3 minute read
As cases recede, health experts urge caution


BY HOLLY KAYS STAFF WRITER
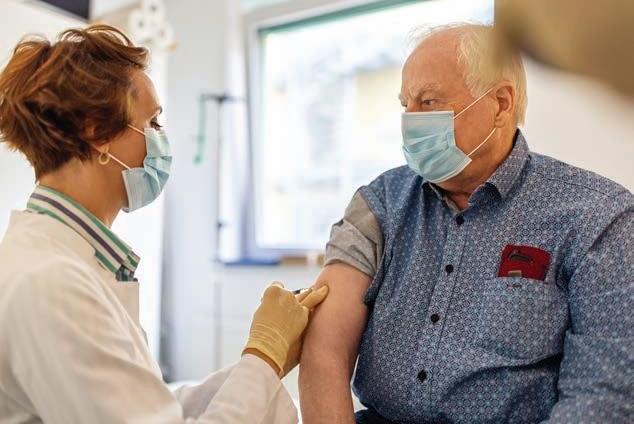
Vaccination numbers have nearly doubled in the four-county area of Haywood, Jackson, Swain and Macon counties over past month and case numbers are way down, but with Easter weekend and spring break trips on the horizon, public health officials are urging the public to continue taking measures to prevent the spread of COVID-19.
“Spring is an exciting time of year, and I know that everyone is anxious to get outside and vacation as the weather warms up,” said Haywood County Health Director Sarah Henderson. “I ask that if you are considering traveling during this time, please be diligent about wearing a mask in public settings, maintaining social distance when possible, and washing your hands often.”
While case counts in Haywood have remained about level over the past week, they have increased in some parts of the state.
That being said, overall the figures are encouraging. On March 17, the number of people hospitalized with COVID-19 in North Carolina fell below 1,000 for the first time since Oct. 5 and has remained below that threshold since. Statewide, 1,062 positive cases were reported on March 23, and as of that date in the past seven days Haywood County and Macon County had each reported 29 new cases, Jackson had reported 45 and Swain 10.
Statewide as of March 23, 22.2 percent of the entire population and 28.5 percent of the population 18 and older had received at least one vaccination shot.
On average, the four-county region
appears to be doing better than the state as a whole in terms of percentage of population vaccinated. As of March 22, county rates ranged from 20.8 percent of the population partially vaccinated in Swain up to 26.8 percent in Macon.
But these rates don’t take into account vaccination efforts on the Qualla Boundary, which operate under a federal allocation. When adding in vaccinations administered by the EBCI, vaccination coverage over the entire four-county area jumps to 26.23 percent for partial vaccinations and 17.16 percent for full vaccinations. While some people vaccinated by the Eastern Band of Cherokee Indians do not live in the fourcounty area — a significant number of tribal members live in Cherokee and Graham counties, and tribal employees may commute significant distances to work — most of them do.
These figures also don’t account for vac-
cines administered through the federal longterm care vaccination program executed in partnership with Walgreens. Long-term care residents had the opportunity to be vaccinated back in December and January, with county health departments now taking over the job of vaccinating new residents as they arrive. While data is not available as to what proportion of long-term care residents chose to get vaccinated, long-term care residents make up a small percentage of overall population, about 1.1 percent in Haywood County and 0.8 percent in Macon.
Local health departments continue to vaccinate mainly with Moderna. This week, Jackson County will receive 600 first doses, 200 of which will be for a special event targeting the county’s Latino population, and Harris Regional together with Swain Community Hospital will receive 100. Macon County will also receive 600 doses, and Haywood County and Haywood
Regional Medical Center will receive a combined 700 — all Moderna. The clinic at Western Carolina University is one of the few locations in the mountains able to store the Pfizer vaccine, and so far that vaccine has made up the majority of its doses.
Area vaccine distributors have consistently said in response to questions on the matter that they have not recorded any severe adverse reactions to COVID-19 vaccines and that they have been able to avoid wasting or spoiling allocated doses.
Vaccination by the numbers
Feb. 22 March 22 County First/second Percent Partial/ Percent dose population full vaccination population
Haywood 8,971/4,944 14.4/9.93 13,238/9,945 21.2/16.0 Jackson 4,736/2,264 10.78/5.15 10,215/4,881 23.2/11.1 Swain 1,807/614 12.66/4.3 2,973/1,778 20.8/12.5 Macon 4,247/2,035 11.84/5.68 9,623/6,711 26.8/18.7 EBCI 3,094/1,184 24/9 4,699/3,341 30.95/22.63 Combined 22,855/11,041 14.71/7.11 40,748/26,656 26.23/17.16 Statewide 1,226,758/676,572 11.70/6.45 2,295,702/1,459,146 21.9/13.9
* Tribal dose numbers from EBCI. All other dose numbers from NCDHHS. County data do not include doses administered through the federal long-term care facilities program or by tribal governments and may be subject to a 72-hour reporting lag. Population figures based on 2019 U.S. Census Bureau estimates, excepting tribal figures, which are from the EBCI. Combined figures based on population of four-county area.


