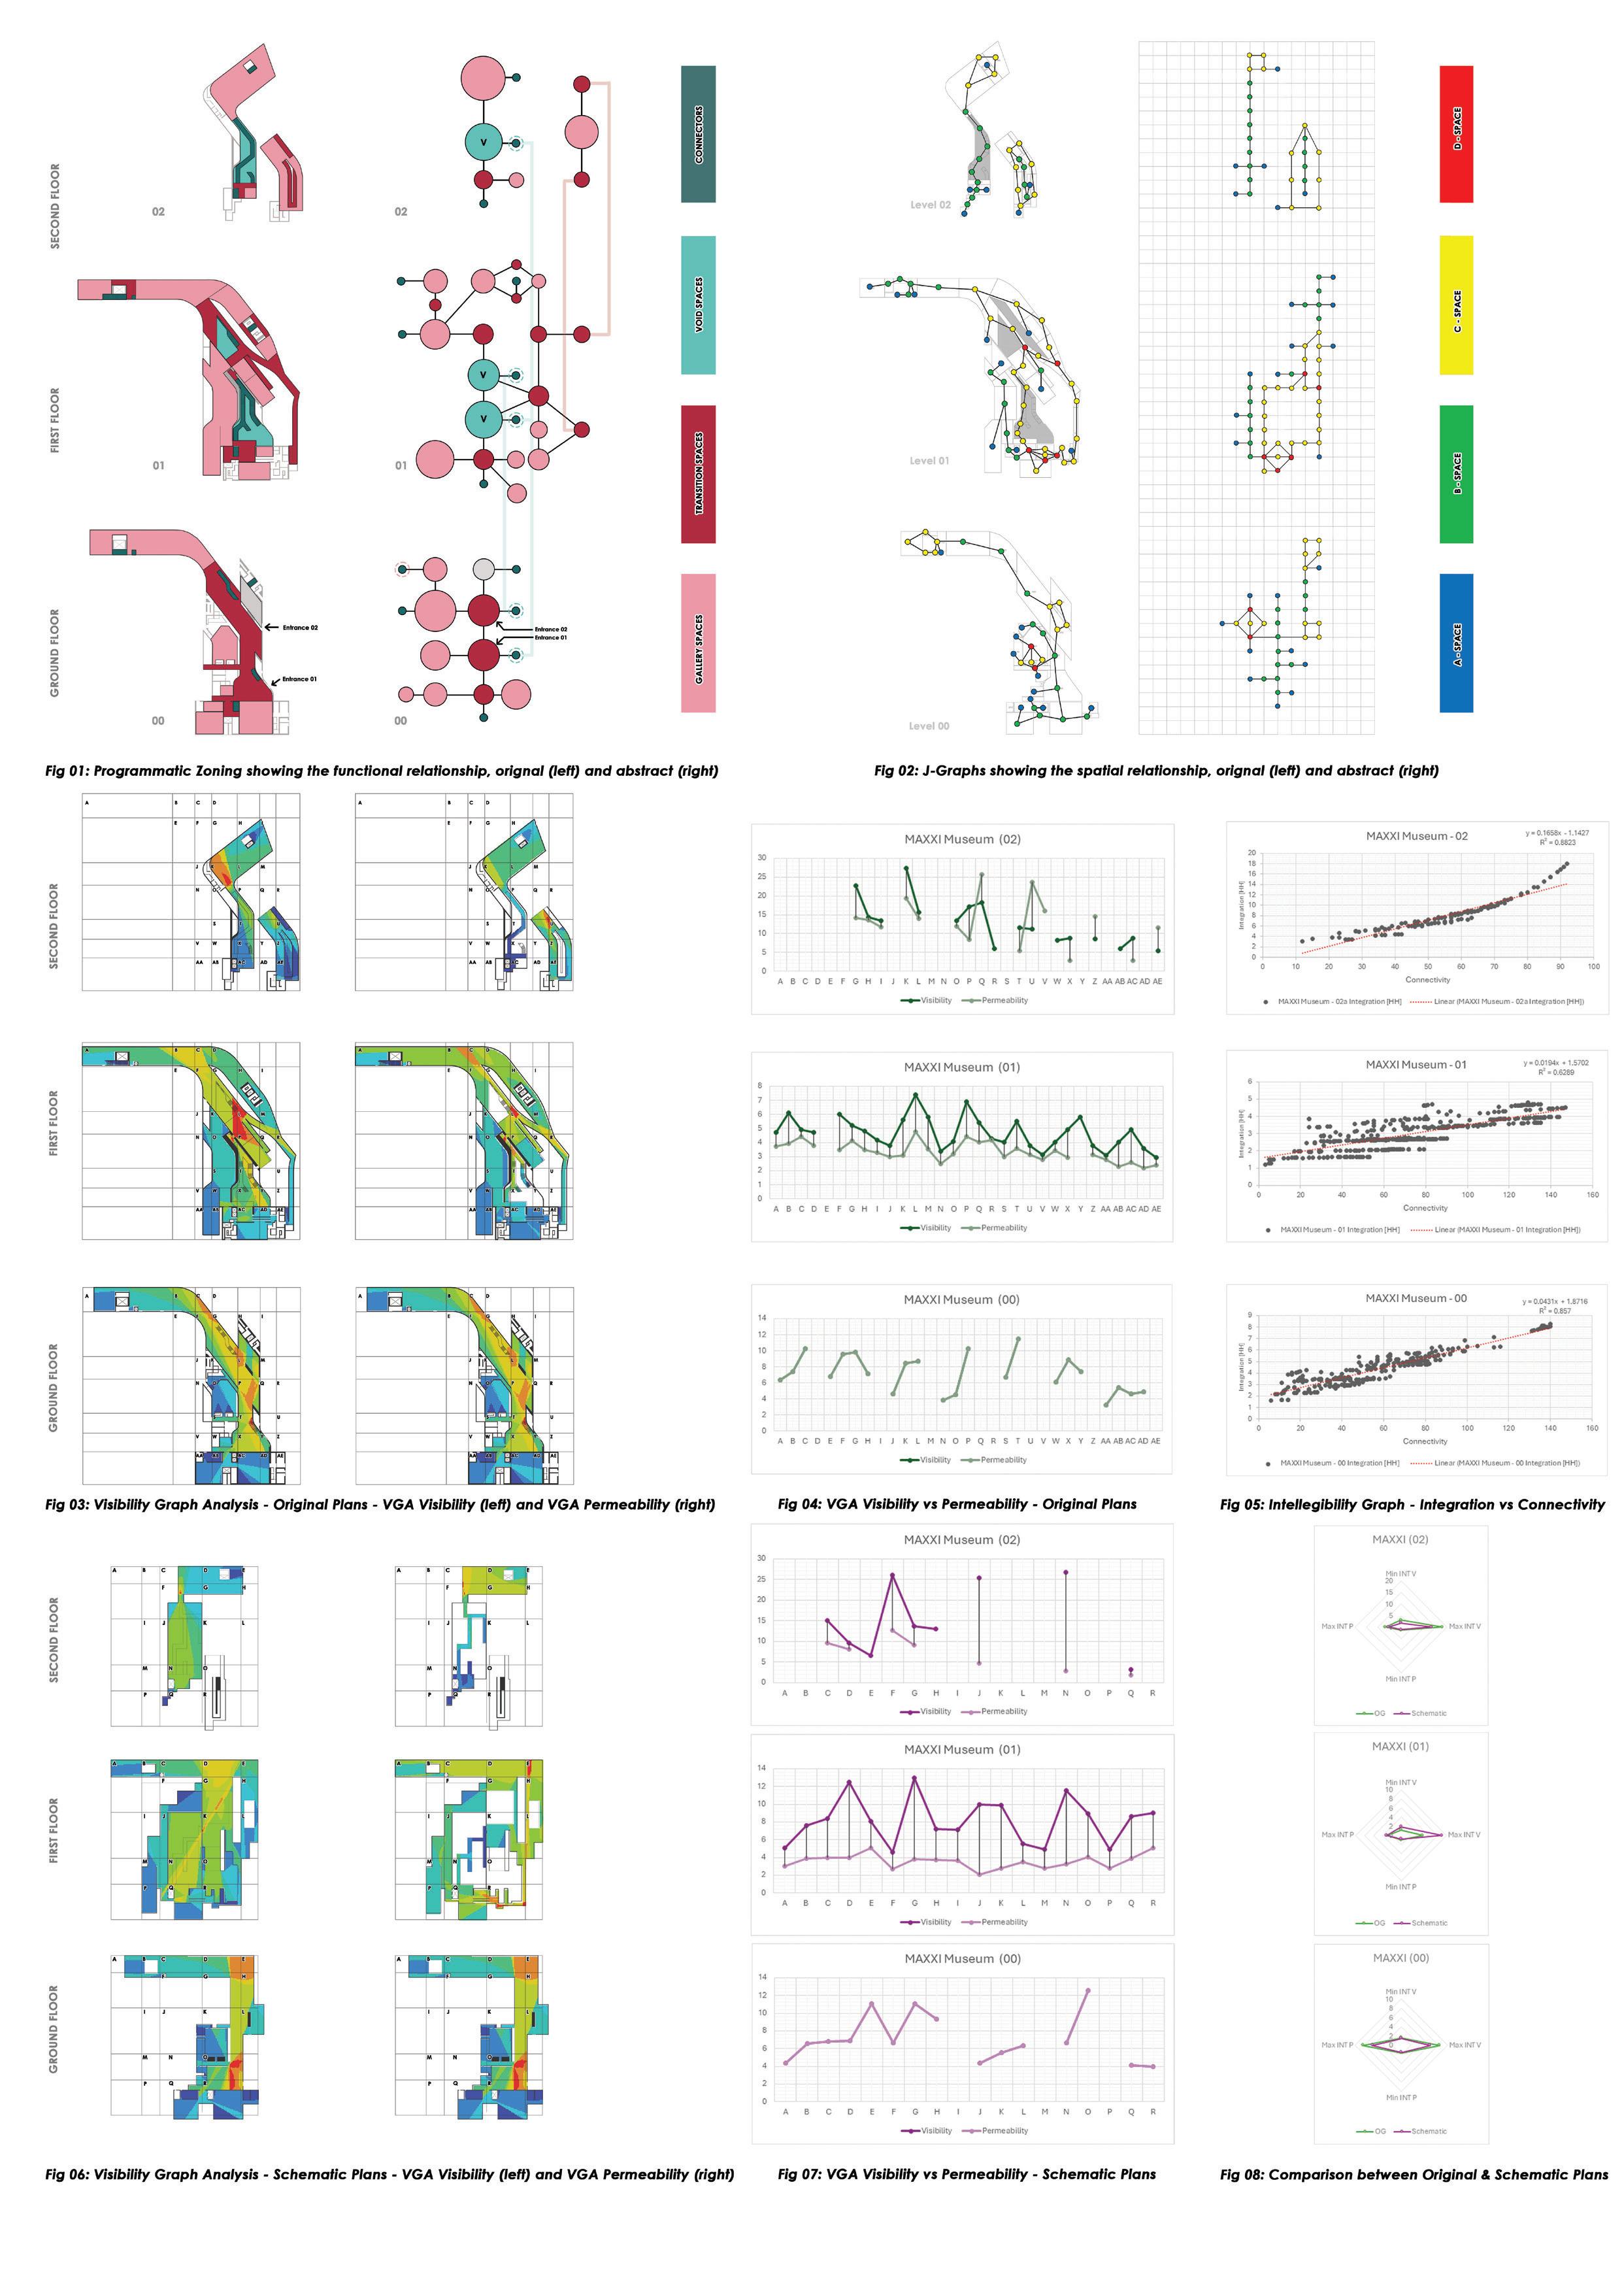


Understanding Deconstructivist Museums: This thesis explores the impact of visitor experiences. By analyzing existing museums and deriving key attributes spatial dynamics and architectural intent.

of voids in deconstructivist museums, focusing on how atriums shape spatial configurations and attributes from voids, the study generates new atrium design iterations, offering insights into their Revit - QGIS - DepthMapX - Autocad - Python - Excel


Building upon the findings of the analytical study, this chapter delves into the derivative study, which focuses on the attributes of voids identified in the previous analysis. Rather than concentrating on individual case studies, the derivative study employs an iterative approach to investigate how different combinations of spatial attributes—such as the number, shape, location, and openness of voids—affect spatial configurations. Using these derived attributes, the study explores hypothetical scenarios and iterations that abstract the role of voids in deconstructivist architecture. This allows for a more generalized understanding of the impact of voids on movement, space utilization, and architectural expression across various configurations, ultimately expanding the scope beyond the specific case studies.

The analysis of five deconstructivist museums (Phaeno Science Museum, MAXXI Museum, Guggenheim Museum, Jewish Museum, and Denver Art Museum) using space syntax revealed that:
• Visibility and Permeability: Voids improved visibility and permeability, especially on ground floors. For instance, Phaeno Science Museum’s Level 00 had a high intelligibility score (0.887), ensuring smooth flow, while upper levels were more complex and exploratory.
• Intelligibility and Engagement: Higher intelligibility scores supported easier navigation, with voids acting as central hubs in the Guggenheim and Jewish Museums to guide movement.
The derivative study of 324 design iterations showed that:
• Openness and Connectivity: Greater openness (50% or 75%) improved visual and movement connectivity, especially with circle-shaped voids.
• Shape and Accessibility: Circle and square voids promoted better connectivity, while parallelogram shapes led to fragmentation and more complex navigation.


A descriptive analysis revealed that increased openness positively influences both Visual Connectivity and Axial Connectivity, meaning that as openness increases, spaces become more visually and physically accessible. However, the variability in these metrics, particularly for Visual Connectivity and Axial Integration, suggests diverse spatial conditions across the openness spectrum. Box plots illustrate the distribution of four metrics—Visual Connectivity, Visual Integration, Axial Connectivity, and Axial Integration—across openness levels. Visual Connectivity shows a clear upward trend, with the median value increasing alongside openness, while Visual Integration maintains a relatively consistent median, though with greater variability at higher openness. Similarly, Axial Connectivity and Axial Integration both exhibit more variability and higher central tendency values as openness increases.
A correlation analysis further supports these findings, showing moderate positive correlations between openness and Visual Connectivity (r = 0.28), Axial Connectivity (r = 0.22), and Axial Integration (r = 0.25), suggesting that as openness increases, both visual and movement accessibility improve.

The analysis revealed that both plan shapes and atrium shapes significantly influence accessibility metrics. Circle-shaped atriums performed particularly well, showing higher mean values for both Visual Connectivity and Axial Connectivity compared to other shapes, indicating that they promote better visibility and ease of movement. In contrast, parallelogram-shaped atriums demonstrated more variation in Visual Integration and Axial Integration, suggesting inconsistent movement patterns and variability in visual integration.Box plots further illustrated that Circle and Square atriums exhibited higher median values for Visual and Axial Connectivity, reinforcing that these shapes enhance visibility and facilitate movement. On the other hand, parallelogram-shaped atriums displayed greater variability in Axial Integration, suggesting that movement within these spaces may be less predictable or require more exploration.
Visual Connectivity was notably stronger in circle-based shapes, which tended to offer more consistent visual connections with minimal variation, while parallelograms showed wider distributions in Visual Integration, reflecting a broader range of visual integration outcomes.
The Kruskal-Wallis test confirmed that these differences are statistically significant. For Visual Connectivity (H=11.10, p=0.0039) and Visual Integration (H=12.20, p=0.0022), the test showed significant differences across shapes, with Circle atriums outperforming others.
This study explores how complex geometries, such as parallelogram plans or multiple atriums, influence spatial fragmentation and movement flow. Heatmaps illustrating Mean Depth values for various base shapes and the number of atriums highlight that areas with higher mean depth represent increased spatial complexity or fragmentation. These fragmented areas typically pose challenges for visual accessibility while affecting movement differently. The correlation analysis between Mean Depth and connectivity metrics reveals important trends. A positive correlation between Mean Depth and Axial Connectivity indicates that as spatial depth increases, movement flow improves, suggesting that more fragmented, complex spaces often support better axial (movement) connectivity. However, there is a negative correlation between Mean Depth and Visual Connectivity, meaning that deeper, more complex spaces tend to obscure visibility, making them harder to visually navigate.
Understanding Bunhill: This project conducts a spatial analysis of the Bunhill design methods, the study identifies analytical solutions to urban challenges,

Bunhill ward in London, addressing macro, meso, and micro-scale issues. By applying evidence-based challenges, offering insights into the area’s spatial dynamics and development strategies.
QGIS - DepthMapX - Autocad


The ‘Clueless’ Meter: This study uses Grasshopper to analyse the approach directness of visual navigation. The research explores how effectively these

approach to landmark buildings from key transport points, such as tube exits and bus stops, to assess the these landmarks are visually accessible, enhancing wayfinding and urban legibility.
Rhino - Grasshopper - Python - Autocad


“ I am Still Learning” - Michelangelo
