
11 minute read
the global sustainable competitiveness index 2019


Advertisement


1.1 Key Take-aways: Competitiveness Index 201 9:
Scandinavia, Northern Europe on Top –Least developed Africa behind: • The top 5 spots are occupied by Scandinavia: Sweden is leading the Sustainable Competitiveness Index –followed by the other 4 the Scandinavian nations. • The top 20 are dominated by Northern European countries, including the Baltic states • Of the top twenty nations only two are not European –New Zealand on 1 2, and Canada on 19. • Germany ranks 1 5, the UK 17, and the World’s largest economy, the US, is ranked 34. The US ranks particularly low in resource efficiency, but also social capital –potentially undermining the global status of the US in the future • Of the large emerging economies (BRICs), China is ranked 37, Brazil 49, Russia 51 , and India 1 30. • Some of the least developed nations have a considerable higher GSCI ranking than their GDP would suggest (e.g. Laos, Timor, Burma, Bhutan, Suriname…) • Asian nations (South Korea, Japan, Singapore, and China) lead the Intellectual Capital ranking. However, achieving sustained prosperity in these countries might be compromised by Natural Capital constraints and current high resource intensity/low resource efficiency • The Social Cohesion ranking is headed by Northern European (Scandinavian) countries, indicating that Social Cohesion is the result of economic growth combined with a country-wide social consensus
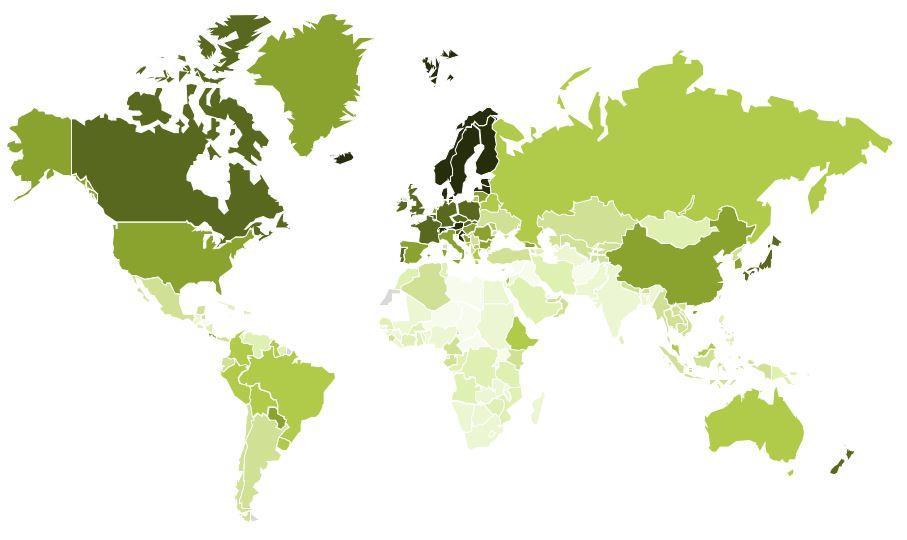
The Sustainable Competitiveness World Map 2019
The Sustainable Competitiveness World Map. Dark areas indicate high competitiveness, light areas low competitiveness
1.2 Sustainable vs. Conventional Competitiveness
The success of nations currently is mostly expressed in their economic output –GDP, and GDP per capita, GDP growth. The GDP or GNI, however, are limited to the current economic output, and do not evaluate underlying structures.
The best-know competitiveness ranking is the WEF’s Competitiveness Index. However, the WEF index is flawed, both methodically and in terms of indicators considered. It is therefore not really surprising that the Index results rise eyebrows. We are all aware that the US is a big economy –but the 2 nd most competitive economy? Please. Yes, the US has MS, Google and precision military hardware, people don’t buy American cars because they are not competitive –and that’s all. Here are some of the most striking differences between the WEF-Index and the Global Sustainable Competitiveness Index:
We consider the GSCI to be a more balanced index and measurement of competitiveness that delivers a deeper and more accurate picture of the true competitiveness of a nation-economy. (For a detailed analysis of the similarities and differences between the GSCI and the WEF index, please refer to the research paper “Sustainable Vs WEF Competitiveness”).
Rating comparisons and implications
In order to test the implications of the conventional applied sovereign bond ratings, a virtual sustainability-adjusted credit rating was calculated. The sustainability-adjusted rating is equally based on GSCI ratings and conventional ratings (average of Moody’s, S&P, and Fitch).

Based on sustainable competitiveness, countries dependent on exploitation of natural resources would receive a significant lower credit rating. On the other hand, some developing nations would receive higher ratings (and therefor lower interest rates) based on their development potential.
In the asset management world, it is now standard procedure to integrate “E, S and G” into financial investment risk/opportunity evaluation, while credit ratings do exclude ESG risks - and therefore do not cover all investor risks. Key observations:
Sovereign bond ratings show a high correlation to GDP/capita levels: Poor countries have to pay higher interest rates than rich countries. Sovereign bond ratings do not reflect the non-tangible risks and opportunities associated with nation economies Sustainable adjusted ratings and conventional ratings show significant differences. Under a sustainability-adjusted credit rating, countries with high reliance on exploitation of natural resources would be rated lower, while poor country with a healthy fundament (biodiversity, education, governance) would receive higher ratings.
It is high time that credit ratings include sustainability in their risk calculations.


capital
2 Natural Capital
Natural capital is the basis on which a country is built: the physical environment and climatic conditions, combined with the extent of human activities that have or will affect the natural environment. The Natural Capital of a country reflects its ability to sustain the population and the economy, now and into the future.
A nation’s natural capital is a given value –it is as it is –i.e. there are limitations to human ability to improve or change the availability of natural capital. While it takes little exploit natural capital, rebuilding or improving natural capital factors is difficult, and requires significant time and resources.
Natural Capital Ratings 2019 –Key Take-aways
High-ranking countries are characterised by abundant water availability, the source of a rich biodiversity. Many of the highest scoring countries are located in tropical areas. While some of these countries currently may lack social, intellectual and governance capital, their Natural Capital would allow them to develop sustainable competitiveness over time. A certain correlation with the level of human activities and population density can also be observed: large countries with a comparably small population density and rich biodiversity tend to score higher.

The Natural Capital Index is topped by Guyana, followed by Laos, Congo, Cameron and Sweden. OECD representation in the top 20 is limited to Sweden, Canada, New Zealand and Finland. The two most populated countries, China (153) and India (163) are both affected by a combination of arid climate, high population density and depletion levels, raising concerns over those countries’ ability to self-sustain their large populations in the long term.
Table of Contents governance


3 Governance Efficiency
The Governance Sub-Index of the Sustainable Competitiveness Index is based on quantitative data series –i.e. not based on qualitative evaluation of government systems. In addition, some aspects of government direction implications (such as human rights, freedom of press, etc.) are assigned to the Social Capital Index. The Governance Sub-Index aims at evaluating the performance of a country’s regulatory framework and infrastructure environment to facilitate sustainable competitiveness. The regulatory and infrastructure framework should enable an environment in which the country’s natural, social and intellectual capital can flourish to generate new and sustain existing wealth.
The Governance Efficiency rankings 2018:
The Governance Ranking is topped by Ireland, followed by the Czech Republic, Slovenia, Poland, and Germany. The ranking is dominated by Central and Eastern European nations The UK is ranked 32. Japan 64 and the US at 71 . Of the BRICs, China is ranked 24, Russia 56, India 75, and Brazil 121 The map shows a clear north-South gap: all African countries score comparable low

The Governance World Map
The Governance World Map. Dark areas indicate high, light areas low levels of Governance quality


capital

Intellectual Capital is the basis for innovation capability and sustainable economic competitiveness. The indicators used for assessing these criteria are composed of data points relating to education, innovation capabilities, and entrepreneurship. Countries with a high score in this ranking are more likely than others to develop (or sustain) successful economies through research and knowledge driven industries, i.e. high-value added industries, and therefore achieve higher growth rates. All indicators used to assess the innovation capability and sustainable competitiveness have been scored against size of the population or against GDP in order to gain a full picture of the competitiveness, independent of the size of a country. In addition, developments (trends) of performance indicators have also been taken into account. Key observations of the Intellectual Capital ranking include:
The innovation and competitiveness ranking is topped by South Korea –by a considerable margin. North-Eastern Asian nations (S. Korea, China, Japan, Singapore) and the Scandinavian Nations (Sweden, Norway, Denmark) dominate the intellectual capital sub-index of the GSCI. Eastern European countries and the Baltic States also rank high. The UK is ranked 7, Germany 11 , the US 1 5. Vietnam (42), Tunisia (43), Bolivia (46) and Cuba (49) are the highest ranked countries of the Southern hemisphere. China is ranked 9, Russia 32, Brazil 56, and India 1 05.
The Intellectual Capital World Map. Dark areas indicate high, light areas low availability of Intellectual Capital


resource intensity

Resource Management World Map
The Resource Management Sub-Index is composed of indicators scored relative to population (e.g. GHG per capita) as well as relative to economic output (e.g. energy consumption per GDP). Indicators measured against population (per capita) clearly favour countries with low resource and raw material consumption (i.e. less developed countries), while indicators scored relative to GDP measure economic efficiency.
The resource intensity map shows that the resource intensity of less developed countries seems to be –generally speaking - lower than that of higher developed economies. However, indicators are measured both against economic output (GNI/GDP) and against per-capita performance. While the per-capita intensity is naturally lower in less developed economies, the per-output performance in efficient developed countries is lower than in the developing countries.
The resource intensity ranking is topped by Kenya, followed by Togo and Ethiopia –mainly due to low resource consumption. However, also highly developed economies achieve high rankings –Sweden (5), Luxembourg (6) and the UK (8) are all ranked within the top ten. However, the World’s economic powerhouses are ranked significantly lower –Germany on 77, Japan on 96, the US on 102, and China on 160. The low rankings indicate a distinctive potential for improving sustainable competitiveness through reducing resource intensity and resource management –i.e. reducing costs, at the end of the day.
The main implications of higher or lower resource management capabilities are related to stability and sustained economic growth: should global prices for raw materials and energy rise significantly in the future (as trends and the majority of available research suggests), the countries in the lower ranks will face substantial higher costs and challenges to maintain their growth compared to countries with higher efficiency and intensity scores.


cohesion

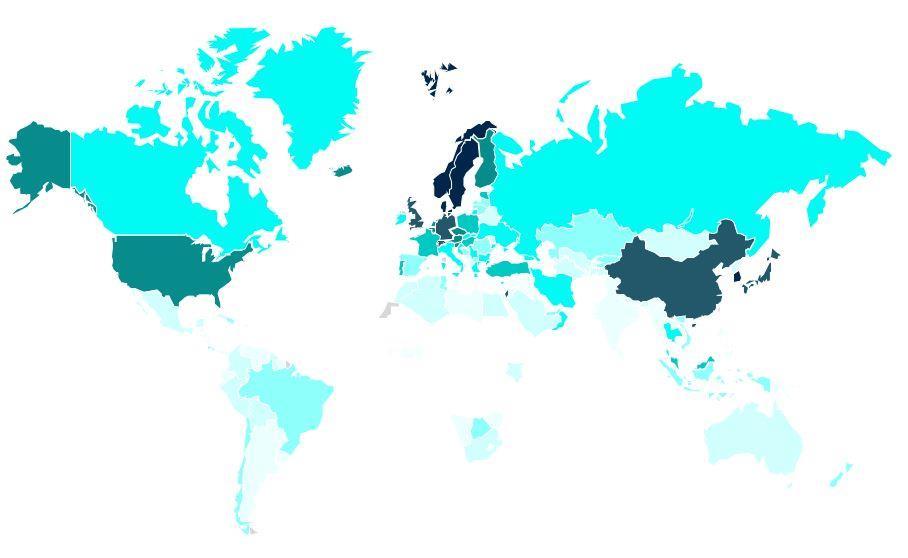
Social Capital World Map
A certain level of social balance or social consensus is required to maintain a stable environment in which economic activities can take place. The higher the social capital of a country, the better the economy can flourish. The higher the social consensus, the higher the motivation of individuals to contribute to the wider good, i.e. the sustainable development of the nation –and the less likely they are to fall off the track into illegal paths of wealth generation that eventually hurt the legal economy. The indicators used to calculate the Social Capital score of countries is composed of health and health care factors (availability and affordability), the quantitative equality within societies (income, assets, and gender equality), freedom indicators (political freedom, freedom from fear, individual happiness), crime levels, and demographic indicators.
• The top 20 in the Social Capital sub-index is dominated by European countries from the North (particularly Scandinavia) –only Japan (12), Singapore (1 3) and Kyrgyzstan (19) break into the ranks • The USA, due to comparable high crime rates, low availability of health services, and rising inequality, is ranked 1 42, just below Guinea-Bissau and above South Sudan. • The UK is ranked 40, reflecting the deteriorating social fabric. • China is ranked 34, India 90, Russia 127, and Brazil 1 48 • The highest ranked South American country are Argentina (55) and Ecuador (69); the highest-ranking African country Burkina Faso (73). Most African nations, particular within and south of the Sahel zone, are at the bottom of this list, due to a combination of low availability of health care services and child mortality, limited freedom of expression, and unstable human rights situation

In a sustainable efficient entity, powers are balanced. Imbalance in power between individuals, groups, and entities always lead to lower efficiency over time. Low efficiency means higher overall cost, less benefits. What might appear competitive now (e.g. the exploitation of natural non-renewable resources), but is not into the future, is not competitive. Competitiveness that is not sustainable is not competitive.
In a sustainable entity, the economy does not run against nature and/or communities/society. All dimensions of an entity are all running in parallel in winwin interactions. The fundamentals hat make an economy, a society, and the natural environment in which both of the above operate/live in, are balanced interacting:
The Sustainable Competitiveness Framework:

Sustainable competitiveness only requires two fundamentals as its base:
Equal opportunities, everywhere Decision-making based on science and sustainable cost-benefit analysis that lead to low-cost, high-benefit solutions (LCHBs)
