
Disclaimer:
Even though every attempt has been taken to ensure the high calibre and correctness of SolarQuarter and all our research, we give no promise regarding its content. In addition to not being responsible for the availability of external websites or their contents, SolarQuarter is also not liable for any content created by third parties or for any error, omission, or inaccuracy in any advertising material. The data and information presented in this report are given solely for informational purposes; SolarQuarter, its affiliates, information providers, and content providers disclaim all responsibility for any investment choices made in reliance on this information or for the outcomes of those decisions.
International copyright and trademark laws protect the information in this publication. Any portion of the report may not be altered, copied, reproduced, republished, posted, transmitted, or distributed in any way If you maintain all copyright and other property notices, you may only use the content for personal, non-commercial purposes. You must obtain written consent from FirstView Group to utilize the content for any non-personal or non-commercial purpose.
Introduction to the Indian Solar Industry

India's Solar PV installed capacity as of October 2022 has crossed 60 GW The government had set a JNNSM target by 2022 to install 100 GW of Solar PV capacities which includes 60 GW of utility-scale (Large/ground mount) and 40 GW of Solar rooftop capacity. The growth of large-scale projects had picked up after the announcement of the Solar Park as well as reverse auctions after 2016 before the government used to go for Viability Gap Funding (VGF) along with fixed tariffs where the bidders used to compete over VGF. After the announcement of a reverse auction, the pace of utility-scale solar projects has increased, followed by many other factors such as Solar parks, Solar RPO as well as state-level tenders The growth of Solar has outpaced all the other renewable sources of energy and covers a market of around 51.74% of the total Renewable installed capacities of above 119 GW by October 2022, but India missed the target of 100 GW by December 2022. In renewables, India has become one of the global leaders. In 2021, it ranked third in the world by installed renewable capacity and is the only country in the G20 that is on track to achieve its targets under the Paris Agreement During the first 5 years after the signing of the agreement, India has witnessed the fastest rate of growth in renewable energy capacity addition among all large economies, with renewable energy capacity (including large hydro) growing around two times.
Cumulatively Solar PV installations (Utility & Rooftop)
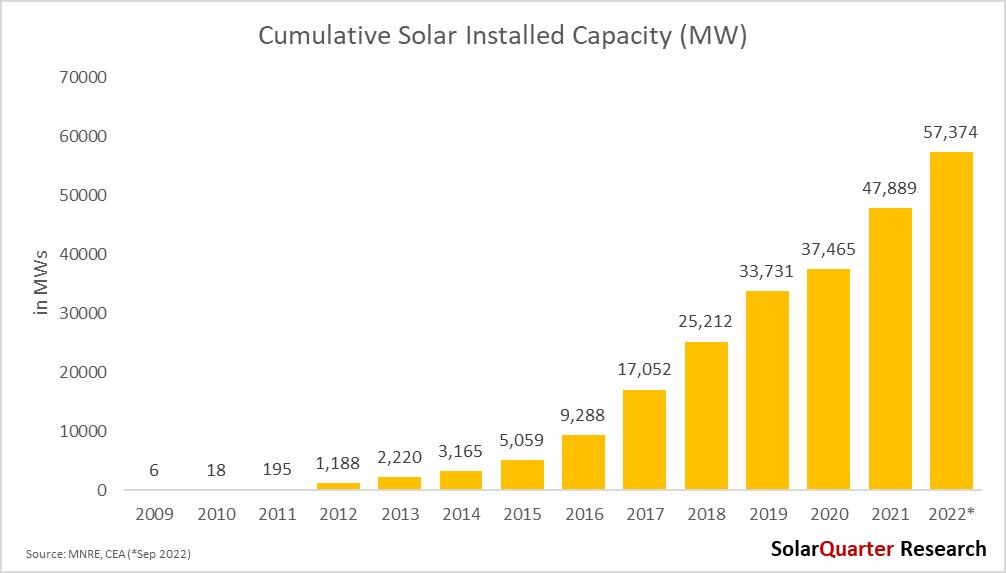
Solar capacity additions grew by around 20% in September 2022 over the previous year with around 47.89 GW installed Solar PV capacity as of September 2021, an exponential increase compared to around 9 5 GW installed in the first three quarters of the calendar year 2022 Installations were up by above 27% compared to 7 45 GW installed in the first nine months of 2021
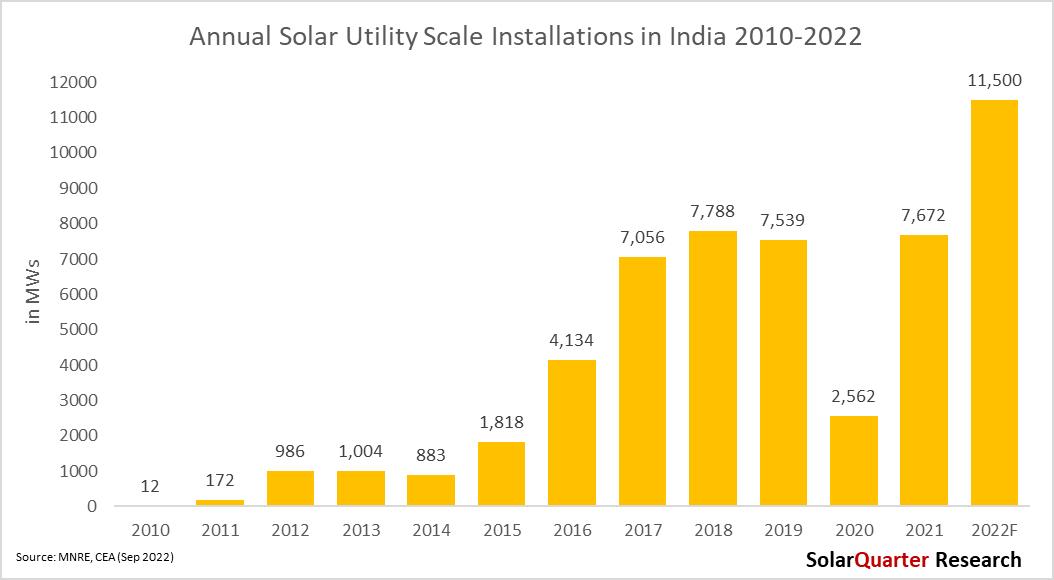
In the first nine months of 2022, large-scale installations totaled around 9.6 GW compared to around 5.38 GW installed in the first three quarters of 2021 altogether. Y-o-Y, large-scale installations increased by over 78.19 percent The large-scale Solar PV project installation figures were the highest since the Solar installation was started in the year 2009-10 As the market opened after the second half of 2021 after COVID-19 restrictions, so many projects which were not able to get commissioned during the lock-down period due to COVID-19 restrictions were commissioned mostly in 2022, also there is a duty-free window in Q1 2022, which allowed the developers to commission their projects during this period, as large-scale developers used to procure their panels few weeks before the commissioning due date Even though the installations are estimated to be high in Q4 2022, due to BCD, many uncertainties arise in the market, such as whether to procure the panels duty-free or have to pay duty MNRE recently clarified that tenders before 09th March 2021, and whose commissioning date is coming after BCD can take the benefit of change in law and procure the panel duty-free. The Solar PV/Solar PV-Wind Hybrid power projects, wherein the last date of bid submission was on or before the announcement on 09th March 2021, regarding the imposition of BCD on import of Solar PV cells and modules with effect from 01st April 2022 and wherein the scheduled commissioning date, including time extension granted, if any, was on or After 01st April 2022, may consider the imposition of BCD on import of Solar PV cells and modules with effect from 01st April 2022, under “Change-in-Law’ unless the same is disallowed by specific provision in the tender document/contracts.
The market has substantially improved since Q4 of 2020 due to which the Solar PV installations crossed 2 GW in all five quarters since a quarter third of 2021. The market is slowly recovering from a pandemic, and projects are getting commissioned that were stuck in 2020 but one issue of rising in the Solar PV modules continues in the Indian Solar industry, as per PVInfo Link the price of Solar PV modules (FOB) fell marginally to USD 0.24-0.27/W in Europe, USD 0.24-0.25/W in the Asia Pacific region, and USD 0.24-0.25/W in Brazil. Local module prices in India translate to around USD 0.32-0.359/W (FOB)
The share of utility-scale in the total Solar PV installations as of September 2022 was around 87 percent, while in CY 2022 for all three quarters, it has increased to 88 percent. While the share of rooftop Solar as of

September 2022 was around 13 percent of the country's total Solar PV installations, it has gained a 20% share compared to September 2021 installations The share of the rooftop especially in the commercial and industrial space will grow substantially as the net-metering policy which was pending for a few months has been approved by the Ministry of Power where the new amendment allows the net-metering users to go for loads up to 500 kW or up to the sanctioned load, whichever is lower.
Yearly Solar PV Installation (Utility-scale)
The growth rate of Solar PV installations is quite impressive in 2021, as India commissioned capacity in the Calendar year (CY) in 2021 was around 10.4 GW compared to the installations in 2020 were 3.7 GW in the full twelve months Installations in the calendar year 2022 will be around 13 6 GW, while the utility-scale Solar PV installation is estimated to be around 11 5 GW Solar Installation in the first nine months of utility-scale was around 9 6 GW by September 2022 Since COVID-19, the installations in the utility-scale segment have slowed down drastically but they gained momentum since the second half of 2021 and India installed a whooping capacity of 16.7 GW in the past five quarters since Q3 2021.
The projects which were not able to be commissioned in 2020 due to COVID-19 restrictions, those projects are commissioned in the calendar year 2021 and also continue through 2022, but the shortage of modules is still looming in the sector. After safeguard duty ended in July 2021, the utility-scale installations have jumped many folds and installed maximum capacity till March 2022. But after the announcement of BCD on 01st April 2022, uncertainty in the market aroused, and there was utmost confusion about whether the developers have to pay BCD on modules & cells Along with that, the government has raised GST on Solar along with compulsory use of ALMM-l listed panels in the government tenders to pull the already struggling installation due to high module prices.
Quarterly Solar PV Installation (Utility)

In CY Q3 2022, utility-scale projects accounted for 83 percent of the total Solar PV installed, which was down by 8 4 percent from CY Q2 2022 and up by 9 6 percent from CY Q3 2021, where the installations were around 2 28 GW The installations in CY 2022 would have been more but due to an increase in the raw materials, also basic customs duty came into the picture from 01st April 2022, many projects were still on hold which might get commissioned in the coming quarter. Due to BCD implementations in April, India installed around 9.6 GW in the first nine months compared to around 5 4 GW installed in the first nine months of 2021
The growth of utility-scale/large projects is taking a stand in the growth of the success story of India. India pledged to become 100% renewable in the coming decades and Solar is going to play a significant role.
Power Mix
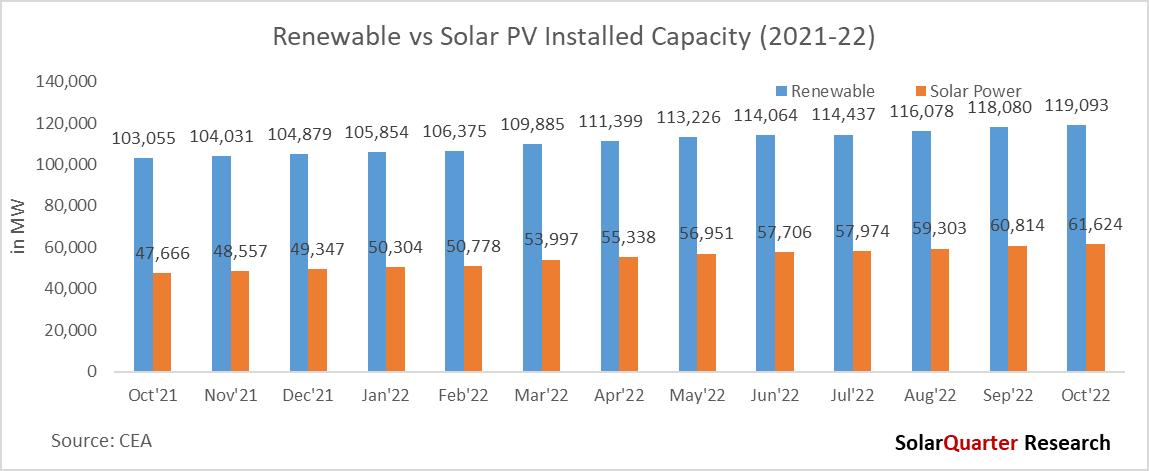
Renewable capacity additions continue to increase at a rapid pace in India, accounting for approximately 29.1 percent of India’s power capacity mix at the end of October 2022 India’s total installed power capacity stood at over 408 GW at the start of the calendar year Q4 2022 from all the sources, with renewables accounting for ~119 GW, compared to cumulative renewable energy installations of 103.05 GW at the end of October 2021, which represented a 15.56 percent growth year-over-year.
Solar power accounted for approximately 61 62 GW of installations, which is 15 1 percent of the total installed power capacity. The share of Solar power in the installation mix grew from 12.2 percent in October 2021 to 15.1 percent in October 2022. Among renewables (excluding Hydro), Solar accounted for approximately 51.74 percent of the installed capacity. Wind accounted for 35.1 GW of the total renewable installed power capacity and nearly 10 2 percent of the overall power capacity mix as of October 2022 As 2022 is the last year for the JNNSM target, the overall installed Solar capacity in the country has increased by 24 88 percent which was 49.34 at the end of December 2021 to 61.62 GW by October 2022.
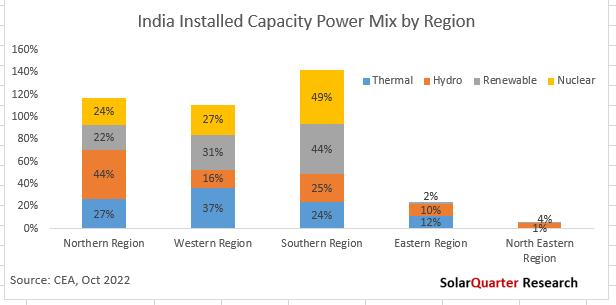
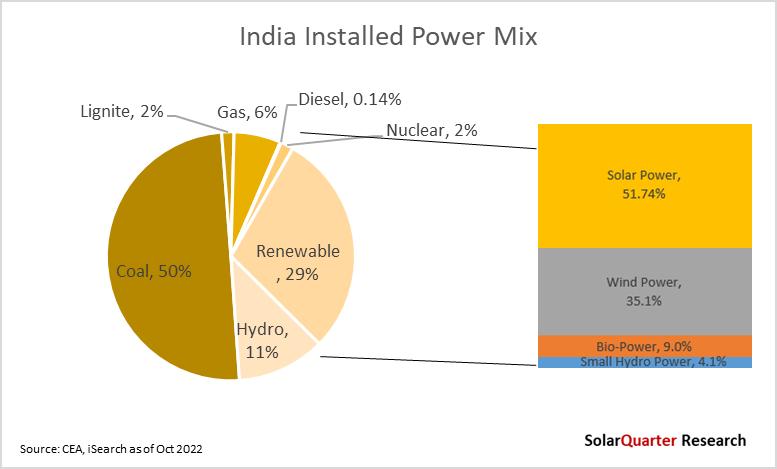
Among renewables, Solar Power has shown the highest growth year-over-year by 29 28 percent from October 2021 to the same month of 2022, while Wind Power has grown by 4.64 percent, and Bio-Power by 1.17 percent. Hydro power’s cumulative installations stood at 46.85 GW, making up 11.5 percent of India’s total installed capacity.

Small hydro had installed over 4.92 GW and represented 1.2 percent of the overall power mix capacity at the end of October 2022 The share of nuclear power remains constant for a few quarters which represents 1 7 percent of the total power mix installed capacity by October 2022, with no capacity added during the full calendar year of 2021 & 2022 Nuclear power is not only clean and environmentally friendly, but it is also a source of base load power available 24x7 like thermal power. As the other segments in the power mix were adding their capacities it resulted in a decrease in the share of nuclear power in the overall power mix. The actual commercial generation has increased from 34,162 million Units in the calendar year 2014 to 43,918 million units in 2021 for nuclear power Total power generation from nuclear power in September 2022 was 3,412.52 million units.
Thermal power (which includes coal, lignite, gas, and diesel) is still the significant source of energy in the country - with its cumulative installations reaching 235 99 GW, representing 57 7 percent of the total installed power capacity. Coal accounted for a dominant share of the mix, with 49.9 percent of the total installed power capacity, followed by natural gas at 6.1 percent, lignite at 1.6 percent, and diesel at 0.14 percent share. However, thermal power’s share in the overall power mix is gradually declining as the government is shutting down old thermal plants, especially coal, and moving towards the non-conventional source of energy But in the recent past, the country suffered outages across the country due to a shortage of coal in the thermal power coal unit. It’s a long way before renewable power generation will be able to dominate the country's electricity demand as mainstream renewable energy is intermittent.
In the recent update from the ministry of power for “Concept note on Pooling of Tariff of 25 years Plus Thermal/Gas Generating Stations” the availability of ample generation capacity, low cost of some recently signed renewable PPAs, and low tariffs in the market, has led States, specifically those that are surplus in power to approach Ministry of Power for relinquishment of their share from Central Generating Stations (CGS) The Ministry of Power, considering the request of the States, allowed the States to exit from PPAs with Central Power Sector Utilities after 25 years vide guidelines dated 22.03.2021. Thereafter, many States/ Distribution companies based on commercial considerations are exiting PPAs of costlier plants (non-pit head coal stations and Gas based thermal generating stations) while retaining the PPAs of cheaper plants

Renewable Energy Generation Mix
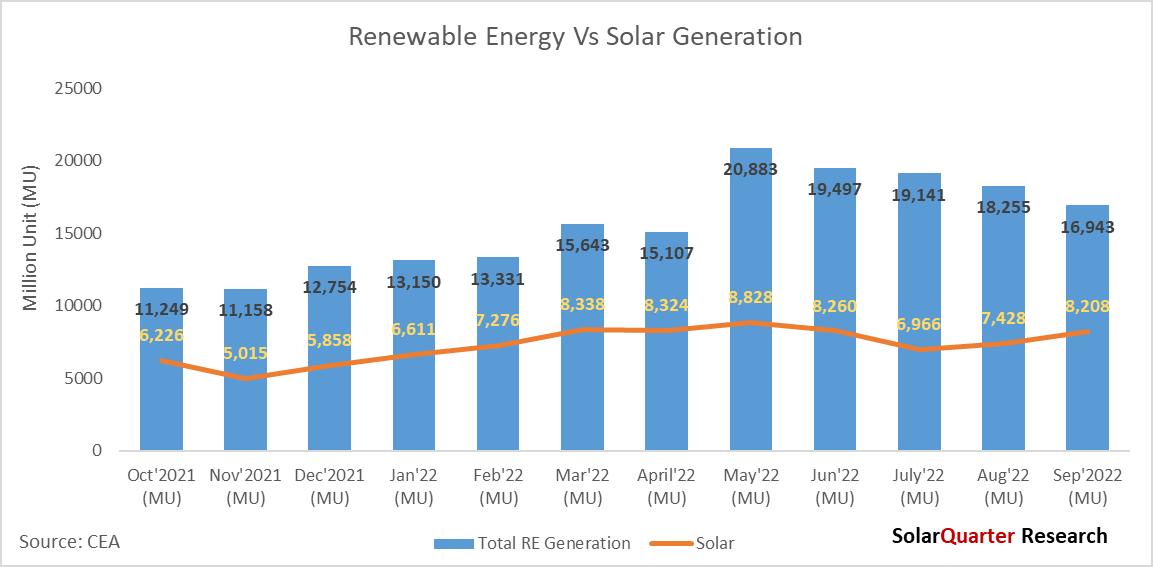
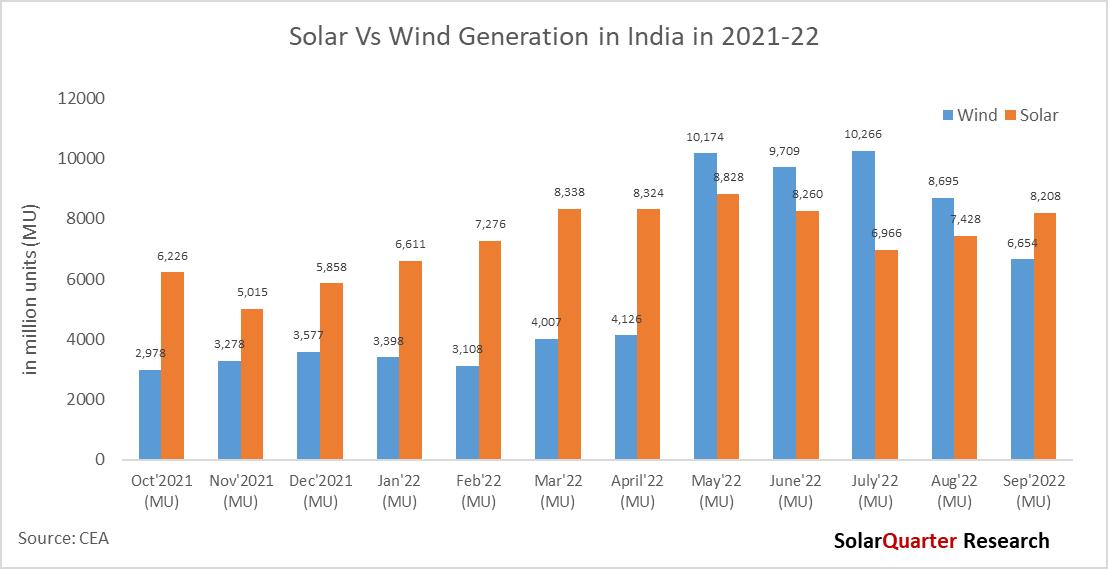
Total renewable energy generations in September 2022 reaches 16,943 29 million units, there is an increase of RE generators by 16 94% over September 2021, where the RE generations were 14,488 86 million units, also there is an increase of over 28.9% in September 2022 over January 2022 where the generation from RE was 13.149.60 million. There is a year-over-year growth of 51.74% in Solar power generation from September 2021 to September 2022, while Wind Power has shown a decline of 4.68% in the same period.
Solar Power generation is having the largest percentage in terms of generation overtook Wind Power with 8,207.73 million units and contributed 48.44 percent of the total renewable generation share in September 2022, Wind Power with 39.28 percent of the market by generating 6,654.49 million units in September 2022. Other sources such as Bagasse, small Hydro, and Biomass contribute 0 97 percent, 9 09 percent, and 1 02 percent respectively Solar and Wind Power together contributed 87 72 percent of the total renewable energy generation in September 2021
The total renewable generation has grown by 32 84 percent from December 2021 to September 2022 While there is an exponential growth of 40 11 percent in Solar power generation from December 2021 till the end of Q3 2022, Wind Power has increased by 86.03 percent in generation in the same period.

In terms of generation for Wind vs Solar, Wind overtakes the actual generation in May, June, July, and August generally due to high wind speed and monsoon season. Even though the installation of Wind in terms of Solar power was lower, the generation overtook in these four months of the year. Generally, generation is high during these seasons for Hydro, wind, as well as small hydro on the other hand generation, used to be low for Solar, and thermal due to the monsoon season The hybrid project developers should make use of this algorithm and can save money by doing the right scheduling and forecasting of power from different sources of electricity
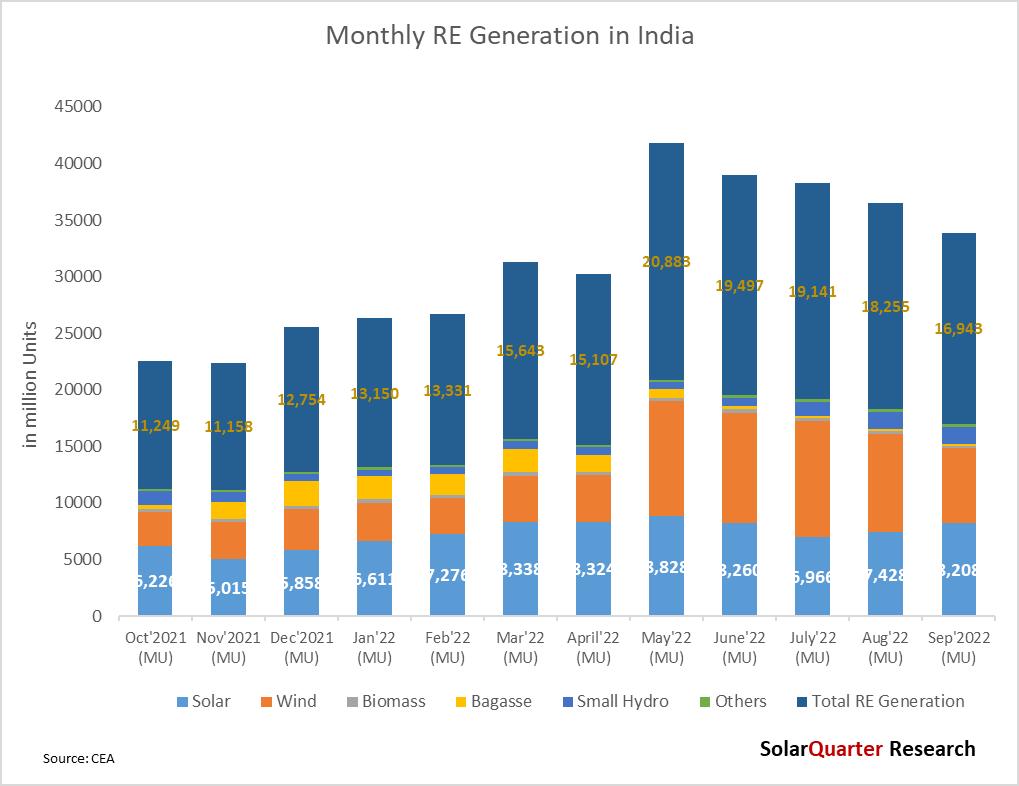
The RE capacity has shown a sudden spike in the generation from May 2022 due to an increase in wind generation as well as capacities addition in Solar PV. The generation from Solar is usually less during the monsoon season, and high during the summer season But the Solar power plant can be installed at any location while the Wind turbine cannot be installed in those locations where the wind speed is less, a minimum required wind speed (generally 12-14 km/h) to begin turning and generate electricity strong winds (50-60 km/h) to generate power at full capacity. winds speed beyond 90 km/h the turbines must be stopped to avoid damage.

SECI Payment to Power Generators
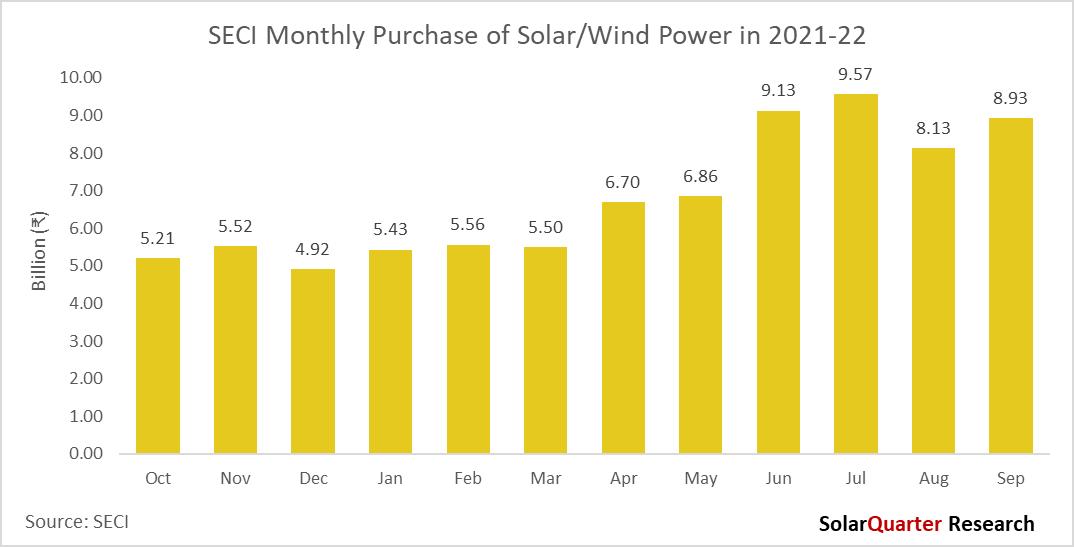
Solar Energy Corporation of India (SECI) paid ₹65 81 billion (~$805 92 million) for Solar and Wind power purchased in the first nine months of 2022, there is a decent growth of SECI payments to Wind and Solar power generators for September 2021 to September 2022 of over 45 percent. The disbursed amount was highest in July followed by June & September. There is a gradual increase in the payment to generators from October 2021 to September 2022.

In the last year from October 2021 to September 2022, SECI has made a payment of around ₹81.47 billion ($997.69 Million). The payment of Solar and wind generators will start increasing in 2022, as lots many projects are coming online in the coming quarters SECI is the major power purchaser for Solar in the country, and monthly payments to power generators are increasing year on year basis
Electricity Market
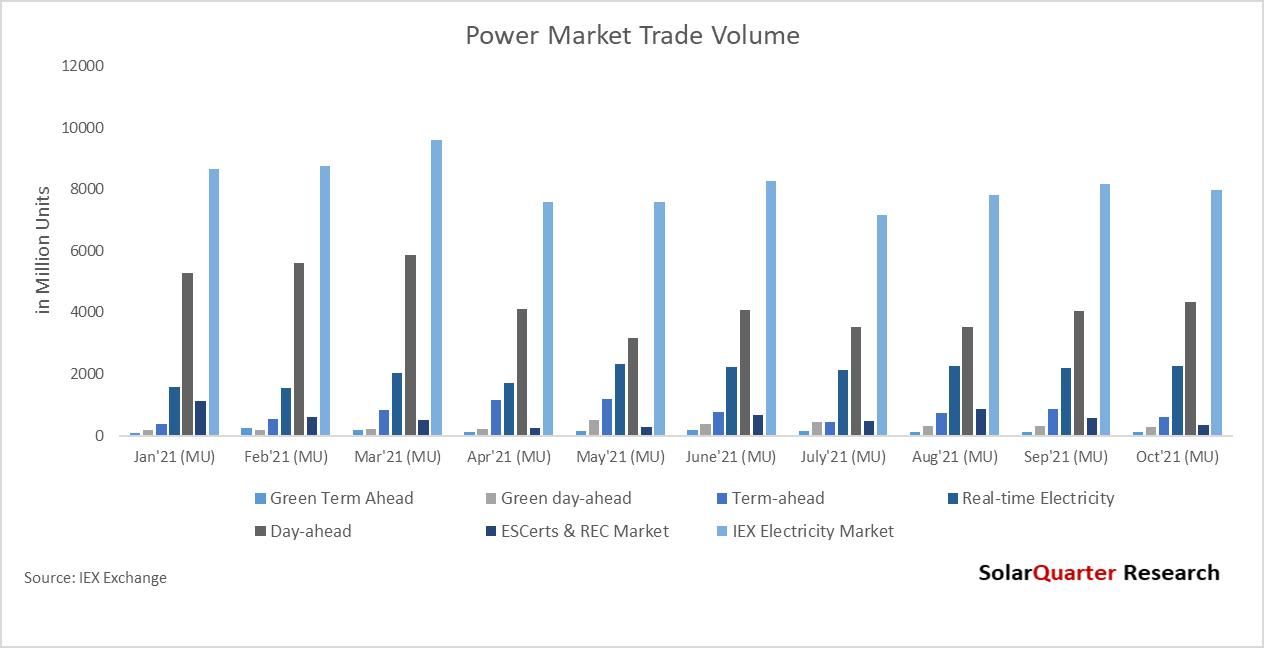
The entities showing aggressiveness in buying Renewable Energy Certificates (REC) to meet their renewable purchase obligation (RPO), there is a growth of 13 02 percent year over year from October 2021 to October 2022 In March 2022, Power Market traded the highest monthly volume of 9,605 MU in the calendar year 2022 The average Day Ahead Market prices increased to ₹5 40 per unit during Q2 FY23, as against ₹4 14 in Q2 FY22
As India moves towards carbon neutrality and harnesses vast amounts of renewable power to meet its growing appetite for energy, IEX will continue to make use of technology and innovation to facilitate the nation’s energy transition.

India recently surpassed the UK to become the fifth-largest economy and is expected to become the third-largest economy by the end of this decade. For FY ’23, the Indian economy is expected to grow by 6.8% as per IMF. During Q2FY23 both the Manufacturing and Services PMI (Purchasing Manager Index) remained strong on account of increased Industrial activity leading to an increase in electricity consumption by 6% YoY to 385 BU
In September 2022, the installed power generation capacity reached 408 GW. The contribution of renewable energy (RE) grew to 165 GW, which is 40% of the total installed power capacity It is evident from the rapidly expanding green energy capacity that the nation is advancing towards a carbon-neutral economy by 2070 and achieving a 50% clean energy share by 2030.
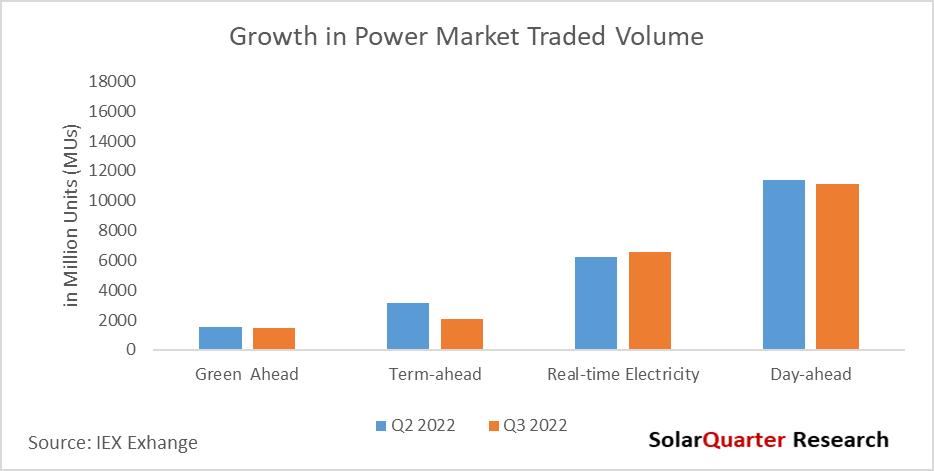
During the quarter (CY Q3), electricity volumes on the Exchange fell by 1 40% YoY with 23 1 BU volumes traded versus 23 43 BU in Q2 CY 2022 The volume comprised 19 72 BU in the conventional power market, and 1 47 BU in the Green Market segment.
In the previous quarter, IEX launched the web-based bidding platform to provide anytime, anywhere easy and secure access to the trading system. IEX also launched its web-based financial reconciliation system to enable the easy and efficient online settlement of exchange-based transactions for customers. On 27th June 2022, IEX successfully launched the much-awaited Longer Duration Contracts up to 90 days on the Exchange which will help to bolster its presence in the short-term market

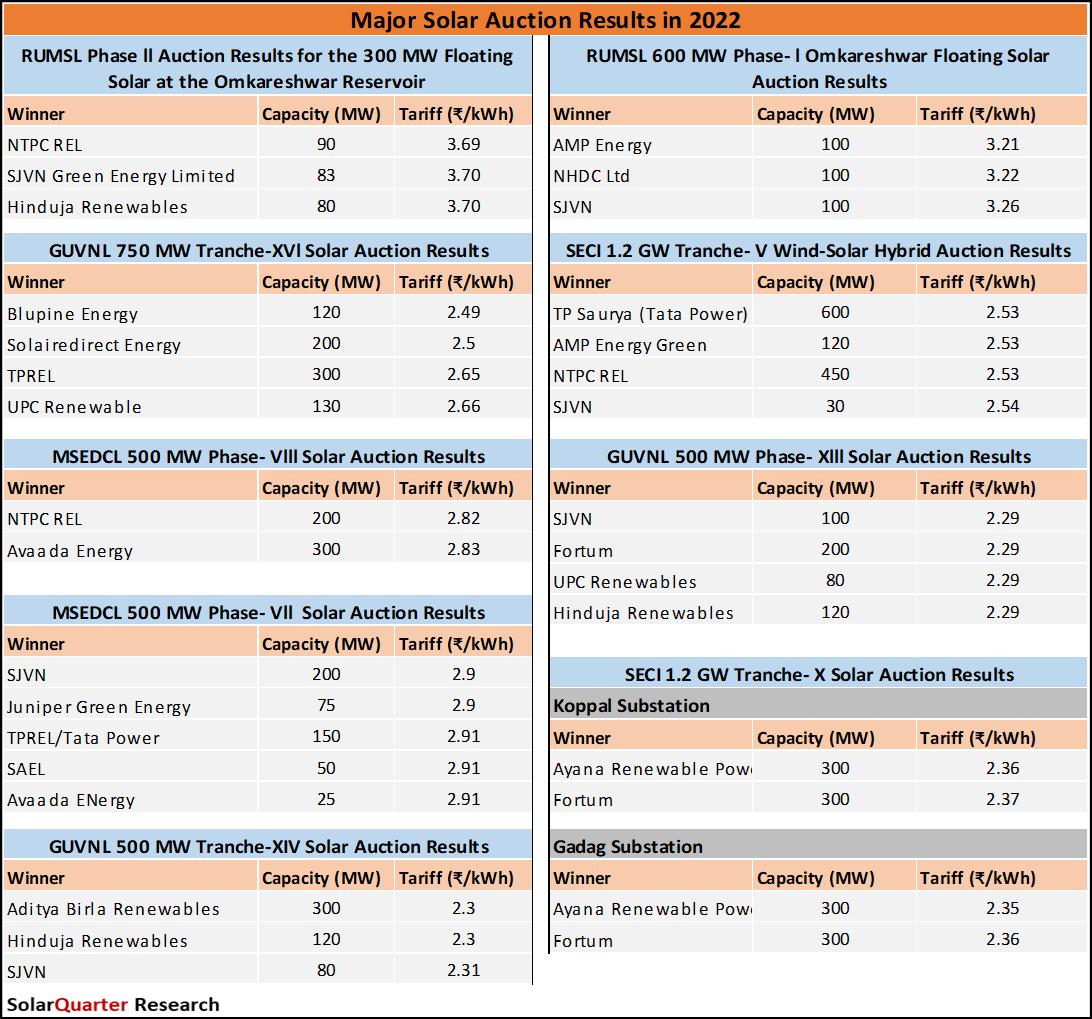

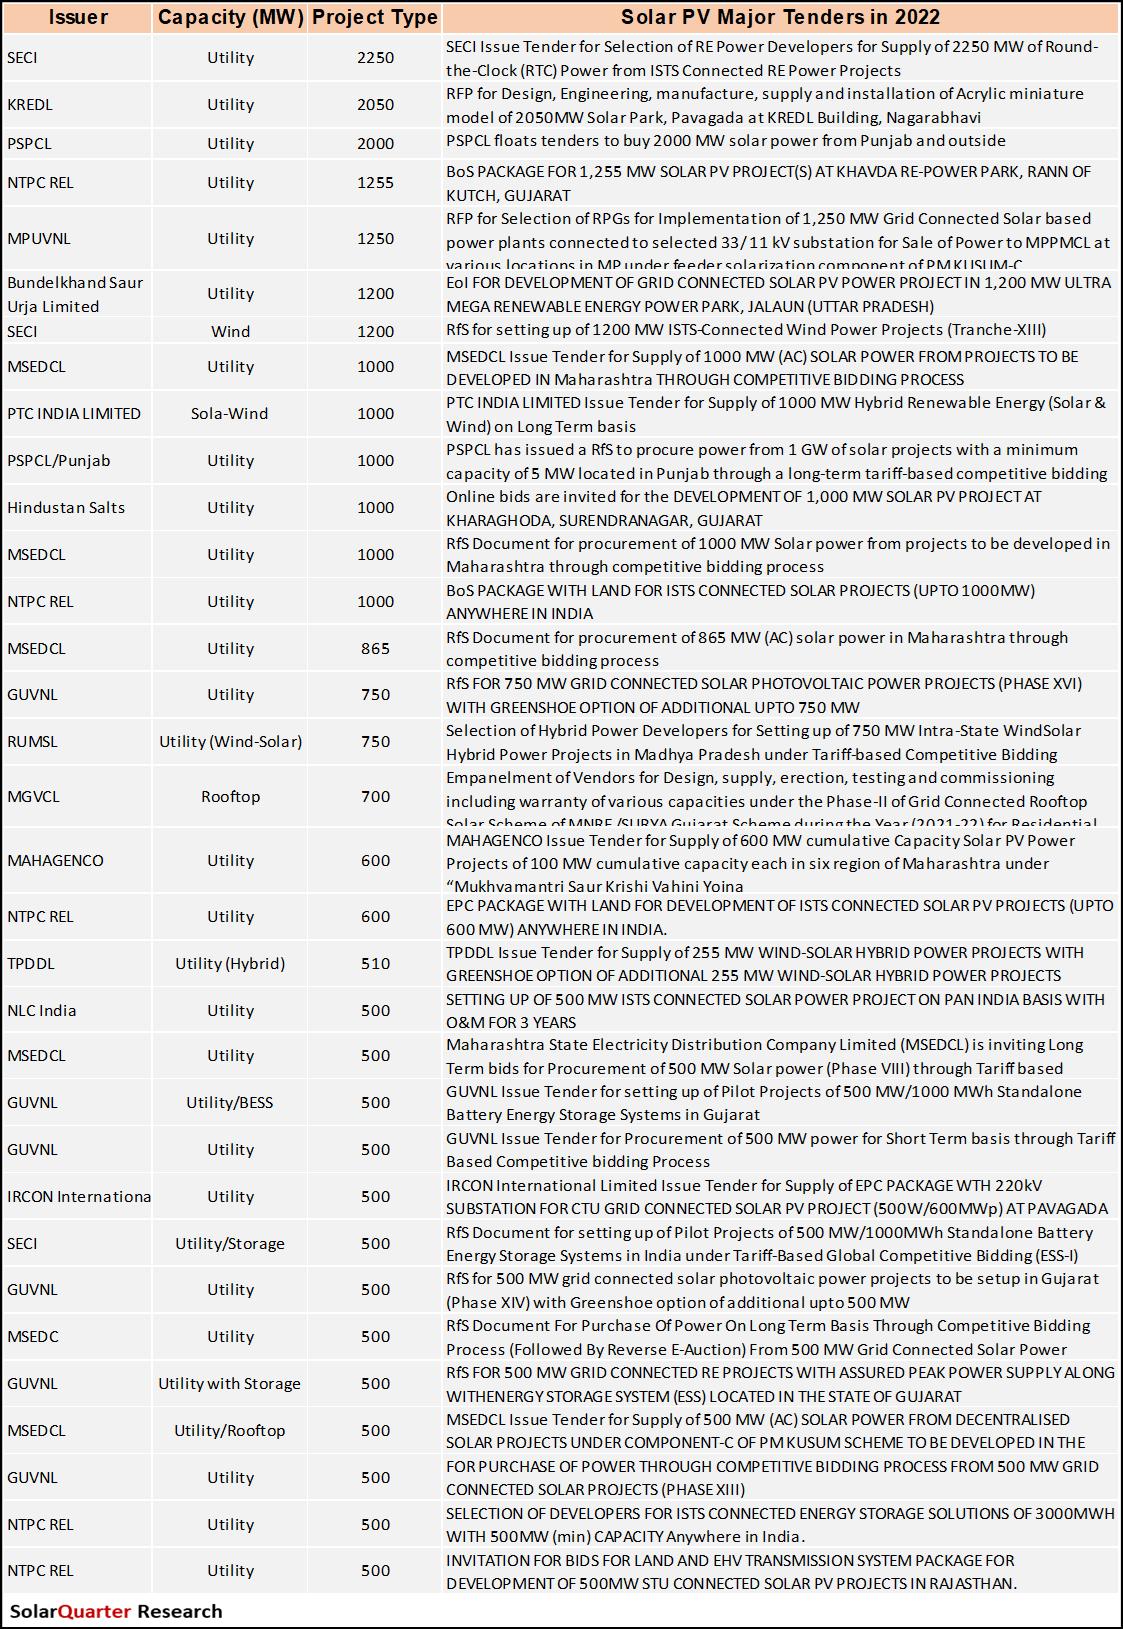
Market Outlook
The installations for Solar PV in the calendar year 2022 for the first nine months were around 10.9 GW (utility-scale & rooftop), and there was a growth of 46% compared to 9M CY 2021 installations. COVID-19 restrictions are gone days, but the significant issue is with the supply of Solar PV modules, as there is a fluctuation in the price of raw materials in China, and there is a huge demand for Solar PV modules across the world Developers can delay projects and call for greater collaboration among upstream and downstream players. Polysilicon prices recorded a rise, and glass prices are increasing. Many signed orders will cause serious losses and seriously endanger the sustainable development of the industry due to the rising prices of materials followed by transport
As capacity utilization rates of Chinese manufacturers fall, manufacturers negotiate with customers. The module manufacturers have also called upon the relevant PV industry associations along with other bodies to monitor the upstream and downstream production capacity more closely to assist in the planning of production capacities beforehand and balance upstream and downstream supply and demand Basic customs duty on Solar PV cells and modules has been imposed from 1st April 2022, which creates ambiguity in the market.
As per the latest update on ALMM list l, 75 companies have been enlisted with 18 788 GW under the Approved list of models and manufacturers. All the government Solar tenders coming these days are mandated to use modules listed under ALMM. On the other hand, none of the Chinese companies are there on the list so far, which might hamper and increase the tariff rate of future bids
PLI (Production Linked Incentive) scheme for Solar manufacturing concludes that the cell and module manufacturing facilities have a minimum gestation period of 18 months. Therefore, the first batch of the Solar module from the facilities is expected before 2024 Also, SECI issued RfS for the Selection of Solar PV Module Manufacturers for Setting up Manufacturing Capacities for High-Efficiency Solar PV Modules in India under the Production Linked Incentive Scheme (Tranche-II) has been issued under the "Scheme Guidelines for Implementation of the Production Linked Incentive Scheme (Tranche II) under ‘National Programme on High-Efficiency Solar PV Modules’ for achieving manufacturing capacity of Giga Watt (GW) scale in High-Efficiency Solar PV modules"
India’s current Solar PV module manufacturing installed capacities are in the range of ~20-25 GW, a significant portion of which is based on multi-crystalline technology, again many new expansions are happening these days with the highest-rated panels of Mono PERC after the announcement of BCD Solar developers have engineered and designed all upcoming Solar plants using Mono-PERC and bifacial technologies.
India’s target to accomplish 280 GW Solar PV installed capacity by 2030 required a capacity addition of nearly 25 GWp per annum In the National draft electricity, five years plan the capacity addition required during 2022-27 to meet the peak demand and energy requirement for the year 2026-27 is 2,28541 MW, which comprises (Coal- 25580 MW, Gas-370 MW, and Nuclear-7000 MW) and 187,909 MW of Renewable based Capacity Addition (Large Hydro-10951 MW, Solar -132,080 MW, Wind-40500 MW, Biomass-2318 MW, PSP-2700 MW) excluding 5,856 MW of likely Hydro based Imports The capacity addition required during 2027-32 to meet the peak demand and energy requirement for the year 2031-32 is 2,43,042 MW comprising 18,134 MW of Conventional capacity addition (Coal-9,434 MW, Nuclear-8700 MW) and 224,908 MW of Renewable based Capacity Addition (Large Hydro-10,888 MW, Solar-147,400, Wind 53,100 MW (Onshore- 43,100 MW and Offshore 10,000 MW, Biomass-1,500 MW, PSP-12,020 MW) excluding 5,856 MW of likely Hydro based Imports
The domestic module manufacturing capacity is not sufficient to meet the yearly requirements and will cause a supply crunch Factors creating issues stating that the sector is going through a perfect storm The prices of major raw materials for the manufacturing of modules like polysilicon, aluminum, silver, and more have increased substantially Sea freight has also increased enormously

The year 2022 is a pivotal one for India’s energy transition. Many big companies such as Reliance, Adani, ReNew Power, and NTPC had announced massive investments in renewable energy (RE), mostly Solar, to slowly move their transition to a low-carbon future This is the last year for the JNNSM target which needs to be fulfilled as India installed around 61 GW of Solar PV capacity by the end of October 2022 as per the CEA monthly update.

In 2022, the installations will be a record year and will surpass an all-time high of Solar PV installations There will be challenges for raw material price and supply. There will also be a growth in Wind-Solar hybrid projects, along with green hydrogen. The Solar rooftop installation will also grow especially in the Commercial and Industrial (C&I) segment, as the electricity demand is increasing due to a sudden surge in demand in the economy after the upliftment of COVID restriction, and to reduce the cost of electricity C&I consumers will go for Solar installation
After the imposition of BCD on Solar, the duty of 40% on the module and 25% on the cell, affects the 2022 installation The installations in the calendar year 2022 will be on the higher side, as this is the last year for the JNNSM target which was 100 GW till December 2022.
The ministry has issued the concept note on Pooling of Tariff of 25 years Plus Therma/Gas
Generating Stations
The power situation in the country has changed from deficit to surplus over the years There were times when States had been keen to enter into a long-term Power Purchase Agreement (PPA) to secure power. However, the situation has changed now. The emergence of cheaper renewable energy, especially Solar, has attracted the attention of everyone Today, the procurers are scouting for cheaper power and are hesitant to enter long-term PPAs, anticipating a further reduction in power prices Further, an often-ignored fact is that the volume of power transacted on the exchange is only about 12% of the total energy requirement in the country.
The availability of ample generation capacity, the low cost of some recently signed renewable PPAs, and low tariffs in the market have led States, specifically those that are surplus in power to approach the Ministry of Power for relinquishment of their share from Central Generating Stations (CGS) The Ministry of Power, considering the request of the States, allowed the States to exit from PPAs with Central Power Sector Utilities after 25 years vide guidelines dated 22.03.2021. Thereafter, many States/ Distribution companies based on commercial considerations are exiting PPAs of costlier plants (non-pit head coal stations and Gas based thermal generating stations) while retaining the PPAs of cheaper plants State-wise Solar PV Installed Capacity (Utility-scale)
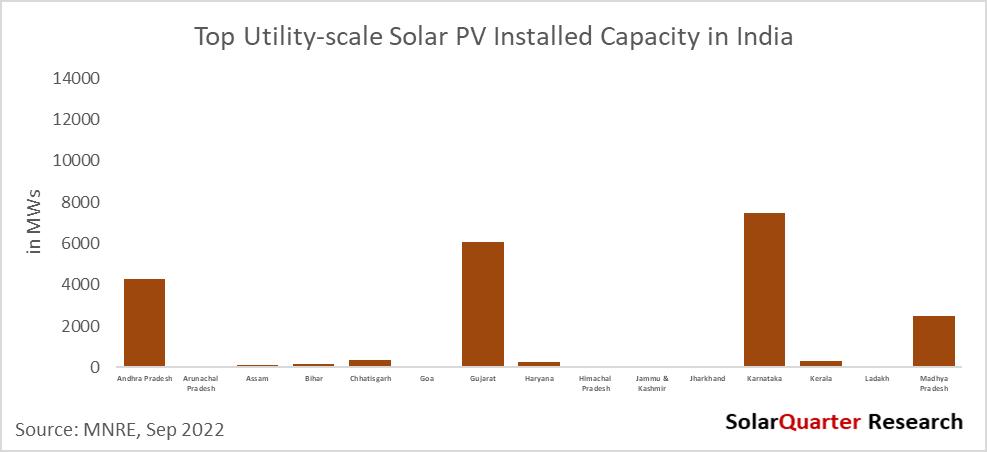
India installed around 49.85 GW of Solar PV installations as of September 2022 as per the MNRE update. Rajasthan, Karnataka, Gujarat, Tamil Nadu, Telangana, and Andhra Pradesh were the top states who have installed grid-connected utility-scale Solar projects of above 4 GW and cover 81.25 percent of the total installed large-scale capacity The top ten states installed a cumulative capacity of around 47 75 GW and covered a market share of more than 96 percent by the end of September 2022

India's total installed Solar PV capacity has crossed the 60 GW milestone by the end of September 2022, out of which large-scale projects contribute 49 85 GW while the rest come from rooftop solar as well as off-grid systems The government has targeted the installation of 60 GW of Solar PV large-scale as of December 2022, but India has achieved above 49 85 GW of Solar PV installation in the utility/large-scale segment A quarter is left for the JNNSM target, and around 10 GW of the shortfall is left to be installed in these three months before 2022 comes to an end. It seems the target might not be fulfilled as expected due to uncertainty arising in the market after BCD from April 2022 Also, the price of the module is on the higher side and is slowly moving in a downward trend after the pandemic restriction It doesn’t seem feasible for the project developers to commission the projects before the due date as the price of the modules are not matching with the tariff rate which the bidders had expected while biddings.
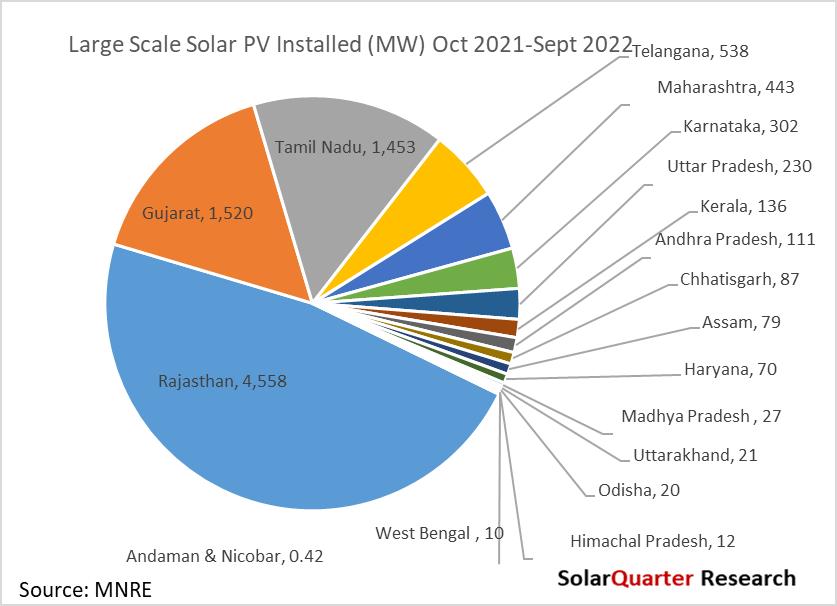
The large-scale Solar projects between October 2021 to September 2022 installed around 9 6 GW, Rajasthan installed a whooping capacity of 4.5 GW, while Gujarat and Tamil Nadu installed 1.52 GW and 1.45 GW, the rest of the state installed below 1 GW in that period. Nine States installed below 100 MW of large-scale Solar capacity, while only one state installed above 500 MW and below 1 GW Around 19 states have not installed any Solar PV capacity under utility-scale Solar PV capacity in the past year since October 2022


