16 minute read
Chapter 1: Introduction and Overview of South Carolina’s Property Tax System


Introduction
South Carolina has a property tax system that is unique among the 50 states. As this report will show, South Carolina’s property tax system is complex, nontransparent, inequitable, and noncompetitive. Act 388 passed in 2006 with the ostensible aim of providing property tax relief to homeowners, but it has exacerbated the problems with South Carolina’s property tax system.
This introductory chapter first presents criteria for a good tax system. Next, it provides an overview of the South Carolina property tax system and Act 388. The third section will describe revisions to the property tax since Act 388. The next section discusses outcomes of Act 388 and South Carolina’s property tax system, paying special attention to effective tax rates. Some of the data illustrate how the property tax has changed since Act 388 went into effect. The final section notes some of the ways that South Carolina’s property tax system is an outlier among the 50 states.
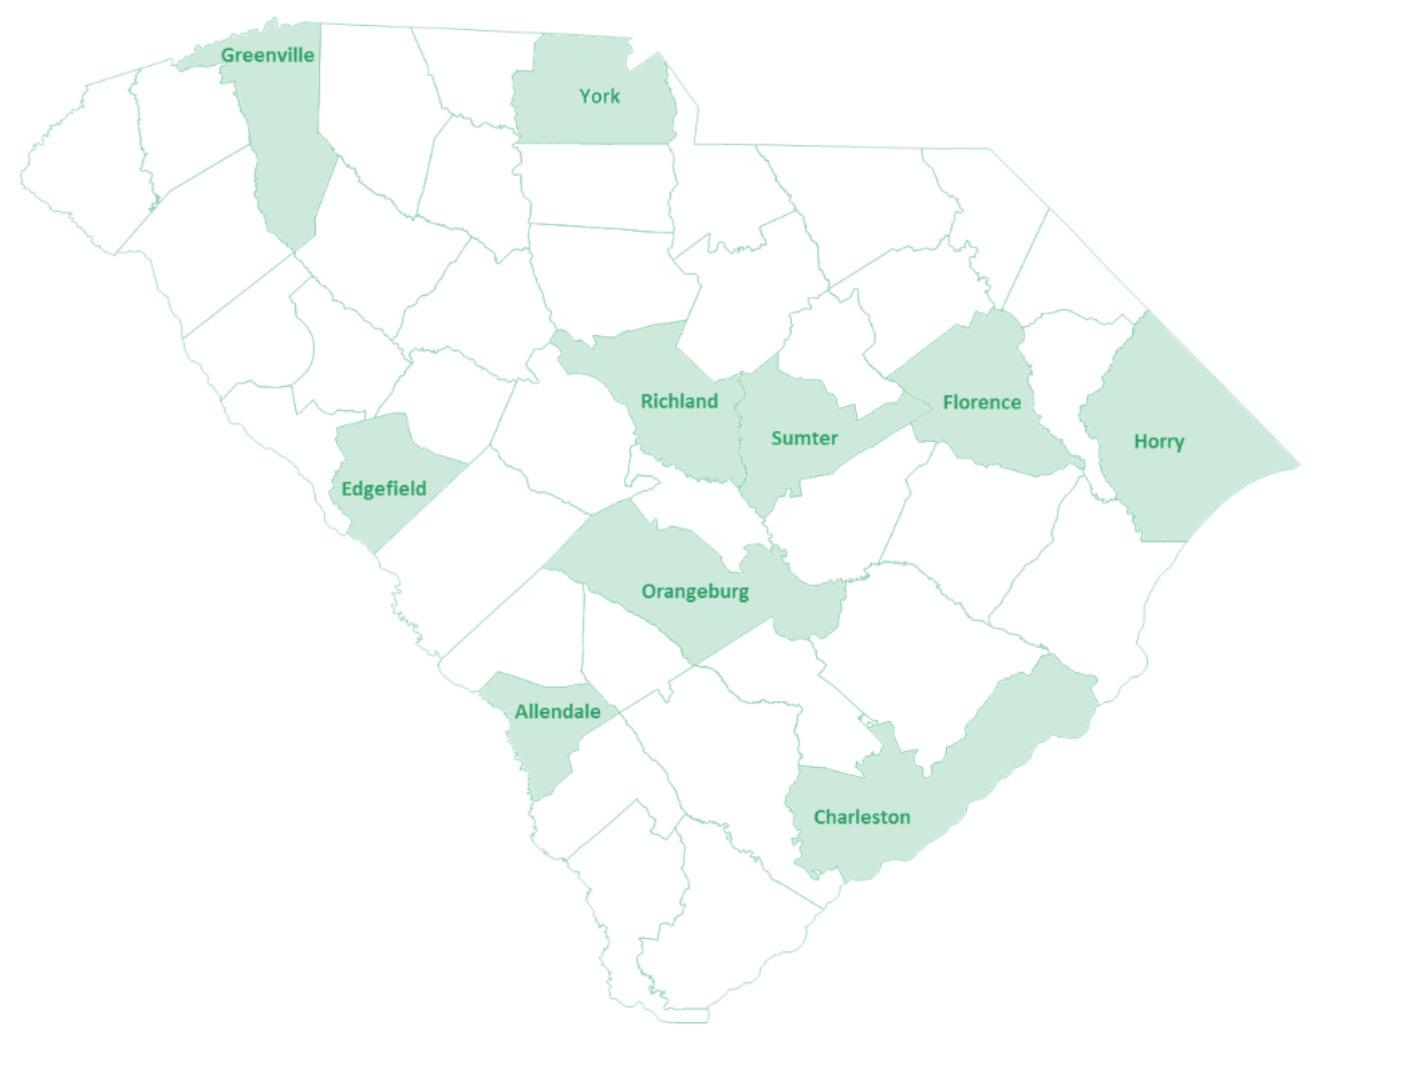
This analysis includes data from 10 focus counties: Allendale, Charleston, Edgefield, Florence, Greenville, Horry, Orangeburg, Richland, Sumter, and York (Figure 1.1). These counties vary in size, geography, and economic status to provide a representative cross-section of South Carolina’s property tax systems. 4
Figure 1.1
Map of Focus Counties
Criteria for a Good Tax System
Studies of state and local tax systems traditionally present underlying principles of sound tax policy as a guide for tax policy choices. South Carolina policymakers should evaluate any reform proposals in the context of these principles.
Equity
Equity or fairness is fundamental to sound tax policy. Two theories of tax fairness, the benefit principle and the ability-to-pay principle, present distinct approaches to equity. The benefit principle ties equity to benefits received. The ability-to-pay principle ties equity to each taxpayer’s financial resources. The terms horizontal equity and vertical equity describe two components of the ability to pay principle. Horizontal equity implies that taxpayers in similar situations face similar tax liability. Vertical equity implies that taxpayers in dissimilar situations face dissimilar tax liability (Cordes 2005 and Ebel 1990). In other words, equitable tax systems impose higher tax rates on taxpayers with more income and wealth and similar tax rates on taxpayers with similar resources.
Efficiency
An efficient revenue system is marked by neutrality. An efficient tax minimizes unintended interference with markets by avoiding policies that alter personal or business behaviors and decisions. In aiming for neutrality, governments should favor policies that uniformly apply low rates to a broad base (Ebel 1990). Efficient systems also minimize the costs of administering and complying with tax systems for governments and taxpayers.
Stability
Tax revenues rise and fall to varying degrees as economic conditions fluctuate. The more stable a tax or system of taxes is, the steadier the revenue stream will be in times of economic change (Almy, Dornfest, and Kenyon 2008).
Transparency
A tax is transparent when information on the process of taxation is publicly available, the tax is understandable, and all information is disclosed. Taxpayers should clearly understand what is taxed (the tax base), what they must pay, and when a tax is payable.
South Carolina’s Property Tax System
The method by which South Carolina’s tax bills are calculated reveals the complexities of the state’s property tax system. In very basic terms, a South Carolina property tax bill is determined in three steps: (1) (2)
(3) The property is valued at its fair market value (also known as appraised value). The property is assigned an assessment ratio. South Carolina has a property tax classification system under which different types of property are taxed at different ratios of assessed value (Table 1.1). Primary residences and private agriculture receive the lowest assessment ratio—4 percent—while manufacturing, utility, and personal property receive the highest assessment ratio—10.5 percent. 5 The fair market value is multiplied by the assessment ratio to produce the assessed value. The assessment ratio for primary residences in South Carolina is 4 percent, so a homeowner’s primary residence valued at $100,000 would be assigned an assessed value of $4,000. Assessed value is multiplied by the total millage rate to derive the property tax bill. The total millage rate is the sum of the tax rates of the county, municipality, school district, and other taxing entities.
Table 1.1 Constitutional Assessment Ratios by Class of Property
Property Classification
Owner-Occupied Agricultural (Private) Agricultural (Corporate) Commercial/Rental Personal Property (Vehicles) Other Personal Property Manufacturing Utility Business Personal Motor Carrier Source: South Carolina State Constitution
Tax Rate (%)
4.0 4.0 6.0 6.0 6.0 10.5 10.5 10.5 10.5 9.5
5 Throughout this report “owner-occupied” will mean the same as “primary residence.” Definitions of these terms and others can be found in the Definitions section at the end of the report.
Table 1.2 presents a simplified property tax bill calculation for two South Carolina residential properties, both with a fair market value of $150,000. The owner-occupied residence has an assessment ratio of 4 percent while the rental property has an assessment ratio of 6 percent. Even if the two properties are in the same taxing jurisdiction, they will not face the same total millage rate because the owner-occupied property is exempt from millage for school operating costs. So, in this stylized example, the total millage rate for the owner-occupied primary residence is 0.2022 and the millage rate for the rental property is 0.4590. As of result of varying assessment ratios and the school exemption, these two properties with identical market values face two very different tax rates and tax bills. The tax on the rental property of $4,131 is three-and-a-half times that of the owner-occupied property ($1,213).
Table 1.2 Comparison of Tax Bills for Two South Carolina Residential Properties
Owner-Occupied Rental
Fair Market Value $150,000 $150,000 Assessment Ratio 4% 6% Assessed Value $6,000 $9,000 Millage Rate 0.2022 0.459 Property Taxes $1,213 $4,131 Effective Tax Rate 0.81% 2.75% Source: Author’s calculation Note: Owner-occupied primary residences have an assessment ratio of 4.0% and rental property has an assessment ratio of 6.0%. Owner-occupied property is exempt from property taxes for school operating costs so is subject to a lower millage rate.
Differentially high taxation of rental property compared to primary residential property is inequitable for two reasons. First, homeowners typically have higher incomes than renters. Thus, the differentially heavy taxation of renters fails the ability to pay principle. Second, homeowners are the primary beneficiaries of school spending. Thus, exempting primary residences from paying for school operating costs fails the benefit principle.
Act 388
Act 388, passed in 2006, limited property tax revenue in three major ways:
It eliminated property tax liability on primary residences for school operating costs known as the “O & M” (operation and maintenance) exemption. Homeowners are still liable for property taxes for school debt service. Since Act 388, non-homestead property owners bear the burden of school operating costs funded by property taxes. Act 388 raised the sales tax one percentage point to offset the revenue loss, mandating state reimbursement of local government tax loss.
It placed a 15 percent cap on the growth of appraised value of property tax over a fiveyear period unless the property is sold (assessable transfer of interest or ATI). If a property is sold, it is revalued at its fair market value.
It placed a cap on the rate of growth of jurisdiction-specific property tax rates. The maximum millage cap limits increases in local millage rates for operating purposes. Under the law, a locality may not increase its millage rate by more than the increase in the consumer price index plus its population growth percentage in the previous year (Significant Features of the Property Tax).
Revisions to South Carolina’s Property Tax System Post-Act 388
Since enactment of Act 388, South Carolina adopted a number of legislative or administrative “patches” to its property tax system. We make no attempt to provide a comprehensive list of these revisions but try to highlight some of the most important ones.
The fees in lieu of taxes (FILOTs) program, which reduces property tax liabilities of firms that make new investment and create jobs in the state, predates Act 388, but the use of FILOTs has expanded considerably since Act 388 was enacted. Nominally, industrial property is assessed at 10.5 percent while commercial property is assessed at 6 percent. Under the FILOT program, industrial property is able to obtain an assessment rate of 6 percent, and sometimes 4 percent, as well as other property tax relief. The FILOT program is further discussed in Chapter 5.
Recent legislation used a phase-in scheme to exempt 14.3 percent of manufacturing property from property taxation and effectively reduce the effective assessment rate on manufacturing property to 9 percent. This statutory change is targeted at investments that are not eligible for FILOTs. Although the stated assessment ratio applying to utilities, like manufacturing, is 10.5 percent, utilities were not included in this legislation.
When property is sold, South Carolina’s ATI law requires that it be reassessed at market value. Because of the state’s 5-year revaluation cycle, this means that recently sold property can be valued much higher than similar property that has not been recently sold. There is a special exemption of 25 percent of market value for properties assessed at a 6 percent rate that would otherwise qualify as ATIs. However, the property owner must apply to receive this exemption and apparently some taxpayers are unaware of this provision.
These changes to the property tax system attempt to reduce the differentially heavy property tax burden on manufacturing and commercial property. However, each of these revisions can be considered “patches” as they increase the complexity of the property tax system and reduce its transparency.
South Carolina’s Property Tax is Characterized by Disparate Tax Rates
Effective Tax Rates
An effective tax rate compares the tax paid (tax liability) to the value of the property on which the tax is levied (tax base). Another way to think of effective tax rate is the tax bill as a percent of the property’s market value.
Much of the analysis in this chapter relies on an annual report examining the property tax by category of property for the largest city in each state (Lincoln Institute of Land Policy and Minnesota Center for Fiscal Excellence 2019). 6 This data source reports effective property tax rates for cities within states, and not for states as a whole. Nevertheless, for many states, examining the property tax in the largest city in the state, as these data do, provides a reasonable measure of the property tax burden for the state as a whole.
6 In addition to published estimates, the staff of the Minnesota Center for Fiscal Excellence calculated some additional estimates for the purposes of this report.
Figure 1.2 Effective Tax Rates by Property Type, 2018
2.5%
2.0%
1.5%
1.0%
0.5%
0.0%
Industrial: $1 Million Commercial: $1 Million Apartment: $600,000 Homestead: Median
Charleston, SC Rate US Rate Charlotte, NC rate Atlanta, GA Rate
Source: Lincoln Institute of Land Policy and Minnesota Center for Fiscal Excellence 2019 Note: Median home values vary across states. The median home value for Charleston was $344,600; the median home value in Charlotte was $215,500; and the median home value in Atlanta was $299,400.
Charleston, South Carolina has an effective tax rate for industrial property that is extremely high compared to the U.S. average and its counterpart cities in neighboring North Carolina and Georgia (Figure 1.2). Charleston’s commercial and apartment effective tax rates are close to the U.S. average but higher than its neighbors. Its homestead effective tax rate is very low compared both to the U.S. average and its neighbors.
Commercial-to-homestead, apartment-to-homestead, and industrial-to-homestead ratios of effective property tax rates show the disparity in tax rates for different property classes. Some states, like North Carolina, tax all property at the same rate. Therefore Charlotte, North Carolina’s commercial-to-homestead ratio and apartment-to-homestead ratios both equal 1. It is not unusual to tax either apartment or commercial property at a higher rate than homestead property as seen in Florida, Georgia, and Tennessee. However, it is unusual to tax apartment or commercial property three times higher than homestead property as South Carolina does.
Effective tax rates can vary within a property category like industrial. For the United States as a whole, industrial properties valued at $100,000 are typically taxed at a somewhat lower rate than those properties valued at $25 million. Charleston’s effective property tax rate for industrial property consistently ranks fourth among the largest cities in each of the 50
states (very high). Its effective tax rate for commercial properties ranks from twenty-fourth to twenty-seventh (about average), its effective tax rate for apartments ranks nineteenth (somewhat above average) and its effective tax rate for residential ranks either fiftieth or fiftyfirst(very low).
County Effective Property Tax Rate Comparison
The annual report of the Lincoln Institute of Land Policy and the Minnesota Center for Fiscal Excellence reports effective tax rates for selected cities. One might wonder whether effective property tax rates reported for Charleston (now the most populous city in South Carolina) or Columbia (which used to be the most populous city in South Carolina) are representative of the state as a whole. Therefore, special calculations done by the staff of the Minnesota Center for Fiscal Excellence present information on ratios of effective property tax rates for the largest city in each of the ten focus counties.
Ratios of effective tax rates for commercial, apartment, or industrial property to homestead property vary among the largest city in each county, however, in all of the 10 focus counties, commercial and apartment property is taxed at an effective rate two-and-a-half to five times higher than homestead property; industrial property is taxed at an effective rate fourand-a-half to nine times higher than homestead property (Figure 1.3). Since South Carolina taxes apartments at the same rate as commercial properties, the effective tax rate ratios of commercial and apartment property to homestead rates are identical.
Figure 1.3 ETR Ratios for Largest City in 10 Focus Counties
10.0
9.0
8.0
7.0
6.0
5.0
4.0
3.0
2.0
1.0
0.0
8.487 9.265
5.115 5.715
4.759
2.795 3.119 4.940
4.481
2.561
Allendale Charleston Edgefield Florence Greenville
Commercial - Homestead ETR Source: Minnesota Center for Fiscal Excellence
6.504 6.781
4.886
2.792 3.716 3.687 5.415
4.799
2.921
2.742
Myrtle Orangeburg Columbia Sumter Rock Hill Beach (Richland (York (Horry County) County) County) Apartment- Homested ETR Industrial - Homestead ETR
Changes in Effective Tax Rates since Act 388 In 2002, commercial property in Columbia, South Carolina, was taxed at just over twice the rate of homestead property. In 2007, after the passage of Act 388, commercial property was taxed at nearly four times the rate of homestead property (Figure 1.4). Although the ratio of commercial-to-homestead effective tax rates has varied from 2007 to 2018, post-388 commercial property has been taxed at a rate at least three times higher than the residential tax rate.
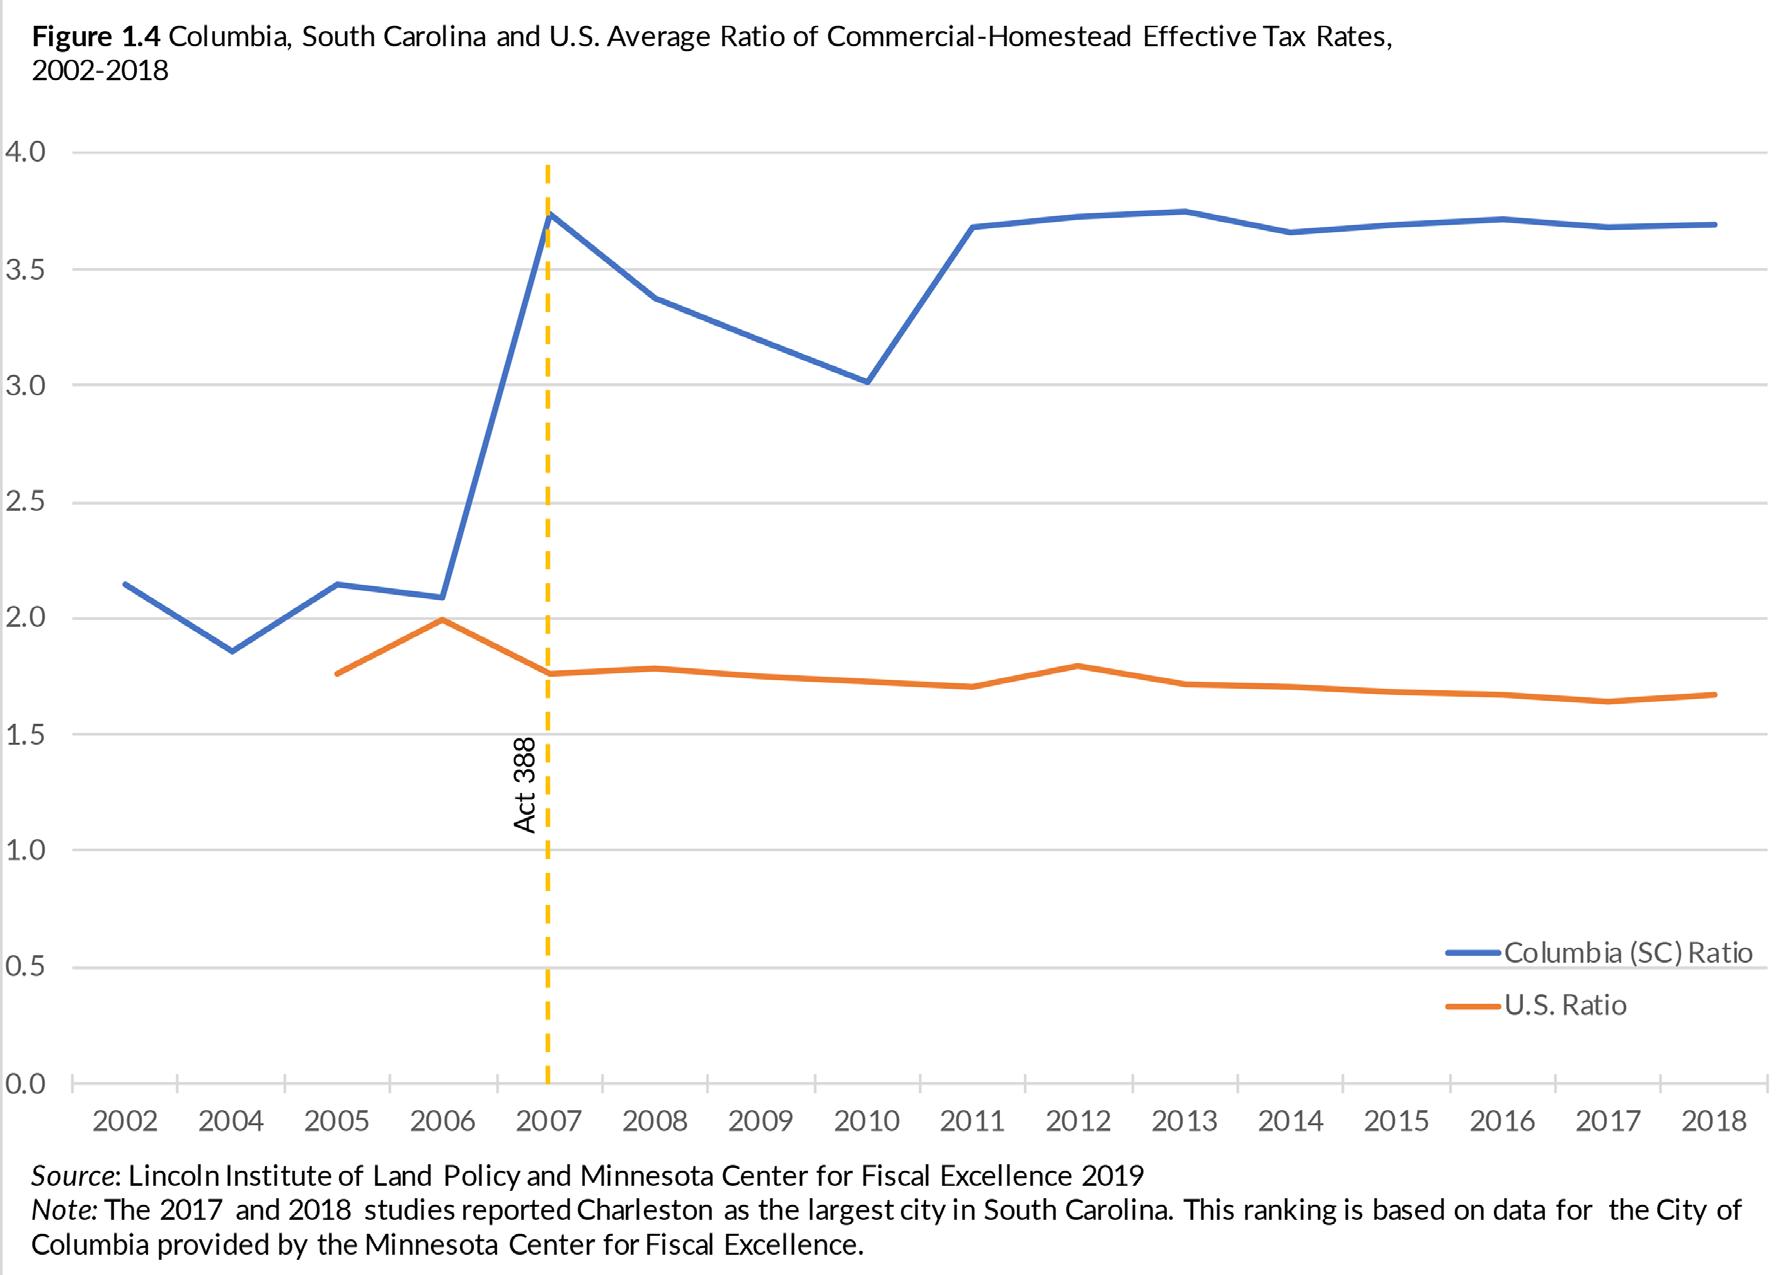
Apartment to homestead ratios of effective tax rates show a similar trend. In 2002, apartment property in South Carolina was taxed at just over twice the rate of homestead property. In 2007, after the passage of Act 388, apartment property was taxed at nearly four times the rate of homestead property. Although the ratio of apartment-to-homestead effective tax rates has varied from 2007 to 2018, post Act 388 with the exception of 2010, apartment property has been taxed at a rate at least three and a half times higher than the residential tax rate.
8 Figure 1.5 The Impact of Act 388: Changing Ratios of Effective Property Tax Rates
7
6
5
4
3
2
1
0
Industrial-Homestead Commercial-Homestead 2005 2018 Apartment-Homestead
Source: Minnesota Center for Fiscal Excellence
Figure 1.5 presents three ratios of effective property tax rates for 2005 and 2018. This clearly shows that South Carolina’s disparities in effective property tax rates were exacerbated by enactment of Act 388:
Before Act 388, industrial property was taxed at about three and a half times higher than homestead property. After Act 388, industrial property has been taxed at nearly seven times the rate of homestead property.
Before Act 388 commercial and apartment property was taxed at over two times the rate of homestead property. After Act 388, commercial and apartment property has been taxed at about three and a half times the rate of homestead property.
Both the structure of South Carolina’s property tax system and its outcome make South Carolina an outlier among the fifty states. South Carolina’s unique policy that fully exempts primary homesteads from property taxes for school operating costs contributes to the high ratios of industrial, apartment, and commercial property tax rates compared to homestead property tax rates. Michigan is the only other state that exempts primary homesteads from local property taxes for school operating costs. However, Michigan imposes a statewide property tax that captures revenue for schools from all property classes.
South Carolina is one of only two states where the property tax system treats commercial properties preferentially compared to industrial properties (the other state is Wyoming) (Minnesota Center for Fiscal Excellence).
Charleston ranks fourth highest in the United States with respect to its effective property tax rate for industrial property. In contrast, South Carolina’s largest city ranks fifty-first lowest with respect to its effective property tax rate on median-valued homes. 7 None of South Carolina’s neighbors have a pattern of effective tax rates that is skewed in this way. South Carolina’s disparate property tax rates are also reflected in various ratios of effective tax rates:
In 2018, Columbia, South Carolina had the highest ratio of industrial-to-homestead effective property tax rates in the nation. 8 Columbia’s ratio of industrial-to-homestead effective tax rates has ranked highest in the nation since 2013.
Columbia, South Carolina’s commercial-to-homestead ratio of effective tax rates ranked fourth highest among largest cities in 2018 and has ranked among the top five highest ratios since 2010.
Charleston, South Carolina’s apartment-to-homestead ratio of effective property tax rates ranked highest among the largest cities in 2018. Conclusion
Data on South Carolina property taxes reveal a complex and unusual system under which businesses and apartments bear a proportionally greater share of the property tax than owner-occupied residential properties. Taxation of property in the state is subject to assessment ratios and exemptions that have led to widely disparate effective tax rates on homestead and non-homestead property. South Carolina has the highest-in the nation ratio of industrial-to-homestead property tax rates. Its policy for taxing industrial property differently from commercial property is highly unusual. The state’s exemption of all primary homeowners from school operating taxes is unique among the 50 states and a primary cause of South Carolina property tax imbalance. The property tax system lacks the characteristics of equity, efficiency, and transparency that are foundational to a sound tax system.
7 See Volume 2 for additional comparisons of effective tax rates by property type for South Carolina and comparison states. 8 These rankings rank the largest city in each state plus Washington, DC and two additional cities in New York and Chicago. Two cities are used to reflect property tax policy in Illinois and New York since Chicago’s and New York City’s property tax systems are significantly different from the rest of the state. Since 53 cities are included in total, ranks range from 1 to 53.


