
29 minute read
Visitation Report
Tourism Space Coast on the


Tourism Space Coast
VISITATION REPORT CALENDAR YEAR 2018 AND 2019
BY ALEX VAMOSI, Ph.D.
EXECUTIVE SUMMARY
This report provides a comparative analysis of the lodging, spending, and trip profiles of Space Coast visitors for calendar years 2018 and 2019. The population group on which data were collected are domestic visitors who purchased overnight lodging during their visit to the Space Coast. We refer to this market as DTAB - domestic tourism, accommodations-based. The DTAB segment is a large subset of the overall tourism market and the key economic driver of overnight visitation on the Space Coast. The estimates that were tabulated for this report are based on a survey instrument that was completed by 2,079 respondents over the two-year period. The following items summarize the main findings of this report.
• In comparison to 2018 estimates, mean expenditures per party in the DTAB market decreased by 4.4 percent in 2019, and by 4.0 percent and 9.3 percent in the hotel and non-hotel accommodations sub-markets, respectively. These decreases occurred because the average 2019 visiting party was smaller (fewer adults) and rented fewer rooms for fewer nights than a representative party in 2018.
• Average spending per room per night (room nights) and per person per night (people nights) grew by 3.2 percent and 5.2 percent, respectively, in 2019.
Consequently, we can conclude that spending per party would have risen in 2019 had the average number of room nights and people nights remained unchanged.

• Over the two-year period that was studied, the DTAB market had an economic impact of about $210.7 million for every 100,000 visiting parties; or $45.1 million for every 100,000 room nights that visitors procured for overnight lodging.
• The Space Coast economy benefits from a high frequency of repeat visits. Over the entire two-year period, about 50.5 percent of survey respondents visited two to four times in the past 24 months; while a remarkable 19 percent visited 5 or more times.
• The large proportion of high frequency visitors is partially attributable to the variety of attractions that the Space Coast offers, and the high level of satisfaction experienced by its users; over the two-year period, all but two attractions scored 4.25 points or higher on a 5-point scale.
During the spring of 2017, a research team comprised of members from the Florida Institute of Technology (FIT) and Florida’s Space Coast Office of Tourism (FSCOT) began developing a survey instrument designed to gather detailed information about domestic visitors who purchased overnight lodging in Brevard County. By statute, these establishments are required to pay Brevard County’s 5 percent bed tax. The database that has been compiled since 2017 has been used to provide a 12-month snapshot and/or to make annual comparisons of visitor profiles, spending patterns, and other trip characteristics of visitors in the domestic tourism, accommodations-based (DTAB) market. Although the DTAB market does not encompass the entire tourism market, it is a large subset of the market and the key economic driver of overnight visitation on the Space Coast.
Each year, members of the FIT/FSCOT research team review the survey instrument for clarity and conciseness and adjust the survey accordingly. When methodological issues in the collection process or in data cleaning arise, these are also discussed by team members before any change is finalized. For instance, in the spring of 2018, in collaboration with one of FSCOT’s marketing partners, a new collection process was implemented to address concerns over dwindling sample sizes that began occurring in September 2017. The new process has yielded a much larger number of surveys in total and a steadier stream of responses from one collection period to the next. A total of 2,079 useable survey were collected during calendar years 2018 and 2019.
The revised survey collection process has, however, also produced a large increase in the proportion of surveys collected from visitors who chose non-hotel accommodations to satisfy their lodging needs. Visitors in this population group tend to take longer trips, with larger sized parties, than visitors in the hotel sub-market. Consequently, over-sampling in the non-hotel accommodations sector creates an upward bias in mean estimates in the aggregate DTAB market for important metrics, such as party size, length of visit, and per party expenditures. To correct this bias and to more accurately reflect the DTAB population, the data has been weighted by the percentage share of bed-tax revenue that accrued to hotel, non-hotel, and RV/campground accommodations in each year. Data on bed-tax revenues can be downloaded from the FSCOT’s dashboard.
Each visitation report also contains a spotlight feature, which provides an in-depth analysis of distinct sub-markets that make up the Space Coast tourism industry. In past issues, we have studied the cruise market, cohorts by household income, markets consisting of first-time versus repeat visitors, and compared the air travel market with regional drive travel sub-markets. The spotlight for this issue compares data for calendar years 2018 and 2019. Much of the narrative focuses on the economic estimates related to spending and the variables that affect mean expenditures per party: 1) the size of a party; 2) the number of rooms rented by a party; and 3) the number of nights that rooms were procured.
A COMPARATIVE ANALYSIS OF CALENDAR YEARS 2018 AND 2019
1. Introduction
The purpose of this report is to provide a comparative analysis of the lodging, spending, and trip profiles of visitors in the DTAB market and several of its sub-markets for calendar years 2018 and 2019. The respective sub-markets segment visitors based on the type of lodging they purchased and whether survey respondents did or did not embark on a cruise during their visit to the Space Coast. The lodging sub-markets are categorized broadly as hotel accommodations and non-hotel accommodations. Hotel accommodations are defined as lodging at either a hotel or motel, while non-hotel accommodations include Airbnb, VRBO, condos, bed and breakfast, and other types of vacation rentals. Lodging at RV/ Campgrounds, which make up a small share of bed-tax revenue and are rented out at much lower rates per unit than other forms of accommodation, have been excluded from the analysis.
Table 1.1 summarizes the distribution of surveys by number and percent in each of the sub-markets. A total of 2,079 surveys were collected over the two-year period, including 905 surveys in 2018 and 1,173 surveys in 2019. More than 300 surveys were collected annually in the non-cruise sub-market and primary lodging sub-markets. The number of surveys gathered in the cruise sub-market, however, fell below 100 in both years. Although the sample size in the cruise sub-market is small in comparison to the non-cruise sector, from a purely statistical standpoint, it is sufficiently large
TABLE 1.1 DISTRIBUTION OF SURVEYS COLLECTED, 2018 AND 2019
Number of Percent of Surveys Total 2018 2019 2018 2019
DTAB Market 905 1173 100% 100% Non-Cruise Sub-market 819 1077 90.5% 91.8%
Cruise Sub-market 86 96 9.5% 8.2%
Primary Lodging Markets
Hotel Accommodations 502 678 55.5% 57.8%
Non-hotel Accommodations 337 410 37.2% 35.0%
TAKEAWAY: The sample sizes in each year are sufficiently large that valid statistical inferences about the population in each of the sub-markets can be made. that valid inferences about this population group can be made.
The tabulations shown under the Percent of Total column show that the distribution of surveys within the sub-markets was approximately the same in each year. The percentages associated with primary lodging, however, suggest that the hotel accommodations sub-market is under-sampled. This determination was made by comparing the table percentages with the share of bed-tax revenue generated by hotel accommodations. For example, the proportion of surveys in 2019 is 57.8 percent, while the share of bed-tax revenue was 75 percent in fiscal year 2018-19. To more accurately reflect the DTAB population, the estimates associated with the lodging and spending profiles were weighted by the share of bed-tax revenue that accrued to hotel, non-hotel, and RV/ campground accommodations in each year.
Table 1.2 shows data on the number of trips survey respondents had made to the Space Coast within the past 24 months, inclusive of their most recent visit. The distributions are strikingly similar in 2018 and 2019, with about 29.5 percent of respondents identifying themselves as first-time visitors,
TABLE 1.2: DISTRIBUTION OF TRIPS MADE TO THE SPACE COAST IN THE PAST 24 MONTHS
Number of Visits Percent of Total 2018 2019 2018 2019
First-Time Visitor 266 347 29.4% 29.6% 2 Visits 254 316 28.1% 26.9% 3 or 4 Visits 207 291 22.9% 24.8% 5 or More Visits 178 219 19.7% 18.7%
TAKEAWAY: The frequency of repeat visitors to the Space Coast is markedly high; more than 50 percent of survey respondents visited the Space Coast between 2-4 times in the past 24 months, while
about 19 percent took 5 or more trips. while the rest are people who had visited the Space Coast two or more times. The Space Coast clearly attracts a high frequency of repeat visits. Over the entire two-year period, about 50.5 percent of survey respondents visited two to four times in the past 24 months; while a remarkable 19 percent visited 5 or more times.
Several factors contribute to the high regularity of repeat visits to the Space Coast: driving distance to Brevard County, relatives and friends who live in the area, exposure to various forms of advertising media about the Space Coast, wonderful attractions such as Cocoa Beach, Kennedy Space Center, nearby Orlando theme parks, and a bounty of nature and wildlife viewing resources for outdoor enthusiasts. Word of mouth is also an integral contributor to repeat visits. In both 2018 and 2019, survey respondents indicated a high likelihood of referring a friend to the Space Coast. On a scale of 1 (very unlikely) to 5 (very likely), almost 76 percent of survey respondents indicate that they are “very likely” to refer a friend/family member/ colleague for a visit to Florida’s Space Coast; over 90 percent responded to the survey question with scores of 4 or higher.
2. Lodging Profile of Space Coast Visitors
Survey respondents were asked to report on several variables that collectively describe the lodging profile of Space Coast visitors: party size, number of adults and children, number of rooms that were rented, and length of stay, measured by the number of nights that lodging was procured. Based on this information, two additional variables that influence the economic impact of Space Coast visitors were developed. The new constructs were derived by multiplying party size by number of rooms (room nights) and by number of nights (people nights) for each subject in the sample. Tables 2.1 and 2.2 summarize estimates for four original variables (party size, adults, rooms and nights), while table 2.3 reports on the derived constructs (room nights and people nights.)
Table 2.1 shows that the average size of a DTAB party was 2.96 in 2018, and that hotel accommodations attracted smaller sized parties (2.85) than non-hotel accommodations (3.36). In contrast, the average party size in the DTAB market dropped by 7.1 percent in 2019, a decrease that was felt in all sub-markets, but especially in the cruise and hotel accommodations sub-markets, which saw decreases of 8.9 percent and 8.8 percent respectively. Adults made up about 78 percent of a typical DTAB party in both 2018 and 2019. Thus, most of the observed decrease in party size that occurred in 2019 reflects parties that were traveling with fewer adults. Within the primary lodging markets, hotel accommodations experienced a much larger drop in average party size than non-hotel accommodations (8.8 percent compared to 3.3 percent). This difference, however, is almost entirely explained by a change in the mix of children within the two markets; on average, fewer children resided at hotel accommodations while more children were lodged in non-hotel accommodations.
Intuitively, a decrease in average party size should translate into fewer rooms rented at hotel accommodations. The estimates reported in Table 2.2 confirms this proposition: the number of rooms that were procured by a representative party saw an annual decrease of 6.8 percent in the DTAB market and 8.1 percent in the hotel accommodations sub-market. The zero percent change shown for non-hotel accommodations occurs because respondents who stayed at these establishments were not asked to report how many rooms they rented. Rather, we assumed that each party rented one unit only, even if that unit contained multiple rooms. The decision to code the data in this manner dates to the development of the survey instrument when the research team agreed to define “number of rooms” as the number of standalone units that are rented by visitors. Most hotel rooms are stand-alone units and guests are charged a specific rate for each. This is not the case at many non-hotel
TABLE 2.1: DISTRIBUTION OF PARTY SIZE AND NUMBER OF ADULTS PER PARTY
Party Size Percent of Total 2018 2019 Change (%) 2018 2019 Change (%)
DTAB Market 2.96 2.75 -7.1% 2.32 2.15 -7.3%
Non-Cruise Sub-market 2.92 2.73 -6.5% 2.28 2.13 -6.6%
Cruise Sub-market 3.16 2.88 -8.9% 2.54 2.35 -7.5%
Primary Lodging Markets
Hotel Accommodations 2.85 2.60 -8.8% 2.22 2.05 -7.7%
Non-Hotel Accommodations 3.36 3.25 -3.3% 2.66 2.49 -6.4%
TAKEAWAY: About 80 percent of the decrease in average party size that occurred in the DTAB market in 2019 is explained by party’s traveling with fewer adults.
accommodations that can include single dwelling houses, townhomes, condominiums, etc. The rooms in these units are not standalone (they are part of the unit) and guests are usually charged a single price for the overall unit rather than per room.
Table 2.2 also reports on the mean number of nights that rooms were procured by Space Coast visitors. This metric, which is used to measure the average length of a trip visit, decreased by a mere 0.5 percent in 2019. The small annual change, however, masks wide variations within the various sub-markets. For instance, the average length of stay increased by 2.2 percent at hotel accommodations, while dropping 8.9 percent, almost two-thirds of a night, at non-hotel accommodations. Regrettably, we were unable to determine why the mean length of a visit at non-hotel accommodations dropped so markedly in 2019. Interestingly, visitors in the cruise sub-market also reported significantly longer trip visits in 2019, about one-half night longer than in 2018, a jump of more than 17 percent. We conjecture that many parties that embarked on a cruise in 2019 may have traveled to the Space Coast a night or two earlier and/or decided to extend their visit upon completing their cruise.
Table 2.3 summarizes estimates for two variables that directly influence the average expenditures made by visiting parties:

TABLE 2.2: DISTRIBUTION OF ROOMS AND NIGHTS THAT LODGING WAS PROCURED
Number of Rooms Number of Nights 2018 2019 Change (%) 2018 2019 Change (%)
DTAB Market 1.18 1.10 -6.8% 4.17 4.15 -0.5%
Non-Cruise Sub-market 1.17 1.10 -6.0% 4.28 4.20 -1.9%
Cruise Sub-market 1.22 1.09 -10.7% 3.22 3.78 17.4%
Primary Lodging Markets
Hotel Accommodations 1.23 1.13 -8.1% 3.25 3.32 2.2%
Non-Hotel Accommodations 1.00 1.00 0.00% 7.20 6.56 -8.9%
TAKEAWAY: In the hotel accommodations sub-market, a typical party rented fewer rooms but for more nights in 2019; in contrast, the number of nights that visitors procured lodging at non-hotel accommodations dropped sharply in 2019, almost two-thirds of a night.
TABLE 2.3: DISTRIBUTION OF ROOM NIGHTS AND PEOPLE NIGHTS
Room Nights People Nights 2018 2019 Change (%) 2018 2019 Change (%)
DTAB Market 4.88 4.52 -7.4% 12.84 11.67 -9.1%
Non-Cruise Sub-market 5.02 4.56 -9.2% 13.15 11.74 -10.7%
Cruise Sub-market 3.75 4.18 11.5% 9.93 11.09 11.7%
Primary Lodging Markets
Hotel Accommodations 4.18 3.81 -8.9% 9.41 8.60 -8.6%
Non-Hotel Accommodations 7.20 6.56 -8.9% 24.58 21.00 -14.6%
TAKEAWAY: Apart from the cruise sub-market, the average number of room nights and people nights fell significantly in the DTAB market and all other sub-markets in 2019.
room nights and people nights. Lodging expenses make up the single largest component (more than 40 percent) of the total purchases made by a party. Apart from the type of accommodation that visitors procure, lodging expenses depend primarily on room nights, the number of rooms rented by a party multiplied by the length of stay of that party (measured by number of nights.) Dining, drinking, recreation and retail (DDRR) purchases account for an additional 50 percent of total expenditures. DDRR purchases are positively related to people nights (party size times length of stay.)
Estimates reported in Table 2.3 exhibit a significant decrease in 2019 in the DTAB market and in virtually every sub-market for both room nights and people nights. The lone exception occurred in the cruise sub-market where longer stays more than offset decreases in party size and number of rooms procured and produced higher mean estimates for both room nights and people nights. Within the lodging sub-markets, the mean estimates are noticeably larger in the non-hotel accommodations sub-market, where over the two-year period, room nights and people nights were about 1.7 times and 2.5 times greater, respectively. The percent change in room nights, however, was virtually identical in the two lodging sub-markets (-8.9 percent), while non-hotel accommodations experienced a much larger relative decline in people nights (-14.6 percent compared to -8.6 percent)
TABLE 3.1 MEAN EXPENDITURES PER PARTY, TOTAL SPENDING AND LODGING EXPENSE
Total Spending Lodging Expense 2018 2019 Change (%) 2018 2019 Change (%)
DTAB Market $1,350 $1,291 -4.4% $586 $553 -5.6%
Non-Cruise Sub-market $1,391 $1,299 -6.6% $606 $555 -8.4%
Cruise Sub-market $1,000 $1,221 22.1% $431 $553 28.3%
Primary Lodging Markets
Hotel Accommodations $1,112 $1,067 -4.0% $465 $444 -4.5%
Non-Hotel Accommodations $2,206 $2,001 -9.3% $1,028 $911 -11.4%
TAKEAWAY: Apart from the cruise sub-market, 2019 was characterized by significant decreases in mean spending per party; most of the drop is attributable to shorter visits and smaller party size, which subsequently lowered lodging expense per party.
3. Spending Profile of Space Coast Visitors
Visitors to the Space Coast make significant contributions to the local economy through direct channels associated with their spending on lodging, dining and drinking, recreation, retail purchases, etc. The economic impact also works through indirect channels (additional purchases made by local businesses in the tourism and support sectors) and induced channels (additional spending by local households of the income earned in the tourism and support sectors). Survey respondents were asked to itemize their direct spending into several broad categories, which were then aggregated to determine the total expenses for each party in the sample.
Table 3.1 summarizes per party estimates for total spending and lodging expenses, the single largest component of spending, which accounts for approximately 43 percent of direct sales in the DTAB market. Mean expenditures fell in the aggregate DTAB market and in virtually every sub-market in 2019. More specifically, total outlays dropped by an average of $58 per party in the DTAB market, and by $45 and $205 per party, respectively, in the hotel and non-hotel accommodation sub-markets. The decrease in total spending in the DTAB market would have been even larger had spending in the cruise sub-market not increased by an average of $221 per party. The annual percent changes reported in Table 3.1 directly align with the changes in room nights and people nights that were reported in Table 2.3. For instance, in the cruise sub-market, where room nights and people nights increased, significantly higher levels of spending occurred. In all the other sub-markets, a decline in room nights and people nights produced lower mean outlays.
TABLE 3.2 MEAN PURCHASES BY ROOM NIGHTS AND PEOPLE NIGHTS
Room Nights People Nights 2018 2019 Change (%) 2018 2019 Change (%)
DTAB Market $277 $286 3.2% $105 $111 5.2%
Non-Cruise Sub-market $277 $285 2.8% $106 $111 4.6%
Cruise Sub-market $267 $292 9.5% $101 $110 9.3%
Primary Lodging Markets
Hotel Accommodations $266 $280 5.3% $118 $124 5.0%
Non-Hotel Accommodations $306 $305 -0.4% $90 $95 6.2%
TAKEAWAY: For the most part, average expenditures per room per night (room nights) and per person per night (people nights) grew steadily in 2019. Spending per room night was virtually unchanged in the non-hotel accommodations sub-market.
Table 3.2 shows the impact on spending after controlling for changes in room nights or people nights. When expenditures are calculated per room per night (room nights) or per person per night (people nights), we find that mean outlays increased by a healthy 3.2 percent and 5.2 percent, respectively, in 2019. Subsequently, we can conclude that had the average number of room nights and people nights remained unchanged in 2019, mean expenditures per party would also have risen.
The spending estimates shown in the tables above were also used to quantify the economic impact of the DTAB market in Brevard County. Over the two-year period that was studied, the DTAB market had an economic impact of about $210.7 million for every 100,000 parties; or $45.1 million for every 100,000 room nights procured by overnight visitors. For each estimate we began by calculating a two-year weighted average of the direct purchases made by Space Coast visitors (shown in Tables 3.1 and 3.2). The weighted average estimates were then multiplied by 1.6 to account for both indirect and induced purchases that were made by local businesses and households in the tourism sector and supporting sectors of the economy. The 1.6 multiplier is consistent with estimates associated with most tourism events that have been reported in the Space Coast Tourism Journal. The final calculations were made by multiplying total expenditures (direct spending plus indirect and induced spending) by 100,000 units.
Economic impact assessments related to tourism typically report spending estimates on a per party basis. Calculating the total number of parties that visit the Space Coast, however, is challenging. The difficulty is that there is no mechanism in place to track the number of visitors entering Brevard County and staying overnight. Conceptually, it would be easier to track room nights at hotels/motels, non-hotels and RV/campgrounds. For instance, the FSCOT has reliable data that includes monthly and annual estimates of the number of available rooms and occupancy rates at hotels and motels in Brevard County. If similar data were available for vacation rentals and RV/campgrounds, then valid estimates of room nights could be tabulated for each lodging sub-markets and subsequently converted into an economic impact estimate.
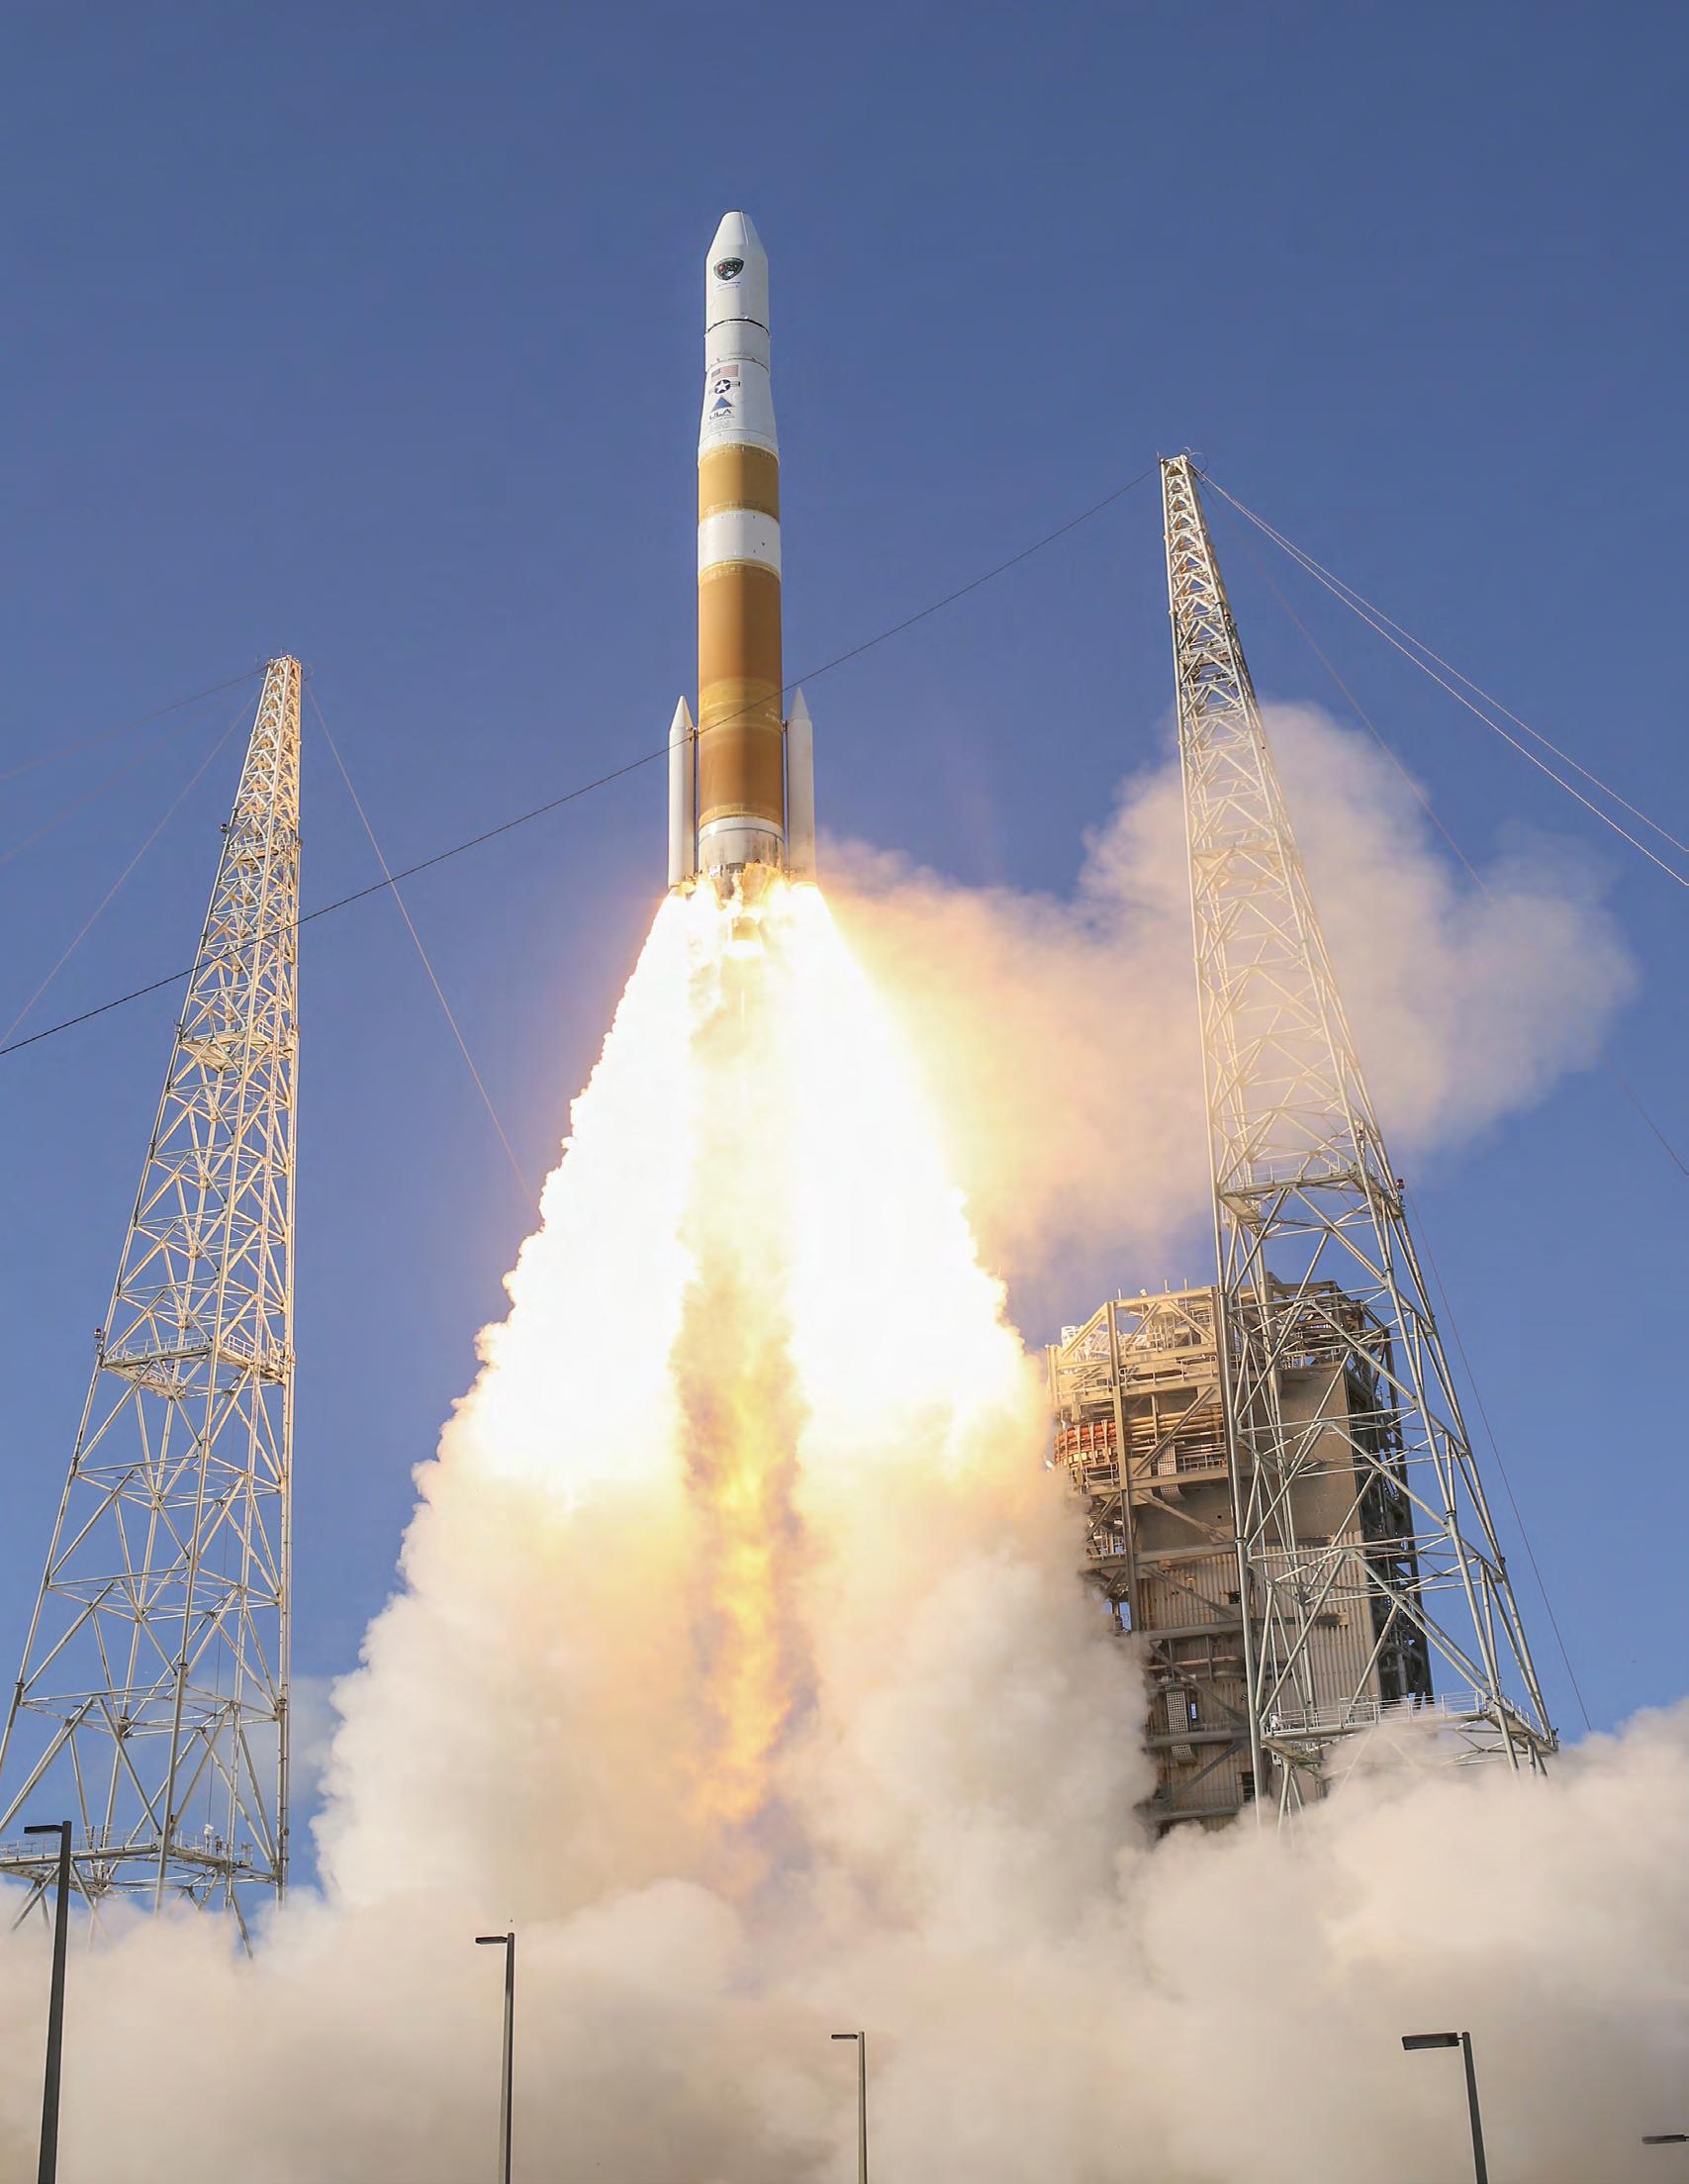
TABLE 4.1 DISTRIBUTION OF TRAVEL MODE
2018 2019 Change Primary Method of Travel to the Space Coast
Drive Travel 59.2% 58.4% -0.83 pts
Air Travel 40.8% 41.6% 0.83 pts
If Air Travel, which Regional Airport
Orlando International Airport 78.6% 76.4% -2.16 pts
Orlando Melbourne International Airport 11.1% 11.5% 0.36 pts
Orlando Sanford International Airport 10.3% 12.1% 1.79 pts TAKEAWAY: The primary method used to travel to the Space Coast saw little change in 2019; amongst air travelers, the use of Melbourne and Sanford regional airports increased by more than two percentage points in 2019. 4. Trip Profile of Space Coast Visitors
This section explores the trip profiles of Space Coast visitors, including the mode of transportation that was used traveling to the Space Coast, the primary purpose of visits, the types of marketing that respondent’s saw prior to their trip, and the reported participation rates and satisfaction scores of survey respondents for several of the Space Coast’s most prominent venues and activities.
The geographic proximity of the Space Coast to major metropolitan centers such as Orlando, Miami, Jacksonville and Tampa-Bay makes it primarily a drive market. Table 4.1 estimates show that about 58-59 percent of survey respondents used drive travel as their primary mode of transportation when traveling to the Space Coast. It should be noted that Facebook places a 100-mile radius restriction on the ads and survey link that it sends to users who have visited the Space Coast. Consequently, a sizeable amount of the local drive market did not receive the ad nor the link to the
TABLE 4.2 PRIMARY PURPOSE OF TRIP VISITS
2018 2019 Change
Vacation/Holiday 54.9% 51.2% 3.68 pts Visiting Family and Friends 14.8% 16.2% 1.39 pts Rocket Launch 5.19% 8.18% 2.99 pts Business 6.30% 6.65% 0.35 pts Private Occasion (wedding, reunion, etc.) 4.97% 4.77% -0.20 pts Public Event, Show or Festival 2.87% 2.73% -0.14 pts Job Interview 1.33% 1.53% 0.21 pts Convenient Stop for Drive Travel 1.33% 1.28% -0.05 pts Another Trip Purpose 8.29% 7.42% -0.87 pts TAKEAWAY: The percentage of visitors who reported Rocket Launch as the primary purpose of their visit to the Space Coast
increased by about 58 percent in 2019. survey instrument. Using data from 2017, which were not subject to Facebook’s restriction, we estimate that the 100-mile limit lowered the drive travel proportions reported in Table 4.1 by about 10 to 15 points.
Table 4.1 also summarizes the distribution of regional airports that were utilized by Space Coast visitors who used air travel as their primary method of transportation. The proportion of air travelers who flew into Orlando International Airport (MCO) has decreased from about 80 percent in 2017 to 76 percent in 2019, a total drop of about 4-points over the two-year period. As would be expected, the smaller regional airports in Melbourne (MLB) and Sanford (SFB) have benefited from this decline, with roughly an equal split accruing to both. For more information, we refer readers to the Space Coast Tourism Journal (Summer 2019), which provides an in-depth analysis of regional markets by mode of transportation.
Table 4.2 highlights the primary motivations given by survey respondents for
trip visits to the Space Coast. Naturally, the most cited reason is vacation/holiday (over 50 percent), followed by visiting family and friends (15 to 16 percent). Since 2017, when we first began compiling data for this report, there has been a clear increase in the proportion of respondents who identified “visiting family and friends,” or some other non-vacation motive, as their primary trip purpose. For example, a re-energized NASA space program, combined with renewed public interest in space exploration, fueled a significant jump in Space Coast visitors during the past year. In 2019, more than 8 percent of survey respondents recorded “rocket launch” as the primary purpose of their visit, an annual increase of 40 percent, making it the third highest ranked reason that people visit the Space Coast. The current issue of this publication includes an economic impact assessment of a Falcon Heavy rocket launch.

TABLE 4.3 DISTRIBUTION OF ADVERTISING PLATFORMS (ABOUT THE SPACE COAST)
2018 2019 Change
Digital Marketing (average number seen) 1.23 1.27 0.048
Social Media Video 51.2% 52.6% 1.44 pts
Website 28.0% 27.5% -0.42 pts
Social Media Other 20.8% 23.4% 2.59 pts
Florida’s Space Coast Vacation Planner 17.3% 17.5% 0.13 pts
YouTube 5.3% 6.4% 1.09 pts Traditional Tactics (average number seen) 0.98 1.00 0.023
Billboard or Outdoor Advertisement 29.5% 29.8% 0.34 pts
News Stories 15.1% 18.2% 3.11 pts
Magazine Print Ad 17.9% 15.8% -2.13 pts
Airport Display 14.7% 15.3% 0.56 pts
TV 15.0% 14.7% -0.28 pts
Radio 5.6% 6.3% 0.67 pts None of the above 17.6% 18.8% 1.19%
TAKEAWAY: In 2018 and 2019, digital marketing tactics respectively produced 25% and 27% more exposure than traditional advertising media. Collectively, exposure to social media platforms increased by four percentage points in 2019.
Marketing and advertising platforms are essential tools used to build brand awareness, attract first-time customers and foster growth through repeat customers. In the tourism industry, traditional marketing platforms have included billboards and outdoor advertising, TV and radio, newspaper stories and magazine print ads, and airport displays. In the era of information technology, digital marketing platforms such as social media videos, online websites, vacation planners, etc. are becoming increasingly prominent in building brand awareness and attracting visitors to the area. In order to compare the relative exposure to traditional and digital marketing platforms, survey respondents were asked to check off all the types of marketing or advertising they have “specifically seen about the Space Coast” in the past six months. TABLE 4.4 ACTIVITY PARTICIPATION RATES AND SATISFACTION Table 4.3 summarizes the distribution for 11 advertising platforms that were Participation Rate Satisfaction (5-point Scale) considered. In both 2018 and 2019, social 2018 2019 2018 2019 media videos about the Space Coast were Average 52.6% 49.7% 4.40 4.41 seen by more than 50 percent of survey respondents, a figure that is over 20 points higher than the second ranked platform - billboard or outdoor advertising. The table also reports the average number of Beach Activities 87.7% 85.1% 4.44 4.47 Bicycling 39.0% 34.5% 4.41 4.37 Brevard Zoo 35.6% 32.5% 4.51 4.41 (Brevard Zoo) Treetop Trek na 10.1% na 4.13 advertisements about the Space Coast that were seen within each of the two major Eau Gallie Arts District 30.5% 27.5% 4.26 4.36 marketing classifications. In 2019, a repre-Cocoa Village 52.7% 48.9% 4.38 4.34 sentative survey respondent had seen 1.27 and 1.00 advertisements about the Space Downtown Melbourne 45.5% 43.3% 4.35 4.44 Coast from digital and traditional platforms, respectively. Although these numbers Kennedy Space Center 59.8% 60.7% 4.59 4.63
Nature & Wildlife Viewing 56.7% 56.1% 4.41 4.47
Orlando Theme Parks 37.1% 28.1% 4.47 4.35
Ron Jon Surf Shop;
Cocoa Beach Surf 57.0% 54.0% 4.35 4.34
Company
Space Coast Stadium 17.5% 12.3% 4.09 4.18
The Cove 39.3% 32.4% 4.38 4.43
Westgate Cocoa Beach Pier 49.5% 44.3% 4.27 4.28
TAKEAWAY: Shorter trip visits in 2019 generated a lower overall rate of participation; however, using a five-point scale, every activity earned an average satisfaction score above 4.0.
may seem small, they show that the exposure to digital platforms is about 27 percent higher than with traditional media.As noted earlier in this report, the Space Coast has a high volume of repeat visitors; more than 50 percent of respondents had visited the Space Coast 2-4 times in the previous 24 months, while 19.5 percent visited 5+ times. As people become increasingly familiar with a location, the additional benefit of seeking out information through social media or other platforms begins to drop. Consequently, it is not surprising that one out of every five respondents report that they had not seen any advertising about the Space Coast in the six months prior to their trip.
Another reason for the high number of repeat visitors is that people enjoy the many activities the Space Coast offers. Survey respondents were asked to rate their satisfaction with several prominent attractions marketed by Space Coast tourism officials and stakeholders. The ratings scale ranges from (1) very unsatisfied to (5) very satisfied. Table 4.4 summarizes the participation rate and satisfaction scores for 13 venues and activities.

TABLE 4.4 ACTIVITY PARTICIPATION RATES AND SATISFACTION
Participation Satisfaction
Rate (5-point Scale)
2018 2019 2018 2019 Average 52.6% 49.7% 4.40 4.41 Beach Activities 87.7% 85.1% 4.44 4.47 Bicycling 39.0% 34.5% 4.41 4.37 Brevard Zoo 35.6% 32.5% 4.51 4.41 (Brevard Zoo) Treetop Trek na 10.1% na 4.13 Eau Gallie Arts District 30.5% 27.5% 4.26 4.36 Cocoa Village 52.7% 48.9% 4.38 4.34 Downtown Melbourne 45.5% 43.3% 4.35 4.44 Kennedy Space Center 59.8% 60.7% 4.59 4.63 Nature & Wildlife Viewing 56.7% 56.1% 4.41 4.47 Orlando Theme Parks 37.1% 28.1% 4.47 4.35
Ron Jon Surf Shop;
Cocoa Beach Surf 57.0% 54.0% 4.35 4.34
Company
Space Coast Stadium 17.5% 12.3% 4.09 4.18 The Cove 39.3% 32.4% 4.38 4.43 Westgate Cocoa Beach Pier 49.5% 44.3% 4.27 4.28
TAKEAWAY: Shorter trip visits in 2019 generated a lower overall rate of participation; however, using a five-point scale, every activity earned an average satisfaction score above 4.0.
During the past year the overall participation rate dropped from 52.6 percent to 49.7 percent; virtually all activities, except the Kennedy Space Center Visitor Complex, experienced a decline. The explanation is straightforward: shorter trip visits (especially in the non-hotel accommodations sub-market) combined with fewer visitors per party produce widespread decreases in participation rates. Everything else equal, shorter trips provide less opportunity to engage in leisure activities, while a decrease in the average party size lowers the likelihood of participation within a party.
With respect to the satisfaction scores, there are no substantial differences in the 2018 and 2019 scores. In 2019, some venues scored higher, while others scored lower. The aggregate mean score rose by an insignificant 0.01 points, while the largest change for singular attractions and venues was ±0.10 points. Generally, the satisfaction scores are high across the board. Every activity or venue earned an average score above 4.00 points in both 2018 and 2019; moreover, all but two attractions scored an average of 4.25 points or higher. The importance of these high satisfaction scores and participation rates for the long-term sustainability of Brevard County’s tourism sector cannot be overstated. The large proportion of high frequency visitors is at least partially attributable to the variety of attractions that the Space Coast offers, and the high level of satisfaction experienced by its users.
5. Summary
This report presented a comprehensive comparison of visitor profiles in the DTAB market for calendar years 2018 and 2019. The estimates were tabulated using information from 2,079 useable surveys that were collected by FSCOT’s marketing agents over the two-year period.
In general, calendar year 2019 was characterized by modest, absolute decreases in key variables that collectively lowered the mean estimate of spending per party in the DTAB market by 4.4 percent. Average party sizes were smaller (many parties traveled with fewer adults), fewer rooms were rented, and the length of visits (number of nights that lodging was procured) were typically shorter at both hotel and non-hotel accommodations. In the cruise sub-market, however, spending per party increased in 2019 even though mean estimates of party size and number of rooms were both lower. The increase in spending in the cruise sub-market occurred because the average length of a visit rose from 3.2 nights in 2018 to 3.8 nights in 2019.
To control for party size and the number of rooms and nights that lodging was procured, we re-calculated the spending estimates using room nights (rooms times nights) and people nights (party size time nights) as the basis of comparison. In 2019, mean outlays per room night and per people night increased in the DTAB market by 3.2 percent and 5.2 percent, respectively. This leads us to conclude that spending per party estimates would have risen in 2019 had the average number of room nights and people nights remained unchanged.
Visitors to the Space Coast make significant contributions to the local economy through direct channels associated with their spending as well as indirect and induced channels of spending that filter throughout the economy. Over the two-year period, we calculated that the DTAB market had an economic impact of about $210.7 million for every 100,000 visiting parties; or $45.1 million for every 100,000 room nights that overnight visitors procured.
The Space Coast economy also benefits from a high frequency of repeat visits. Over the entire two-year period, about 50.5 percent of survey respondents visited two to four times in the past 24 months, while a remarkable 19 percent visited 5 or more times. The large proportion of high frequency visitors is partially attributable to the variety of attractions that the Space Coast offers, and the high level of satisfaction experienced by its users. Over the two-year period, all but two attractions scored 4.25 points or higher on a 5-point scale. n


