19 minute read
Aerial Insect Abundance Predicts Myotis Bat Habitat Use Along Streams
Ari Brisco Schofield1*, Tazlina Dentinger2, Richard Klein3, and Brandi Sanchez4
[1] UC San Diego, Eleanor Roosevelt College, Ecology, Behavior and Evolution, Class of 2024; [2] UC Davis, College of Engineering, Biological Systems Engineering, Class of 2025; [3] University of California, Berkeley, Conservation and Resource Studies, 2023; [4] UC San Diego, Revelle College, Ecology, Behavior and Evolution, Class of 2023; *Corresponding Author: Ari Brisco Schofield, abriscos@ucsd.edu
Advertisement
ABSTRACT
Bats have become increasingly threatened by anthropogenic disturbances in recent decades. Threats to bat populations are a cause for concern because bats provide crucial ecosystem services such as pest control and pollination. The ability to predict geographic localization of bat populations can improve bat species surveillance and lead to more informed management decisions to aid conservation. Understanding specific factors that affect bat habitat use, like prey abundance and physical site characteristics, can enable the construction of predictive occurrence models. To better understand the habitat use of Yuma myotis (Myotis yumanensis), we conducted a study in the riverine habitats located within LandelsHill Big Creek Reserve in Monterey County, CA, during the summer. Currently, it is unclear how to predict bat habitat use patterns and if management activities will adversely affect bat populations. We found that the number of Myotis bat calls is positively correlated with aerial insect abundance along streams, but is not correlated with stream width. Our results suggest that, during the summer, insect abundance is a stronger predictor of Yuma myotis habitat use than physical site-level characteristics, likely because bats track insect populations. Therefore, monitoring insect abundance is a promising step for developing future bat population predictive occurrence models. These models can serve as a basis to improve targeted monitoring of bat populations, which will be critical for future conservation efforts as bats continue to be threatened.
Introduction
Bats are important components of ecosystems as they provide irreplaceable support for many organisms, including humans. For example, they serve as crucial means of pest control by safeguarding agricultural crops and mitigating disease vectors such as mosquitos, bolstering public health overall.1,2 It is estimated that in the United States alone, bats provide a near equivalent of $22.9 billion in pest control per year through the consumption of insects.1 Yet in recent decades bat species around the world have been increasingly threatened by anthropogenic threats such as habitat loss and degradation, pesticides, water contamination, and fatal diseases (e.g. white-nose syndrome).3,4 In order to effectively monitor and conserve bat to advise management activities. However, constructing predictive occurrence models for widespread bat species is particularly challenging as current data show there is low variability in bat habitat use characteristics. Consequently, more data is needed to draw statistically significant conclusions regarding bat population statuses. One such widespread bat group are those within the genus Myotis (family Vespertilionidae), also known as mouse-eared bats.6,7 With at least 120 species, Myotis is the largest and most widely distributed genus globally within the order Chiroptera, found in a variety of habitats. As a result, not only is it difficult to analyze what factors change Myotis habitat use, but the genus is more likely to be impacted by anthropogenic threats because of their widespread distribution.8 Due to their abundance, Myotis spp. are also responsible for a large proportion of the ecosystem services bats provide, so their loss would be particularly harmful to ecosystems worldwide.
Compared to other bat genera, all Myotis are relatively small, and their diets are composed of a wide variety of insects, often dependent on regional variation in insect communities.6 Like other bats, all Myotis spp. use echolocation to navigate and detect objects in their surroundings, meaning that acoustic surveys can be done as a metric of habitat use.9 Within the genus Myotis there are several described foraging strategies, each of which is connected with the distribution, diet, and morphology of specific Myotis species, wildlife managers must develop a greater understanding of where and when specific populations of bats are likely to occur.
An understanding of which factors influence the distribution of particular bat species can be used to create more accurate predictive models that enable wildlife managers to anticipate where populations are likely to be found.5 Monitoring bat populations can be difficult as they are small and nocturnal.3 As a result, there is currently very little data on the status of bat populations, which is necessary to make well-informed land management decisions to preserve these species. Predictive modeling allows wildlife managers to target areas for observing bats, resulting in improved population monitoring that can be used
One bat foraging strategy is trawling, the primary strategy used by the M. yumanensis. 6 Trawler bats fly a few centimeters over water and catch insects from the surface with their hind feet. In addition, Yuma myotises also catch aeri- al insects close to both land and water depending on the availability of prey. The morphology of M. yumanesis allows for high maneuverability during flight, granting them the ability to fly in tight spaces. However, they are routinely found foraging in open, uncluttered habitats close to and above flowing bodies of freshwater. Since M. yumanesis are opportunistic feeders, they tend to have a highly variable diet; a majority of their diet consists of insects in the orders Lepidoptera, Diptera, Trichoptera, Ephemeroptera, and Coleoptera.10 Understanding whether foraging site characteristics and insect orders are or are not associated with foraging M. yumanesis presence would assist in predicting these bats’ location.
To study M. yumanesis habitat preference, we observed the effects of insect abundance and the availability of open flight paths on the summertime occurrence of M. yumanesis in riverine habitats. More specifically, we asked if the number of M. yumanesis varies with aerial insect availability and stream width, using the number of calls as an indicator of the abundance of M. yumanesis foraging at each site. We expected that higher aerial insect abundance, regardless of the orders of insects present, and more open flight paths surrounding water bodies would yield more bat calls indicating more bat habitat use in a particular area.
MATERIALS & METHODS
2.1 Natural History of Study System
This study was conducted at the Landels-Hill Big Creek Reserve, Big Sur, CA, USA from July 29 to August 3, 2022. This reserve is in the Santa Lucia Mountain range in Monterey County and ranges from 0 to 1,067 m in elevation.11 The coast receives an average of 62 cm of precipitation per year. Average temperatures from 0 to 30 m elevation in August range from 10.9 to 20.9ºC. Riverine habitats within the reserve are found along Big Creek and Devil’s Creek, which are both perennial streams that flow through the reserve. The plant communities vary across the streams, starting as coastal scrub and hardwood in downstream regions and transitioning to more mixed hardwood and redwood further upstream. In addition, the reserve is part of a pristine watershed, defined as functioning close to natural conditions.12 This makes the reserve a good baseline study system because it is relatively unaffected by humans compared to degraded watersheds. The streams on the reserve provide foraging habitat for a variety of insectivorous bat species, including several Myotis species.
The Landels-Hill Big Creek Reserve is known to contain twelve species of bats across its various habitats.13 Myotis species known to live in the reserve are the Yuma myotis (M. yumanensis), California myotis (Myotis californicus), little brown myotis (Myotis lucifugus), longeared myotis (Myotis evotis), long-legged myotis (Myotis volans), and fringed myotis (Myotis thysanodes). Other bat species known to visit the riparian habitat include the canyon bat (Parastrellus hesperus) and Western red bat (Lasiurus blossevillii). M. yumanensiswas the focal species of our study because it is relatively common, especially within the riverine areas, which are also populated by a variety of aerial insects known to be prey for M. yumanensis. 14 Past studies have found insects from the orders Diptera, Ephemeroptera, Plecoptera, Trichoptera, Hemiptera, Hymenoptera, Lepidoptera, Neuroptera, and Coleoptera at the streams we studied.15
2.2 Research Methods
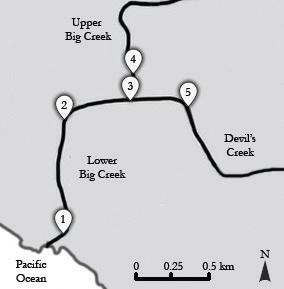
To examine how Myotis habitat use varies with habitat characteristics and insect populations, we observed five different sites with variable characteristics (Fig. 1). Two sites were on Lower Big Creek: one near the Pacific Ocean and one further inland. The third site was at the confluence of Upper Big Creek and Devil’s Creek. The fourth and fifth sites were located on Upper Big Creek and Devil’s Creek respectively, be- fore the creeks converge. At each site, we recorded stream width, bat calls, and aerial insects. We measured the stream width by averaging the width at two accessible points 10 m apart, one on either side of the site where we sampled insects.
Figure 1. Map of site locations. All study site locations surveyed for bat call and flying insect abundance were located along streams in the Landels-Hill Big Creek Reserve in Monterey County, CA, USA. Sites 1 and 2 are both located on Lower Big Creek. Site 3 is located at the confluence of Upper Big Creek and Devil’s Creek. Site 4 is located on Upper Big Creek and Site 5 is located on Devil’s Creek. Sites varied in flight path openness based on stream width.
We surveyed bat calls and aerial insects at one site each day from 8:00 P.M. to 10:00 P.M., when they begin their foraging. Bat echolocation calls were surveyed using the Echo Meter Touch 2 module with the Echo Meter Touch Bat Detector application version 2.8.14 (Wildlife Acoustics, Inc. 2022), which detected and recorded the calls as spectrograms. It detected bat calls with a trigger minimum frequency of 6 kHz, a trigger window (delay after end of detected call) of 1 second, and a maximum trigger length (recording length) of 30 seconds. Myotis calls were identified and separated from non-Myotis bat calls by the spectrograms and frequencies in Kaleidoscope Pro version 5.4.8 (Wildlife Acoustics, Inc. 2021) using the Humboldt State University Bat Lab’s 2018 table on bat echolocation call characteristics.16 The Echo Meter Touch Bat Detector application can also automatically identify bat species using the spectrograms, but there is some error involved in this identification due to noise interference or calls being too short or quiet. Given that multiple species within the Myotis genus produce calls with similar spectrograms, confidently identifying a specific species can be difficult even with software. The Echo Meter Touch 2 is capable of measuring the number of bat calls but cannot directly measure the abundance of individual bats as repeated calls could be from the same bats. It also did not account for the length of calls or periods when multiple bats were calling at the same time, which can occur in heavily populated sites. A larger number of calls in a time period, or call abundance, can indicate that an individual bat is spending more time in the area, or that there are more bats in the area. Either way, this indicates a high level of habitat use by bats, so we used Myotis call abundance as a metric for habitat use.
To examine aerial insect communities at each site, we used a white sheet with a 0.5 m by 0.5 m quadrat divided into 25 squares and set it up near the edge of the stream with an ultraviolet and a white flashlight pointed at it to attract insects, which is a standard method for collecting nocturnal aerial insects. In our pilot study, we allowed insects to accumulate on the sheet for 20 minutes, which resulted in enough insects to reasonably estimate the population and community composition of aerial insects in the area while still being possible to manually count. We then spent five minutes counting the insects in the quadrat before turning off the light and removing the insects from the sheet to avoid counting them in the next trial. Be- five squares, then multiplied by 2.5 to estimate the number in all 25 squares.
Insects that we could not identify onsite were aspirated, retained in individual specimen jars, and identified under a microscope in conjunction with A Field Guide to Insects. 17
2.3 Statistical Analyses
fore repeating the trial, we allowed the insects to disperse for five minutes, and conducted four trials each night for four nights. While counting the number of insects, we also classified them according to their respective order. In cases where there were too many similar-looking insects to count in five minutes, we counted the number of insects in two sets of
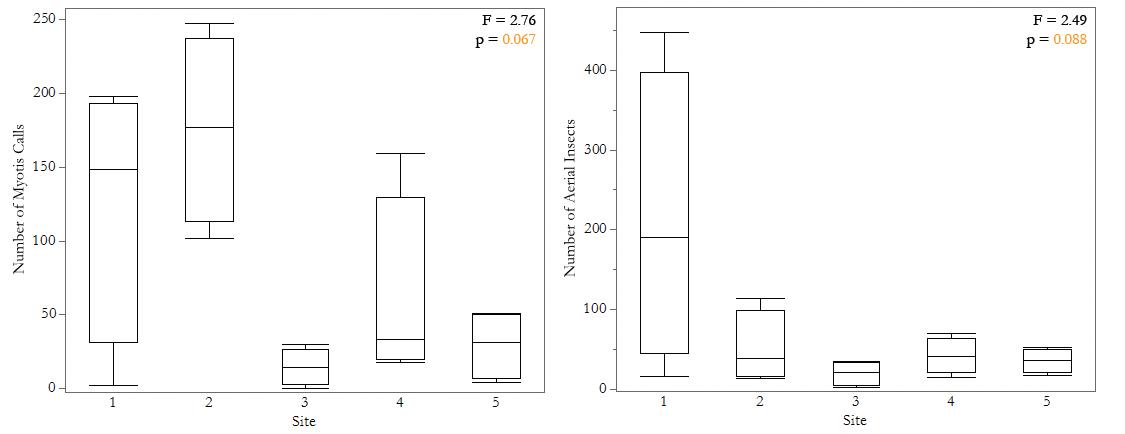
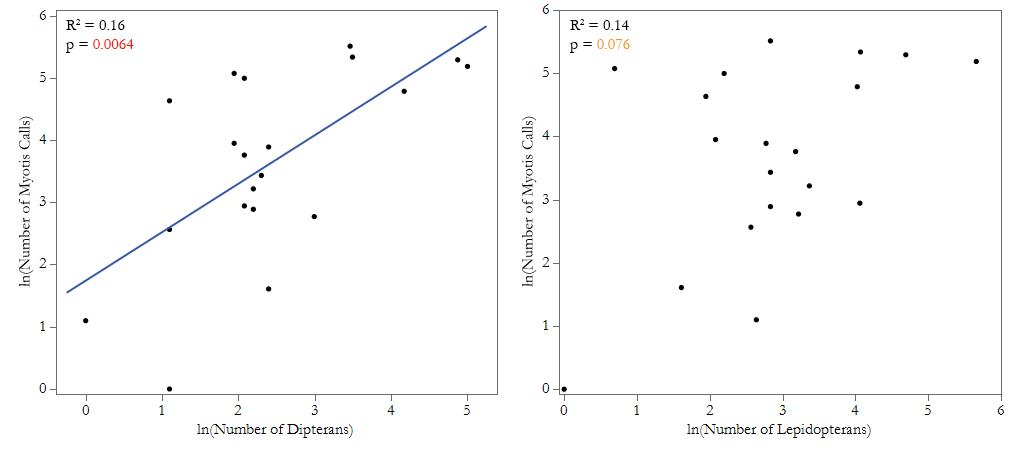
All statistical analyses were performed using JMP Pro software version 16.0.0 (SAS Institute, Inc. 2021). Bat call abundance and insect abundance data were normalized using a natural log transformation. For each half-hour period from each site, we used a linear regression to analyze the effect of the abundance of all aerial insects on the number of Myotis calls in the same period, with time as a random effect (Fig. 2). We also used linear regressions to investigate whether lepidopteran and dipteran insect order abundance influence the number of Myotis calls, with time as a random effect (Fig. 3-4), and to analyze how stream width affects overall abundance of Myotis calls and aerial insects at each site (Fig. 4). We ran two one-way ANOVAs to examine the differences in overall number of Myotis calls and the number of aerial insects between sites.
Results
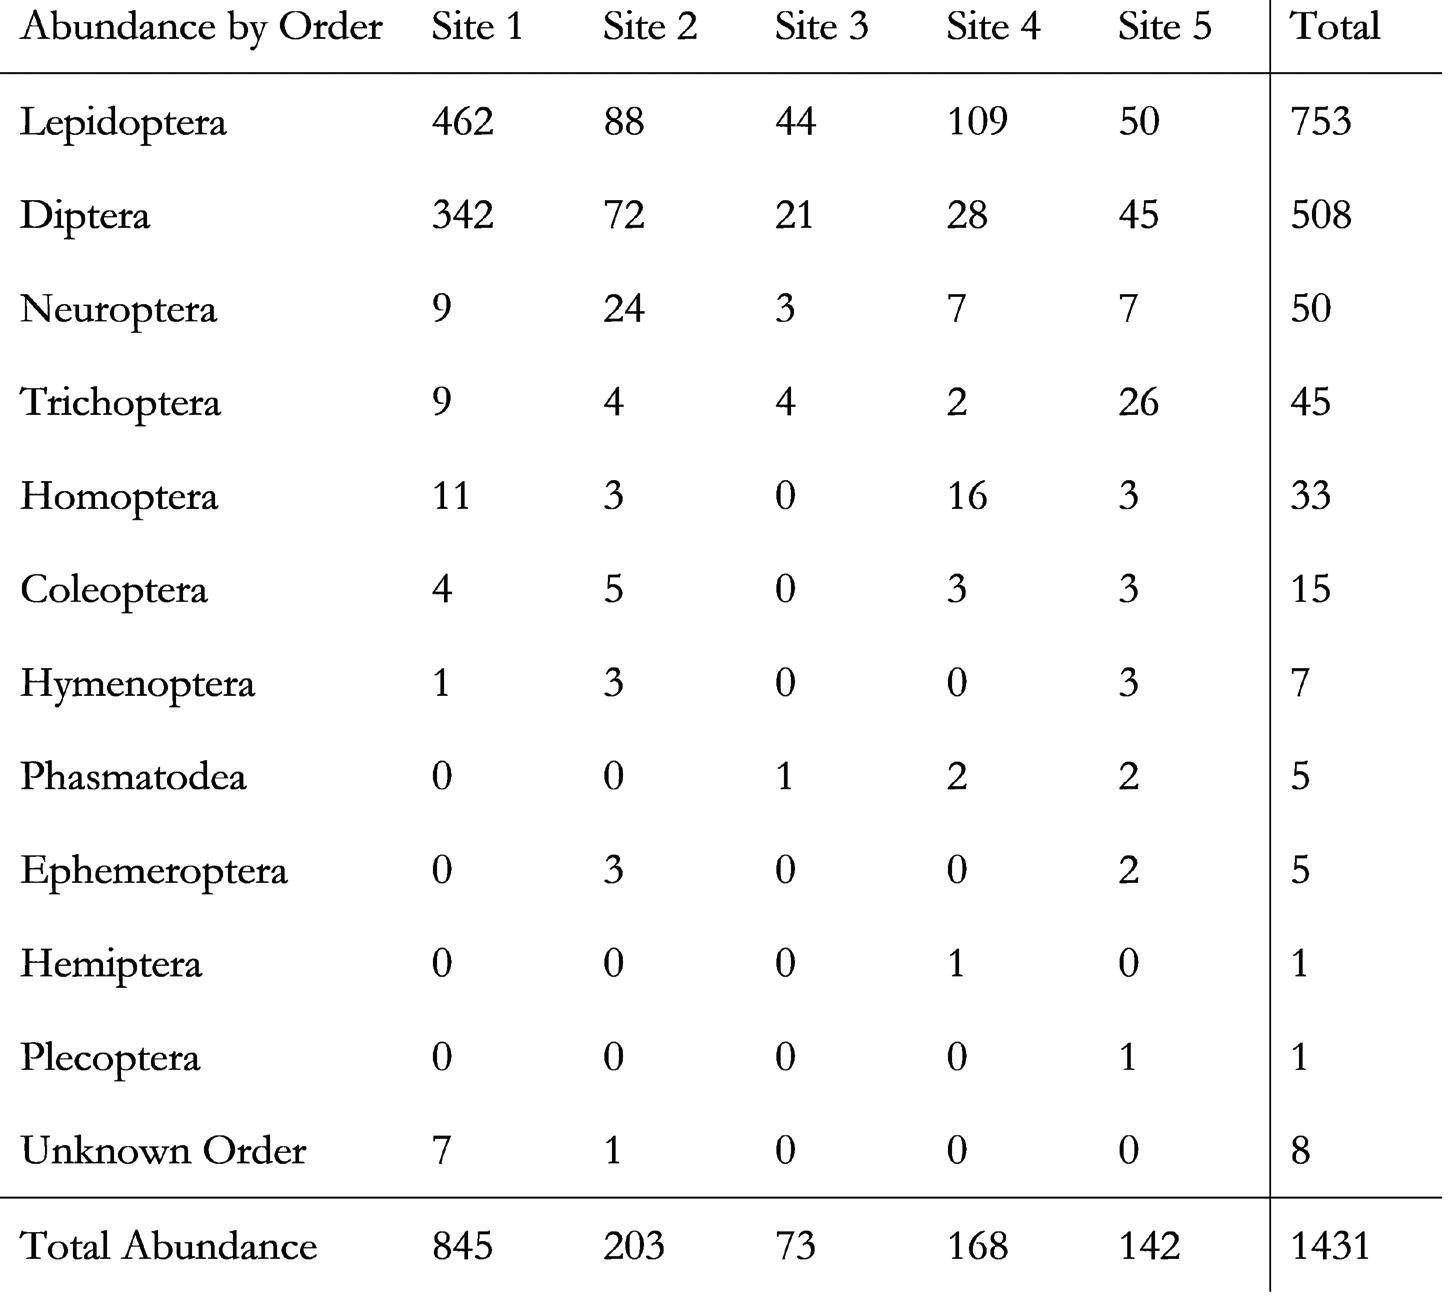
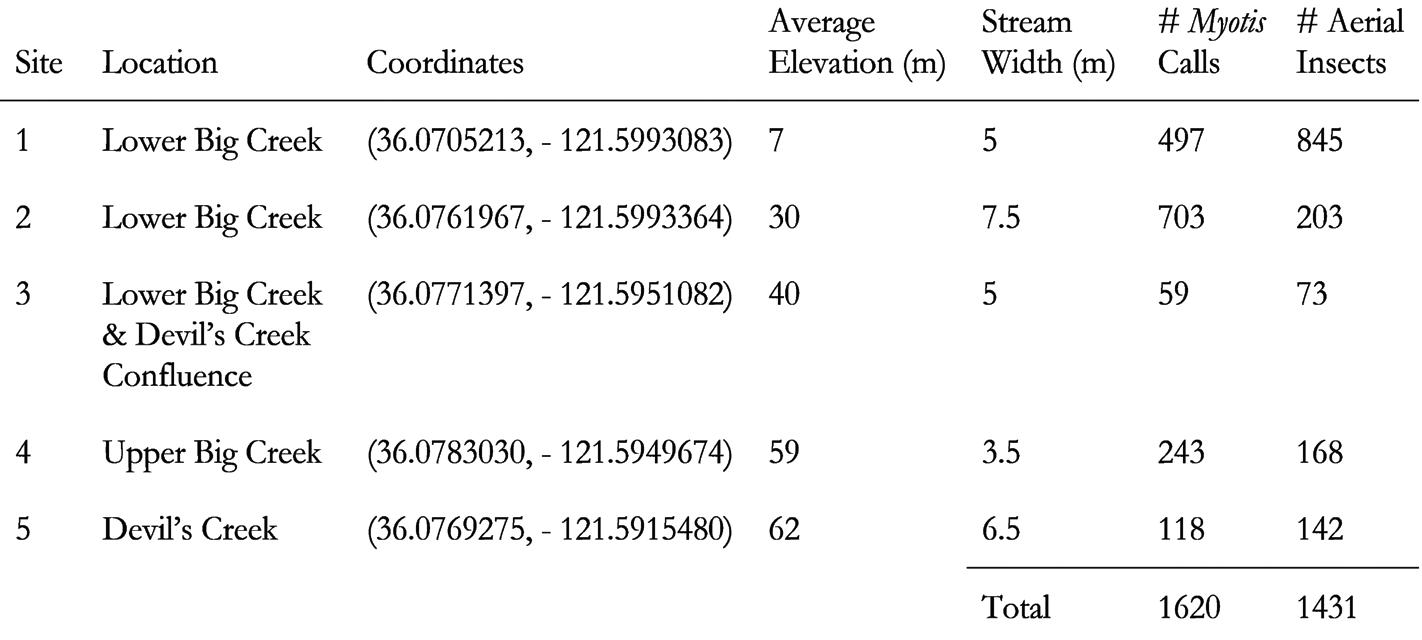
We recorded a total of 1,639 bat calls over the course of our study. The Echo Meter Touch 2 Bat Detector application identified 812 of the recorded calls to the species level. Approximately 80% of the automatically-identified 812 calls belonged to M. yumanensis and 15% belonged to M. californicus. Two belonged to western small-footed myotises (Myotis ciliolabrum), and one be- longed to M. volans. To identify recorded calls that were not identified by the application, we manually compared the recorded spectrograms to known Myotis spectrograms. In total, we identified 1,620 Myotis spp. calls, though due to the similarity of calls within the Myotis genus, we were not able to identify all of the calls to the species level. Stream width varied from 3.5 m to 7.5 m (Table 1). We found 1,431 insects, with approximately 53% from order Lepidoptera, 36% from order Diptera, 4% from order Neuroptera, 3% from order Trichoptera, and the remaining 4% composed of small numbers from orders Homoptera, Coleoptera, Hymenoptera, Phasmatodea, Ephemeroptera, Hemiptera, and Plecoptera (Table 2).
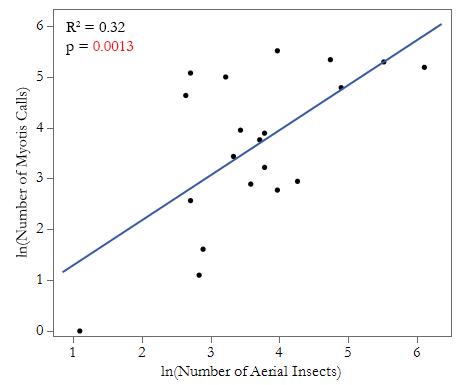
Figure 2. Myotis call abundance increases with aerial insect abundance. Five creek sites were surveyed along Big Creek and Devil’s Creek in LandelsHill Big Creek Reserve, Big Sur, CA, USA. Data on flying insect abundance and Myotis bat call abundance was recorded in half-hour chunks over 5 nights in summer 2022, with one sampling period per site. A linear regression was used to analyze the effect of the number of aerial insects on the number of Myotis calls, with time as a random effect. Myotis call abundance increased with the abundance of aerial insects collected (N = 20, R2 = 0.32, p = 0.0013).
We found that the number of Myotis calls increased with the number of observed aerial insects. Myotis calls in a half-hour period were most strongly correlated with the overall abundance of aerial insects found in the same period (N = 20, R2 = 0.32, p = 0.0013; Fig. 2). When analyzed in relation to specific orders, calls were correlated with absolute dipteran abundance (N = 20, R2 = 0.16, p = 0.0064; Fig. 3a) but only marginally and not significantly correlated with absolute lepidopteran abundance (N = 20, R2 = 0.14, p = 0.076; Fig. 3b). Specifically, there is a marginal difference between sites regarding the number of Myotis calls (N = 20, F = 2.76, p = 0.067; Fig. 4a) and number of aerial insects (N = 20, F = 2.49, p = 0.088; Fig. 4b) per site. Insects from the other orders we examined were far less abundant than lepidopterans and dipterans, so there was insufficient data to reliably determine any correlation with Myotis calls. While it is not statistically significant, there is a marginal difference between sites regarding the number of Myotis calls (N = 20, F = 2.76, p = 0.067; Fig. 4a) and number of aerial insects (N = 20, F = 2.49, p = 0.088; Fig. 4b) per site. We did not find any relationship between stream width and the total abundance of aerial insects at each site (N = 5, R2 = 0.18, p = 0.57) or between stream width and the total abundance of Myotis calls (N = 5, R2 = 0.21, p = 0.44).
Figure 3. Myotis call abundance and specified insect orders. (a) Myotis call abundance increases with dipteran abundance. Five creek sites were surveyed along Big Creek and Devil’s Creek in Landels-Hill Big Creek Reserve, Big Sur, CA, USA. Data on dipteran abundance and Myotis call abundance was recorded in half-hour chunks over 5 nights in summer 2022, with one sampling period per site. A linear regression was run to test the effect of the number of dipterans on the number of Myotis calls, with time as a random effect. Myotis call abundance increased with the abundance of dipterans collected (N = 20, R2 = 0.16, p = 0.0064). (b) Myotis call abundance marginally increases with lepidopteran abundance. Five creek sites were surveyed along Big Creek and Devil’s Creek in Landels-Hill Big Creek Reserve, Big Sur, CA, USA. Data on lepidopteran abundance and Myotis call abundance was recorded in half-hour chunks over 5 nights in summer 2022, with one sampling period per site. A linear regression was run to test the effect of the number of lepidopterans on the number of Myotis calls, with time as a random effect. Myotis call abundance marginally increased with the abundance of lepidopterans collected (N = 20, R2 = 0.14, p = 0.076), but the effect was not statistically significant.
2022, with one sampling period per site. A one-way ANOVA was run to test the effect of site on the number of Myotis calls using the natural log of the number of calls. There is a marginal difference between sites for Myotis call abundance (N = 20, F = 2.76, p = 0.067) but not statistically significant. (b) Aerial insect abundance at each site. Five creek sites were surveyed along Big Creek and Devil’s Creek in Landels-Hill Big Creek Reserve, Big Sur, CA, USA. Data on aerial insect abundance was recorded in half-hour chunks over 5 nights in summer 2022, with one sampling period per site. A one-way ANOVA was run to test the effect of site on the number of aerial insects collected using the natural log of the number insects. There is a marginal difference between sites for aerial insect abundance (N = 20, F = 2.49, p = 0.088) but not statistically significant.
Discussion
Overall, we found that Myotis call abundance increased with total aerial insect abundance, which was consistent with our hypothesis (Fig. 2). We found a marginal difference between sites for both Myotis call abundance and total aerial insect abundance (Fig. 4). However, in contrast to our predictions, we did not find a correlation between the size of the stream and Myotis call abundance.
Our results suggest that summertime Myotis habitat use may be driven more by availability of prey rather than by habitat physical characteristics. Stream width did not affect Myotis call abundance, despite previous studies indicating that they prefer open areas.10 This could be due to the stream width differences not being large enough between sites, or other site factors affecting bat abundance more than stream width (Table 1). Bats preferentially foraging in areas of larger prey abundance is supported by a previous study which found that bats were capable of tracking insect hatches over tens of kilometers.10 The marginal differences among sites in Myotis call and aerial insect abundance suggest that a site-level factor other than stream width could potentially affect where M. yumanensis and insects can be found. However, because we did not find statistical significance for call abundance and insect abundance overall across sites, more data would need to be collected to determine which site-level characteristics, if any, are important in determining bat habitat use. These characteristics could include nearby tree species, proximity to bat roosts, or stream flow rate, which could all impact either the insect community composition or the number of bats able to easily access the site.
Previous studies on bats suggest differences in abundance could also be due to variable environmental factors during the study, such as temperature, wind speed, and air pressure.18 For example, insect abundances for Site 3 were low in comparison to other sites (Table 2). This may have been the result of an abnormally cold, humid, or windy night, which were not controlled for in the study. Gathering data at multiple sites on the same day, or several times over the course of a longer time scale would better indicate year-round habitat use. Recording more site-level variables, such as temperature, wind speed, and air pressure could also lead to a better understanding of the habitat characteristics that affect M. yumanensis habitat use.
Our results also showed that the relationship between insect Myotis bat calls and the abundance of insects varied based on the orders of the insects (Fig. 3). Specifically, there was a significant correlation between bat calls and dipteran abundance, but not between bat calls and lepidopteran abundance, despite a higher abundance of lepidopterans overall. This may indicate a dietary preference for dipterans over lepidopterans. However, this trend may have been created by our sampling methods, as our insect collection was based only on aerial insects that were attracted to white and/or UV light (Table 2). Previous studies have used emer- traps to track aquatic insects emerging from streams in addition to aerial insects.19 Expanding this study to include these methods may provide a more accurate representation of riparian insect communities.
While we found the presence of M. yumanensis to be most associated with dipterans in our study (Fig. 3a), it is also possible that there are shifts in dietary preferences throughout the year depending on seasonal availability of prey. Insect swarm composition varies over time due to differences in hatching times, resulting in temporal changes in the insects present in a given area over time.10 Furthermore, species composition and population abundances of bats are not static due to migration and hibernation.20
Since our observations were limited to the summer season and abundances of bats and insects can change seasonally, future studies should encompass larger time scales across multiple seasons. Additionally, expanding this study to include more sites across a larger area would more accurately capture overall foraging behavior. Individual bats are capable of traveling large distances, so variation between two sites that are relatively far apart could factor into bat abundance at those sites.14
The passive acoustic monitoring methods used in this study are a practical way to assess bat abundance, but more direct methods may be more accurate in determining abundance and identifying specific bat species.21 Studies that seek more direct methods could employ mist nets for capturing and identifying bats. They could also employ pellet analysis to provide a more accurate measure of dietary preferences. It should be noted that the Echo Meter Touch Bat Detector application’s automatic species identification software is known to have some error, such as misidentifying species. While it indicated that 80% of the automatically identified bat echolocation calls were from the species M. yumanensis there were 825 calls out of 1,639 that it was not able to identify to a species level. Many of these (a total of 1,620) were manually identified. A more accurate species assessment would indicate whether our results may be applicable to Yuma myotis specifically or to Myotis spp. in general.
Conclusion
Since Myotis bat calls and insect abundance are correlated, insect populations may provide an indirect way to measure which areas bats are more likely to forage in. Knowing where populations of bats are likely to forage helps prioritizing areas for bat conservation, such as riverine areas with rich insect communities that provide plenty of prey for foraging bats. The correlation between bats and their insect prey could also be used to target specific areas to directly monitor the bat population. Due to the difficulty in monitoring bat populations, developing more effective and efficient methods for conducting population surveys can assist in land management decision-making and conservation. This is increasingly relevant as anthropogenic activities and disease put growing stress on bat populations.
Data provided by this study and future studies could aid in creating improved bat population predictive occurrence models to be specifically based on insect abundance. This data could also help reduce the cost of more direct bat surveys by identifying likely sites of bat foraging. Doing so is necessary to monitor bat populations’ response to various threats. Bats are integral components of many ecosystems that provide humans with valuable ecosystem services such as pest management in agricultural areas and consumption of insects that are potential disease vectors. Despite their ecological value, there is limited research on bat populations, and thus, there continues to be a need for improved monitoring and assessment of bat populations.
Acknowledgements
This work was performed at the University of California Natural Reserve System Landels-Hill Big Creek Reserve.
Special acknowledgements to course professors Timothy Miller and Renske Kirchholtes, teaching assistant Amy Van Scoyoc, and course assistants Athena Lynch and Maria Carias.
References
[1] Boyles, J.G., Cryan, P.M., McCracken, G.F., and Kunz, T.H.. Economic Importance of Bats in Agriculture. Science 332, 41–42 (2011).
[2] Reiskind, M.H., and Wund, M.A.. Experimental Assessment of the Impacts of Northern LongEared Bats on Ovipositing Culex (Diptera:Culicidae) Mosquitoes. Journal of Medical Entomology 46, 1037–1044 (2009).
[3] Frick, W.F., Kingston, T., and Flanders, J.. A review of the major threats and challenges to global bat conservation. Annals of the New York Academy of Sciences 1469, 5–25 (2020).
[4] Ingersoll, T.E., Sewall, B.T., and Amelon, S.K.. Improved Analysis of Long-Term Monitoring Data Demonstrates Marked Regional Declines of Bat Populations in the Eastern United States. PLoS One, 8(6) (2013).
[5] Duff, A.A., and Morrell, T.E.. Predictive Occur- rence Models for Bat Species in California. Journal of Wildlife Management 71, 693–700 (2007).
[6] Fenton, M.B., and Bogdanowicz, W.. Relationships between external morphology and foraging behaviour: bats in the genus Myotis Canadian Journal of Zoology 80, 1004–1013 (2002).
[7] Burt, W.H., and Grossenheider, R.P.. A Field Guide to the Mammals - North America north of Mexico. Third edition. Boston, New York, Houghton Mifflin Company (1980).
[8] Gunnel, G.F., Smith, R., and Smith, T.. 33 million year old Myotis (Chiroptera, Vespertilionidae) and the rapid global radiation of modern bats. PLOS ONE 12(3), (2017).
[9] Gannon, W.L., and Sherwin, R.E. “Are Acoustic Detectors a ‘Silver Bullet’ for Assessing Habitat Use by Bats?” Brigham, M., Kalko, E., Jones, G., Parsons, S., and Limpens, H., editors. Bat echolocation research: tools, techniques and analysis. Bat Conservation International, 175 (2002).
[10] Brigham, R.M., Aldridge, H.D.J.N., and Mackey, R.L.. Variation in Habitat Use and Prey Selection by Yuma Bats, Myotis yumanensis. Journal of Mammalogy 73, 640–645 (1992).
[11] UCNRS. Landels-Hill Big Creek Reserve. Last modified July 22, 2015. Accessed 2022, August 7.
[12] Potyondy, J.P., and Geier, T.W.. Watershed Condition Classification Technical Guide. United States Department of Agriculture Forest Service (2011).
[13] UCSC. Landels-Hill Big Creek Reserve: Big Creek Mammal List. Last modified 2020. Accessed 2022, August 7.
[14] Falxa, G.A. Rethinking Yuma Bat and Little Brown Bat Foraging Endurance. Cascadia Research Collective, 3 (2004).
[15] Rundio, D.E., and Lindley, S.T.. Reciprocal fluxes of stream and riparian invertebrates in a coastal California basin with Mediterranean climate. Ecological Research 27, 539–550 (2012).
[16] Szewczak, J.. Echolocation Call Characteristics of California Bats. Humboldt State University Bat Lab (2018).
[17] Borror, D.J. and White, R.E.. A Field Guide to the Insects - America north of Mexico. Second edition. Boston, New York, Houghton Mifflin Company (1998).
[18] Gorman, K.M., Barr, E.L., Ries, L., Nocera, T., and Ford, W.M.. Bat activity patterns relative to temporal and weather effects in a temperate coastal environment. Global Ecology and Conservation 30, e01769 (2021).
[19] Rainey, W., Mary, P., and Sandra, C.. Temporal and spatial variation in aquatic insect emergence and bat activity in a restored floodplain wetland. CALFED, 54 (2006).
[20] Kuenzi, A.J., and Morrison, M.L.. Temporal Patterns of Bat Activity in Southern Arizona. The Journal of Wildlife Management 67, 52–64 (2003).
[21] Szewczak, J.M.. “Advanced analysis techniques for identifying bat species.” Brigham, M., Kalko, E., Jones, G., Parsons, S., and Limpens, H., editors. Bat echolocation research: tools, techniques and analysis. Bat Conservation International, 175 (2002).


