
ANNUAL REPORT 20 22


After the passing of Roland J. George, Sarah George approached Stetson University determined to bring her late husband’s dream to life. Roland, who had suffered vast investment failures of his own in the market crash of 1929, insisted the truest way to learn the principles of investing was to learn by doing. He embraced failures and mistakes as a critical part of the learning process. Theory and principle are important in an investor’s learning path, but nothing can replace practical learning experiences. The Georges envisioned a program in which students would not only have the traditional classroom experience, but also be given the opportunity to manage a real portfolio – purchasing and selling securities, constantly monitoring the portfolio, and enduring the pressures of generating sufficient income to pay for the program’s expenses.

During his lifetime, Roland endeavored to spread these ideas but was unable to find a sponsor in the academic community for such a program. Offers on his part to assist in creating and financing a “practical” investments course went unaccepted. However, on Aug. 20, 1980, Sarah George transferred assets valuing just under $500,000 to Stetson, accompanied by contributions from President Pope Duncan, Dean David Nylen, H. Douglas Lee and Professor Kenneth Jackson. Then came a memorandum stating the terms of the new Roland George Investments Program (RGIP), which the school was committed to bring to life for the approaching spring semester.
Carter Randall, a noted lecturer, writer and panelist on PBS’s “Wall Street Week,” was selected as the first Distinguished Visiting Professor. Randall proved to be instrumental to the program, as his efforts as lecturer, advisor and fund consultant established the ambitious standards RGIP holds itself to today.
From 1982 to 1987, Gerald T. Kennedy assumed this position and introduced the use of computers to scan stocks meeting criteria derived from student research. Students advanced their research methods through the introduction of services such as Value Line and Dow Jones News Retrieval, in conjunction

MAKING ROLAND GEORGE’S DREAM A REALITY THAT HAS THRIVED FOR 40 YEARS.
with data sources such as Zack’s Icarus Services and the O’Neil Reports.
Sarah George passed away in 1988, and in her will she left a gift of $3.6 million to establish the Roland and Sarah George Investments Institute, where the Roland George Investments Program (RGIP) was born. The Institute provides support for investment education at Stetson to bring investment professionals and academic theorists together, and helps provide access to research in investments for the School of Business Administration faculty. The Stetson community greatly appreciates Sarah George’s generosity and vision for investment education. The George endowment has also allowed RGIP to have a full-time resident professor with applied experience.
The RGIP further progressed through its division into a twosemester course. During the first semester, emphasis lies on the Growth Fund and equity management techniques. The following semester, focus shifts to managing the Income Fund, which includes bonds and other income-generating securities. Although students monitor both portfolios year-round, this structure allows for students to concentrate their efforts in specific areas of investments throughout the year.
Max Zavanelli was selected as the first Roland George Distinguished Visiting Professor of Applied Investments. Since
then, Ned Schmidt, Frank Castle and K.C. Ma have served as visiting professors, with David Mascio currently holding this position. These individuals were selected because they applied investment experience and the enthusiasm to effectively convey this knowledge to the students in the program. Their efforts have helped materialize Mr. and Mrs. George’s dream of developing the RGIP into a first-rate organization for applied investment research and investment education.
The RGIP is unique in its concept and design, giving Stetson business students the opportunity to simultaneously learn the theory behind portfolio management and put that learning into practice with a lot more than test grades at stake. While many universities offer courses using computer-simulated programs with “play” money, RGIP students are trusted to invest more than $5 million.
Roland George believed the best way to prepare for a career in investments was through participation in actual investment decisions under the supervision of experienced investment managers. His dream is now a reality, as the program has thrived for the past 40 years and has fundamentally changed the way Stetson University teaches investments.

Anna-Rose
Alemayehu
ANALYST
Austin Amaral
ANALYST
Kyle Benedict
INVESTMENT COMMITTEE MEMBER
Mike Cooke
INVESTMENT COMMITTEE MEMBER
Matthew Cooper
UTILITIES
Ashley Delezenne

ANALYST Elena Djokovic
CONSUMER STAPLES
Owen Fitzgerald
ANALYST
Georgia Goering
ANALYST
Jonathan Gonzales


ANALYST
Braden Hill


INFORMATION
TECHNOLOGY
Alexandre Hillhouse ANALYST


Christopher Kent
CHIEF INVESTMENT OFFICER

Benjamin Maura
ALUMNI RELATIONS OFFICER


Max McCullough
RISK & COMPLIANCE OFFICER
Enzo Oliva
LEAD QUANT ANALYST
Jadyn Prinz


ANALYST
Samuel Rafferty
VALUE PM
Lindsey Richmond
CONSUMER DISCRETIONARY
Sugeeth Sathish
HEALTH CARE
Devin Shaffer

FINANCIALS
Vishal Sharma

FIXED INCOME PM
Alec
Small
REAL ESTATE
Cameron Spence
INDUSTRIALS
Alonso Tang
COMMUNICATION SERVICES

Isabella Thomsen

MATERIALS
Jose Valcourt III


ENERGY
Giovanni Valentine
ANALYST
Michael Wojciechowski


GROWTH PM
Rachel Zaremba
ANALYST

in our Value portfolio. The Bloomberg Aggregate Bond Index was down -12.30% for the year, compared to our Fixed Income portfolio being only down -5.21%. The student investment committee showed tremendous leadership, prudence and care in safeguarding the RGIP portfolio, and the results show that their skill was commensurate with top-performing, seasoned Wall Street veterans.
Matthew Hurst DIRECTORLooking back on 2022, the word that comes to mind is “tumultuous.” A few days into January 2022, the S&P 500 hit an all-time high before finishing the year down -19.44% in December. Experts will ascribe many causes to the lackluster performance, including but not limited to: fears of recession, persistent inflation, supply chain constraints, unprecedented rate hikes by the Federal Reserve, prolonged conflict in Ukraine, and a massive shift from Growth-oriented stocks to Value. The aforementioned challenges make what the Roland George Investments Program did in 2022 all the more impressive.
On the surface, judged by our absolute return, 2022 was a tough year. The combined portfolio value fell from over $5.7M to less than $5M. However, on a relative basis, we outperformed across all asset classes. The annual return for the Russell 1000 Growth Index, the benchmark for our growth portfolio, was down -29.26% in 2022, compared to our Growth Portfolio, which was down only -15.06%. Similarly, the Russell 1000 Value Index was down -7.72%, compared to a gain of 2.66%

The successes of the Roland George Investments Program did not stop at fund performance. The CFA Research Competition made it to the Regional Finals for the second year in a row. The teams’ monumental achievement of making it to the final 10 in the world showcases their tremendous effort and dedication. In 2022 the Roland George Investments Program placed first and second in the Fixed Income and Value Fund strategies at the Quinnipiac G.A.M.E. annual performance competition, although the performance was based on 2021 fund performance.
During calendar year 2022 the Roland George Investments Program moved to a new state-of-the-art lab, funded entirely by the program’s past performance. The need for a new lab was in part due to aging technology in the lab that had housed the program for more than a decade, but it was also to accommodate more students in the RGIP. The Program has expanded to a multi-year experience that now includes Advanced Portfolio Management courses (FINA 450/451). In 2022 we had 36 students participating in RGIP compared to past averages in the low 20’s. As part of the program expansion, the senior-level students have taken on expanded mentoring roles to the incoming junior analysts and have created a Friday recitation to improve the quality of the student research.
a handful of stocks. The RGIP typically does not hold ETFs and traditionally eschews holding glamour stocks. However, this was one year where passive or naïve diversification outperformed our active management strategies. The primary reason for our underperformance can be attributed to the asset allocation decision. Diving deeper into our asset class holdings, we barely missed the performance of large cap stocks while maintaining a significantly lower beta, and our small-cap stock holdings drastically outperformed, which indicates superior security selection. One area where we made Emerging
The student investment committee showed tremendous leadership, prudence and care in safeguarding the RGIP portfolio, and the results show that their skill was commensurate with top-performing, seasoned Wall Street veterans.”

Probably the most disturbing aspect of this unprecedented increase was the fact that throughout 2021 Jerome Powell (Head of the Federal Reserve) and Janet Yellen (Head of the U.S. Treasury Department) stated that inflation was simply “Transitory,” resulting in no decisive action by the FOMC throughout the year. Of course, this outlook proved wrong, and by the middle of 2022 inflation increased to 9.05% at a 40-year high. Only after the Federal Reserve Bank raised the overnight lending rate from 0.05% at the end of 2021 to 4.5% at year-end 2022 has inflation cooled to 6.5%.

The financial markets in 2022 can be characterized by extreme volatility caused by interest rate uncertainties surrounding a rapid increase in inflation. The S&P 500 Index registered one of its worst years of performance since the financial crisis of 2008-2009. Adding to investor’s dismal portfolio returns was the double-digit losses of fixed income securities. The real question that remains unanswered is: “Is the worst yet to come in 2023?”
The S&P 500 Index registered one of its worst years of performance since the financial crisis. This broad gauge of the most well-known companies in the world was negative by -19.4% in 2022. The main culprit was investor’s uncertainty over future interest rate increases. Surprisingly, earnings of these 500 companies, collectively, were only down 4% year over year. Most of the weakness came from the technology sector and economically sensitive industries. The only real bright spot within the index was the performance of the Energy sector, which was up 52.5% for the year.
At the end of 2020, the annual inflation rate measured by the consumer price index (CPI) was at 1.36% under the Federal Reserve’s target rate of 2.0%. After significant expansion of the money supply by the Federal Reserve, massive increases in fiscal spending by the United States Congress, and a change in the United States Energy Policy, the annual CPI rate at the end of 2021 increased nearly 650% to 7.03%.
For the first time in nearly 40 years, fixed income investments were down almost -12.3% in 2022. The losses sustained during this period have caused a great deal of turmoil for traditional investment allocations among high-net-worth individuals, pension plans and endowments. In addition, the so-called 60/40 stock-to-bond portfolio allocation was down in some cases over 20% in 2022. Not only were traditional portfolio allocations damaged, but financial institutions and banks have negative book values if their fixed income holdings are marketto-market. This alone could cause tremendous stress on the global financial system in the near future. The main cause of this dislocation is the rapid increase in short-term interest rates by the Federal Reserve over the last several months.
The financial markets will continue to be under tremendous pressure caused by the rapid increase in interest rates in
2022. The economy continues to operate in a negative real interest rate environment. With the CPI still north of 6.5% and the Federal Funds rate at 4.5%, the overall cost of money is generally accommodative. Until the inflationary environment is firmly under control, the cost of debt will continue to increase.

The “canary in the coal mine” could be within the banking sector based on its unstable financial positions. Moreover, as potential foreclosures increase within the commercial real estate market, this could result in a global financial crisis that will far exceed the depths of the 2008-2009 housing collapse.
There are some positives going into 2023. Corporate earnings remain resilient, and consumers still have plenty of liquidity and purchasing power. Jobs continue to be plentiful as wage pressures continue to ease. Though, given these positives, the overall risk environment will remain negative for the next 12-18 months. The only way equity and credit investment strategies end 2023 in positive territory is if inflation decreases to an annual rate near 3% by the end of the year. This could be the most elusive target for the Federal Reserve to endure for some time to come.
At the end of 2022, the economic environment within the U.S. can be characterized by widespread uncertainty.
As potential foreclosures increase within the commercial real estate market, this could result in a global financial crisis that will far exceed the depths of the 2008-2009 housing collapse.”

In 2022, the world gave the financial markets a lot to process. Shortly after rebounding from an optimistic post-COVID recovery, inflation, swift interest rate hikes, and a persistent threat of recession tested our markets’ resilience during a year of a continuing global pandemic, supply chain disruptions, and significant geopolitical unrest. Despite these economic challenges, RGIP has succeeded in both portfolio performance and academic achievement. We have learned that confident prognostications about the future are likely to be undermined by unforeseen circumstances.
CHRISTOPHER KENT CHIEF INVESTMENT OFFICER

As the rapid acceleration of inflation moved from transitory to persistent, the U.S. experienced the highest price increases in four decades. Russia’s invasion of Ukraine in February brought uncertainty about political stability, and supply shortages of, and sanctions on, Russian oil and natural gas added fuel to the already smoldering inflation fire. The bear flattening that resulted in the largest yield curve inversion in recent history sent alarming signals to investors that the markets were becoming increasingly concerned about the brisk pace of inflation and looming possibility of a recession. Central banks around the world responded quickly by altering their monetary policy, moving from record low interest rates of the pandemic era to steady increases in rates at the fastest pace since the 1980s.
As inflation became the prominent macroeconomic story, the Federal Reserve responded by pursuing a series of seven interest rate increases to combat rising prices and tame inflation. The midterm elections in the United States and significant social movements augmented brewing unrest. The collapse of FTX rippled through the cryptocurrency market, tampering investors’ trust and questioned the regulation of digital assets. Finally, small- and large-cap stocks suffered with negative returns from the heightened volatility and yearlong uncertainty. This unprecedented course of events and market behavior provided a challenging environment from which to learn investment fundamentals. By capitalizing on heightened volatility and market inefficiency, RGIP’s ability to ensure the preservation of capital was in full effect. Despite the challenging economic backdrop, the program acted in an expeditious manner, decreasing exposure to volatile asset classes and strategically overweighting securities with strong
I firmly believe that the program has extended the handson experience that Mr. and Mrs. Roland and Sarah George once envisioned - it has become a community, bringing like-minded and highly motivated individuals together.”
balance sheets, significant cash flow generation, and priced at attractive multiples. By strategically shifting our tactical asset allocation to capitalize on higher energy prices, value-oriented sectors, and frontloading the short end of the yield curve while minimizing our systematic risk to cyclical industries, the Growth and Value Portfolio’s outperformed 14.2% and 7.9%, respectively, and the Fixed Income outperformed 7.1% in a year when bonds posted their worst annual returns in decades.
The macroeconomic landscape also served as an opportunity to analyze and assess the boundaries of global markets. The reversal of the market’s gaze from growth- to valueoriented securities, stemming from the end of a decadeslong environment of record low interest rates, provided a “valuation reset,” evidenced by the decline of the S&P’s P/E multiple, from 21.4x at the beginning of the year to 17.6x by year’s end. Conflicting economic releases, including recordlow unemployment and increased job openings combined with an inverted yield curve and negative real GDP growth, necessitated in-depth discussions about the future state of the economy. Unpacking the multitude of macroeconomic and microeconomic implications seen throughout the fiscal year presented an invaluable learning opportunity that emphasized the Program core mission: providing students with real-world exposure through a hands-on experience. Given the blended curriculum structure, our analysts were able to learn in an aberrant macroeconomic environment by analyzing a plethora of asset classes and financial markets.
Since its inception, the program has offered students an invaluable learning experience in a hands-on environment managing a real portfolio of $5.5 million, and the opportunity to gain quantitative and qualitative investment-related skills and applications. Recent structural and operational changes to the program have created even more opportunities to develop analytical skills of security research and continue the Program mentorship, evidenced by our successes in and out of the classroom. Our students placed top 16 in the world for the CFA Institute Research Challenge, the farthest in program history, passed the CFA Level I exam, and placed 1st and 2nd in the GAME Global Portfolio Competition for our Fixed Income and Value Portfolios, respectively. Furthermore, our prolific alumni network has allowed us the opportunities to gain
valuable contacts in the industry, leading to positions at buyand sell-side investment firms and multinational corporations. We look forward to developing our student-alumni network and thank those who have served and shaped the program to the level of prestige it carries today.
In the past year, I have had the privilege and honor of sharing in the program tremendous impact in learning, faculty and student mentorship, and fellowship. The cohort structure, with analysts and a student-led investment committee, permits a collaborative environment for like-minded, ambitious individuals to create relationships that last a lifetime. Serving as the Chief Investment Officer has certainly been the pinnacle of my academic career, and something that I will regard as a cornerstone of my professional and personal life.
In closing, I firmly believe the program has extended the hands-on experience that Mr. Roland George once envisioned – it has become a community, bringing like-minded and highly motivated individuals together. The resiliency of our analysts and the steadfast guidance of our investment committee has endured in an environment of uncertainty. Concluding a year of immense challenges and successes, our gratitude is owed to the pedagogy and leadership of Drs. Matthew Hurst and David Mascio, who have allowed the program to thrive. As we move forward, I am confident the valuable lessons and experiences gained from this program will continue to inspire us to strive towards excellence, both in our professional and personal lives.

GROWTH VALUE


 GROWTH PORTFOLIO MANAGER
• Provide an invaluable learning opportunity for the student analysis
• Maximize return within the 12-month period
• Growth Portfolio cannot encapsulate more than 65% of total RGIP funds
• Sector allocation cannot exceed 150% of target benchmark
• Weighting of individual securities are limited to 5% of overall portfolio
• Prohibited from investing in securities that have held an Initial Public Offering in the previous six months
• Maintain an average beta of 1+/- 0.2
Eventful. That would be the most fitting word when describing financial markets in 2022. Characterized by significant volatility, global equity markets faced challenges such as supply chain constraints, geopolitical tensions, and uncertainties around inflation and interest rates. For the first time in decades, record inflation took hold as surplus liquidity and loose monetary policy resulted in demand pull inflation and record readings of the Consumer Price Index. The Federal Reserve raised rates at an unprecedented pace, aiming to offset inflationary pressures, resulting in increased financial market volatility in growth stocks reliant on cheap capital. Markets started 2022 on a high note with the S&P 500 coming off an alltime high of $4,766 in late 2021. This was not to last, as several major macroeconomic events, including the Russian invasion of Ukraine, sparked widespread selloffs in broader financial markets with major indices at one point entering technical bear market drew-down levels. Through all of this, the RGIP Growth Portfolio stood tall among long-only equity, especially growth-based funds.
The growth portfolio outperformed most major equity indices in 2022, beating the Russell 1000 Growth by 14.20%, and the Wilshire 5000 total market index by 4% in 2022. This outperformance was also seen on a risk-adjusted basis, with a Sharpe-ratio of -0.66 for the RGIP Growth Portfolio, compared with -0.71 and -0.73 for the RGIP Value, S&P500 and Wilshire 5000. This can largely be attributed to a conservative asset allocation with a main focal point of being underweight information technology stocks. Security selection also played an important role as a shift to companies with high growth potential as well as a strong balance sheet were selected over more speculative investments. Our analysts have taken great pride in pitching stocks that have strong resilience to macroeconomic headwinds, and the results show it. Another key focus within our portfolio in 2022 included rotating to selected sectors where equities in our growth portfolio have shown relative strength. This included consumer discretionary, lead by Top Build and Topgolf Callaway Brands, and Materials led by James Hardie. These are traditionally cyclical sectors, but they have shown resilience in our portfolio due to their economic moat and irrepressible consumer base even in times of economic duress. In large part this ability to pivot our asset allocation effectively is enabled by the quality of the underlying investments in our portfolio. The current analyst class has done an exceptional job under extremely volatile and unprecedented conditions, adapting their research methodology to fit the current macroeconomic environment, as well as our investment objectives.
Financial markets are projected to be volatile for the foreseeable future with selloffs in growth stocks resulting from the Federal Reserve tightening the overnight lending rate to stunt inflation. Consumer spending and sentiment, however, remains strong, putting leaders of fiscal and monetary policy in a tricky position to manage demand pull inflation. We predict that the deterioration of macroeconomic conditions is expected to hit service and tech-related firms much harder than businesses that produce tangible products in sectors such as manufacturing or industrials.
Deglobalization pressures and shifting demographics are also expected to change the current world economic order, resulting in the expansion of industry in North America. However, this does represent a substantial opportunity in growth-related sectors as companies with strong balance sheets and revenue will ultimately be better positioned relative to their peers, who do not possess such characteristics.
Currently the macroeconomic spotlight for 2023 remains on the Federal Reserve. Mainly, will it continue the Federal Reserve remain hawkish on inflation? And secondly, will it be the Federal Reserve able to pull off a “soft landing.” The possibility of a soft landing is diminishing with time as some macroeconomic indicators flash warning signals. One of the most pressing warning signals is the bond market with it 2-10-year spread being the most inverted it has ever been. These moves in rates have already begun to result in ripple effects across the market and will continue to affect access to capital for growth-oriented companies in the short-medium-term futures.
We look to capitalize on companies with high growth prospects which also possess strong fundamentals and competitive advantages, specifically in these sectors. We aim to continue to provide outsized returns on a risk adjusted basis resulting from both security selection and tactical asset allocation, and look to shield our portfolio from macroeconomic and geopolitical risks while capitalizing on stocks which show substantial growth potential.

For the time being, we expect our current allocation to remain relatively conservative, using free capital to jump on opportunities that may present themselves in the market.


• Provide an invaluable learning opportunity for student analysts

• Invest in high-quality and yielding equities to boost the return profile of the value-orientated strategy
• Sector allocation cannot exceed 150% of the benchmark
• Entire portfolio may not exceed 65% of the portfolio in conjunction with the fixed-income portfolio
• Up to 2% of the portfolio may be used for hedging purposes
• Avoid Funds and ETFs except when using as temporary placeholders to maintain weighting
• Prohibited from investing in securities that have filed for IPO within the last six months
• Maintain portfolio beta of 1 +/- .02
• Single security purchases may not exceed 5% of the portfolio
The equities market in 2022 faced challenges with increasing resistance, as the initial rebound from the COVID-19 pandemic led to a 1.51%, 22.49%, and 3.07% decrease in the S&P Composite 1500 Value, Wilshire 5000, and the Dow Jones respectively. The main catalyst for this drawdown was the Federal Reserve’s decision to raise interest rates in response to rapidly increasing inflationary pressures. This led to a retracting effect on the financial markets and a slow lagging effect on economic growth, as businesses’ revenue growth, market growth, and spending were slowed down.
The equities market throughout 2022 faced increasing resistance with the Russell 100 Value, Wilshire 5000, and the S&P 500 declining -7.72%, -19%, and 19.44% respectively. This outperformance was achieved after robust financial markets in 2021 began to slow down, and a rapid shift in strategy was needed. The conservative allocations and quick adjustments made by the investment committee helped to mitigate the underperformance of some equities that did not perform as expected in the first few quarters of the year, while the continual performance of other equities helped in mitigating losses. However, some sectors, such as Technology, Financials, and Materials, had a negative impact on the Value portfolio’s performance, with large losses occurring in the beginning and latter half of the year. These underperforming equities were sold and replaced during the year.
Looking forward to 2023, the year is filled with uncertainty as the financial markets have started the year in a pullback, with benchmarks still underperforming alongside other major indices. The financial markets are expected to face continued inflation, interest rate increases, and global political tensions, leading to ongoing volatility throughout the year. However, this uncertainty also provides an opportunity to seek better returns and further mitigate losses through strong valueoriented equities.
The Roland George Investments Program is making drastic changes in 2023 to better manage the portfolios. These changes include adding fluidity in adjusting trades and proposing new trades, determining portfolio managers and CIO before the end of the spring semester to allow for portfolio monitoring during the usual summer gap, and continuing to improve the ability to hedge the Roland George Investment Program. Considering the macroeconomic factors likely to affect equity markets in the first half of 2023, the Value portfolio has been strategically rebalanced to be in the best possible position to outperform the benchmark.
The investment committee has voted to remain strongly weighted in Energy, Consumer Staples, and Financials, as it believes these sectors will remain strong despite rate hikes due to factors such as high energy demand, supply constraints, high costs, and volatility, which are expected to drive investors towards defensive sectors such as staples and energy for safety and potential appreciation opportunities based on organic company revenue and growth. The Value portfolio’s lowest allocation is in Real Estate and Utilities, as the investment committee believes average Americans may have limited discretionary income if inflation continues, and the housing market may slow down due to rapid increases in mortgage rates, reducing consumer purchasing power. Additionally, the investment committee aims to reduce the amount of ETFs in the portfolio to better aid in tactical allocation.
Moving forward through 2023, the investment committee is confident in the overall positioning of the portfolios, and as the Value Portfolio Manager, I am confident in the Value Portfolio’s positioning to be defensive while allowing for potential appreciation opportunities. Overall, the Roland George Investments Program continues to strive for improved performance and risk management in the ever-changing market environment.
 FIXED INCOME PORTFOLIO MANAGER

Calendar year 2022 brought about an extreme amount of volatility within mostly all tradeable securities. The bond market, which the general investor has always considered to be a flight to safety, did not live up to its general characteristics. In 2022, the bond market recorded its worst performance ever of -13.1% with the intermediate-term U.S. Treasury bonds losing 10.6% of their value, long-dated U.S. notes down 39.2%, and long-term U.S. treasuries taking a 29.3% hit. 2022 was a year when investors fought hard and heavily to attain notable gains as the equity markets displayed just as much volatility and downside as the Fixed-Income Market. Due to the correlation between the Fixed-Income Market and the overall economy, bonds became a severe casualty of rising interest rates.
Historically, it has been the Federal Reserve’s top priority to keep a symbiotic relationship with unemployment and inflation and sustain both metrics under their targets. Hence, during 2022, as inflation rapidly began to increase up to 40year highs, it reviewed the overall economic conditions and anticipated the possibilities of cutting back on its previously enforced stimulating economic policy. As it decided to begin tightening economic conditions, it turned to its supposedly most effective instrument of raising the overnight lending rate to increase the cost of debt. This factor in the economy causes the consumer to slow down the amount of debt they are taking due to the high theoretical premium they would be paying on the amount they are borrowing, thus slowing down the overall money spent. Manipulating interest rates has been very successful in the past. Hence, the Federal Reserve, throughout 2022, has been gradually increasing interest rates to tame the overall consumer price index and bring the economy back to an equilibrium. This attempt at taming inflation has been detrimental to the bond market due to the inverse impact that interest rates have on the price of fixed-income securities. Hence, throughout the process of the Federal Reserve increasing rates, the bond market has suffered and provided its investors with negative returns, taking away its credibility
The Investment Committee at the Roland George Investments Fund initiated a heavy rebalancing, forecasting the risk of future interest rate hikes by studying and interpreting the forward yield curve. At the beginning of 2022, geopolitical risk, a rise in inflation, and the combative tightening policy caused a significant bear flattening in the yield curve, anticipating higher short-term interest rates for an ambiguous period until inflation was under control. Thus, to capitalize on this opportunity, the Investment Committee made the executive decision to exit more volatile, poorly rated risk, corporate notes and front-load the yield curve by taking a position in the United State Treasury-Backed Government note. The Investment Committee overweighted sovereign debt in the year 2022 and locked in this note at an attractive yield of 4.4%. By overweighting default-proof USTs and underweighting risky corporate exposure, the Fixed Income Fund outperformed its benchmark by 7.1%.
Coming off a year where the market recorded its worst performance in years, many investors are anticipating catching the bottom of the bond market and capitulating on an aggressive bounce. Most of what the bond market will do in the next four quarters lies within the hands of the Federal Reserve and how aggressively it will continue to raise rates. The Federal Reserve has suggested to investors that it plans to shift its policy based on economic data that is released to receive validation of its intentions and goals. However, the Federal Reserve has heavily pointed through its Federal Funds rate swaps that interest rates may remain higher for longer, which has motivated investors to position themselves on the shorter end of the yield curve and keep their portfolio duration low to capitalize on the high yield that bonds are currently providing. This volatility in the fixed-income market is expected to continue to decline as the overall economy experiences the lingering effects of high-interest rates and demonstrates the slowdown the Federal Reserve has been expecting to see to be able to meet its goal of the parity between the labor market and inflation. Once it begins to see the economy return back to its equilibrium, it will be forced to put a cap on interest rate hikes and instill efficiency within the economy for it to be able to sustain its GDP growth forecasts in the coming decade.


 Figure
By overweighting defaultproof USTs and underweighting risky corporate exposure, the Fixed Income Fund outperformed its benchmark by 7.1%.

CONSUMER DISCRETIONARY
CONSUMER STAPLES
CONSUMER SERVICES

ENERGY
FINANCIAL
HEALTHCARE
INDUSTRIAL
MATERIALS
REAL ESTATE
TECHNOLOGY
UTILITIES

The Consumer Discretionary sector contains goods and services that are non-essential to consumers’ everyday lives. These include, but are not limited to, automobiles, hotels, restaurants, textiles and luxury goods. Despite frequent comparisons to consumer staples in discussions regarding the purchase of goods, the performance of the consumer discretionary is profoundly impacted by economic cycles. During periods of economic growth, disposable income rises, leaving consumers with greater after-tax dollars to allocate towards non-essential goods and services. After a period of expansion in 2021, the Consumer Discretionary sector experienced a significant slowdown throughout 2022, attributed to the compounding impact of inflationary pressure, rising interest rates, and mounting supply chain issues. As a result, the Consumer Discretionary Select Sector SPDR Fund (XLY) witnessed a staggering -37% price decline.
Looking forward, CPI numbers have steadily rose and remained well above interest rates. As immense amounts of cash have been pumped into our economy, supply chain disruptions continue, and less workers are willing to work for normal wages, we have continued cause for inflation. Higher prices will then be passed on to the consumer, who will then require even higher wages, and the endless cycle will continue. As this dilemma goes on, demand will have to come down, and drawback in consumer spending will take place. The timeline for this, however, is uncertain. The economic and market landscape has become highly uncertain as a result of an unprecedented and volatile series of events. It is prudent to maintain sector allocations in line with the overall market until more clarity on how the sharp rise in commodity prices, tightening financial conditions, and Federal Reserve interest rate hikes will impact the economy and underlying
fundamentals that drive relative sector performance become available.
This year, President Biden’s proposed Inflation Reduction Act was passed in response to the increasing inflation seen post-2020. In this Act, a couple of key points included the 15% corporate minimum tax and the 1% excise tax on stock buybacks. The 15% corporate minimum tax more heavily affected companies with a larger average gap between their recent effective tax rates and the new 15% and growth sectors, both of which heavily apply to Consumer Discretionary. This creates a headwind for the sector, which resulted in a slight reduction in earnings per share following the passing of this Act.
Looking back, 2021 was the U.S. economy’s strongest year of growth since 1984. However, this was in an effort to quickly fix the damage done to the economy in 2020 due to the COVID-19 pandemic. With any quick fix, there are consequences. For this year of growth, rising inflation lead to a hazardous economic environment. In 2022, inflation reached 8.5%, its highest rate since 1982. This created a great pressure on the Federal Reserve to cool the economy and lower inflation. So, on March 17, 2022, in response to this, the Federal Reserve promised to increase interest rates and has continued to do so throughout the year.

On January 1, 2022, 21 states decided to raise their minimum wage rates. Of these 21 states, 17 of them increased their wages, by 50 cents or more. In eight other states, the increases are part of scheduled raises in efforts to reach $15 minimum wages in the years to come—including New York and Florida. There are possible negative consequences of increasing wages as they can be a cause of further increasing inflation, decreased competition amongst companies, and increased job loss. However, the unemployment rate actually decreased from 4% in January 2022 to 3.5% in December 2022, and historical increases in disposable income have been a major tailwind for the Consumer Discretionary sector, as more people feel they have more money to spend.

Following the COVID-19 pandemic, there were still negative effects continuing throughout 2022, including major supply chain disruptions. These disruptions have highlighted resiliency gaps in many companies and organizations, and negatively impacted all sectors. Many key trends within these disruptions include logistics disruption, production delays, overreliance on a limited number of third parties, high commodity pricing, and workforce and labor constraints. Due to these disruptions, we have seen a decrease in efficiency in many companies leading to a decrease in performance across all sectors.
Despite negative effects from macroeconomic variables this year, the Consumer Discretionary sector contains large companies that propel growth in the future. Some of these large companies functioning under the umbrella of Consumer Discretionary are Apple, Amazon, Tesla and many more. This sector makes up 9.8% of the S&P 500, being led by these companies, which continue to grow into the strong, well-known companies of this century. Therefore, Consumer Discretionary is one of the fastest-growing sectors to this date. Another key factor for growth in this sector is that many up-and-coming technology companies operate under the Consumer Discretionary sector, which will allow for further growth in the future.
Figure 1


The GICS Consumer Staples sector includes companies involved in the production and distribution of essential products such as food, beverages, tobacco, and household and personal care products. It is divided into consumer products and retail staples. Consumer products include agriculture, beverages, consumer staples, household products, packaged food, tobacco and cannabis. The sector is considered defensive because demand for these products tends to be relatively stable regardless of economic conditions or changes in the stock market. This means that even during economic downturns, people are likely to continue purchasing these essential products. While it may not offer the same growth potential as other sectors, its defensive nature can provide investors with a reliable source of income and a measure of stability during uncertain times.
Market conditions in 2022 have aided the performance of the consumer staples sector. During 2022, the CPI (Consumer Price Index) for Food increased 10.4%, reflecting an 11.8% increase in prices for food at home and an 8.3% increase in prices for food away from home, while nonalcoholic beverages and beverage materials prices rose 12.6%. Even though the cost for firms to fabricate or to provide staples products increased, consumers were able to afford higher prices due to low unemployment throughout the year and higher levels of savings. Widespread price increases made customers adjust quicker and as a result prevented companies from losing customers. Coca-Cola (KO) and Procter & Gamble Co (PG) were the top performers in the consumer staple sector with 15.2% and 14% returns, respectively.
Increased distribution costs in terms of labor and oil prices had an impact on the vast majority of the consumer staples sector. Currency loss and a strong US dollar challenged international companies and affected their operations. Some businesses were unable to pass increased prices to customers and lost sales as consumers switched to less expensive generic brands and private-label goods. In such an environment, companies with strong brand recognition and loyalty have a superior advantage.
Household and personal care products are expected to recover as customers return to in-store purchases and focus on their wellbeing. Although there might have been a change in personal care items such as razors, deodorant and shampoo, volume is expected to increase as people return to pre-COVID-19 habits. The packaged food segment might experience decline as higher prices shift customers’ eating habits. Companies such as General Mills (GIS), Campbell Soup (CPB), Kellogg (K) and Kraft Heinz (KHC) will be facing challenging competition from generic brands and retailers’ private-labeled products. Those alternatives will be available to customers as a cheaper option and might be more attractive to lower middle-class customers.
The Consumer Staples sector performed well overall during 2022. With consistent need for their products, consumer staples companies can provide steady returns, even in bear markets and recessionary periods. By adjusting package sizes and spending on promotion and advertising, businesses in the consumer staples sector are prepared for another year of headwinds. If demand declines even further, many companies
will start to focus on cost-cutting initiatives, which could include layoffs and efficiency improvements. While 2023 may present some difficulties for the sector and the industry, certain businesses are still likely to prosper. For investors seeking cashflows in equity markets, consumer staples sector would be one of the best options. A large number of companies, including General Mills (GIS) and Procter & Gamble Co (PG), in the consumer staples sector are considered “dividend aristocrats.” Such companies have increased their dividend every year for at least 25 years, making it a very attractive sector for investors seeking income return in the form of dividend.


The Global Industry Classification Standard (GICS) classifies the energy sector into two primary industries: Energy Equipment & Services and Oil, Gas & Consumable Fuels. The categorization incorporates sub-industries encompassing resource prospecting, excavation, purification, warehousing, conveyance, and commercialization activities. Moreover, enterprises that offer equipment and services to the oil and gas industry are considered a constituent of the energy sector. Predominantly, companies in the oil and gas industry can be segmented into three key elements of the supply chain: Upstream, Midstream, and Downstream. The Upstream companies are directly prospecting prospective crude oil and natural gas reservoirs, primarily through drilling and operating wells. The Midstream companies provide storage, conveyance (via pipelines, barges, railroads, and other logistics), and wholesale marketing of energy-related resources and products. The Downstream companies are involved in all post-production processes, which encompass the purification and dissemination of crude oil and raw natural gas into consumable fuels, such as gasoline, diesel fuel, jet fuel, waxes, lubricants, and other petrochemical derivatives.
The energy sector saw the greatest performance of all sectors in 2022. Tight supplies and surging demand fueled elevated oil and natural gas prices. Energy consumption rebounded quicker than anticipated from its pandemic lows, leading to a decrease in oil and gas stockpiles and reaching depleted levels by late 2021. These already rigorous market circumstances were exacerbated in 2022 by the Russian invasion of Ukraine, which resulted in supply interruptions. Russian natural gas
exports witnessed a substantial reduction since the incursion, while Russian oil production endured a slight decrease and is expected to endure further decreases as Europe enforces stringent sanctions on Russian energy. The past year also witnessed a scarcity of refined products and consumable fuels, such as gasoline and diesel, compared to raw inputs, such as crude oil. Refinery profit margins for oil companies surged to unprecedented levels during the summer of 2022, when consumers embarked on summer travel, in part due to interruptions of processed product exports from Russia and the closure of refineries as the world shifts towards renewable energy sources. Though not consumer friendly, energy stocks outperformed as a result of these catalysts.

Looking into 2023 and beyond, despite recessionary pressures and slowing economic growth, the forecasted demand for crude oil and natural gas is expected to rise as economies persist in recuperating from the pandemic. Although investment in oil and gas production has been proliferating, global supply may take several years to keep pace with demand, thereby supporting high prices for crude oil and natural gas. Companies are utilizing their augmented cash flow to alter their strategies from investing in industrial plants and drilling operations to addressing their outstanding debt and internal corporate expenses. Refining capacity remains limited and will remain tight in 2023, considering the restricted availability and the extended lead time required to establish new power. This is likely to lead to another fruitful year for the profitability of companies engaged in refining operations. Energy services companies may encounter robust earnings growth as expenditures on exploration and production escalate.
A significant risk that may occur is the substantial weakening of the demand side, as noted. Most of this stems from backand-forth moves between Russia and G7 on oil sanctions. With the recent announcement of oil production being cut by 5%, combined with a Chinese economy reopening after its zero COVID strategy ending, oil and other commodity prices, such as platinum, can see some volatility based on the pressure of price caps from one part of the world versus production decreases from another. The global macroeconomic landscape concerning geopolitical tensions will continue to dictate how the energy sector performs, combined with domestic inflationary pressure and decisions on spot rates. Exploration & Production (E&P) companies. Some U.S.-based E&Ps, in particular, may be able to return significant amounts of capital to investors via dividends and/or share buybacks. Though the weather will continue to play a factor in the oil and gas markets, underlying demand for oil and gas should continue to grow as economic growth continues while supplies are likely to remain relatively restrained. As a result, we predict oil and gas producers are likely to continue to enjoy strong profitability and stock performance in 2022 (see Figure 2).


The Financials Sector includes firms such as banks, brokerages, insurance companies, consumer finance firms, and other companies engaged with financial assets or transactions. It is a crucial part of the U.S. economy, providing access to capital and liquidity used to fuel business growth and drive consumer spending. The health of the Financials Sector is often indicative of the health of the larger economy. Additionally, due to its economy-wide reach, the Financials Sector generates the most revenue (Figure 1). Notable firms in the sector include JPMorgan Chase, American Express, and Berkshire Hathaway.


The success of the Financials Sector is tied to overall economic conditions. As such, macro-wide components such as interest rates, inflation, gross domestic product, and the housing market have a substantial impact on how the sector performs. Incidentally, these figures were mainstream talking points in 2022 as inflation hit a 30-year high and as a result, the FED pursued its most aggressive rate-hiking cycle in decades (Figure 3).
The early-to-middle portion of the business cycle typically presents the most optimal conditions for the Financials sector. In an expansion, businesses and consumers are borrowing more money to spend and invest. This stimulates GDP growth and healthy inflation, driving the sectors performance. As the economy heats up, the Federal Reserve typically reacts by raising interest rates. Many Financials Firms, especially banks, benefit from a high interest rate environment as interest earning assets such as loans and bonds command higher interest. When the cycle turns and the economy slows down, the sector will sector experiences deteriorating performance as volume declines, but prudently managed firms that adequately factor

 Devin Shaffer FINANCIAL PORFTOLIO MANAGER
Figure 1
Figure 3
Devin Shaffer FINANCIAL PORFTOLIO MANAGER
Figure 1
Figure 3
the risk environment into their operational approach can still see healthy performance. Overall, the Financials Sector is cyclically sensitive but to a lesser extent than other sectors as certain functions, such as banking, are always in demand to a certain extent no matter the phase of the business cycle.
2022 presented a high degree of uncertainty and conflicting indications of the direction of the economy. Early in the year, inflation was surging and the FED began aggressively raising the Federal Funds Rate after dropping it to an all-time low of 0.25% during the COVID-19 pandemic to stimulate economic recovery. Recession fears mounted, but key economic health indicators such as the Unemployment Rate and Continuing Jobless Claims continued to prove resilient throughout the year (Figure 4).

The sector also performed well against the overall market, as more cyclical sectors such as Consumer Discretionary and Real Estate saw declining activity, especially in the first half of the year, with peaking inflation and higher interest rates. Comparing the S&P 500 to the SPDR Financial Sector ETF (NYSE: XLF), the sector outperformed the overall market (Figure 6).
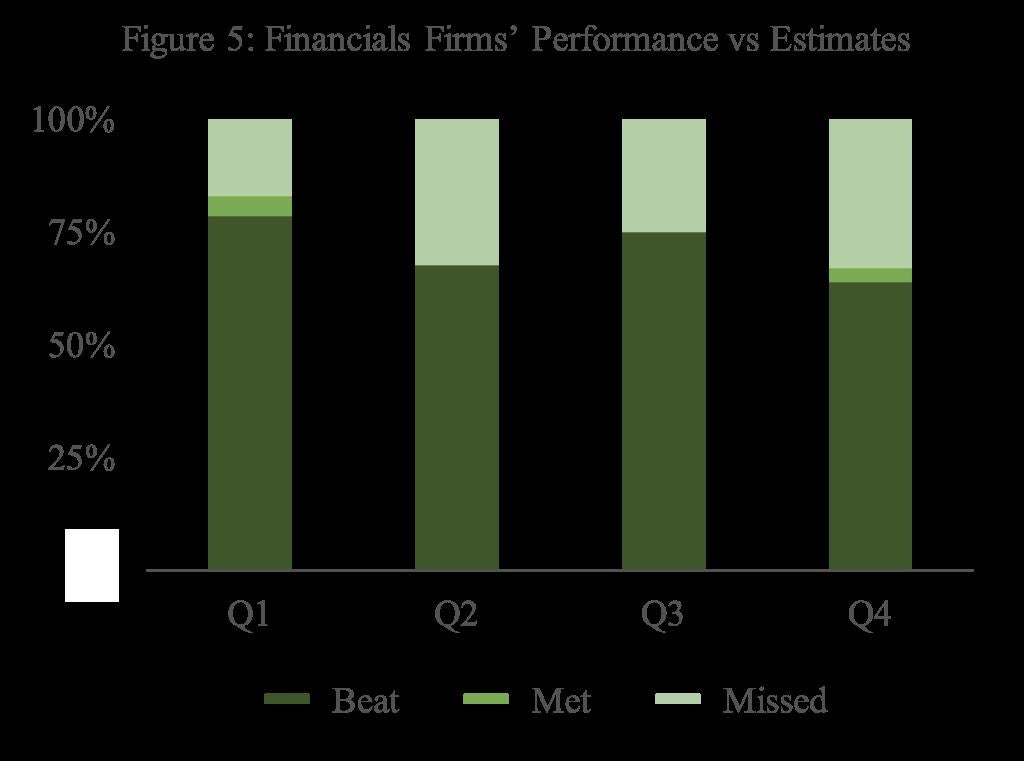
Overall, Financials Firms performed well. This was due to macroeconomic buoyance and higher interest rates translating to growing interest incomes. For all four quarters, a majority of firms in the sector either met or beat earnings estimates (Figure 5).
Peaking inflation and recession fears drove markets down in the first half of the year. However, as noted in the above graph, the Financials Sector rebounded much stronger in the second half of 2022 as higher rates took effect. Due to the first half decline, the Financials Sector and S&P 500 closed the year down 10.4% and 18.6%, respectively.
 Figure 4
Figure 5
Figure 4
Figure 5
The sector picked up momentum in the second half of 2022, but did show some signs of slowing as firms posted their Q4 results. Positive indicators include Real GDP, which grew 2.1% in 2022, and a stubbornly strong labor market, with the unemployment rate closing the year at a near-decades low of 3.7%. Additional economic data across the board mostly illustrated a strong economy. However, the last CPI report of the year showed a 0.1% MoM increase, suggesting inflation is beginning to slow retreat. The fact interest rate hikes are not immediately felt in the economy, coupled with the FED bringing the FED Funds Rate to 4.25% to close 2022, would indicate the economy should start to slow growth in early-tomid 2023. General fears of a recession are not as widespread as earlier in 2022, but the possibility still remains relevant. It is expected that banks will continue to see boosted interest income from higher rates in the near term. It is also important to consider that the current macroeconomic environment proves to be the most challenging in over a decade, and banks should be watched carefully as 2021 and 2022 saw significant loan origination, which could lead to an increase in defaults should the economy slow and the unemployment rate increase towards the second half of 2023. Furthermore, due to the more favorable environment over the last decade, with the exception of 2022, it is possible that firms were not very cautious and forward-looking after a long stretch of optimism. For instance, it is common that banks invest in Treasury Bonds, regarded as risk-free. Bonds purchased at very low rates during 2020 and 2021, will lose significant value as higher rates drive down prices. Unless these are held to maturity, this can present liquidity challenges.
Overall, the near-term outlook suggests a stubbornly strong economy will provide opportunities for growth if managed correctly, but the sector should be approached with more vigilance due to a potentially changing macroeconomic environment.

Positive indicators include Real GDP, which grew 2.1% in 2022, and a stubbornly strong labor market, with the unemployment rate closing the year at a neardecades low of 3.7%.
The Healthcare Sector is comprised of industries such as pharmaceuticals, biotechnology, medical devices, healthcare facilities, and healthcare services (Figure 1). Businesses in this sector produce and distribute a variety of products including medical supplies, equipment, medicines, vaccines, and other therapies. The sector is one of the largest in the United States, with a market size of approximately $4.3 trillion in 2021. The Healthcare Sector accounts for 18.3% of the country’s gross domestic product (GDP), which has decreased from $4.1 trillion or 19.7% in 2020 due to a reduction in COVID-19 related expenses. However, the actual dollar value of healthcare spending has continued to grow, indicating the industry’s importance to the overall economy.

experienced significant losses, healthcare remained relatively steady. In Figure 2, a comparison of daily YTD returns of the SPDR S&P 500 ETF Trust (SPY) and the Vanguard Healthcare Index Fund (VHT) is shown. The VHT strongly outperformed the market, ending the year down 4.99% while the SPY was down 19.64%.

The Healthcare sector is very defensive in nature, which stems from the perpetual need for healthcare solutions irrespective of economic conditions. Consequently, the sector has been a reliable source of stable long-term growth. This was made visible throughout 2022, as the stock market observed significant headwinds due to the macroenvironment, including sticky inflation and interest rate hikes. While the market
As pandemic-related restrictions have eased and a sense of “normalcy” has returned, a reflection on the healthcare space is necessary to evaluate how the sector has adapted to the unprecedented impact of COVID-19 on the health system. The number of reported deaths due to the virus has now surpassed 6.8 million, with over 750 million cases worldwide. The pandemic exposed a multitude of inadequacies in the health system, from a lack of infrastructure to staff shortages. However, the industry quickly transformed to adjust to the new reality. An influx of capital poured across the sector, from the expansion of biotechnology and pharmaceuticals R&D to government spending on healthcare and vaccine therapies. Both private and public sectors have seen growth

in R&D spending, with a growth rate of 10.7% and 5.9% over the last 3 years, respectively (Figure 3). Investment in the space is expected to remain heightened driven by pharma and biotech spending, supply chain security, and infectious disease research to mitigate the impacts of a future pandemic.

The pandemic accelerated the adoption of online meetings and collaboration tools across the economy, and the healthcare sector is no exception. The use of technology to provide remote healthcare services, known as Telehealth, became commonplace as non-essential care was pushed virtual. Although telehealth gained popularity during the pandemic, its ongoing growth can be attributed to its ability to enhance access to care and lower healthcare costs. While challenges such as digital infrastructure and insurance coverage exist, Telehealth is in a very fast development phase and is here to stay. Figure 4 highlights the strong growth in Telehealth users and its revenue-generating abilities. The notable increase in revenue in proportion to the number of active users suggests that each user is utilizing the service more frequently. According to a report by IBISWorld, Telehealth revenue is expected to expand at a compound annual growth rate (CAGR) of 10.5% over the next five years.
Similarly, clinical trials have moved virtual. Forced to minimize in-person contact, companies have embraced decentralized clinical trials (DCTs) and virtual trials (VTs). While there are multiple barriers that need to be overcome, early investments into the adoption of virtual clinical trials allows for a step in a new direction. With new technology entering the space, DCTs and VTs represent a viable alternative to traditional clinical trials. Benefits include the ability for researchers to recruit patients, administer treatment, and collect data without having to make frequent in-person visits. This has also led to boost in participation, with a strong majority of participants indicating they prefer DCTs and VTs. According to Forte Research, 18% of participants leave traditional trials before completion, with the most cited reason being scheduling constraints. By increasing the pool of participants and offering more flexibility, virtual trials are a cost-effective solution for business.
The pandemic lead to a resurgence in investment in the healthcare space, creating opportunities for growth not seen in recent years. Deal value and volume grew 52% and 55% respectively from 2020 to 2021. This growth in mergers and acquisitions (M&A) was largely driven by companies seeking to expand their capabilities and portfolios in response to the pandemic. While the macro-environment led to a dramatic slowdown in deal activity over 2022, the Healthcare Sector remained relatively flat with deal value and volume down 20% and 2% respectively from 2021 (Figure 5). Looking ahead, we anticipate that M&A activity in the Healthcare Sector will pick back up as companies adjust their valuations to the new interest rate environment. Moreover, the innovative businesses that have emerged during the pandemic will likely

strengthen the sector’s M&A offerings, making it an attractive destination for companies to seeking growth and returns.

Despite the recent volatility that has spread throughout the United States and reached the HealthCare Sector due to geopolitical events, we project a healthy outlook in Health care for 2022. In 2020, the start of the global pandemic uncovered the lack of preparedness to face a worldwide crisis. Large healthcare corporations such as Thermo Fisher Scientific have adjusted to the situation by increasing supply chain security and strategically aligning themselves to serve attractive biotechnology and pharmaceutical markets. They have also focused on delivering to emerging markets, specifically in China. The influx of government spending and academic research centered on development of advancements in pharmaceuticals and biotechnology has strategically positioned the sector to mitigate the risk of the ever-present global pandemic.


The North American Real Estate Investment Trust (NAREIT) Sector is formed by six different types of Real Estate Investment Trusts (REITs), which include residential, office, retail, healthcare, industrial, and self-storage REITs. Other various forms of REITs include timber, mortgage, gaming, and infrastructure. There are also sub-REITs such as hotels, warehouses, data centers, and cell towers, which fall into the six main REIT sectors. By definition, a REIT is a company that owns, manages, and leases real estate properties and invests in real estate-related securities. Since their inception after the legislation was passed in 1960, then later amended in 1986, REITs have been trading on major exchanges, mostly on the New York Stock Exchange (NYSE). Much like mutual funds, REITs pool capital from numerous investors which allows individual investors, to earn dividends without having to manage or buy property. Due to this mutual fundlike structure, REITs provide liquidity as opposed to real property, which is much less liquid. REITs are exempt from
federal, state, and corporate income taxation at the entity level, but there are several requirements to qualify to be a REIT. Most notably of which include that at least 90% of taxable income be paid in the form of dividends each year. While most of the REIT revenue is fairly divided, retail REITs bring in the most revenue per year versus the six main sectors.
The graph above shows the relative performance of each REIT segment in terms of the ending 2022 FFO multiple. FFO stands for Funds From Operations, and the FFO multiple helps us evaluate a company’s share price by using FFO as a performance measure as it makes adjustments for depreciation, preferred dividends, and distributions. Mall REITs continue to heavily weigh down the industry as it remains the cheapest segment. This is primarily due to lasting impact from COVID-19, but also largely reflected e-commerce growth and recently by the multiple decline of mall-focused Simon Property Group, the largest member of the peer group by far. Office REITs also traded low as increased demand for at-home jobs compounded
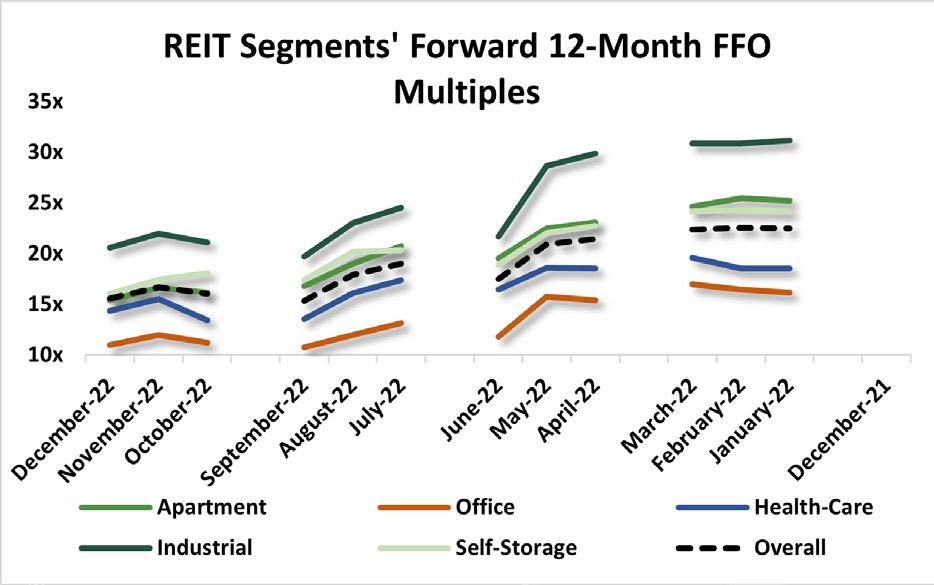

with lasting effects from COVID-19. Average occupancy rates for Office REITs hit its lowest point mid-2022 since 2017, resulting in them trading at their lowest multiple since 2009 in combination with uncertainty over long-term tenant demand.

Industrial REITs were one of the top performers of the year, trading at the highest multiple. Majorly contributing to this were historic levels of warehouse transaction volume and demand, which were almost 2x previous highs. Although warehouse availability is limited, companies are looking to continue acquiring more property as real interest rates remain accommodative. This plus surprising rent growth led to industrial REITs leading the pack for the year. Retail REITs also performed at the top due to their ability to pass on price increases to their tenants, which ended 2022 with a 96.4% occupancy rate, the highest level on record. The segment saw the smallest decrease in YoY total return compared to the rest of the segments, coming in slightly over -13%.
As portrayed above, one of the biggest threats to the real estate sector is the uncertainty surrounding inflation and the interest rate environment. With very few economists surveying recent CPI data and the Fed stating it will not raising rates until it feels inflation is under control, the uncertainty prohibits growth for an industry heavily reliant on rates for lending and developing, and inflation for property prices as well as capital costs (nonresidential), which rose roughly 10% during 2022. Also, with transaction volume down and capital costs up, REITs were poorly positioned at the end of the year to carry onto the next. Both top and bottom line growth are expected to slow if asset prices remain inflated, which is uncertain as previously mentioned. Capitalization rates, the rate of return on a real estate investment property based on the income expected to generate, on average have fallen from 5.1% pre-COVID to roughly 3.2% around the end of 2022. Retail struggled in 2021, and the outlook for 2022 is not much different. Even before the pandemic, the shift to online shopping was well underway. Brick-and-mortar stores closed by the thousands, and it is predicted that 9% of stores, or 80,000 more, will close by the end of 2026, additional hurting retail REITs. Malls are currently the most heavily shorted REIT property type, and other retail is the second heaviest, showing there is not much confidence in the market heading further into 2022.
 Figure 3
While the sector had a very poor previous year and is expected to see somewhat similar results, there are opportunities for growth in the sector and REIT industry. Industrial REITs are well positioned with high warehouse demand and e-commerce growth persisting into this year. Also, cap rates for industrial REITs reached over 7% at the end of the year, compared to the before stated average of 3%. With the ability to acquire new property, growth is available through expansion in properties and limited and attractive land. Retail REITs in 2022 saw over a 100 bps increase in lease rate percentage, from 95% to 96.32%, and this is expected to uphold for 2023. This, combined with lack of new supply, strong occupancy rates, and growth in rental rates, is set to provide a strong year ahead. Being that REITs historically serve as hedges against inflation, if the FED succeeds in lowering inflation levels, REITs will look more attractive.

Based on prior performance of REITs when entering and during recessions, stable and consistent tenant demand combined with minimal supply are holding many asset classes positioned to keep expanding net operating income in 2023. However, logically looking forward, inflationary levels will most likely remain at heightened levels that keep asset prices for REITs above desired levels and high interest rates that will keep capital costs high, as well. Demand for retail centers and warehouses will serve as main revenue generators, and the addition of high cap rates will counteract the negative effects of the uncertainty of inflation, interest rates, and geopolitical tension.


The Utility Sector is a significant component of the economy, providing essential services such as electricity, natural gas, water, and other public services to individuals and businesses globally. The Utility Sector is considered relatively defensive due to its low volatility and consistently stable demand for its products and services. Historically, utility companies generate solid growth in revenue and cash flows and pay consistent dividends, making them attractive investments for income-oriented investors, typically held as long-term assets. The Utility Sector consists of segment-specialized as well as multi-purpose companies, giving investors the opportunity to invest in sub-sectors depending on which areas they think will perform best. The Utility Sector has seen some changes since 2020 when President Joe Biden called for the country to achieve a 10% clean energy economy and net-zero greenhouse gas emissions no later than 2050, committing nearly 2 trillion U.S. Dollars in investment to achieve this goal. With this, utility companies have access to the $65 billion allocated in the Infrastructure Investment and Jobs Act, dedicated to upgrading the national power infrastructure. This fund has facilitated growth for many organizations and allowed them to operate and grow sustainably without worrying about significantly increasing their capital expenditures.
In 2022, the S&P 500 Utility Sector outperformed the S&P 500 index by 18.08%, yielding a 0.18% total return, which is a tribute to the stability the securities in this sector consistently obtain. As seen in Figure 1, the S&P 500 Utility Sector Index and the S&P 500 Index experienced similar fluctuations, but the Utility Sector was considerably less fluctuant and showed less volatility than the market index. With macroeconomic

uncertainty at the start of the year regarding inflation, interest rates, and geopolitical conflict, many investors leaned on defensive securities such as utility stocks, seeing them as a form of reliable income due to the constant demand. This was one of the main reasons for the continued stability and growth in the sector, even in a year of negative overall market returns. In the RGIP fund, utility stocks make up a total of 3.37% of the portfolio -- 71.81% of these stocks are in the value portfolio and 28.19% are in the Growth Portfolio. One of the strongest performers in the fund in 2022 was Atmos Energy Corporation, a value stock that holds the majority of the utility weighting, which saw a 6.44% growth in its share price from 2021-2022. This stock not only outperformed the S&P 500 index by nearly 25%, but it also outperformed the S&P 500 utility index by 6.26%, and according to our analysts, is projected to see even more growth over the coming years.
The Utility Sector has experienced significant changes in recent years, primarily driven by technological advancements and changes in consumer preferences. One of the biggest trends is that the Utility Sector is moving towards renewable energy sources (see Figure 2 for the breakdown of renewable energy in
the United States), driven by three main catalysts: the declining cost of renewable energy technologies, environmental concerns, and government incentives.

increasing the competition in the overall market.
One of the most substantial headwinds for the Utility Sector is the steady demand for natural gas throughout the United States. In the United States, about 48 percent of all homes use natural gas for heating, according to the U.S. Census Bureau, indicating the country’s heavy reliance on natural gas providers. Also, throughout sustained inflationary pressures and rising commodity prices over the past few years, the demand for natural gas has remained constant, indicating its high resiliency, and projecting strong performance in the years to come, despite the increase in electrified alternatives.
That said, another trend that has significantly impacted the Utility Sector is the anticipated shift to electrification, as many companies will be adopting this as a strategy, and the market will begin to see some new organizations arise. Electrification is the idea of replacing technologies and systems that run on fossil fuels with alternatives that run on clean energy, a way to reduce pollution in efforts to decarbonize the economy, per President Biden’s plans to eliminate emissions and increase clean energy by 2050. This direction will allow electricity providers to increase their business substantially and continue to grow in the coming years.
With the increase in energy suppliers and options for renewable energy providers, customers are becoming more empowered in the utility sector with the ability to pick and choose their solutions to fit their desires,
One constant risk for utility companies is changes in or unexpected weather patterns. Companies in this sector historically have faced struggles when occurrences such as natural disasters, climate change, and mixed weather patterns have occurred. For example, for companies specializing in heating homes throughout the winter months, having a warmer-than-average winter will significantly impact their business and cause them to profit less in a period when they typically thrive. Changes in weather patterns threaten the overall industry, as it has the potential to increase business expenses and cause marginal losses.
Also, with potential financial uncertainty in the near future, consumers may become more conservative regarding their energy level use as prices increase, having the potential to cause energy providers to lose business from their customers, even if it is fractional. If each household becomes more aware and conservative of their energy usage on a day-to-day basis, the industry will have less cash flowing through, decreasing the overall profitability of many companies in this sector.
The Utility Sector, typically seen as a Value Sector, looks very strong regarding projected future performance. The companies in this sector expect to continue their reputation of being a shoulder to lean on for investors while simultaneously having immense growth potential due to new business opportunities with the growth of renewable energy solutions. As they continue to obtain a more reliable and modernized grid, there are great opportunities for industry leaders to continue to thrive and for next-generation energy technologies to have the chance to come out of their shells. That said, the business potential in this sector is immense, and we expect to see safe growth compared to the market over the coming years.

The Communications Sector (GICS) is comprised of sectors that make possible easy global communication. One of the two subsectors is Telecommunication Services, which is primarily covered by companies that manage internet accessibility, data operators, and telephone and cable companies. The second subsector is Media & Entertainment, which goes from multinational holding companies to video game and social media companies. This sector has a market value of $7 trillion, and it represents more than12% of the S&P 500 and roughly 9% of the Wilshire 5000 indices.
In 2022, the two indexes declined roughly 19%, and more than half of the sectors saw a double-digit decline. However, The S&P Level 1 Sector Index declined 39% in 2022, underperforming all sectors and landing three percentage points lower than the second lowest -- consumer discretionary. With the two-year daily beta of the level 1 index of being 1.2 and a correlation of 0.85, it shows that the sector as a whole reacts with a greater magnitude than the market economic events.
This sector is significantly sensitive to changes in interest rates and high inflation rates. Apple, the biggest company in the industry in terms of market share accounts for roughly 31% of the entire sector and it declined 22% and 26% in revenue and net income respectively during the first two quarters of 2022, periods that saw a constant rising rates. Since rates have increased more than three percentage points since the start of last year, customers are spending less on commodities and in communication services.
MEDIA AND ENTERTAINMENT:
Companies such as Netflix, Spotify, Disney and Warner Bros. will have to take a new marketing approach if the economy is signaling a recession. In addition, the companies in this subsector have to consider the customers’ changing demands. Since social media is becoming more impactful on the average person’s life having a safe, cyber-secure environment to communicate is the main element which gives companies and firms competitive advantage.
This subsector is very fragmented, with 15 companies having more than 60 billion dollars of market share and over 50 billion dollars of revenue. The two industries – diversified and wireless services- have a high level of competition. In addition to having economies of scale, telephone companies must always have good services and offers for customers to choose them to keep them in the fold. With 5G technology and infrastructure in most telecom companies, the speed, quality, and resilience of internet is their main competitive advantage, along with the prices of their services.
Alonso TangDuring the first months of 2022, when inflation signaled a continuous rise in interest rates, the portfolio shifted to a defensive strategy. Our two investments in the growth portfolio consist of Tencent Holdings (ADR: TCEHY) and T-Mobile (TMUS). The first has a correlation of 0.15 compared to the Wilshire 5000 index, so an economic event in the United States will not reflect on the performance of this stock. T-Mobile, on the other hand, outperformed the competition and went the opposite way, with a 19% increase in price. In our value portfolio, we have selected Warner Bros (WBD), Verizon Inc (VZ), and AT&T (T). By diversifying this portfolio in terms of geography and industry, we have managed to reduce our losses in comparison to the average in the industry and the indices.
This sector has the opportunity for strong growth in economic expansion. Since the usage of telephones and devices has become an essential item, there is always a need for better internet. Since this sector is relatively new and there is still a lack of these devices in some parts of the world, there is always the desire to enter new markets. Companies that do not rely on a sole country for their operations will have more room for resilience against a particular economy. In addition, since new generations will impact the media and entertainment industries, there will always be a demand for commodities.
Two-thirds of the industry’s market cap is media and entertainment. With the inflation rate being close to 6% and the risk-free rate being raised to 350bps, the failure to control them can affect their revenues. There is still the possibility of increasing the interest rates according to the FED, so commodities such as video subscriptions will be affected if customers are taking a more conservative position. In addition, since big technology companies have been laying off employees and closing buildings, they could face the same fate if the companies do not have a conservative plan. Furthermore, there has been a demand for security regarding information
and cybersecurity attacks, and the failure to comply with these requests can affect the opinion of markets, therefore reducing the revenue and popularity these competitive firms have.
Since the rise of interest rates is almost certain, there will be a higher decline in prices in 2023. However, after this slowdown and the control of the inflation rate, there is an expected growth poeriod for social media and telecommunication. There will be more markets involved since the big competitors of wireless service communications are aspiring to reach areas where telecommunications are not present, even with current economic situation. It is expected that this growth will be similar to the growth seen in the last five years.

This past year has seen contractions in the technology industry, which can be traced back to the catalysts of rising inflation rates, rising interest rates, and the uncertainty of the direction of the market. The Standard & Poor’s 500 Index fell by 20% in 2022 and had fallen 25% at its lowest point (Figure 1). While this uncertainty has pushed some investors back and incurred losses, we have still seen massive innovation and opportunity in the technology space branching out with AI, machine learning, data security, and much more.

In 2022, the information technology sector has seen a sizeable decline with losses at 31.40% (Figure 2), according to the S&P 500 Info Tech Index, with tech experiencing the greatest losses of any other sector. This can be deduced to the fact that technology is much more cyclical than any other industry, meaning the sector is affected more by interest rates and uncertainty in the United States and world economies.

Going into 2023, there are an abundance of drivers that could propel technology forward and away from the contractions that we have seen over the past year. The biggest of these drivers is the advancements in AI and Machine Learning. AI is increasing at a rapid rate in the technology sector, now enabling any business to leverage its power to create more intelligent products and innovative services. AI and Machine Learning are game changers for cybersecurity and expanded spending on AI in cybersecurity is forecast to go from 15 million in 2021 to $134 billion by 2030. Due to a lot of uncertainty in the market, data security also will be a focus. With new requirements and regulations put into place in the specific areas of data security, data governance and data protection, there are increasing projects and funding
in this field. These advancements will be an exciting area for innovation in the upcoming months. It should be noted that when historical data is considered, the same forces that drive economic and geopolitical uncertainty also drive cutting-edge innovation. It is expected that those forces will continue to work as they have in the past, hence increasing innovation and security in the information technology space.
Major threats affecting the technology sector include: the United States economy ongoing high inflation and
Figure 1interest rate hikes along, macroeconomic risk regarding the current war going on in Ukraine.
Regarding inflation, we expect that the Federal Reserve will continue to hike interest rates up to 5.125% (Figure 2) by end of year 2023. The dot-plots and forward curves suggest a period where the Fed will pause the hiking cycle, followed by a series of rate cuts (Figure 3).
The information technology sector has been largely affected by the Russian and Ukraine war. In recent years technology companies have outsourced activities to Ukraine due to the countries low-cost and skilled labor. Recent data suggests that there are said to be more than 150,000 computer engineers in Ukraine alone. With the United States suffering labor shortages, this war negatively contributes to the scarcity of labor. Ukraine also plays a very significant role in the production of semiconductors and with a persistent shortage, the war adds pressure to the ongoing scarcity. Ukraine also produces half the world’s neon gas, which is used in the production of computer microchips. The war inherently threatens to greatly increase the global chip shortage.
While there are some unfavorable circumstances for technology, there have also been increases in innovation, including a rise in innovation in the cybersecurity industry. Currently in cybersecurity, there are more positions available than employees due to scarcity of labor. This outpacing environment for jobs has allowed for innovation of automation to be even more apparent when human talent is scarce. With companies still in need of security and protection, AI and Machine Learning will continue to help the information technology space when manual work ceases to be an option. Another opportunity for growth is improvement and innovation in the cloud space. With the cloud disrupting traditional computing and with most companies being driven by conventional technology advancements, cloud computing will propel more companies forward from an innovation standpoint.
The outlook for 2022-23 is difficult unless inflation can be controlled, at wich point the technology sector will become strong again. With current macroeconomic threats in the United States and global markets, 2023 shows a volatile and inverted treasury forward curve (Figure 3) indicating an extremely uncertain period due to rapid interest rate changes to cover inflation. We do not see any long-term detrimental effects past this year, and this uncertain period may cause technology to strengthen.


The Industrials Sector is broken down into three major components: manufacturing/distributing capital goods, providing commercial and professional services, and transportation. Subsectors include aerospace and defense, air freight & logistics, airlines, industrial machinery, industrial conglomerates, commercial services and supplies, electrical, construction, transportation, and waste management. Current Industrial Securities in the portfolio include Lockheed Martin (LMT), Griffon Corporation (GFF), Honeywell (HON), L3 Harris Technologies (LHX), and Quanta Services (PWR). Industrial Securities are very cyclical in nature and perform well during economic booms and underperform in recessionary periods. Fidelity MSCI Industrials Index ETF (FIDU) tracks an index of U.S. Industrial Stocks, including transportation firms, providers of commercial and professional services, and manufacturers of capital goods. The index illustrates that the sector has stayed stable over the course of uncertain macroeconomic conditions in 2022, with a return to the 2021 price levels at the conclusion of the year.

The war between Russia and Ukraine has attracted the attention of Western governments that wish to support Ukraine in its struggle. Lockheed Martin (LMT) stock performed well in 2022, as the company capitalized on the war by fulfilling numerous purchase orders from the United States Government. In December of 2022, the Biden Administration planned to request congressional approval for a $20 billion sale of new F-16 jets to Turkey. The sale would include 40 new planes and kits to overhaul 79 jets in Turkey’s existing fleet. Furthermore, the White House also requested a separate sale of next-generation F-35 fighters to Greece. Lockheed was awarded just over $1 billion to expedite production as it works to deliver 118 Lot 18 F-35 Lightning II fighter jets by January of 2023. Thus, the U.S. Defense Budget has ballooned to alltime highs, and LMT continues to beat earnings expectations.

The sector saw decreased consumer demand in the housing market throughout 2022 due to sharp interest rates by the Federal Reserve. New single-family home sales fell early in the year as mortgage rates rose. However, the program’s holdings
Figure 1of Griffon Corporation (GFF) outperformed the market by a large margin in 2022, with the company’s shares rising by more than 25%. Griffon holds subsidiaries across the industry that provide lucrative growth opportunities and consistent earnings to support the company’s diversified portfolio. Griffon’s latest acquisition was Hunter Fans Corporation, a global market leader in residential ceiling, commercial, and industrial fans that contributed $400 million in revenue and $90 million in EBITDA to Griffon’s balance sheet in fiscal 2022. Overall, despite unfavorable market conditions, Griffon consistently exceeded earnings expectations and outperformed its peers.

The program took a defensive stance in 2022 to combat the negative effects inflation and increased interest rates would take on the profitability of the sector. The cyclicality of Industrial Companies typically suggests that the program should under weight this sector in its portfolio when a recession seems imminent. The current inverted yield curve predicts an economic downturn in coming months, and the FED has repeatedly noted it will raise interest rates until inflation has cooled. However, strong job reports and high forecasted company earnings point to an economic expansion in 2023. It seems that the same uncertain macroeconomic conditions that plagued 2022 are being translated to 2023, which will inevitably impact the Industrial Sector’s revenue. Overall, while the Industrial Securities in the portfolio had a strong performance in 2022, high interest rates and reduced consumer demand make it difficult to say the same for 2023.
The Biden Administration has made significant investments in construction and infrastructure in an attempt to repair and modernize highways, bridges, and airports across the nation. In order to accomplish these goals, companies adept at providing electric power infrastructure solutions will be in great demand -- companies like Quanta Services (PWR). By providing services that address various aspects of the electric grid, Quanta is well-positioned to benefit from an influx of investment in the aging electrical infrastructure. The program’s holdings of the stock outperformed expectations in 2022 as Quanta’s backlog increased, representing the high demand for the company’s services in the industry.

The Materials Sector encompasses five main industries: chemicals, construction materials, containers and packaging, metals and mining, and forestry. The metals and mining sub-sector has seen the most growth among materials and is comprised of a range of minerals and precious metals such as gold and silver, oil, aluminum, and steel. The chemical industry is wide ranging and can be broken down into categories of organic chemical producers, fertilizer industries, refining and petroleum, pesticides, and even heat treatment production. In conjunction, construction materials are also prominent among this sector. These elements either occur naturally such as stone, clay, and lumber or are synthetically made like concrete, steel, or bricks.
Materials is considered a cyclical sector given its performance tendency to rise and fall with global growth prospects. Its high sensitivity to business cycle fluctuations is a key indicator of economic health. Therefore, this sector as a whole may experience downturns during recessionary periods of high inflation and high interest rates. Conditions such as these were notable in 2022, slowing the overall growth of the sector within the United States. Moreover, geopolitical conflicts greatly influence the performance of the materials sector as forces of international supply and demand dictate its total return. For instance, throughout 2022 China engaged in strict COVID policies, closing its borders to travel and enforcing severe lockdown protocols. These efforts directly impacted the metals and mining industry, as copper experienced volatile price movements, reaching a nearly two-year low of $3.30. However, despite a copper downturn, the mining and metals industry maintained positive returns, displaying the high diversification among this sector. Despite its cyclicality, these industries highlight Material’s unique response to the macroeconomic environment through their significant diversification.
In 2022, the Materials Sector represented 2.76% of the S&P 500 index at year end. The S&P 500 Materials Index (S5MATR) experienced negative returns of 13% throughout the year. Much of this volatility was due to the economic uncertainty of 2022 given interest rate hikes, inflationary pressures, and geopolitical conflicts. However, in terms of earnings, the index saw a 33% increase from year end 2021. This trend is further displayed in their 26% increase in EBITDA and a 5% rise in earnings in Q4 of 2022. With an anticipated increase in demand for mining, metals, and chemicals, the sector’s earnings are forecasted to grow by 9% annually according to analyst consensus.
The chemical and mining & metal industries generated the most revenue throughout 2022, with mining reaching a high of $3.67 trillion. Worldwide infrastructure initiatives and the transition to green energy are catalysts to the success of the mining and metals industry. Despite their higher comparative revenue, chemicals saw a 15% fall in its one year revenue growth rate. Other industries saw similar patterns, emphasizing construction materials, which saw a 46% fall in growth, as well. This pattern may correlate to the fall in U.S. housing starts throughout the year. However, Materials’ final two industries––forestry and containers & packaging––saw positive revenue growth for the year, demonstrating again the diversity of the sector.

The forces of supply and demand are key drivers of the Materials Sector, correlating directly to changes in the business cycle and the overall macroeconomic environment. Material industries such as mining and metals face extreme price sensitivity, as buyer demand dictates the price of commodities and raw materials. Because Materials is largely influenced by the health of the global economy, it serves as a leasing indicator of consumer spending and consumer confidence. The housing market plays a large role in the Materials Sector, as it influences both construction materials and the timber & forestry industries. Joined with soaring interest rates, housing starts within the United States fell significantly during 2022. Single family starts were down 10% from the previous year, in addition to a fall of 30% YoY in total housing permits. However, on an upside, total housing units under construction were 12% higher than a year ago, which may benefit the construction industry going into 2023. Moreover, chemicals are anticipating growth as the industry takes a more globalized approach in terms of demand and competition. New products that increase energy efficiency and reduce reliance on oil-based products are becoming key drivers of chemical innovation. With the emergence of multinational chemical companies and growing demand in developing countries, high earnings and sales are anticipated to continue in the following years.
The United States continues to reiterate its commitment to driving the green energy transition through a series of 2022 progress reports. Their initiatives range from supporting electric vehicles to investing in clean energy power operations in hopes of reducing net emissions. Given clean energy’s reliance upon raw materials, this transition stands as the largest opportunity

facing the Materials Sector. Industries such as metals & mining and chemicals will see the largest impact, as these commodities have a finite supply and must be sourced internationally. Not only will demand increase in the near-term, but sustainable innovations will sustain long-term demand as well. For instance, copper stands as a leading renewable resource given its unique ability to be recycled without a loss of performance. Through its high conductive capabilities, copper is found in EVs, wind turbines, and even infrastructure that stores renewable energy. The green energy market is anticipated to grow at a CAGR of 9% until 2030, stimulated by local and national incentives to engage in green protocols. Such trends will increase both the demand and the earnings of this sector as a whole, giving them a positive future outlook.
The global economy, geopolitical conflicts, and fluctuating demand stand as the largest risk factors to the Materials Sector. In an attempt to combat rising inflation, the Federal Reserve introduced interest rate hikes beginning in March of 2022, which have continued to increase into 2023. Throughout the year, the United States saw the overnight lending rate reach 4.32 in December and inflation peak at 9.1% in June. By year end, while inflation fell, it still remained above average at 6.5% in December. With the overnight lending anticipated to continue rising, these policies serve as a prominent threat to Materials.
Through its various industries, the Materials Sector remains diversified and in demand through international competition and limited supply of raw materials. This sector has a direct impact on construction, manufacturers, and producers, making its multifaceted character attractive to investors. While material investments favor a bullish market, they can be used to hedge risk, increase exposure, or simply diversify one’s portfolio.
 Figure 2

 ROLAND GEORGE INVESTMENTS PROGRAM