


Business Performance Company Sub-consultant to Project Cornerstone St. Louis County Public Survey: Topline Summary www.bizperformanceco.com March 22, 2023


• Project Cornerstone is an update of the St. Louis County Facilities Master Plan, which offered suggestions to maximize efficiency and reduce real estate footprint by consolidating the central Administrative Building and satellite sites.
• This report consists of results and conclusions from the quantitative phase of data collection among users of services (public survey). The research in this report uses input from qualitative interviews with key stakeholders, including St. Louis County Staff and residents, about their opinions regarding the County’s need to reduce its footprint and consolidate offices and services.
• The Business Performance Company, a subcontractor of Vector Communications, conducted an online quantitative survey with users of St. Louis County services. Potential respondents were selected from a panel of St. Louis County residents.
• The survey was available between February and March 2023. Over 5,000 St. Louis County residents were sent invitations via email to complete the survey. Participation was voluntary and a total 433 St. Louis county residents completed the online survey. A drawing for ten, $100 honorariums was used to incentivize residents to participate.
• Several facilities included in this study are underutilized by residents, including West Satellite, South Health Center and Clayton Police HQ, with 90% of St. Louis County residents reporting they do not visit these locations. It is worth noting that the 10% of residents who use these locations reside in all parts of St. Louis County, with higher concentrations of visitors coming from the nearby surrounding area. Roughly 25% of residents visit two or more St. Louis County locations each year.
• The purpose for most resident visits to St. Louis County Government locations is to pay taxes (68%). The Department of Revenue and the Assessor’s office are the most visited departments by 47% and 28% of residents, respectively.
• Residents visit specific St. Louis County Government locations mainly because of the available in-person services (48%), and the location is convenient (47%). Some residents also visit because services are not available online (22%). Results suggest 30-minute travel time is the threshold for Government facilities to be considered conveniently located. Only 13% of residents who report travel times of more than 30 minutes report they visit due to convenient location.
• One of the drawbacks of visiting St. Louis County Government locations is staff access, with top priorities for improving services being appointment scheduling, multi-service windows, and better access to staff. One resident explains, “I have just had to wait in line for a very long time the few times I went. More available staff would make a huge difference.”
• If services are expanded, more than 80% of residents are likely to use online interactions. Furthermore, about 75% of residents who do not visit any of the locations interact with St. Louis County Government online. Expanding and improving access to online services could alleviate some of the stress points associated with in-person interactions (e.g., long lines, wait-time, staff shortages, etc.). The most useful online services that residents mention are having the ability to review/pay taxes, complete DMV services such as car registrations, and renew driver’s license. Residents would also like to communicate with employees online via live chat or virtual appointments (30%), as one resident suggests, “Still incorporating a chat feature or online features to reduce the amount of in person visits would be really helpful…”
• Residents from all areas of St. Louis County overwhelming support the idea of consolidating locations and services (78%). Residents who use the Northwest Crossing are less likely to support the idea and may need additional benefits and/or assurances. Having free parking, centrally located around other services residents use and offering a one-stop shop will improve customers’ experiences while visiting St. Louis County Government locations.
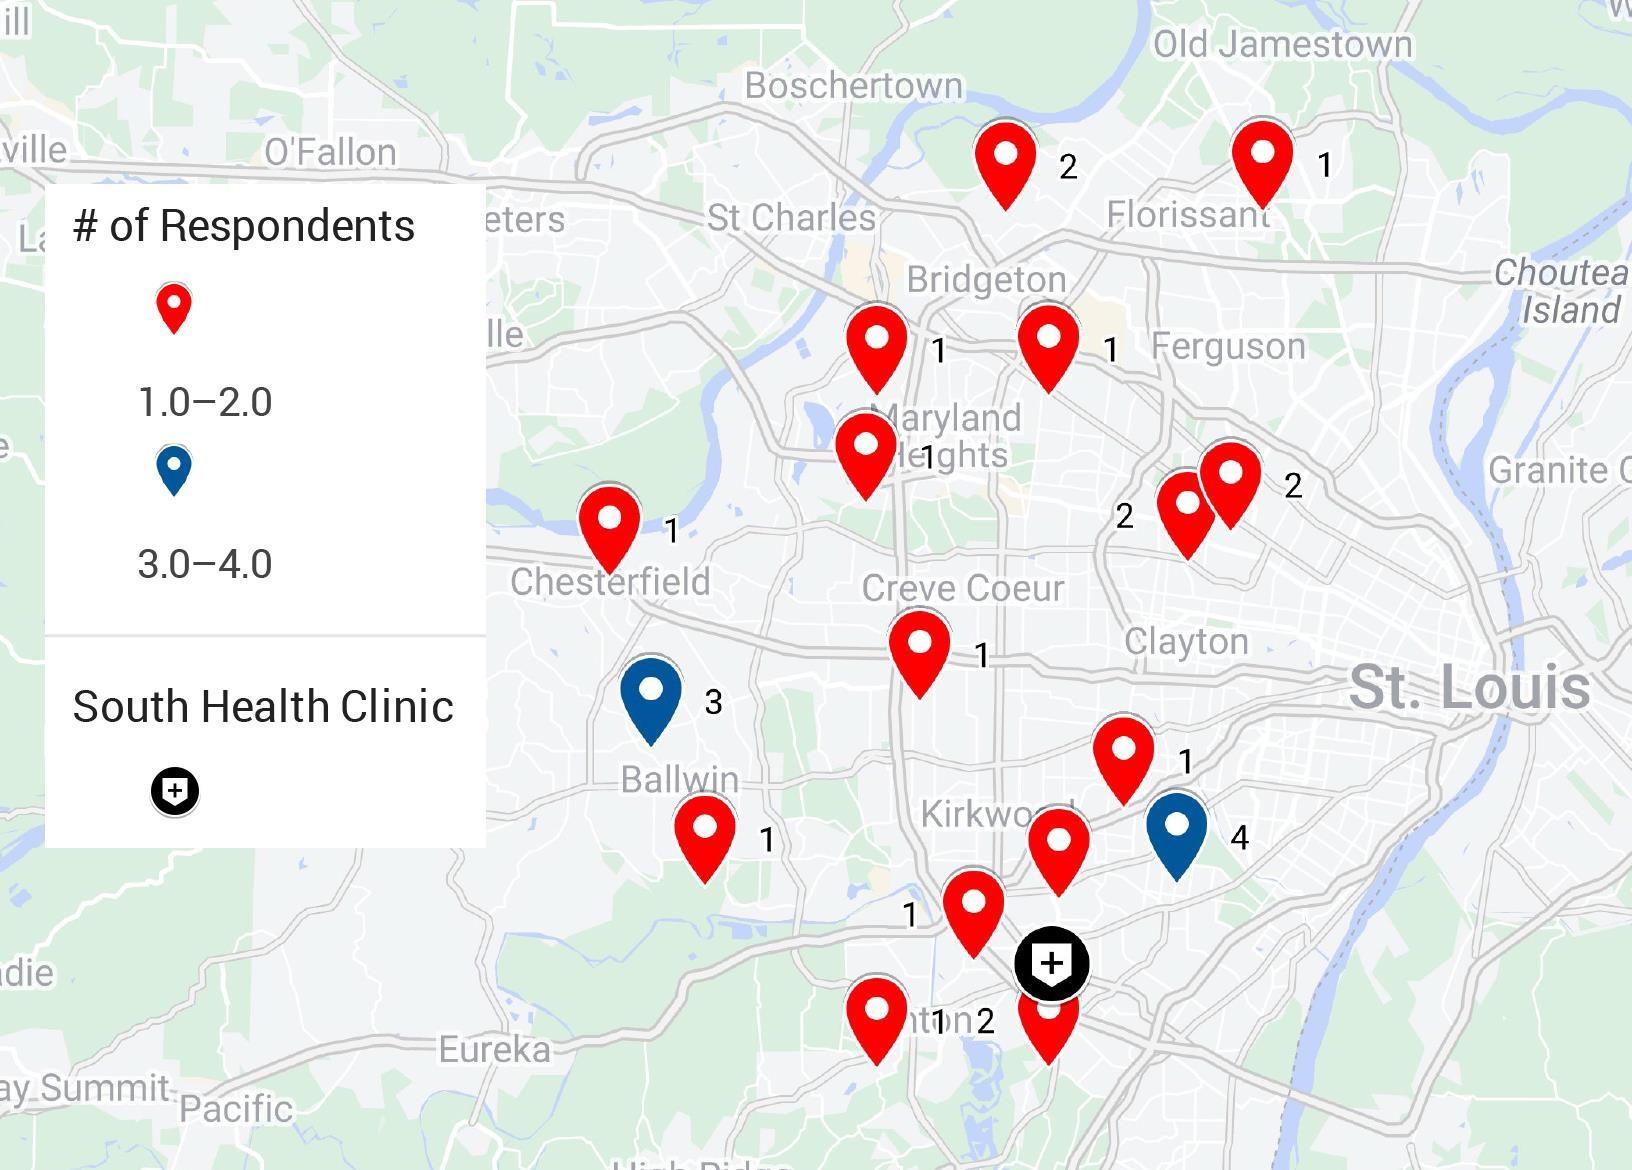
• In total, 433 residents of St. Louis County completed the survey between February and March of 2023.
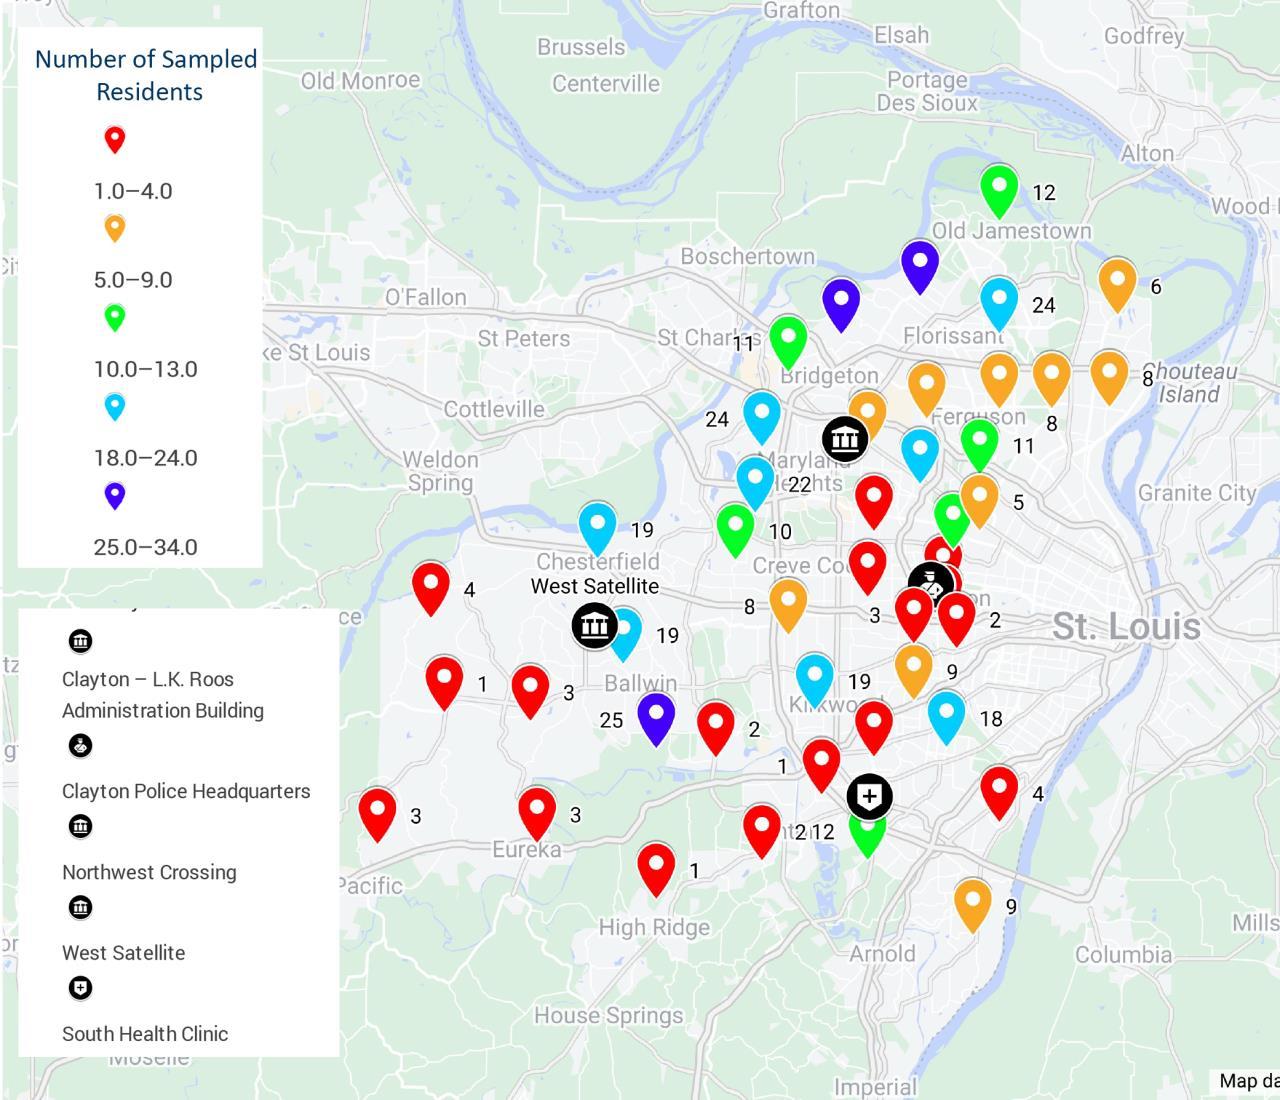
• The adjacent map shows the number of respondents who completed the survey from different areas of St. Louis County. Participants in this study were required to reside in specified St. Louis County ZIP codes (see actual ZIP codes in the Appendix). The margin of error associated with a sample size of 433 is this study is +/-4.7.
• To ensure representation, quotas were applied based on ethnicity. The final counts are as follows:
• Most customers use personal vehicles for transportation to St. Louis County facilities (97%).
In total, 62% of residents report they visit one or more of the St. Louis County Government locations annually. About 29% of residents visit two or more different St. Louis County Government facilities in a given year. Among the 38% of St. Louis County residents who do not visit any of the locations, most interact with St. Louis County Government via online services (75%) or phone (40%).
How Respondents Who Do not Visit Interact with St. Louis County Gov’t.
I do not interact with St. Louis County Government
Source: Pie - Please estimate the number of times each year, you visit any of the locations . Base=433. Bar- How do you interact with St. Louis County Government? Base=166.
Northwest Crossing and L.K. Roos Admin. Bldg. are visited by 39% and 35% of residents, respectively, most of whom visit one to two times annually. Other facilities such as West Satellite, Clayton Police HQ, South Health Clinic are underutilized by residents, with 90% or more of resident reporting they do not visit these locations. This may be due to several factors, including the services offered and the location of the facility.
Source: Please estimate the number of times each year, you visit any of the locations . Base=433.
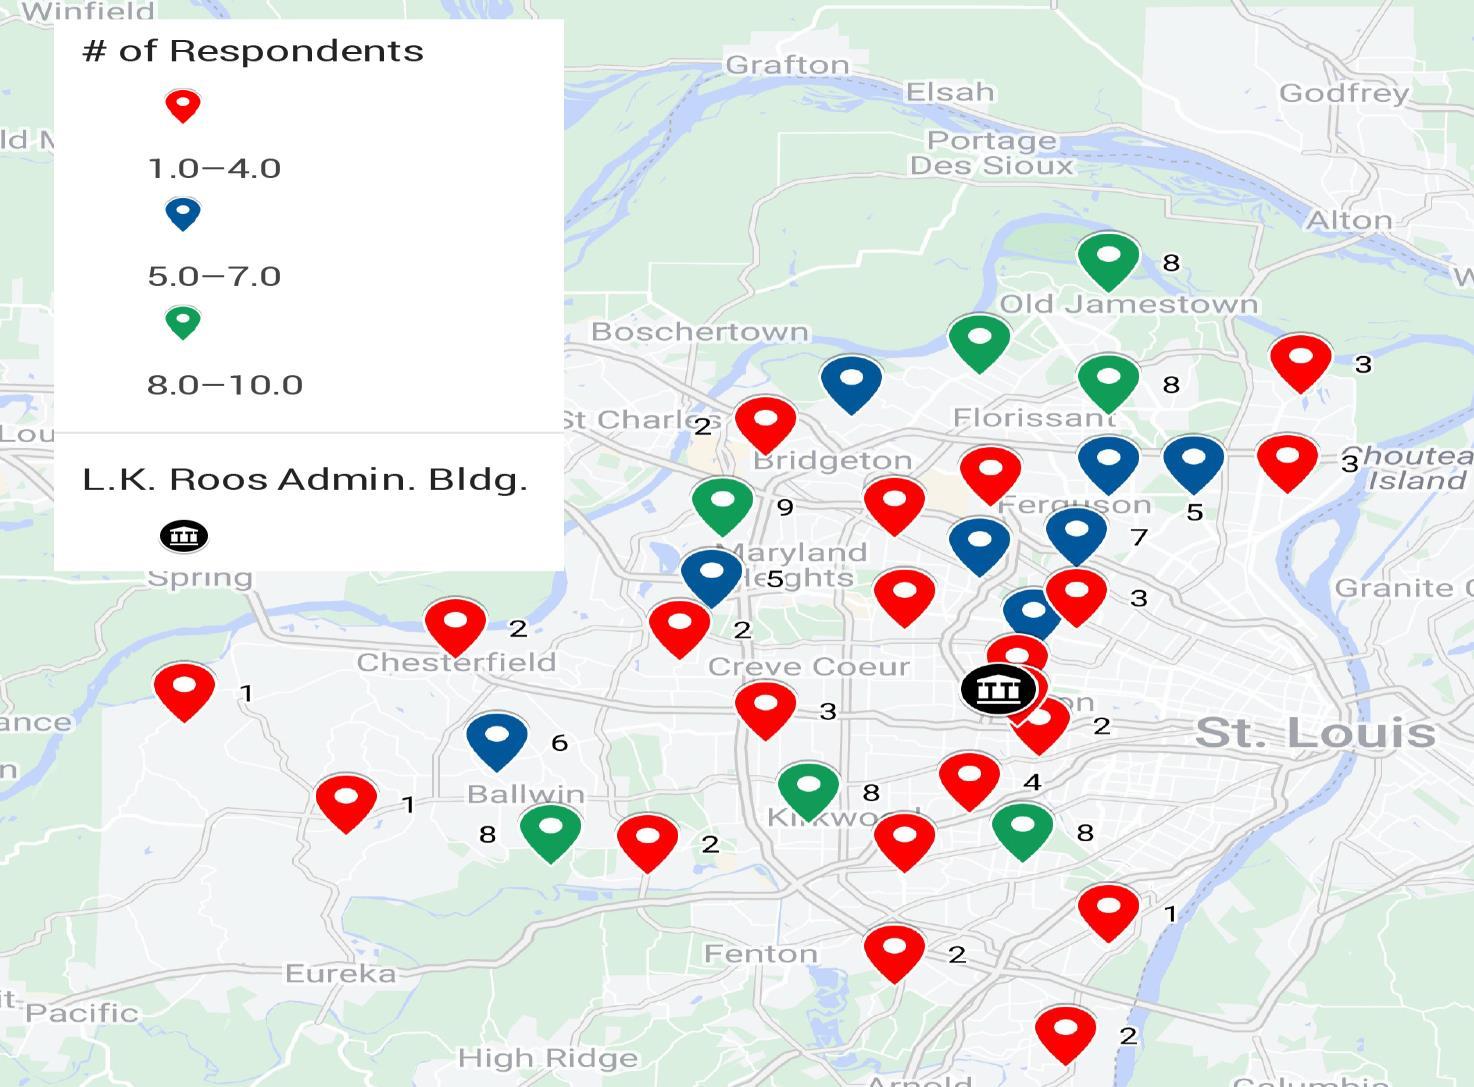
The adjacent map shows ZIP codes of St. Louis County residents who visit the L.K. Roos Administration Building in Clayton are spread out over a large area of St. Louis County (39%). Travel times are less than 30 minutes to get to the L.K. Roos Admin. Bldg. (77%) and most residents spend more than 30 minutes at the facility (57%).
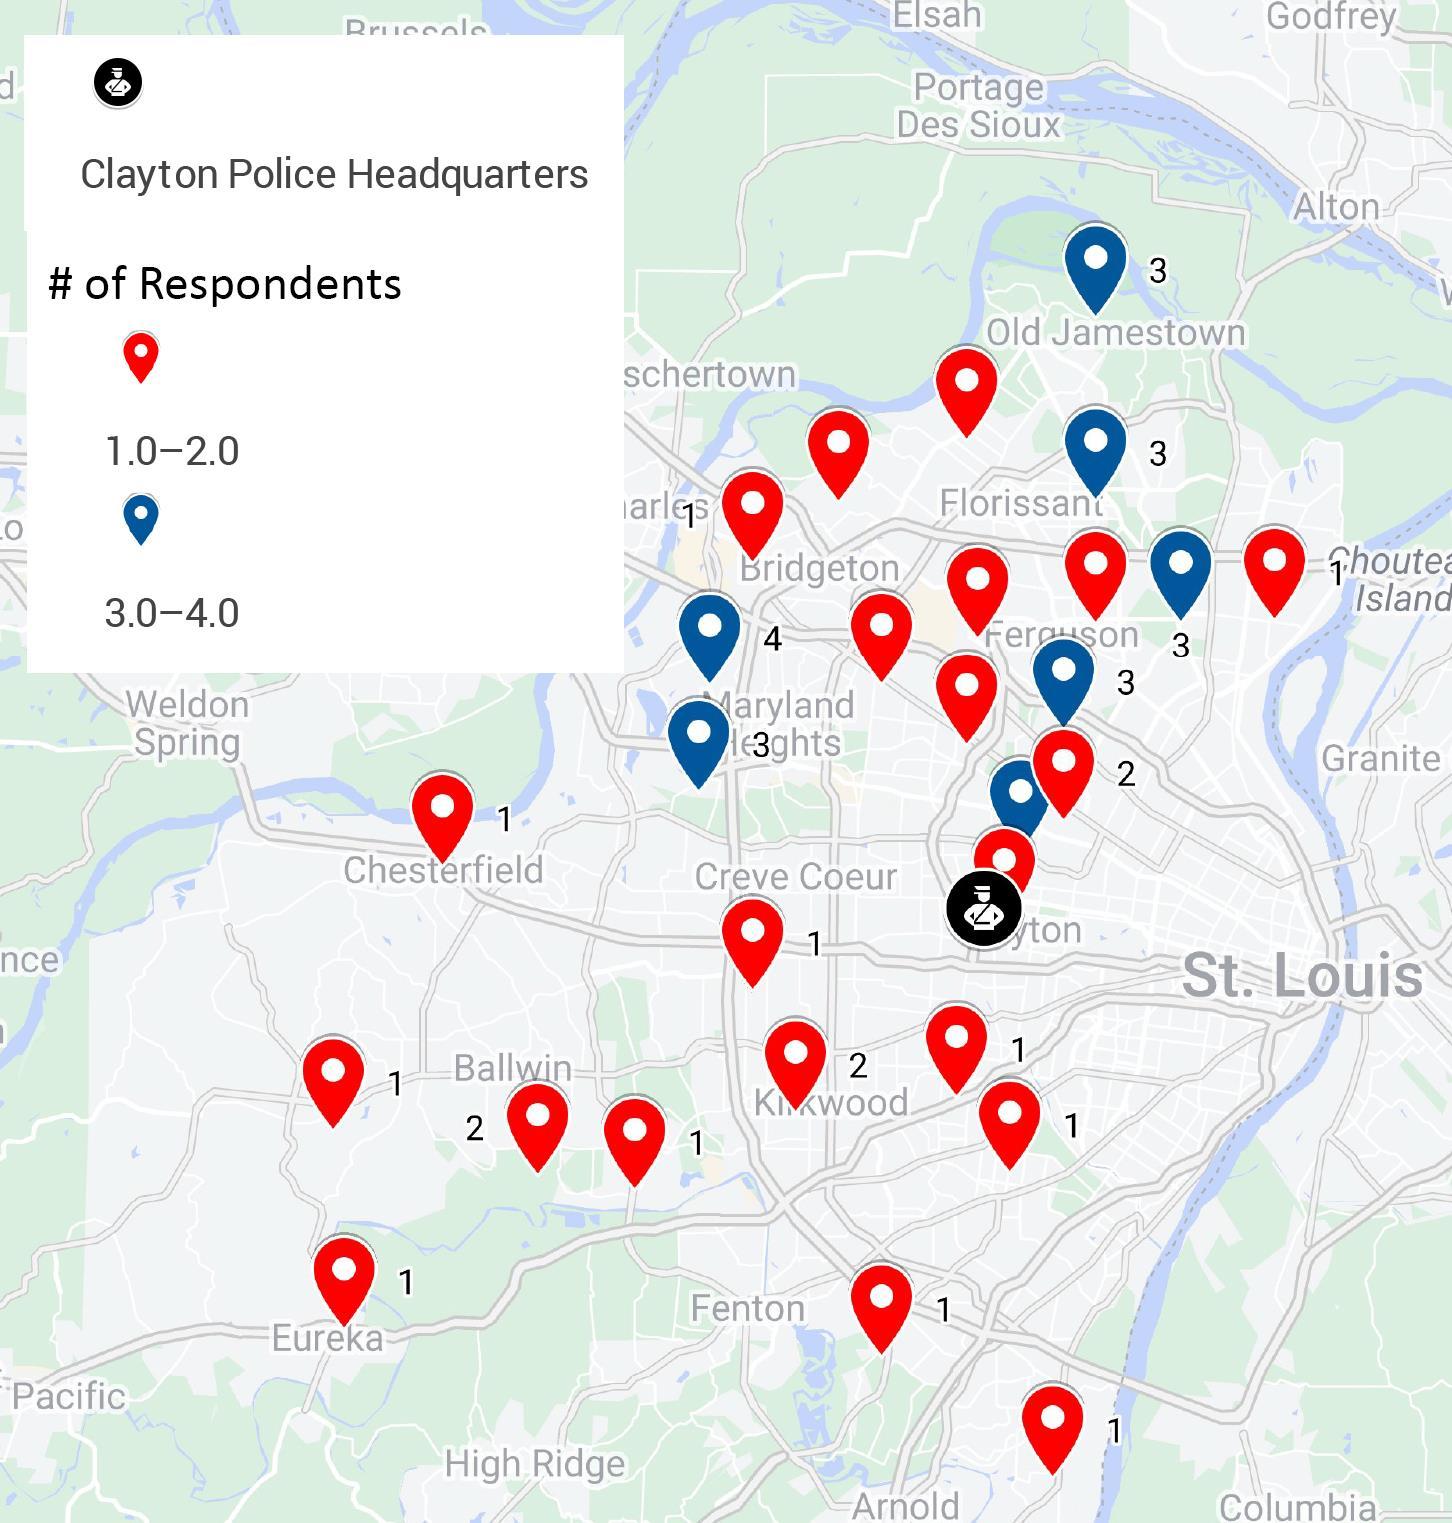
The adjacent map shows the ZIP codes of St. Louis County residents who visit the Clayton Police HQ (11%) are mostly concentrated in Northern areas of St. Louis County. Travel times are less than 30 minutes to get to the Clayton Police HQ (78%) and most residents spend less than 30 minutes at the facility (56%).
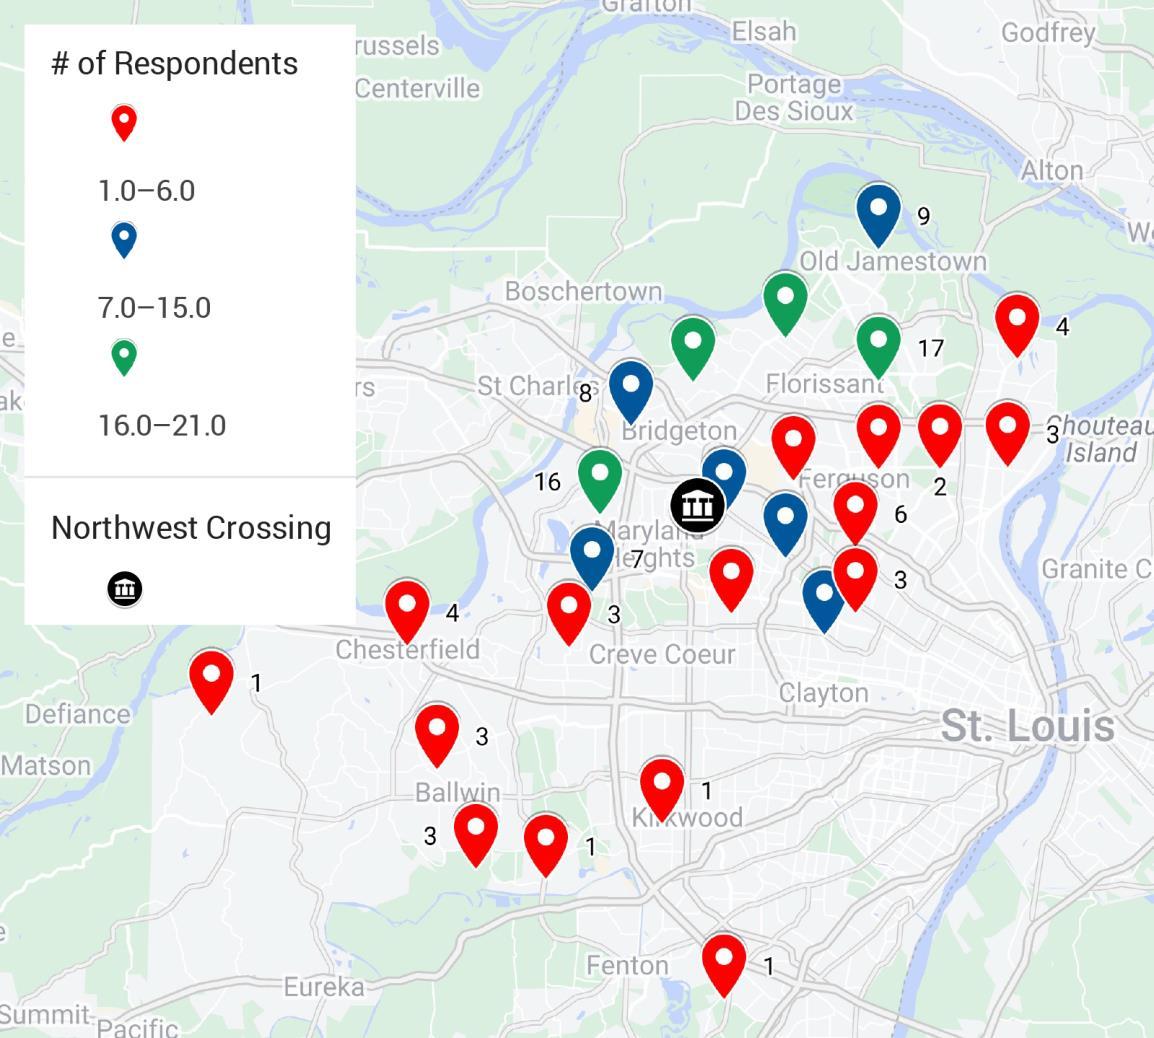
The adjacent map shows ZIP codes of St. Louis County residents who visit Northwest Crossing. Of these, (39%) are mostly concentrated in the surrounding area of North County. Travel times are less than 15 minutes generally to get to the facility (57%) and residents generally spend less than 30 minutes at the facility (58%).
The adjacent map shows the ZIP codes of St. Louis County residents who visit the West Satellite location (6%). Travel times are generally less than 30 minutes to get to the facility (80%) and residents generally spend less than 30 minutes at the facility (70%), based on the few respondents who use this location (n=30).

The adjacent map shows ZIP codes of St. Louis County residents who visit the South Health location (6%). Most residents’ travel time is less than 30 minutes to get to the facility (84%) and they spend less than 45 minutes at the facility (76%), based on the few respondents who use this location (n=25).
Most residents visit St. Louis County Government locations because in-person services are available (48%) and the location is convenient (47%). It is not clear whether residents visit because services are available in-person and not online or because residents prefer in-person services. Results suggest travel times over 30 minutes are not considered convenient for residents. Over half of residents who report convenient location as their reason for visiting report traveling 30 minutes or less to St. Louis County Government locations, compared to 13% who report travel times of more than 30 minutes.
Source: For what reasons do you visit the St. Louis County location(s) you primarily use? Base=397.
Thinking about the St. Louis County facility you primarily visit, on average, how long does it take you to get there and how long do you typically stay? Base=130.
The most visited departments are the Department of Revenue and the County Assessor’s office. Residents visit St. Louis County Government locations mostly to pay taxes (68%). Moving some of the functions of these two departments online will reduce the number in-person visits necessary.
*Other responses not shown account for less than 5% each.
Source: Left - Which department or division do you primarily visit in a given year? . Base =433.Right - What are the primary reasons you interact with St. Louis County? Base=433.
Staff access is an area that residents say will improve their experiences while visiting St. Louis County Government facilities. This includes appointment scheduling (33% of residents), multi-service windows (31%) and more access to staff (24%). Most residents contend long waits and not enough staff are obstacles for interacting with St. Louis County Government employees.
Source: Left - What are the top two priorities for improvements to the St. Louis County location you visit most that would improve your experience while visiting? . Base =433. Right-What, if anything, represents an obstacle when interacting with St. Louis County employees? Base =433.
In addition to more staff access, most residents agree free parking will improve their experience in visiting St. Louis County Government facilities (82%) and being centrally and conveniently located by other services residents may use, such as banks, grocery stores, etc.
Source: Bar chart- Please rank only the amenities that you feel would make these facilities most useful and customer-oriented. Base =433. Pie chart - If the improvements you selected above were made (i.e., What are the top two priorities for improvements to the St. Louis County location you visit most that would improve your experience while visiting?), how likely do you think it would positively impact the level of customer service you receive? Base=397.
Virtual
A relaxed environment with some structural separation between employees and the public or virtual meetings are preferred over private enclosed meetings when interacting with St. Louis County employees. Virtual meetings appeal to about 30% of residents.
In lieu of in-person meetings, most residents express interest in using online services (83%) if available and for some services, mainly tax payments, Department of Revenue services, and DMV services. Residents would also like the ability to interact with staff via live chat features and virtual online appointments.
Likelihood to Use Online Services If Available
Taxes, tax payments, revenue services, pay bills
Live chat, chat feature
Renewals (permits, notorary, drivers license)
Vehicle registration, titles
Retrieve documents
Licenses/Permits
Virtual appointments, scheduling
Most Beneficial Online Services* Very unlikely
Voting
Everything, all
Source: Pie chart - If more services were online, how likely would you be to use them in the future? Base=433.
Source: Bar chart - What on-line services would provide the greatest benefit to your interactions with County services? Base=272.
* Open-ended responses coded into categories for reporting.
Shifting priorities to improve and expand online services and reduce in-person interactions will offer residents an additional resource to consider for interacting with county government that will alleviate some of the stress points associated with in-person interactions. Just over half of St. Louis county residents express satisfaction with both their in-person (55%) and online interactions (53%) with St. Louis County Government. Improvements are likely to have a positive impact on residents’ experiences while visiting St. Louis County Government facilities and thus are likely to increase satisfaction.
Source: In-person - Thinking about your in-person interactions with St. Louis County, how would you describe your overall satisfaction? Base=417. Online - How would you describe your overall satisfaction regarding your online interactions with St. Louis County? Base=433.
Residents were provided information about consolidating services and locations (right). Overwhelming residents would support the idea (78% very/somewhat likely to support).
St. Louis County is considering consolidating services and existing locations into new comprehensive satellite locations. Benefits for this strategy include improved customer interaction, more accessible parking, and improved operational and energy efficiency. For example:
• Providing a new customer service-oriented facility in a centrally located County location as an alternative to Clayton
• Consolidating West and South satellites into an accessible, customer service-oriented facility
Source: How likely are you to support this idea? Base=433.
While the majority of residents are likely to support consolidating services in any group, fewer residents who visit Northwest Crossing are likely to support the measure than other residents. Since Northwest Crossing is in North County where a higher concentration of African Americans reside, it is expected that African Americans are less likely to support the measure than other residents.
Source: How likely are you to support this idea? “Other” locations (n=13) not shown.