REAL ESTATE MARKET REVIEW Local
FEATURED CONTENT
4: MARKET COMMENTARY
6-16: MARKET DATA BY TOWN
18: MEET THE TEAM
22: THE SUE ADLER TEAM EDGE
DearNeighbor,
We at the Sue Adler Team firmly believe that knowledge is the foundation for empowered decision-making. With that, we present to you our annual 2022 Real Estate Market Review. Each year since 2015, we extract and comb through the local market data from the previous 12 months.We analyze it, review the trends, and provide you with a comprehensive report. By sharing this data with the community, we aim to equip you with the context you need to accomplish your real estate goals and stay informed of local real estate trends.
2022 was another record-breaking year in real estate within the Midtown Direct train line towns. Inventory was down 40% since 2019 and 10% since last year, continuing to set the tone for the market. Low inventory, coupled with high demand, caused prices to rise throughout the first half of the year and ultimately stabilize near the peak, during the summer, fall and winter months. The average home sale price in 2022 marks the highest ever in GMLS history. From 2021 to 2022, it climbed by $127,563 with the average home selling for $1,184,229. Overwhelming demand also paved the way to a lower average days on market and a higher average original list-to-sale price ratio. The average days on market (including attorney review) totaled 24 (down six from the year prior) and the average list-to-sale price ratio rose by 4% to a whopping 106%. In other words, a buyer needed to pay, on average, 6% over list price to purchase a home in this competitive
SUE ADLER
market. For Sue Adler Team listings in 2022, our home preparation, pricing, and marketing strategies brought our 105 sellers an average 8% more than their list price.

Spring 2022 was undoubtedly one of the hottest real estate markets on record, with offers flooding in before a home ever hit the market. Lines were forming steadily at open houses, and sellers sat squarely in the driver’s seat. As July and August rolled around, rising interest rates lowered affordability and we witnessed a brief pause that coincided with our typical summer market. This was heightened by buyer fatigue that set in after a challenging spring market. The fall market was similar to the spring, with one major difference: even fewer homes for sale! The inventory available in the fall and now into 2023 is simply not enough to meet the demand, thus keeping our local market very strong for sellers. We are seeing fewer transactions due to, not a lack of buyers, but a lack of sellers!
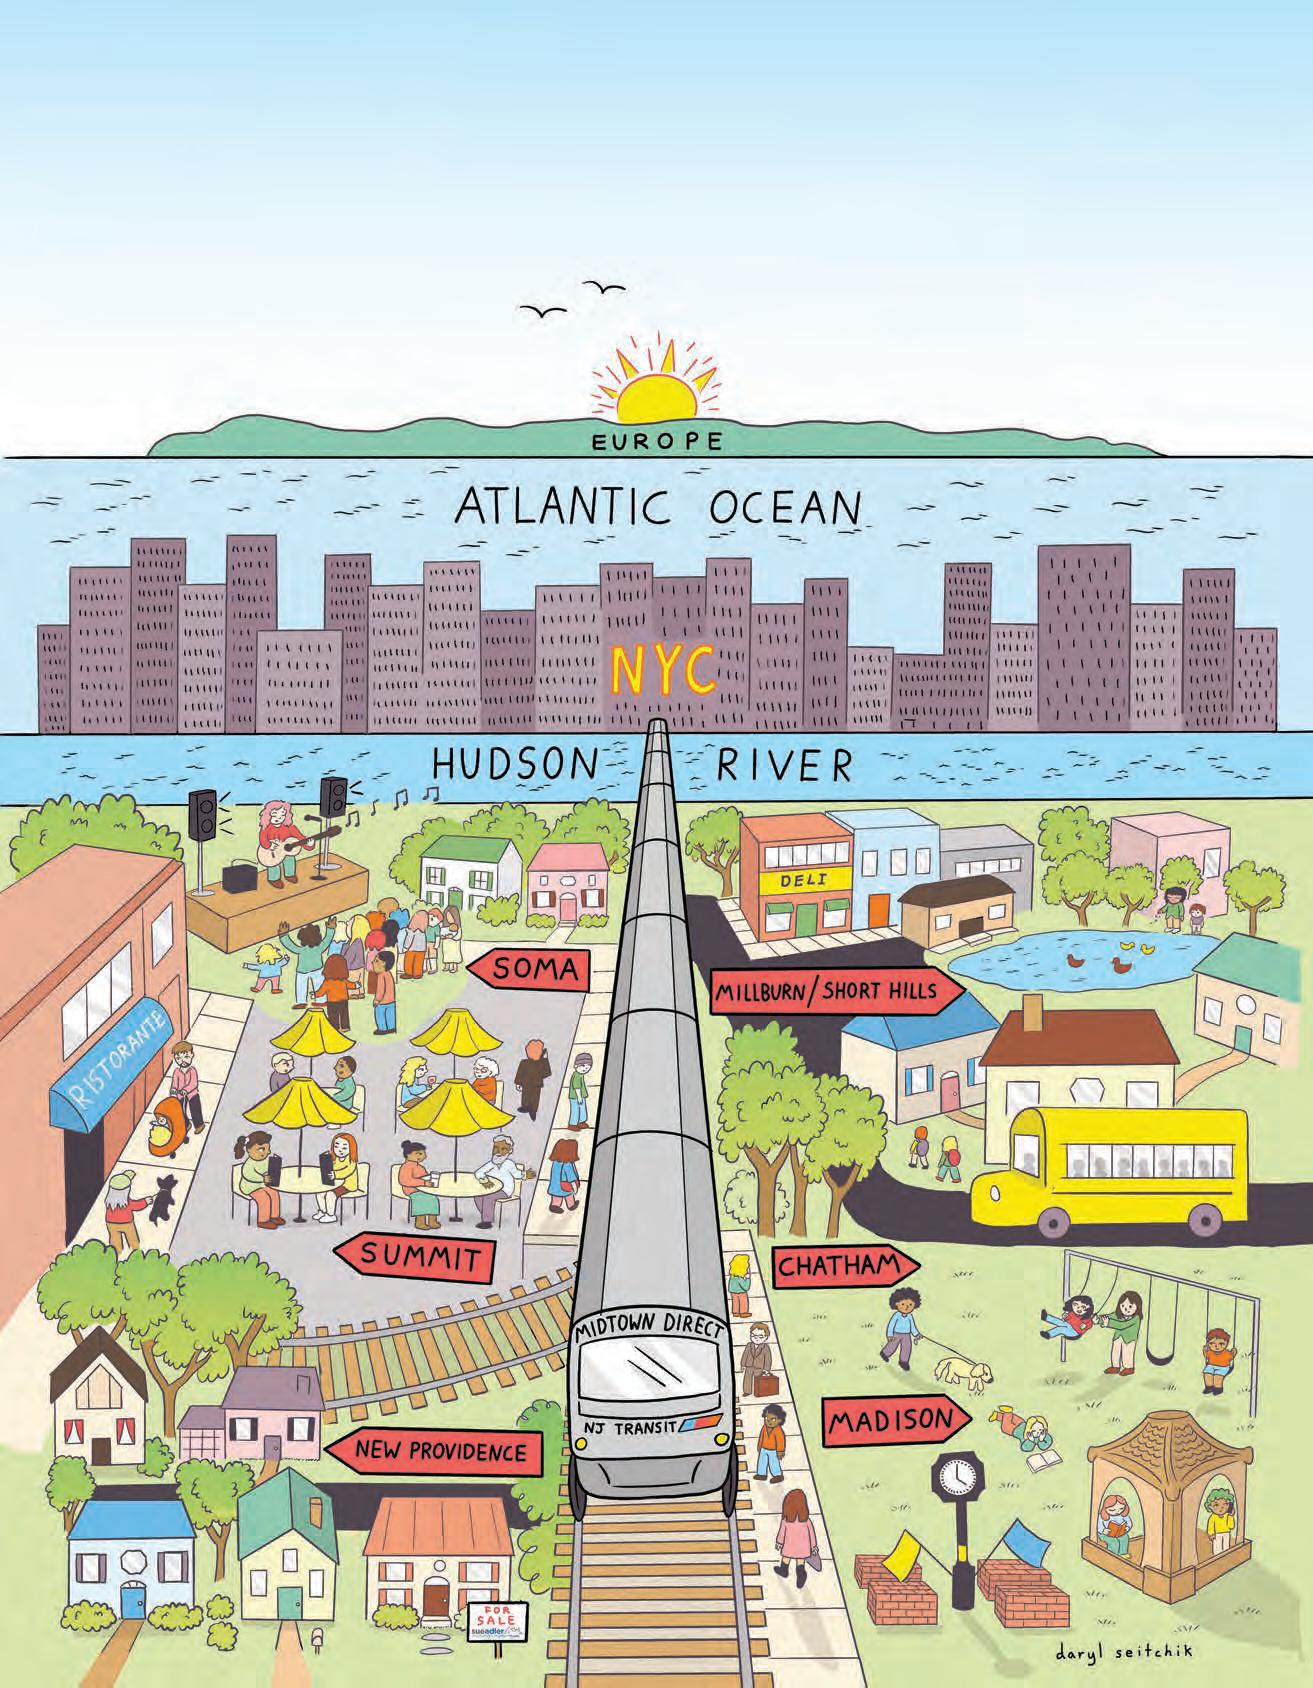
 Cover illustration by Daryl Seitchik, Sue Adler’s daughter www.darylseitchik.com
Most of you have likely seen the news headlines these past six months regarding a national “shifting” real estate market. Interestingly, we are not yet seeing this in our local markets. Why, you may ask, is northern New Jersey bucking national real estate trends? We attribute this to:
1. LIFESTYLE
We are a lifestyle market, meaning buyers looking to move into the Midtown Direct train line towns typically do so for specific lifestyle reasons, including award-winning schools, incredible communities, more space (both interior and exterior), and a desire to be close to their friends and family. Of course, with many companies asking their employees to return to office, even if part time, the easy commute to NYC keeps our train line towns at the forefront of desirability. Because the homes in our towns check all of these boxes, we are the obvious choice for buyers looking to move out of the city.
2. HIGH RENTS
Whether purchasing or renting in the area, the cost of living is high. In other parts of the country renting is a viable option to delay purchasing, especially while interest rates are high. However, rents are at an all-time high, both locally and in Manhattan, leaving many buyers opting to “bite the bullet” and purchase a home and gain their own equity, rather than continuing to pay down their landlord’s mortgage.
3. BUYER & SELLER FINANCIAL STRENGTH
In this competitive market, it is not unusual to see buyers opting to waive mortgage contingencies or purchase homes in
as-is condition to set themselves apart. As compared to other parts of the country, more of our sellers have a lot of equity in their homes, positioning them well to downsize or upsize. Also, the cost of construction is high, so purchasing an existing home, even with high mortgage rates, made the most sense in 2022 and continues to for many.
Early 2023 is proving to be another very strong real estate market! Demand is still extremely high, while the number of desirable homes for sale is simultaneously low. If you are thinking of selling, you have NOT missed the market.

In other news, the Sue Adler Team is extremely grateful for the opportunity to serve our local communities. Through our 100th Home Sale Charity program, we were again privileged to donate in 2022 to our local education foundations,volunteer rescue squads, local food banks, Alzheimer's Research, as well as volunteer at Grace Giving in Summit. We will continue the spirit of giving throughout 2023.
We are immensely grateful for the 285 families that trusted us to help them reach their real estate goals in 2022, most of whom were referred to us by clients, friends of clients, word of mouth, and other realtors. We cannot thank you enough! If we have not had the pleasure of meeting you before, we hope to meet you in 2023! Give us a call at 973.949.0306 or email info@sueadler.com to get started!
We are…yours to count on!
Sue Adler
SUE ADLER TEAM’S MARKET COMMENTARY ON GSMLS DATA*
AVERAGE DAYS ON MARKET
The average days on market in 2022, at only 24, is the lowest ever in GSMLS history. Historically-low inventory, coupled with high buyer demand, continued to create a “perfect storm,” like sellers in 2021 experienced. Even in the second half of the year, homes that were priced right and prepared for sale, routinely sold within the first or second weekend on the market. The Sue Adler Team’s average days on market (including attorney review) was only 11, which is 54% less than the market average.
ORIGINAL LIST TO SALE RATIO
The average original list-to-sale price ratio across the 1,723 sales in our train line towns, was an eye popping 106%, compared to the Sue Adler Team’s 108%. Another impressive stat, this overall average indicates that a home’s winning bidder paid nearly $75,000 over list price. Of the Sue Adler Team’s 105 list-side transactions, the average home sold $144,000 above list price.
SELLING PRICES
The average sale price across the Midtown Direct train line towns totaled $1,184,229, the highest on record. Appreciation levels were unprecedented, as low supply and high demand continued to drive up pricing. While the fall and winter showed that this might level off in 2023, through the first two months of the year, we continue to see record-breaking prices across the board.
INVENTORY & SALES
Inventory is THE key metric when analyzing the real estate market. Throughout 2022, we heard people say, time and time again, “there is nothing for sale!” and the stats certainly support this. 2022 bested 2021 as the year with the fewest new listings to hit the market in MLS history. In 2019, a comparably strong year for real estate, there were 3,137 homes for sale, meaning we were 1,000 homes short in 2022. When inventory falls, it naturally curbs total sales, giving the false impression that the market is slowing, when in actuality it is a supply and demand issue, no different than what we experienced with toilet paper in April 2020.
4 THE SUE ADLER TEAM
43 30 24 20192020 20162017201820212022 0 10 20 30 40 50 60 45 46 43 48
947,615 2017 898,437 2018 896,198 2019 913,363 2020 1,056,666 1,184,229 20212022 871,669 2016 800K 850K 900K 950K 1.0M 1.15M $1.2M
AVERAGE DAYS ON MARKET NUMBER OF SALES LIST TO SALE PRICE RATIO PRICE RANGE 2021 2022 CHANGE 2021 2022 CHANGE 2021 2022 CHANGE $1M AND UNDER 40 28 1,433 1,011 103.92% 105.98% $1M TO $2M 58 25 656 542 101.37% 106.73% $2M AND OVER 117 34 167 170 97.61% 99.85%
98 94% 96% 98% 100% 102% 104% 106% 108% 2016 96 2017 2020 97 2021 102 106 2022 2018 99 2019 99
InventorySales 2,447 1,692 0 500 1,000 1,500 2,000 2,500 3,000 3,500 201620172018 2,758 1,853 2019 3,062 1,793 2020 3,137 1,827 2021 3,069 2,140 2022 2,335 2,256 2,208 1,723
SALES BY TOWN
0 50 100 150 200 250 300 350 New Providence Maplewood 352 390 389 383 274 Millburn/Short Hills 269 296 369 395 327 Chatham BoroChatham Township 129 117 136 178 107 177 173 208 218 187 South Orange 237 267 292 283 186 Madison 197 161 204 198 166 Summit 281 252 363 405 307 151 171 179 196 169 400 450 *ALL DATA IS PER THE GARDEN STATE MLS **HOMES THAT SOLD "OFF MARKET" ARE ACCOUNTED WITH 0 DAYS ON MARKET HOME SALES BY PRICE RANGE** ALL DATA
2018 2019 2020 2021 2022
PERTAINS TO THE MIDTOWN DIRECT TRAIN LINE TOWNS

973.949.0306 www.sueadler.com 5 Outpacing the Market #1 TEAM IN GSMLS FOR 9TH STRAIGHT YEAR $315M IN VOLUME SOLD $91M MORE THAN THE #2 AGENT 284 FAMILIES HELPED BUY & SELL HOMES 108% AVERAGE LIST TO SALE PRICE RATIO $144,759 AVERAGE OVER LIST PRICE 105 SAT LIST-SIDE SALES 94% SOLD AT OR ABOVE LIST PRICE 11 AVERAGE DAYS ON MARKET 16 DAYS LOWER THAN MARKET AVERAGE SUE ADLER TEAM STATS: 2022 IN REVIEW*
360 TOTAL LISTED
PRICE RATIO 28 AVERAGE DAYS ON MARKET
HOUSING* MARKET OVERALL* 327 TOTAL TRANSACTIONS 104.06% AVERAGE ORIGINAL LIST TO
Millburn & Short Hills
2022 HOUSING OVERVIEW

2022 2021 2020 $1,000,000 AND UNDER 105 144 167 $1,000,001 TO $1,500,000 96 112 130 $1,500,001 TO $2,000,000 65 65 81 $2,000,001 AND OVER 94 94 105 $1,000,000 AND UNDER 95 133 139 $1,000,001 TO $1,500,000 94 101 101 $1,500,001 TO $2,000,000 60 74 68 $2,000,001 AND OVER 78 87 61 $1,000,000 AND UNDER 28 49 92 $1,000,001 TO $1,500,000 23 41 98 $1,500,001 TO $2,000,000 24 71 114 $2,000,001 AND OVER 38 133 243 $1,000,000 AND UNDER 105.65% 101.90% 95.79% $1,000,001 TO $1,500,000 105.05% 101.25% 94.03% $1,500,001 TO $2,000,000 107.73% 98.60% 94.96% $2,000,001 AND OVER 98.13% 93.61% 90.45% $1,000,000 AND UNDER 65 82 49 $1,000,001 TO $1,500,000 72 60 35 $1,500,001 TO $2,000,000 50 37 25 $2,000,001 AND OVER 40 30 10 6 THE SUE ADLER TEAM *ALL DATA IS PER THE GARDEN STATE MLS
2022
SALE
Many homes went under contract in 2021 and did not sell until early 2022, explaining why the number of transactions may exceed the number of homes listed for sale.
TOTAL LISTED TRANSACTIONS AVERAGE DAYS ON MARKET ORIGINAL LIST PRICE TO SALE PRICE RATIO SOLD AT OR ABOVE LIST PRICE
SUE ADLER TEAM 2022 LIST-SIDE









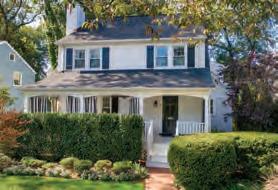


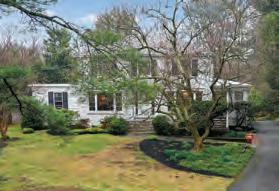

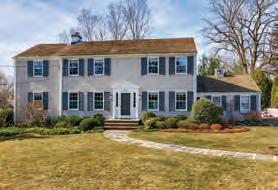

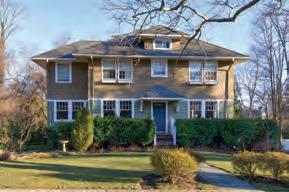





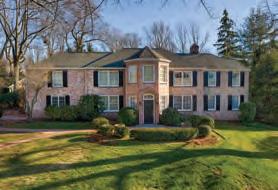

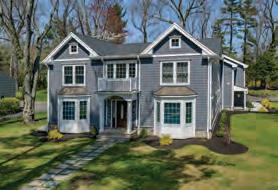

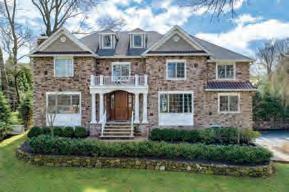


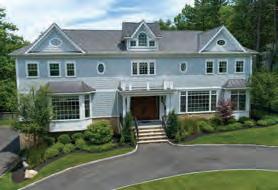
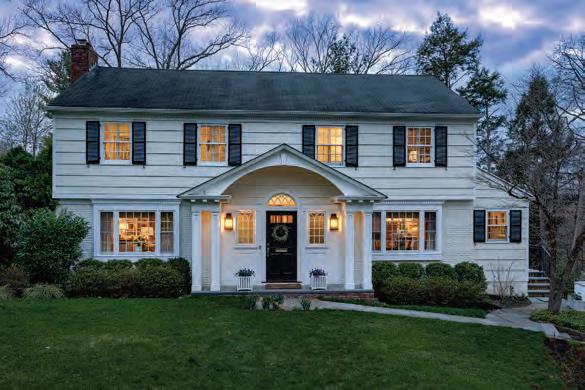
973.949.0306 www.sueadler.com 7 44 TOTAL TRANSACTIONS SUE ADLER TEAM* 2022 STATISTICS* $165K $ AVG. OVER LIST PRICE 110.61% SUE ADLER TEAM ORIG. LIST TO SALE PRICE RATIO 9 AVG. DAYS ON MARKET 121 Slope Drive | $3,300,000 58 Minnisink Road | $3,050,000 7 Lee Terrace | $2,850,000 7 Joanna Way | $2,625,000 62 Western Drive | $2,587,000 98 Minnisink Road | $2,400,000 155 Tennyson Drive | $2,275,000 9 Princeton Terrace | $2,215,000 32 Dryden Terrace | $2,160,000 9 Deer Path | $2,100,000 23 Grosvenor Road | $2,100,000 20 Park Road | $1,875,000 12 Chestnut Place | $1,850,000 17 Joanna Way | $1,527,000 19 Coleridge Road | $1,320,000 45 Hemlock Road | $1,315,000 55 Mohawk Road | $1,255,000 95 Cypress Street | $1,125,000 24 Hobart Avenue | $950,000 127 White Oak Ridge Rd. | $900,000 129 Cypress Street | $875,000 SUE ADLER TEAM 2022 BUY-SIDE SALES 25 Sylvan Way List $4,195,000 | Sale $4,050,000 15 Twin Oak Road List $2,925,000 | Sale $3,075,000 17 Oaklawn Road List $2,895,000 | Sale $3,000,000 7 Lee Terrace List $2,595,000 | Sale $2,850,000 7 Joanna Way List $2,195,000 | Sale $2,625,000 112 Fairfield Drive List $2,195,000 | Sale $2,600,000 98 Minnisink Road List $2,195,000 | Sale $2,400,000 278 Dale Drive List $2,150,000 | Sale $2,372,500 34 Wildwood Drive List $1,395,000 | Sale $2,050,000 10 Shelley Road List $1,895,000 | Sale $1,895,000 20 Park Road List $1,875,000 | Sale $1,875,000 21 Great Oak Drive List 1,525,000| Sale $1,853,500 12 Chestnut Place List $1,499,000 | Sale $1,850,000 73 Falmouth Street List $1,695,000 | Sale $1,745,000 41 Woodland Road List $1,465,000 | Sale $1,626,000 17 Joanna Way List $1,399,000 | Sale $1,527,000 51 Cedar Street List $1,275,000 | Sale $1,380,000 19 Coleridge Road List $1,195,000 | Sale $1,320,000 29 Claremont Drive List $1,299,000 | Sale $1,304,000 55 Mohawk Road List $1,255,000 | Sale $1,255,000 94 Cedar Street List $1,255,000 | Sale $1,250,000 24 Hobart Avenue List $950,000 | Sale $950,000 127 White Oak Ridge Road List $900,000 | Sale $900,000
SALES
2022 HOUSING OVERVIEW
8 THE SUE ADLER TEAM 2022 2021 2020 $500,000 AND UNDER 41 52 56 $500,001 TO $1,000,000 121 152 168 $1,000,001 TO $1,500,000 68 96 121 $1,500,001 TO $2,000,000 55 62 55 $2,000,001 AND OVER 58 46 56 $500,000 AND UNDER 39 54 43 $500,001 TO $1,000,000 105 147 145 $1,000,001 TO $1,500,000 65 102 98 $1,500,001 TO $2,000,000 49 58 41 $2,000,001 AND OVER 49 44 36 $500,000 AND UNDER 40 61 72 $500,001 TO $1,000,000 24 48 67 $1,000,001 TO $1,500,000 20 72 92 $1,500,001 TO $2,000,000 21 36 87 $2,000,001 AND OVER 34 91 111 $500,000 AND UNDER 100.38% 99.13% 97.03% $500,001 TO $1,000,000 103.18% 99.18% 96.34% $1,000,001 TO $1,500,000 108.52% 99.67% 96.28% $1,500,001 TO $2,000,000 107.97% 100.95% 93.75% $2,000,001 AND OVER 101.49% 94.44% 93.82% $500,000 AND UNDER 24 23 17 $500,001 TO $1,000,000 70 75 49 $1,000,001 TO $1,500,000 57 59 35 $1,500,001 TO $2,000,000 42 37 8 $2,000,001 AND OVER 30 14 7 Summit Many homes went under contract in 2021 and did not sell until early 2022, explaining why the number of transactions may exceed the number of homes listed for sale.
TOTAL LISTED TRANSACTIONS AVERAGE DAYS ON MARKET ORIGINAL LIST PRICE TO SALE PRICE RATIO SOLD AT OR ABOVE LIST PRICE 343 TOTAL LISTED 2022 HOUSING* MARKET OVERALL* 307 TOTAL TRANSACTIONS 104.45% AVERAGE ORIGINAL LIST TO SALE PRICE RATIO 26 AVERAGE DAYS ON MARKET 25 Knob


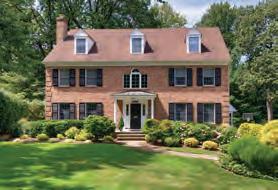

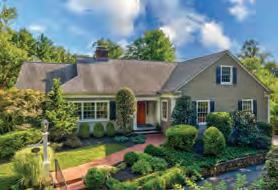


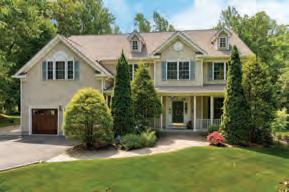

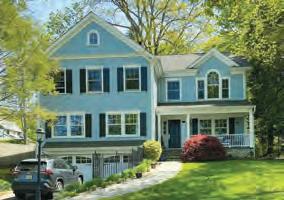










973.949.0306 www.sueadler.com 9 SUE ADLER TEAM 2022 LIST-SIDE SALES 35 Valley View Avenue | $4,050,000 124 Prospect Street | $2,650,000 8 Woodcroft Road | $1,750,000 18 Joanna Way | $1,725,000 8 Parkview Terrace | $1,600,000 35 Tanglewood Drive | $1,562,000 20 Stiles Road | $1,500,000 51 Gloucester Road | $1,125,000 2 Beekman Road | $910,000 15 Malvern Drive | $801,000 390 Morris Ave., Unit 36 | $320,000 SUE ADLER TEAM 2022 BUY-SIDE SALES 69 Edgewood Road List $2,895,000 | Sale $2,700,000 20 High Street List $2,195,000 | Sale $2,405,000 50 Gloucester Road List $1,595,000 | Sale $1,855,000 21 Plymouth Road List $1,595,000 | Sale $1,815,000 706 Springfield Avenue List $1,495,000 | Sale $1,655,000 18 Parkview Terrace List $1,495,000 | Sale $1,600,000 27 Pine Grove Avenue List $1,175,000 | Sale $1,526,000 34 Valley View Avenue List $1,175,000 | Sale $1,200,000 10 Montrose Avenue List $999,000 | Sale $1,060,000 74 Mountain Avenue List $1,050,000 | Sale $1,055,000 73 Canoe Brook Parkway List $899,000 | Sale $993,000 55 Karen Way List $799,000 | Sale $950,000 72 Mountain Avenue List 699,999 | Sale $775,000 9 Montrose Avenue List $699,000 | Sale $755,000 34 Glenside Avenue List $599,000 | Sale $650,000 25 Knob Hill Drive List $1,495,000 | Sale $1,785,000 133 Summit Avenue Unit 25 List $250,000 | Sale $250,000 35 Valley View Avenue List $3,650,000 | Sale $4,050,000 30 TOTAL TRANSACTIONS SUE ADLER TEAM* 2022 STATISTICS* $140K $ AVG. OVER LIST PRICE 109.79% SUE ADLER TEAM ORIG. LIST TO SALE PRICE RATIO 10 AVG. DAYS ON MARKET
2022 HOUSING OVERVIEW
10 THE SUE ADLER TEAM 2022 2021 2020 $500,000 AND UNDER 52 62 61 $500,001 TO $1,000,000 113 158 191 $1,000,001 TO $1,500,000 72 102 115 $1,500,001 TO $2,000,000 57 67 57 $2,000,001 AND OVER 43 36 37 $500,000 AND UNDER 53 58 50 $500,001 TO $1,000,000 107 153 153 $1,000,001 TO $1,500,000 64 110 83 $1,500,001 TO $2,000,000 44 48 38 $2,000,001 AND OVER 26 27 20 $500,000 AND UNDER 26 35 89 $500,001 TO $1,000,000 40 52 90 $1,000,001 TO $1,500,000 30 72 99 $1,500,001 TO $2,000,000 48 102 147 $2,000,001 AND OVER 32 95 137 $500,000 AND UNDER 101.86% 99.40% 96.59% $500,001 TO $1,000,000 102.64% 99.30% 94.50% $1,000,001 TO $1,500,000 104.05% 99.09% 93.71% $1,500,001 TO $2,000,000 100.80% 97.16% 94.02% $2,000,001 AND OVER 101.25% 96.43% 93.70% $500,000 AND UNDER 39 29 13 $500,001 TO $1,000,000 69 83 45 $1,000,001 TO $1,500,000 44 60 20 $1,500,001 TO $2,000,000 31 22 9 $2,000,001 AND OVER 20 9 2
Many homes went under contract in 2021 and did not sell until early 2022, explaining why the number of transactions may exceed the number of homes listed for sale.
Chatham
TOTAL LISTED TRANSACTIONS AVERAGE DAYS ON MARKET ORIGINAL LIST PRICE TO SALE PRICE RATIO SOLD AT OR ABOVE LIST PRICE 337 TOTAL LISTED 2022 HOUSING* MARKET OVERALL* 294 TOTAL TRANSACTIONS
AVERAGE ORIGINAL LIST TO SALE PRICE RATIO 36 AVERAGE DAYS ON MARKET
102.41%











973.949.0306 www.sueadler.com 11 31 Hilltop Terrace | $3,675,000 66 Samuel Way #8 | $1,999,249 12 Deer Run Circle | $1,850,000 59 Candace Lane | $1,645,000 42 Garden Avenue | $1,575,000 38 Hillside Avenue | $1,417,500 20 Dogwood Drive | $1,295,000 28 University Avenue | $1,150,000 73 Fairmount Avenue | $900,000 101 N Passaic Avenue | $655,000 248 Riveredge Drive | $457,500 SUE ADLER TEAM 2022 BUY-SIDE SALES 9 Red Road List $1,225,000 | Sale $1,417,500 21 Wynwood Road List $1,399,000 | Sale $1,400,000 23 Elmwood Avenue List $1,299,000 | Sale $1,380,000 165 Hillside Avenue List $1,195,000 | Sale $1,351,000 179 Weston Avenue List $1,095,000 | Sale $1,125,000 5 Regina Court List $979,989 | Sale $957,000 37 Glenmere Drive List $1,895,000 | Sale $2,010,000 131 Highland Avenue List $1,695,000 | Sale $1,720,000 68 Hall Road List $1,195,000 | Sale $1,478,000 33 Oak Hill Road List $1,435,000 | Sale $1,435,000 45 Broadview Terrace List $839,000 | Sale $895,000 33 N Summit Avenue List $829,000 | Sale $860,000 301 Riveredge Drive List $345,000 | Sale $345,000 98 Washington Avenue List $750,000 | Sale $801,000 357 Shunpike Road List $1,630,000 | Sale $1,750,000 128 Riveredge Drive List $495,000 | Sale $515,000 31 Hilltop Terrace List $3,550,000 | Sale $3,675,000 28 TOTAL TRANSACTIONS SUE ADLER TEAM* 2022 STATISTICS* $76K $ AVG. OVER LIST PRICE 105.81% SUE ADLER TEAM ORIG. LIST TO SALE PRICE RATIO 11 AVG. DAYS ON MARKET SUE ADLER TEAM 2022 LIST-SIDE SALES
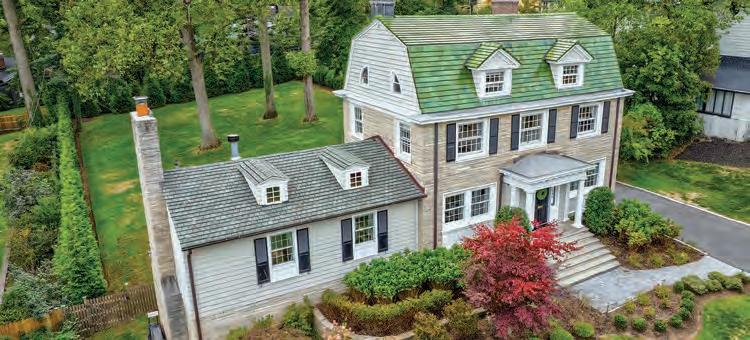
Maplewood & South Orange
12 THE SUE ADLER TEAM
512 TOTAL LISTED 2022 HOUSING* MARKET OVERALL* 460 TOTAL TRANSACTIONS 110.36% AVERAGE ORIGINAL LIST TO SALE PRICE RATIO 116.53% AVERAGE ORIGINAL LIST TO SALE PRICE RATIO $138K $ AVERAGE OVER LIST PRICE 24 AVERAGE DAYS ON MARKET 2022 HOUSING OVERVIEW 2022 2021 2020 $350,000 AND UNDER 36 46 73 $350,001 TO $650,000 159 265 300 $650,001 TO $1,000,000 223 265 336 $1,000,001 AND OVER 94 79 60 $350,000 AND UNDER 43 42 75 $350,001 TO $650,000 132 258 283 $650,001 TO $1,000,000 153 288 280 $1,000,001 AND OVER 132 78 43 $350,000 AND UNDER 50 52 99 $350,001 TO $650,000 30 35 56 $650,001 TO $1,000,000 20 23 34 $1,000,001 AND OVER 15 20 32 $350,000 AND UNDER 99.04% 101.81% 96.91% $350,001 TO $650,000 108.78% 104.01% 100.95% $650,001 TO $1,000,000 111.45% 109.53% 104.43% $1,000,001 AND OVER 114.35% 118.73% 99.80% $350,000 AND UNDER 26 24 32 $350,001 TO $650,000 100 182 173 $650,001 TO $1,000,000 131 246 217 $1,000,001 AND OVER 124 62 26 Many homes went under contract in 2021 and did not sell until early 2022, explaining why the number of transactions may exceed the number of homes listed for sale. TOTAL LISTED TRANSACTIONS AVERAGE DAYS ON MARKET ORIGINAL LIST PRICE TO SALE PRICE RATIO SOLD AT OR ABOVE LIST PRICE SUE ADLER*
TEAM*


973.949.0306 www.sueadler.com 13 186 TOTAL LISTED 2022 HOUSING* MARKET OVERALL* 166 TOTAL TRANSACTIONS 103.26% AVERAGE ORIGINAL LIST TO SALE PRICE RATIO 30 AVERAGE DAYS ON MARKET 2022 HOUSING OVERVIEW 2022 2021 2020 $600,000 AND UNDER 46 59 62 $600,001 TO $1,000,000 72 84 98 $1,000,001 TO $1,500,000 34 49 47 $1,500,001 AND OVER 34 21 27 $600,000 AND UNDER 35 53 62 $600,001 TO $1,000,000 66 74 89 $1,000,001 TO $1,500,000 34 50 37 $1,500,001 AND OVER 31 21 16 $600,000 AND UNDER 27 39 71 $600,001 TO $1,000,000 33 38 69 $1,000,001 TO $1,500,000 39 48 126 $1,500,001 AND OVER 17 90 166 $600,000 AND UNDER 101.81% 97.94% 95.67% $600,001 TO $1,000,000 103.27% 99.32% 96.16% $1,000,001 TO $1,500,000 102.84% 96.79% 93.10% $1,500,001 AND OVER 103.06% 96.41% 87.50% $600,000 AND UNDER 21 27 21 $600,001 TO $1,000,000 47 45 29 $1,000,001 TO $1,500,000 22 22 7 $1,500,001 AND OVER 26 8 2 Many homes
in 2021 and did not sell until early 2022,
for
Madison TOTAL LISTED TRANSACTIONS AVERAGE DAYS ON MARKET ORIGINAL LIST PRICE TO SALE PRICE RATIO SOLD AT OR ABOVE LIST PRICE
AVERAGE ORIGINAL LIST TO SALE PRICE
$57K
AVERAGE
PRICE
went under contract
explaining why the number of transactions may exceed the number of homes listed
sale.
104.47%
RATIO
$
OVER LIST
SUE ADLER* TEAM*
SUE ADLER* TEAM*
New Providence
107.16% $75K $ AVERAGE OVER LIST PRICE

14 THE SUE ADLER TEAM
175 TOTAL LISTED 2022 HOUSING* MARKET OVERALL* 169 TOTAL TRANSACTIONS 105.64% AVERAGE ORIGINAL LIST TO SALE PRICE RATIO 24 AVERAGE DAYS ON MARKET 2022 HOUSING OVERVIEW 2022 2021 2020 $450,000 AND UNDER 5 14 22 $450,001 TO $700,000 73 106 120 $700,001 TO $900,000 52 69 42 $900,001 AND OVER 45 30 30 $450,000 AND UNDER 5 12 18 $450,001 TO $700,000 75 96 102 $700,001 TO $900,000 50 60 34 $900,001 AND OVER 39 28 25 $450,000 AND UNDER 35 79 158 $450,001 TO $700,000 25 47 65 $700,001 TO $900,000 21 47 56 $900,001 AND OVER 24 67 72 $450,000 AND UNDER 101.85% 110.10% 90.40% $450,001 TO $700,000 105.04% 100.76% 96.68% $700,001 TO $900,000 106.12% 102.12% 98.78% $900,001 AND OVER 106.67% 100.15% 96.91% $450,000 AND UNDER 3 6 2 $450,001 TO $700,000 55 58 37 $700,001 TO $900,000 35 43 19 $900,001 AND OVER 29 17 8
AVERAGE ORIGINAL LIST TO SALE PRICE RATIO TOTAL LISTED TRANSACTIONS AVERAGE DAYS ON MARKET ORIGINAL LIST PRICE TO SALE PRICE RATIO SOLD AT OR ABOVE LIST PRICE
Many homes went under contract in 2021 and did not sell until early 2022, explaining why the number of transactions may exceed the number of homes listed for sale.
973.949.0306 www.sueadler.com 15 Westfield 395 TOTAL LISTED 2022 HOUSING* MARKET OVERALL* 379 TOTAL TRANSACTIONS 102.67% AVERAGE ORIGINAL LIST TO SALE PRICE RATIO 31 AVERAGE DAYS ON MARKET 2022 HOUSING OVERVIEW 2022 2021 2020 $600,000 AND UNDER 69 90 139 $600,001 TO $1,000,000 160 252 275 $1,000,001 TO $1,500,000 112 109 133 $1,500,001 AND OVER 54 57 45 $600,000 AND UNDER 66 95 120 $600,001 TO $1,000,000 157 254 246 $1,000,001 TO $1,500,000 108 109 117 $1,500,001 AND OVER 48 54 30 $600,000 AND UNDER 33 63 71 $600,001 TO $1,000,000 31 34 74 $1,000,001 TO $1,500,000 26 44 86 $1,500,001 AND OVER 37 72 85 $600,000 AND UNDER 100.70% 95.86% 96.02% $600,001 TO $1,000,000 102.21% 100.23% 97.07% $1,000,001 TO $1,500,000 105.14% 100.68% 94.94% $1,500,001 AND OVER 101.31% 95.86% 94.82% $600,000 AND UNDER 42 32 43 $600,001 TO $1,000,000 104 154 97 $1,000,001 TO $1,500,000 76 71 28 $1,500,001 AND OVER 27 22 4 Many homes went under contract in 2021 and did not sell until early 2022, explaining why the number of transactions may exceed the number of homes listed for sale. TOTAL LISTED TRANSACTIONS AVERAGE DAYS ON MARKET ORIGINAL LIST PRICE TO SALE PRICE RATIO SOLD AT OR ABOVE LIST PRICE
SUE ADLER* TEAM*
103.54% $87K $ AVERAGE OVER LIST PRICE

16 THE SUE ADLER TEAM
Livingston
2022 HOUSING* MARKET OVERALL*
AVERAGE ORIGINAL
TO SALE PRICE
AVERAGE
2022 HOUSING OVERVIEW 2022 2021 2020 $500,000 AND UNDER 42 60 106 $500,001 TO $750,000 158 236 206 $750,001 TO $1,250,000 166 156 198 $1,250,001 AND OVER 129 106 97 $500,000 AND UNDER 38 69 99 $500,001 TO $750,000 149 208 168 $750,001 TO $1,250,000 146 156 148 $1,250,001 AND OVER 92 67 60 $500,000 AND UNDER 44 67 65 $500,001 TO $750,000 41 42 60 $750,001 TO $1,250,000 30 54 89 $1,250,001 AND OVER 75 83 118 $500,000 AND UNDER 101.07% 100.60% 97.69% $500,001 TO $750,000 102.00% 100.85% 98.56% $750,001 TO $1,250,000 103.86% 100.34% 96.34% $1,250,001 AND OVER 101.52% 97.38% 91.12% $500,000 AND UNDER 20 42 44 $500,001 TO $750,000 100 132 85 $750,001 TO $1,250,000 107 98 57 $1,250,001 AND OVER 60 29 9
495 TOTAL LISTED
425 TOTAL TRANSACTIONS 102.45%
LIST
RATIO 45
DAYS ON MARKET
AVERAGE ORIGINAL LIST TO SALE PRICE RATIO
TRANSACTIONS AVERAGE DAYS ON MARKET ORIGINAL LIST PRICE TO SALE PRICE RATIO SOLD AT OR ABOVE LIST PRICE
Many homes went under contract in 2021 and did not sell until early 2022, explaining why the number of transactions may exceed the number of homes listed for sale.
TOTAL LISTED


973.949.0306 www.sueadler.com 17 Cathy Haddad Senior Producing Branch Sales Manager O: (848) 203-2272 C: (848) 203-2272 rate.com/cathyhaddad cathy.haddad@rate.com 1750 North University Drive, Suite 234 Coral Springs, FL 33071 Cathy Haddad NMLS
Guaranteed Rate Inc.; NMLS #2611; For licensing information visit nmlsconsumeraccess.org. Equal Housing Lender. Conditions may apply. NJ - Licensed in NJ: Licensed Mortgage Banker - NJ Department of Banking & Insurance
#51156
Meet Your Team

EXECUTIVE TEAM
Sue Adler sue@sueadler.com
Scott Shuman scott@sueadler.com
AGENT PARTNERS COMMUNITY OUTREACH SUPPORT TEAM
Sue Adler sue@sueadler.com
Scott Shuman scott@sueadler.com
Melissa Bulwith melissa@sueadler.com
Abby Tanzer abby@sueadler.com
Jennifer Miller jennifer@sueadler.com
Larry Chiger larry@sueadler.com
Amy Deuchler amyd@sueadler.com
Laura Norwalk Bendelius laura@sueadler.com
Kathleen Lamendola kathleen@sueadler.com
Vikas Poddar vikas@sueadler.com
Lee Smith lee@sueadler.com
Terry Orr terry@sueadler.com
Ashima Mehra ashima@sueadler.com
Christine Hunter christine@sueadler.com
Louise Ozolins louise@sueadler.com
Finn Polisin finn@sueadler.com
Jeffrey Petrella jeffrey@sueadler.com
Ian Tumulty ian@sueadler.com
Jeremy Gulish jeremy@thegulishgroup.com
Beth Stein beth@thegulishgroup.com
Amy Olsen Esposito amye@sueadler.com
Michele Matsikoudis michele@sueadler.com
Heidi Ferro heidi@sueadler.com
Shawna Morgan-Smith shawna@sueadler.com
Amy Mascarina amymascarina@sueadler.com
Alana Zuber
Reem Malik
Erika Olesen
Chris Arcadia
Jessica Lascar
Kelsey Santiago
Bobbie Madugula
Paola Palacios
Peter Jacoby
Kat Brask
18 THE SUE ADLER TEAM
973.949.0306 sueadler.com The Sue Adler Team has been the #1 Keller Williams Team in New Jersey since 2005, and the #1 Team for Dollar Volume Production in the GSMLS since 2013.
OUR RESULTS ARE NOT ACCIDENTAL
We are a team of specialists, strategists, and consultants that work tirelessly for our clients to ensure that each accomplishes their real estate goals. As your trusted advisors, we provide you with the highest caliber of service in the industry.
WE NET OUR CLIENTS MORE BECAUSE WE DO MORE!
‘‘Bottom line, from someone who works in a business where customer service and the client experience is everything, Sue's team is exceptional and made the process of selling my home look easy, though I know there was a tremendous amount of work on their parts behind the scenes.
— JULIANNE R., SELLER
‘‘ In no uncertain terms, she maximized our sale price and minimized our anxiety level.
— CHARLIE B., SELLER
‘‘ My husband and I recently sold our home and we interviewed several agents. We were most impressed with Sue Adler because of the team of support she had representing all aspects of the sale. I have to say that we made the best decision by choosing them for this very reason.
— ANDREA S., SELLER
‘‘ From the beginning, Sue and team diffused our reservations and allayed any sensitivities about selling our home that has brought us so many cherished memories. While we were initially overwhelmed by the daunting sales process and prospect of an out-of-state move, their virtual workshop gave us the confidence that we had an all star team supporting every aspect of the process. And then Sue and team performed as promised in each facet of the process from listing to close. One can say it takes a village to go through this arduous process. Sue and team were more than a village; they were an extended family that met every one of our needs even while we relocated to Florida in the middle of the process.
— MARC AND MIRIAM P., SELLERS
973.949.0306 www.sueadler.com 19
’’
’’
’’
’’
’’
In 2022, Refinery-staged homes sold on average 11% OVER listing price in only 12 days!


20 THE SUE ADLER TEAM
Reach out today to schedule your free consultation! help@refineryhomeprep.com | o: 908.517.5259 | c: 973.865.3969
real estate
takes a consultative, hands-on approach. Our goal is to provide a stress-free
price. OUR SERVICES INCLUDE: Decluttering • Staging Color Consultation Home Preparation Planning
As a trusted Sue Adler Team affiliate, Refinery Home Prep + Staging provides home sale preparation services dedicated to helping you prepare your home for sale, inspire buyers’ imaginations, and increase the value of your home.
Our
design team
experience, while maximizing your sale
• Are you thinking about selling your home in the next 1-3 years but not sure where to start?
• Do you have a list of home projects you want to accomplish, but don’t know which are worth doing?
• Are you overwhelmed with decluttering your home to prepare it for sale?
• Would you see value in a step-by-step guide with resources, and a team of helpers to guide you through the home selling process?
WE ARE HERE TO HELP!
You will have your own dedicated consultant — who understands you, your home, and your timeline — present throughout the process. We will provide you with:
DETAILED PLAN
Specify tasks and projects to prepare your home based on necessity, budget, and priority level. We will work to track your progress throughout the home prep phase.
STAGING CONSULTATION
Position your home for photos and showings to attract today's buyers, maximize your sale price and minimize your time on the market.
LIST OF REPUTABLE VENDORS
Share skilled, reasonably priced, and responsive vendors to address any necessary work to handle preemptively, rather than waiting for buyer demands once Under Contract.
PRE-INSPECTION
Connect you with a licensed home inspector for a consultation, which we will attend, review findings of, and generate a list of action items to handle before going to market.
DECLUTTERING & DESIGN TIPS
Provide assistance with decluttering to optimize your space. With our market expertise and your budget in mind, we can recommend paint colors, light fixture and accessories upgrades, and much more!
973.949.0306 www.sueadler.com 21
A unique program designed to help you prepare now, and sell when YOU are ready!
GET STARTED TODAY! CALL 973.490.4686
The Sue Adler
IT’S WHAT WE STAND FOR
Empower you through consultation and education so that you can make the best decisions for your family.
Deliver on our promises. We do what we say we are going to do and are committed to providing you with the highest caliber of service.
Give back to our communities. The more people we help, the more we can give back!
Earn your confidence and trust by making you feel like you are our only client.
CREATING A BRAND FOR YOUR HOME
We professionally curate content, in-house, to paint a unique picture of your home.
CASTING THE WIDEST NET
We combine traditional and innovative ma attract the most qualified buyers.
“Sneak Peek”
Email Campaigns
Creates the “coming soon buzz,” and reaches 37,000+
Weekly Email Campaigns Reaches 37,000+ consumers and Realtors
Your Home’s Very Own “Digital Showcase”
Hosts all curated content in one place on sueadler.com
Community Outreach Makes 800+ calls per day to generate buyers’ interest in your home
Instagram Posts, Stories, Reels & Paid Ads
Facebook Campaigns Attracts active buyers in your area
22 THE SUE ADLER TEAM
EXCLUSIVE EDGE MARKETING PROGRAM Connecting your
OUR
of the Art Photography
powerful first
Floor Plan with Room Dimensions
Curated Narrative
home’s
and
storytelling Interactive Floor Plan Beautiful Property Brochure 4K Cinematography
3D Virtual Tour Brings buyers “from click to closing in less time” Community Tour Videos
buyers with an exclusive look into your town and lifestyle
State
Creates a
impression
Professionally
Showcases your
features
lifestyle through creative
Matterport
Provides
973.949.0306 sueadler.com
Team EDGE
home to buyers’ hearts.
rketing techniques to
Keller Williams Intranet Email Campaigns
Google Advertisements & Paid Retargeting
Inside Sales Team
Prospects to generate buyers’ interest in your home
Garden State Multiple Listing Service (GSMLS)
Third-Party Sites
Syndicates listing to 100+ sites (Zillow, Realtor, Trulia, etc.)
PROVIDING LUXURY SERVICE AT ALL PRICE POINTS
We pride ourselves on seamless communication, doing what it takes for our clients, and delivering on our promises every step of the way, making you feel like our only client.
Team of Specialists
Works with and for you, providing expertise at every stage
Home Preparation
Advises you on everything from pre-inspection and decluttering, to repairs
Proactive Advocacy
Bulletproofs the transaction up front and prices to create maximum interest
Seamless Communication
Is our superpower
Market Expert Positions your home competitively for market to create the most interest
Home Inspection Negotiator
Advocates on your behalf, handling every aspect from contract to close
Service Professionals
Connects you with trusted contractors, stagers, movers, attorneys, inspectors etc.
Daily Update on Comparable Homes
Lets you know where your home fits in at all times
In-Person & Virtual Showings
Realtor & Public Open Houses
To make it convenient for potential buyers to see your home without bothering their realtor
Compiled List of Feedback
Gives you unfiltered, comprehensive context surrounding interest in your home
Marketing Reports
Keeps you up-to-date on marketing reach and response
973.949.0306 www.sueadler.com 23
But where would we go? What repairs do we need to make? How do we even begin to get rid of all our old stuff? 488 Springfield Avenue, Summit, NJ 07901 info@sueadler.com 973.949.0306 sueadler.com If your property is currently listed this is not intended as a solicitation. KELLER WILLIAMS REALTY PREMIER PROPERTIES Each Keller Williams office is individually owned and operated. Learn what over 2,500+ other local homeowners already have by attending Reserve your spot today at SueAdler.com/HSW BOTH IN-PERSON & VIRTUAL WORKSHOP OPTIONS SUE ADLER TEAM’S HOME SELLING, PREP & STAGING WORKSHOP Call 973.949.0306 for your complimentary consultation SUMMIT 488 Springfield Avenue SHORT HILLS 518 Millburn Avenue CHATHAM 127 Main Street WESTFIELD 188 Elm Street THERE’S A SUE ADLER TEAM LOCATION NEAR YOU: Haven't we missed the market? OR should we sell our home in "as-is” condition?


 Cover illustration by Daryl Seitchik, Sue Adler’s daughter www.darylseitchik.com


