
3 minute read
Recording coverage


population and range changes. Two records of Dingy Skipper were also received for Landseer Park, Ipswich at the end of May (30th and 31st) with one being described as, being barely able to fly. Landseer Park also played host to Small Blue. The butterfly was first found on 15th June and last reported on 22nd June. The maximum count was of 5 males on the 17th June. The obvious question is why or how this species has suddenly occurred at this site and whether these Small Blue sightings relate to yet another local introduction or release? However, on a positive note, the site does have Kidney Vetch, the larval food plant, present across the site. In addition, it is a species that is known to be capable of dispersing large distances. This species also unexpectedly occurred in Norfolk in 2019 at Cranwich Camp and at a site in South Essex.
Two records of Dark-green Fritillary were received from Landseer Park, Ipswich on 29th and 30th June. A photograph was received to support the identification although the records are on separate days it is highly likely that they refer to an individual butterfly. Again, given the site location and with no other county records for comparison there is some concern as to it being another released specimen. Of note, this species was also reported from a heathland site in the north of the county but neither description nor photo was provided so the record has been discounted. As an aside, Darkgreen Fritillary flew in reasonable numbers on the Cambridgeshire/ Suffolk border along the Devils Dyke through late June into early August. It is believed to breed in this area, albeit in small numbers. As such, wanderers from this population could be expected in the west of Suffolk but none were reported.
7. Recording and Geographic Coverage in 2019
As discussed above the BNM remains the key recording scheme for general distribution and numbers of butterflies. 2019 was the final year in the current five-year (2015-2019) recording
7. R period. Nearly, 42,000 records were received ecording and Geographic Coverage in 2019 for 2019 and butterflies were recorded in 827 county tetrads (2km x 2km squares). The Suffolk As discussed above the BNM remains the key recording scheme for general distribution and numbers of butterflies. 2019 was the final year in the current five-year (2015-2019) recording period. coverage map for 2019 is shown below.Nearly, 42,000 records were received for 2019 and butterflies were recorded in 827 county tetrads (2km x 2km squares). The Suffolk coverage map for 2019 is shown below.
Map 4: Suffolk recording coverage 2019 Map 4: Suffolk recording coverage 2019
However, as this was the last year of the current However, as this was the last year of the current five-year period it is appropriate to consider the five-year period it is appropriate to consider the extent of coverage achieved. Combining the data from 2015, 2016, 2017, 2018 and 2019 shows that over 175,000 records have been received with butterflies being seen from 1075 county extent of coverage achieved. Combining the data from 8 2015, 2016, 2017, 2018 and 2019 shows that over 175,000 records have been received with butterflies being seen from 1075 county tetrads. This gives us an incredible 98.7% county coverage which is a brilliant position to be in at the end of the recording period. The Suffolk tetrads. This gives us an incredible 98.7% county coverage which is a brilliant position to be in coverage map for 2015-2019 is shown below.at the end of the recording period. The Suffolk coverage map for 2015-2019 is shown below
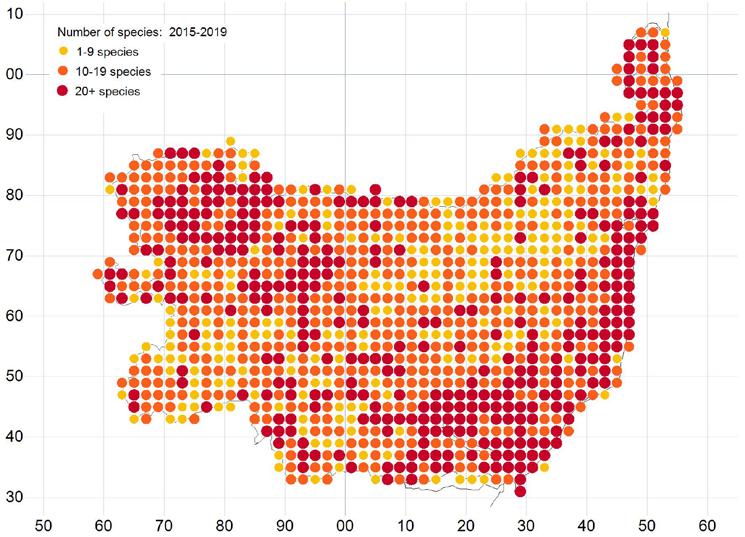
Map 5: Suffolk Coverage 2015-2019 Map 5: Suffolk Coverage 2015-2019
8. Analysis 8. Analysis (See Annex C- Long term trends for residents and regular visitors 1995 to 2019) (See The 39 Annex C- Long term trends for residents species of butterfly recorded in 2019 are shown in Annex A, in order of scarcity, with a and regular visitors 1995 to 2019) direct comparison to last year’s results. However, trends over a longer period are presented separately at Annex C for our regular species. The rolling 5-year figure (2015-2019) covers 1075 tetrads and shows an average of 15.7 species per tetrad.


