Annual roundup of tourism in Tallinn for 2001
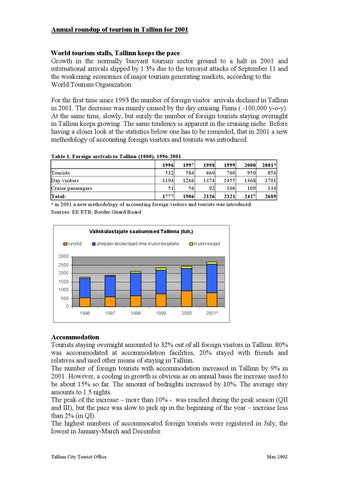
World tourism stalls, Tallinn keeps the pace Growth in the normally buoyant tourism sector ground to a halt in 2001 and international arrivals slipped by 1.3% due to the terrorist attacks of September 11 and the weakening economies of major tourism generating markets, according to the World Tourism Organization. For the first time since 1993 the number of foreign visitor arrivals declined in Tallinn in 2001. The decrease was mainly caused by the day cruising Finns ( -100,000 y-o-y). At the same time, slowly, but surely the number of foreign tourists staying overnight in Tallinn keeps growing. The same tendency is apparent in the cruising niche. Before having a closer look at the statistics below one has to be reminded, that in 2001 a new methodology of accounting foreign visitors and tourists was introduced. Table 1. Foreign arrivals to Tallinn (1000), 1996-2001 1997 1998 1999 2000 1996 Tourists 532 584 660 760 950 Day visitors 1194 1266 1374 1455 1368 Cruise passengers 51 56 92 106 109 Total: 1777 1906 2126 2321 2427 * in 2001 a new methodology of accounting foreign visitors and tourists was introduced. Sources: EE ETB, Border Guard Board
2001* 854 1701 134 2689
Väliskülastajate saabumised Tallinna (tuh.) turistid
ühepäevakülastajad ilma kruiisireisijateta
kruiisireisijad
3000 2500 2000 1500 1000 500 0 1996
1997
1998
1999
2000
2001*
Accommodation Tourists staying overnight amounted to 32% out of all foreign visitors in Tallinn. 80% was accommodated at accommodation facilities, 20% stayed with friends and relatives and used other means of staying in Tallinn. The number of foreign tourists with accommodation increased in Tallinn by 9% in 2001. However, a cooling in growth is obvious as on annual basis the increase used to be about 15% so far. The amount of bednights increased by 10%. The average stay amounts to 1.5 nights. The peak of the increase – more than 10% - was reached during the peak season (QII and III), but the pace was slow to pick up in the beginning of the year – increase less than 2% (in QI). The highest numbers of accommocated foreign tourists were registered in July, the lowest in January-March and December.
Tallinn City Tourist Office
May 2002
There is no significant change to be seen concerning the motivation of the tourists – the largest segment is on leisure and holiday trip (63% of accommodated tourists) with business trips (34%) and other reasons (4%) far behind. The overnights from Russia skyrocketed in January, June, July and December and the annual increase amounted to 44%. Pace-wise Great Britain and Ireland did almost as well with the increase of 41% in overnights (the most drastic leap in January-March and June) with Germany as the solid third with the increase of 23% (the best results in May-August and February). The only slipping was registered by Swedes (-5%). However, Finns still dominate in Tallinn with 64% of all foreign overnights (in 2000 59%). Other largest foreign overnight segments are Swedish, German and Brittish and Irish tourists. Table 2. Accommodated tourists in Tallinn, 1995-2001 1996 1995 Foreign 235153 292698 Domestic 38450 33576 Total: 273603 326274 Source: Statistical Office of Estonia
1997 370926 45309 416235
1998 426353 51251 477604
1999 536024 63006 599030
2000 626471 70294 696765
2001 685117 73293 758410
Tallinna majutusettevõtetes majutatud külastajad Väliskülastajad
Eesti elanikud
800000 600000 400000 200000 0 1995
1996
1997
1998
1999
2000
2001
Table 3. Accommodated tourists in Tallinn by nationality, 1999-2001
1999
TOTAL Estonia Foreign Total Finland Sweden Denmark Germany Benelux France Austria Great Britain, Ireland Spain, Portugal
Tallinn City Tourist Office
2000
% change change change 1999- 199920002001 2001 2000 2000
% change 20002001
599030 696765 758410
97735
16
61645
9
63006 70294 73293
7288
12
2999
4
536024 626471 685117
90447
17
58646
9
358583 424453 467401
65870
18
42948
10
38265 46326 39945
8061
21
-6381
-14
7753
-1779
-19
-50
-1
19901 22781 28260
2880
14
5479
24
9582
7803
4608
5134
5462
526
11
328
6
4532
3573
3923
-959
-21
350
10
1562
1644
1445
82
5
-199
-12
13775 16294 19937
2519
18
3643
22
795
42
1744
65
1872
2667
4411
May 2002
Greece Italy Norway Switzerland CIS Incl. Russia Latvia Lithuania Poland Czech and Slovak Rep. Hungary Albania, Bulgaria, Romania Slovenia Other European states USA Canada Japan Other
305
486
309
181
59
-177
-36
4738
5146
6120
408
9
974
19
8381 12110 12705
3729
44
595
5
2279
356
23
408
22
17525 19765 23714
2240
13
3949
20
11906 14478 18872
2572
22
4394
30
13051 14943 15282
1892
14
339
2
1515
1871
7071
8198
8540
1127
16
342
4
1945
2847
4435
902
46
1588
56
1125
1097
901
-28
-2
-196
-18
664
1019
784
355
53
-235
-23
408
314
316
-94
-23
2
1
48
28
122
-20
-42
94
336
2800
2750
2360
-50
-2
-390
-14
11723 10539 11783
-1184
-10
1244
12
1428
1061
1342
-367
-26
281
26
4978
6056
6128
1078
22
72
1
5639
7566
9460
1927
34
1894
25
Source: Statistical Office of Estonia
Table 4. Overnights in Tallinn, 1999-2001
1999
TOTAL Estonia Foreign total Finland Sweden Denmark Germany Benelux France Austria Great Britain, Ireland Spain, Portugal Greece Italy Norway Switzerland CIS Incl. Russia Latvia
Tallinn City Tourist Office
2000
% change change change 1999- 1999- 2000- % change 2001 2000 2000 2001 2000-2001
857939 1010118 1105888 152179
18 95770
9
12
6337
6
767390 908257 997690 140867
18 89433
10
440915 539708 576212 98793
22 36504
7
19 -3564
-5
90549 101861 108198 11312
58620
69534
65970 10914
18187
13916
14665 -4271
38285
42509
52155
9874
11076
7993
-23
749
5
4224
11
9646
23
12423
1202
12
1347
12
7188
8179
-805
-10
991
14
2736
3077
2795
341
12
-282
-9
31296
35834
50061
4538
15 14227
40
2975
3992
6504
1017
34
2512
63
728
1098
786
370
51
-312
-28
10434
10909
13485
475
5
2576
24
16351
22402
27058
6051
37
4656
21
2648
3614
4393
966
36
779
22
32218
38417
48089
6199
19
9672
25
20777
26821
38023
6044
29 11202
42
18758
22017
22521
3259
17
504
2
May 2002
Lithuania Poland Czech and Slovak Rep. Hungary Albania, Bulgaria, Romania Slovenia Other European states USA Canada Japan Other states
11107
12907
14000
1800
16
1093
8
3847
5343
9282
1496
39
3939
74
2100
2452
2201
352
17
-251
-10
2250
3792
2136
1542
69 -1656
-44
841
774
784
-67
-8
10
1
143
60
324
-83
-58
264
440
5302
6101
5742
799
15
-359
-6
26636
27400
28533
764
3
1133
4
3485
2650
3196
-835
-24
546
21
8177
9615
10230
1438
18
615
6
11484
11872
15966
388
3
4094
34
Source: Statistical Office of Estonia
Table 5. Average length of stay in Tallinn, 1995-2001 1995 1996 Foreign 1.8 1.7 Domestic 2.2 1.8 Source: Statistical Office of Estonia
1997 1.5 1.8
1998 1.5 1.8
1999 1.4 1.4
2000 1.4 1.4
2001 1.5 1.5
Ööbimise pikkus Tallinna majutusettevõtetes Väliskülastajad
Eesti elanikud
2.5 2.0 1.5 1.0 0.5 0.0 1995
1996
1997
1998
1999
2000
2001
Table 6. Accommodation facilities in Tallinn 1999 2000 1996 1997 1998 Facilities 28 27 36 45 55 Rooms 1955 1950 2245 3061 3078 Beds 3410 3206 4018 5671 5606 Room occupancy % 56 67 68 61 65 Bed occupancy % 45 51 51 47 51 Average room rate EEK 496 530 550 544 528 Source: Statistical Office of Estonia, Tallinn City Tourist Office
2001
67 49 548
Motivation
Tallinn City Tourist Office
May 2002
Since 1996 very little has changed in the visitor motivation to choose Tallinn as the destination – in 2001 almost 2/3 of foreigners arrived to Tallinn for leisure and holiday, 1/3 for business and 4% to pursue other reasons. Quite obviously the peak of the holiday travel is summer with shoulder seasons in autumn and spring and very little holidaymakers in the beginning of the year. On the other hand business trips are spread evenly with QII, III and IV dominating, but the first couple of months are very quiet in business as well. Table 7. Visitor motivation of accommodated foreign tourists (%), 1998-2001 1998 1999 62.0 63.5 Holiday 33.0 33.5 Business 3.0 5.0 Other Source: Statistical Office of Estonia
2000 63.5 34.0 2.5
2001 62.5 34.0 3.5
Tallinna majutusettevõtetes majutatud väliskülastajate reisieesmärk, 2001
muu 4% tööreis 34% puhkusereis 62%
Tourism revenue It is estimated that Tallinn amounts to 80% of total export of tourism services in Estonia. Still, the pace has stalled (2000-2001 increase 3.4 %) and for the first time CPI increase (6%) had the upper hand. Table 8. Export of tourism services in Tallinn (EEK 1000), 19962001 Export of tourism services (EEK) Change % Change in CPI %
1996 1997 1998* 1999 2000 4669 5285 6011 6466 6880 13 13.7 7.5 6.4 11.2 8.2 3.3 4
2001 7117 3.4 6
Source: Bank of Estonia
Tallinn City Tourist Office
May 2002
Tallinna reisiteenuste eksport (mln. kr) 8000 7000 6000 5000 4000 3000 2000 1000 0 1996
1997
1998*
1999
2000
2001
Reisiteenuste ekspordi ja tarbijahinnaindeksi muutuste v천rdlus reisiteenuste ekspordi muutus, %
tarbijahinnaindeksi muutus, %
16 14 12 10 8 6 4 2 0 1997
Tallinn City Tourist Office
1998*
1999
2000
2001
May 2002