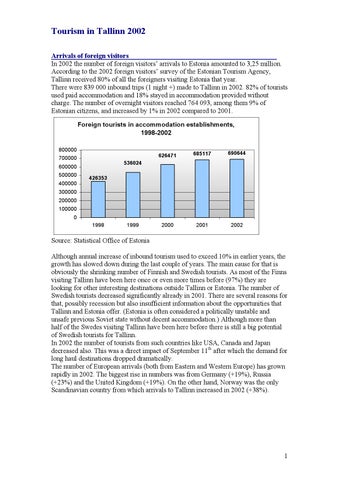
Tourism in Tallinn 2002 Arrivals of foreign visitors In 2002 the number of foreign visitors’ arrivals to Estonia amounted to 3,25 million. According to the 2002 foreign visitors’ survey of the Estonian Tourism Agency, Tallinn received 80% of all the foreigners visiting Estonia that year. There were 839 000 inbound trips (1 night +) made to Tallinn in 2002. 82% of tourists used paid accommodation and 18% stayed in accommodation provided without charge. The number of overnight visitors reached 764 093, among them 9% of Estonian citizens, and increased by 1% in 2002 compared to 2001. Foreign tourists in accommodation establishments, 1998-2002 800000 700000
400000
685117
690644
2000
2001
2002
536024
600000 500000
626471
426353
300000 200000 100000 0 1998
1999
Source: Statistical Office of Estonia Although annual increase of inbound tourism used to exceed 10% in earlier years, the growth has slowed down during the last couple of years. The main cause for that is obviously the shrinking number of Finnish and Swedish tourists. As most of the Finns visiting Tallinn have been here once or even more times before (97%) they are looking for other interesting destinations outside Tallinn or Estonia. The number of Swedish tourists decreased significantly already in 2001. There are several reasons for that, possibly recession but also insufficient information about the opportunities that Tallinn and Estonia offer. (Estonia is often considered a politically unstable and unsafe previous Soviet state without decent accommodation.) Although more than half of the Swedes visiting Tallinn have been here before there is still a big potential of Swedish tourists for Tallinn. In 2002 the number of tourists from such countries like USA, Canada and Japan decreased also. This was a direct impact of September 11th after which the demand for long haul destinations dropped dramatically. The number of European arrivals (both from Eastern and Western Europe) has grown rapidly in 2002. The biggest rise in numbers was from Germany (+19%), Russia (+23%) and the United Kingdom (+19%). On the other hand, Norway was the only Scandinavian country from which arrivals to Tallinn increased in 2002 (+38%).
1
Tourists accommodated in accommodation establishments, 2001-2002
Tourists accommodated in accommodation establishments ('000), 2002 percentage change on a year earlier
Germany
5256
Norway
4806
Russia
4278
Great Britain and Ireland
3835
Poland
1953
Spain and Portugal
1654
Lithuania
1451
Latvia
1230
France
1025 -315
Japan
-1173
USA
-1491
Sweden Finland
Finland
446
Sweden
38
Germany
34
Great Britain
24
Russia
23
Norway
18
Latvia
17
USA
11
-21211 0
-2500 -2000 -1500 -1000 -5000 0 0 0 0
0
100
200
300
400
500
5000 10000
Source: Statistical Office of Estonia
Source: Statistical Office of Estonia
Nearly 80% of all visitors used paid accommodation and 20% stayed in accommodation provided without charge. The majority of Russian visitors stayed with friends or relatives (52%) and so did many visitors from Latvia (59%) and Lithuania (29%). From other countries the percentage is 10-15. March 2002 saw the biggest rise in the number of foreign tourists, +26%, (mainly from Finland, Russia, Norway and Great Britain). The flow of tourists also grew from February to August. The only exception was May with the fall of -2%. The number of nights spent in accommodation establishments increased from January to October and decreased again in November and December. The smaller number of tourists in May could be explained with the Eurovision song contest during which accommodation facilities were full of contest participants and journalists, who stayed there longer than tourists usually do. The number of Finnish and Swedish tourists also shrank considerably during that period of time. According to the Tallinn foreign visitors’ survey 2002, the average length of a trip to Tallinn was 2.8 nights. The longest trips to Tallinn were made by Russians (average length of trip 5,5 nights), followed by Brits, Germans and Swedes. Finns spent in Tallinn 2,2 nights. The sign of a positive trend is the increased length of stay in registered accommodation establishments – from 1,46 nights in 2001 to 1,53 in 2002. Average length of stay in accommodation establishments (nights), 1999-2002 1,54 1,52 1,50 1,48 1,46 1,44 1,42 1,40 1,38
Average length of stay in all types of accommodation (nights), 2002 Russia 1,53
5,5 3,4
Great Britain Germany
1,46 1,45 1,43
1999
3,3
Sweden
2,8
Denmark and Norway
2,7
Latvia and Lithuania 2000
2001
2002
2,6
Finland
2,2 0,0
Source: Statistical Office of Estonia
1,0
2,0
3,0
4,0
5,0
Source: Tallinn foreign visitors’ survey, 2002 2
6,0
Finns still dominate with 54% of all foreign overnight stays in Tallinn. On the other hand, the percentage of Finns is diminishing year by year and the share of tourists coming from Western Europe and Russia is on the rise.
Cruises After a steady rise of cruise passenger arrivals in Tallinn over the years, 2002 was the first year when this number decreased. It is evident that terrorist attacks have brought forth changes in travel behaviour around the world. Arrivals of cruise tourists from USA, Japan and Canada fell the most. However, there has been quite a big increase in the number of cruise passengers from Western Europe (Germany, Italy, Spain, France) and Mexico. The overall decline in the number of cruise passengers between 2001 and 2002 was still only 5%. In 2002 the total of 65 cruise ships (-10 ships) carrying 127 400 passengers arrived at the port of Tallinn. Arrivals of cruise ships to Tallinn, 1998-2002
Arrivals of cruise tourists to Tallinn, 1998-2002 150000 100000
95119
108743 109511
134176 127392
50000
190 185 180 175 170 165 160 155 150
186
1998
1999
2000
2001
181 175 165
1998
0
187
1999
2000
2001
2002
2002
Source: Estonian Board of Boarder Guard
Source: Port of Tallinn
Same-day visitors Nearly 70% of all foreign visitors in Tallinn are the same-day visitors. Finns and Swedes comprise the majority of them. In 2002 the number of same-day visitors among all Finnish visitors in Tallinn was 1,25 million (71%). The respective numbers among Swedes are lower (76 000 and 61%). 53% of Finnish and 67% of Swedish same-day visitors are coming for a holiday. 39% of Finnish and 9% of Swedish sameday visitors come just for a shopping trip. Business trips in the same category of tourists are made by 3% of Finns and 6% of Swedes and 1% of Finns and 15% of Swedes visit their friends and relatives.
3
Purpose of a trip Three-fourths of visitors are coming to Tallinn for a holiday. Every eighth tourist is on a business trip and every thirteenth is visiting friends or relatives (VFR). Purpose of trips to Tallinn, 2002 VFR 8%
other 1%
business trip 13%
holiday trip 78%
Source: Tallinn foreign visitors’ survey, 2002 Quite obviously the peak of holiday travel is in summer with shoulder seasons in autumn and spring. The high seasons for business trips are summer and autumn. Shopping trips are made in spring, when the weather is not good enough for enjoying outdoor activities and a lot of shops have big sales. Friends and relatives are visited in spring, autumn and in December. Tourism revenues It is estimated that 80% of the total international travel receipts of Estonia can be attributed to Tallinn and this number was 466 million Euros in 2002. In the last two years the increase in international travel receipts has been quite moderate, during the same time the CPI has increased faster. In 2002 the tourist’s average spending per night was115 Euros in Tallinn.
4
700 600 500
International tourism receipts (million Euros), 1996-2002 international fare receipts international travel receipts
400 300 200 100 0 1996
1997
1998
1999
2000
2001
2002
Source: Bank of Estonia International travel receipts and CPI, changes 1997-2002 change of international travel receipts 16 14 12 10 8 6 4 2 0
13 11,2
13,7 8,2
7,5
6,4 3,3
1997
change of CPI
1998*
1999
6 4
2000
3,4
2001
2,8
3,6
2002
Source: Bank of Estonia, Statistical Office of Estonia
5
Table 1. Tourists in Tallinn accommodation establishments by country of residence, 2000-2002
TOTAL Estonia Foreign countries Finland Sweden Denmark Germany Belgium, Netherlands, Luxembourg France Austria Great Britain, Ireland Spain, Portugal Greece Italy Norway Switzerland CIS Russia Latvia Lithuania Poland The Czech Republic, Slovakia Hungary Albania, Bulgaria, Romania Slovenia Other European countries USA Canada Japan Other countries
Change in Change in numbers Change, % numbers Change, % 2002 2000-2001 2000-2001 2001-2002 2001-2002
2000
2001
696765
758410
764093
61645
9
5683
1
70294
73293
73449
2999
4
156
0
626471
685117
690644
58646
9
5527
1
424453
467401
446190
42948
10
-21211
-5
46326
39945
38454
-6381
-14
-1491
-4
7803
7753
7754
-50
-1
1
0
22781
28260
33516
5479
24
5256
19
5134
5462
6245
328
6
783
14
3573
3923
4948
350
10
1025
26
1644
1445
1985
-199
-12
540
37
16294
19937
23772
3643
22
3835
19
2667
4411
6065
1744
65
1654
37
486
309
517
-177
-36
208
67
5146
6120
6992
974
19
872
14
12110
12705
17511
595
5
4806
38
1871
2279
2095
408
22
-184
-8
19765
23714
27821
3949
20
4107
17
14478
18872
23150
4394
30
4278
23
14943
15282
16512
339
2
1230
8
8198
8540
9991
342
4
1451
17
2847
4435
6388
1588
56
1953
44
1097
901
1093
-196
-18
192
21
1019
784
839
-235
-23
55
7
314
316
415
2
1
99
31
28
122
195
94
336
73
60
2750
2360
3904
-390
-14
1544
65
10539
11783
10610
1244
12
-1173
-10
1061
1342
1191
281
26
-151
-11
6056
6128
5813
72
1
-315
-5
7566
9460
9828
1894
25
368
4
Source: Statistical Office of Estonia
6
Table 2. The number of nights spent in accommodation establishments of Tallinn, 2000-2002
2000
2001
TOTAL 1010118 1105888 Estonia 101861 108198 Foreign countries 908257 997690 Finland 539708 576212 Sweden 69534 65970 Denmark 13916 14665 Germany 42509 52155 Belgium, Netherlands, Luxembourg 11076 12423 France 7188 8179 Austria 3077 2795 Great Britain, Ireland 35834 50061 Spain, Portugal 3992 6504 Greece 1098 786 Italy 10909 13485 Norway 22402 27058 Switzerland 3614 4393 CIS 38417 48089 Russia 26821 38023 Latvia 22017 22521 Lithuania 12907 14000 Poland 5343 9282 The Czech Republic, Slovakia 2452 2201 Hungary 3792 2136 Albania, Bulgaria, Romania 774 784 Slovenia 60 324 Other European countries 6101 5742 USA 27400 28533 Canada 2650 3196 Japan 9615 10230 Other countries 11872 15966 Source: Statistical Office of Estonia
Change in Change in numbers Change, % numbers Change, % 2002 2000-2001 2000-2001 2001-2002 2001-2002 1172017
95770
9
66129
6
114354
6337
6
6156
6
1057663
89433
10
59973
6
569021
36504
7
-7191
-1
65658
-3564
-5
-312
0
15657
749
5
992
7
62787
9646
23
10632
20
14472
1347
12
2049
16
10699
991
14
2520
31
4471
-282
-9
1676
60
59672
14227
40
9611
19
10505
2512
63
4001
62
1641
-312
-28
855
109
16691
2576
24
3206
24
36091
4656
21
9033
33
4176
779
22
-217
-5
57769
9672
25
9680
20
48236
11202
42
10213
27
24376
504
2
1855
8
16506
1093
8
2506
18
10615
3939
74
1333
14
2893
-251
-10
692
31
4876
-1656
-44
2740
128
1353
10
1
569
73
537
264
440
213
66
10088
-359
-6
4346
76
26105
1133
4
-2428
-9
2941
546
21
-255
-8
10194
615
6
-36
0
17869
4094
34
1903
12
7
Table 3. Tourists in Tallinn accommodation establishments, 1998-2002 1998 1999 2000 2001 2002 Foreign visitors 426353536024626471685117690644 Estonian citizens 51251 63006 70294 73293 73449 477604599030696765758410764093 TOTAL: Source: Statistical Office of Estonia
Table 4. Accommodation establishments in Tallinn, 1998-2002 1998 1999 2000 Number of accommodation establishments 36 45 55 Number of rooms 2245 3061 3078 Number of beds 4018 5671 5606 Occupancy rate of rooms, % 68 61 65 Occupancy rate of bed-place, % 51 47 51 Average cost per night, EEK 550 544 528 Sources: Statistical Office of Estonia, Tallinn City Tourist Office
2001
2002
74 3390 6422 66 50 551
107 3584 6758 62 49 588
8