3 minute read
West Texas Landowner Report
Energy and Growth Trends
INTRODUCTION
Texas is comprised of 141million acres of private farms, ranches, and forestlands, leading the nation in land area devoted to privately-owned working lands. We define working lands as privately-owned farms, ranches, or forest lands, which provide food and fiber, support rural economies, and provide recreational opportunities, among other products and services. These privately-owned acres are stewarded by nearly 250,000landowners, each with their own objectives in managing their property. West Texas has remained primarily ruraland less impacted by urban development as other regions across the state. The Brewster, Jeff Davis, and Presidio County regionis experiencing land-use changes due to more recent urban development pressure largely driven by energy development activity. In response, several organizations, agenciesand industry are workingcollaboratively to promote a balance between a strong state economy and a rural, wild landscape that characterizes the far western region of the state. The purpose of this report is to compileinformation that can serve to better inform key partners and organizations working to conserve and shape the future of West Texas. This report is divided into two sections: (1) changes in land trends related to energy development specific to West Texas (geospatial informationfor 16 county region, Figure 1), and (2) landowner perspectives via a questionnaire administered within the region. A brief background on the questionnaireand how information was collected and compared is provided.
In Fall 2016, the Texas A&M Natural Resources Institute (NRI) in partnership with Texas Parks and Wildlife (TPWD) conducted a statewide,rural working lands questionnaire (hereafter Texas Landowner Survey) to better understand private landowner needs, preferences and concerns regarding the management of their operations and natural resources. The questionnaire was divided into 4 topic areas(land management, landowner concerns, land loss/fragmentation, and landowner demographics) and was comprised of 34 questions in multiple choice, yes/no, openended, and Likert format. The web-based questionnaire was disseminated primarily via emailand landowner group listserves. We received 3,103responses (98% completion rate; near all questions answered) from all but 36counties(86% of Texas counties represented). During Summer 2019, the Texas Landowner Survey was repeated in West Texas to better characterize landowners in counties with low response rates. Counties targeted included Brewster, Crane, Culberson, El Paso, Ector, Hudspeth, Jeff Davis, Loving, Midland, Pecos, Presidio, Reeves, Terrell, Upton, Ward, and Winkler. We received a total of 121 responses in approximately 2 months (100% completion rate, near all question answered); however,33 responses were from WestTexas counties,in addition to 70responses collected via the original survey. The majority of the questions from the Texas Landowner Survey were identicalbetween sampling periods, resulting in a total of 103 responses for the West Texas landowner.
SECTION I: West Texas Maps
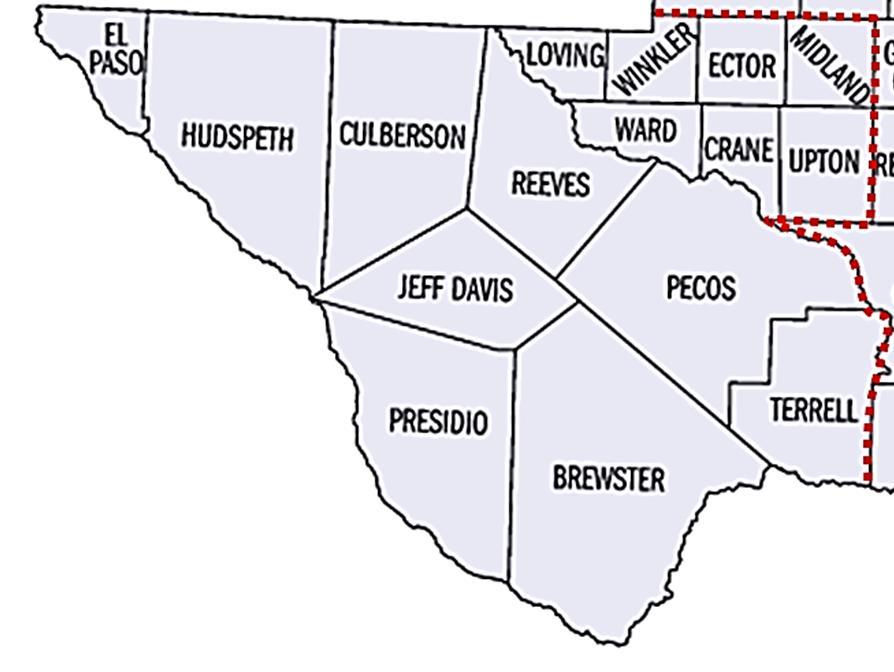
Figure 1. West Texas counties in the Upper Rio Grande region surveyed included Brewster, Crane, Culberson, El Paso, Ector, Hudspeth, Jeff Davis, Loving, Midland, Pecos, Presidio,
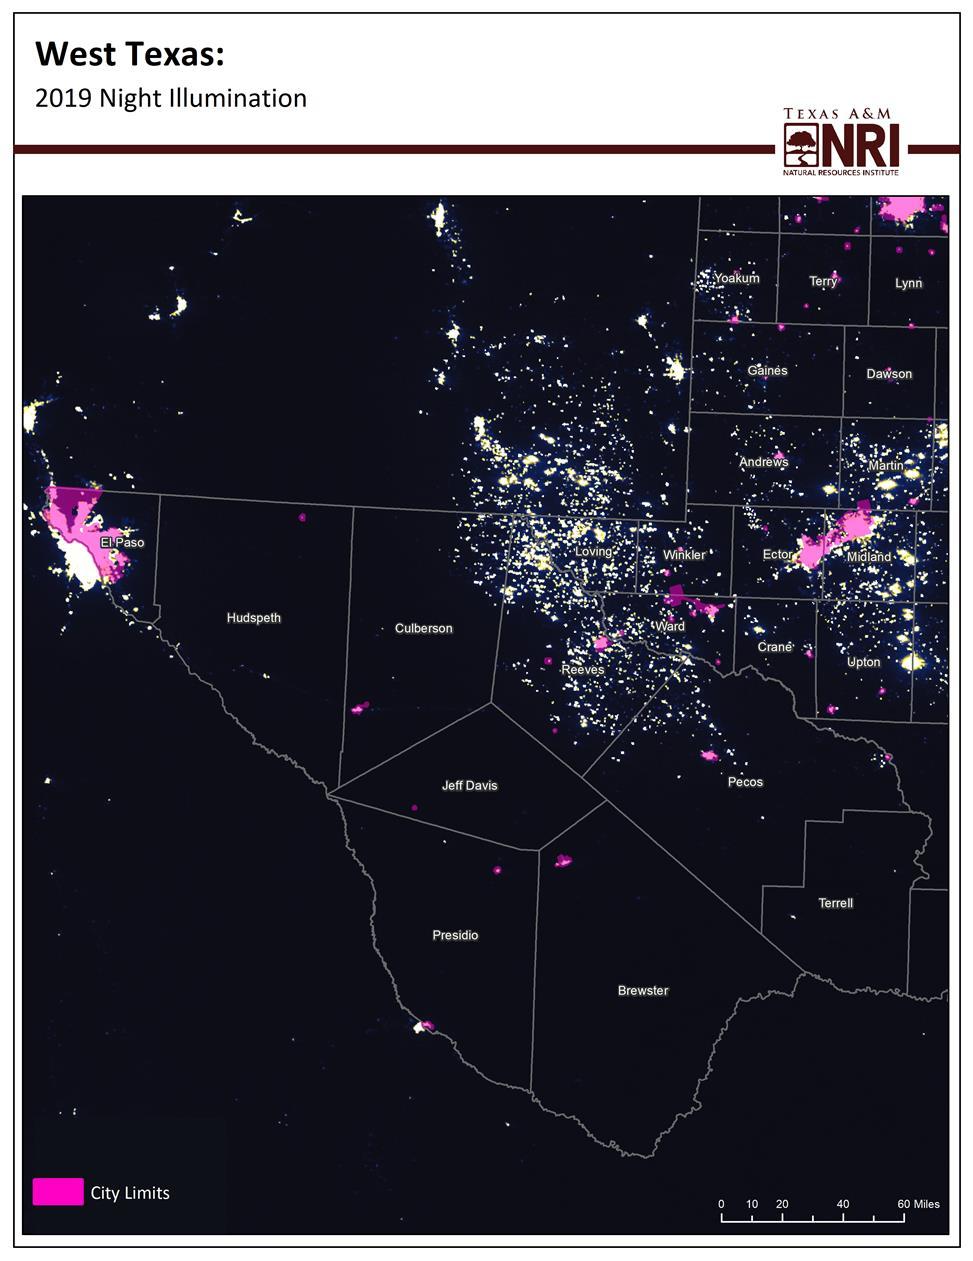
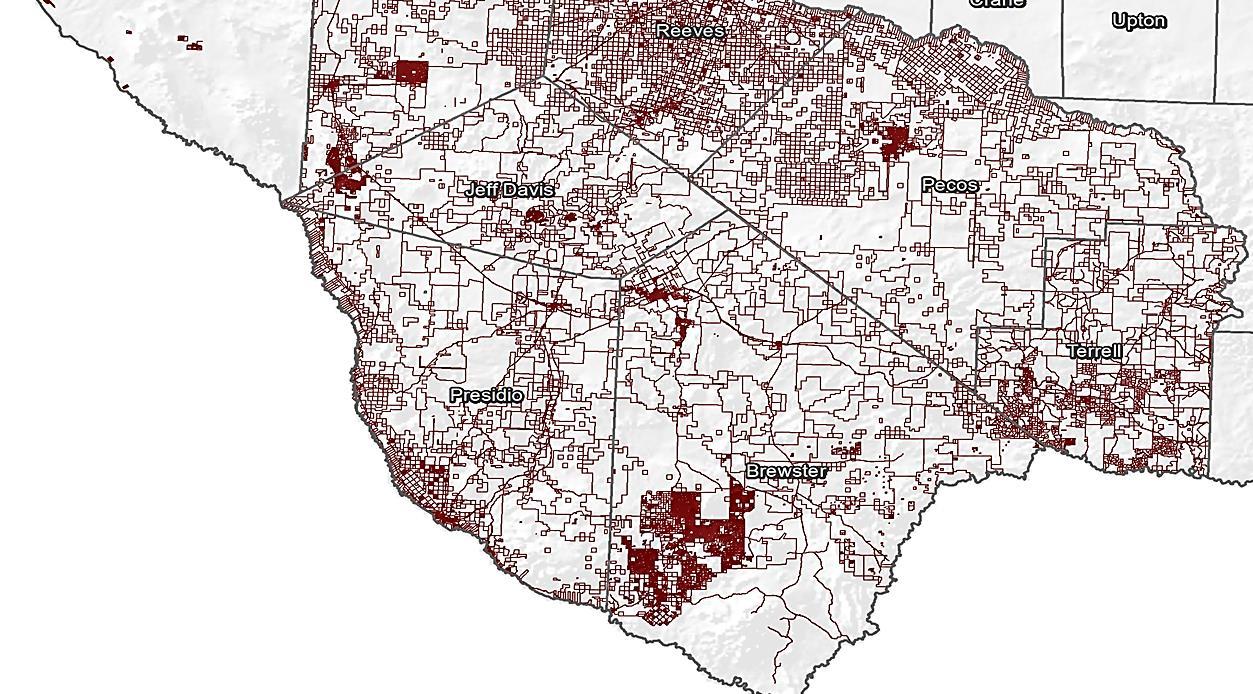
Maps (Figures 2 through 11) were compiled for the West Texas region and illustrate current as well as changes in land use cover driven by both development and energy activity. One map illustrates land cover over the region. Nighttime illumination maps illustrate development progression in the region. In general terms, the brighter the color, the increased rate of development. Impervious surface is associated with development type. An impervious surface is less permeable, for example, with decreased water filtration capabilities and is often associated with increases in urban development. The included general ownership parcel map provides a “bird’s-eye view” of development and private lands in the region. Public lands and protected lands were mapped as key anchor points for land conservation. Finally, potential energy development maps depict solar energy, wind energy and associated traffic projections.
Figure 2. West Texas land cover by typemap (2016).
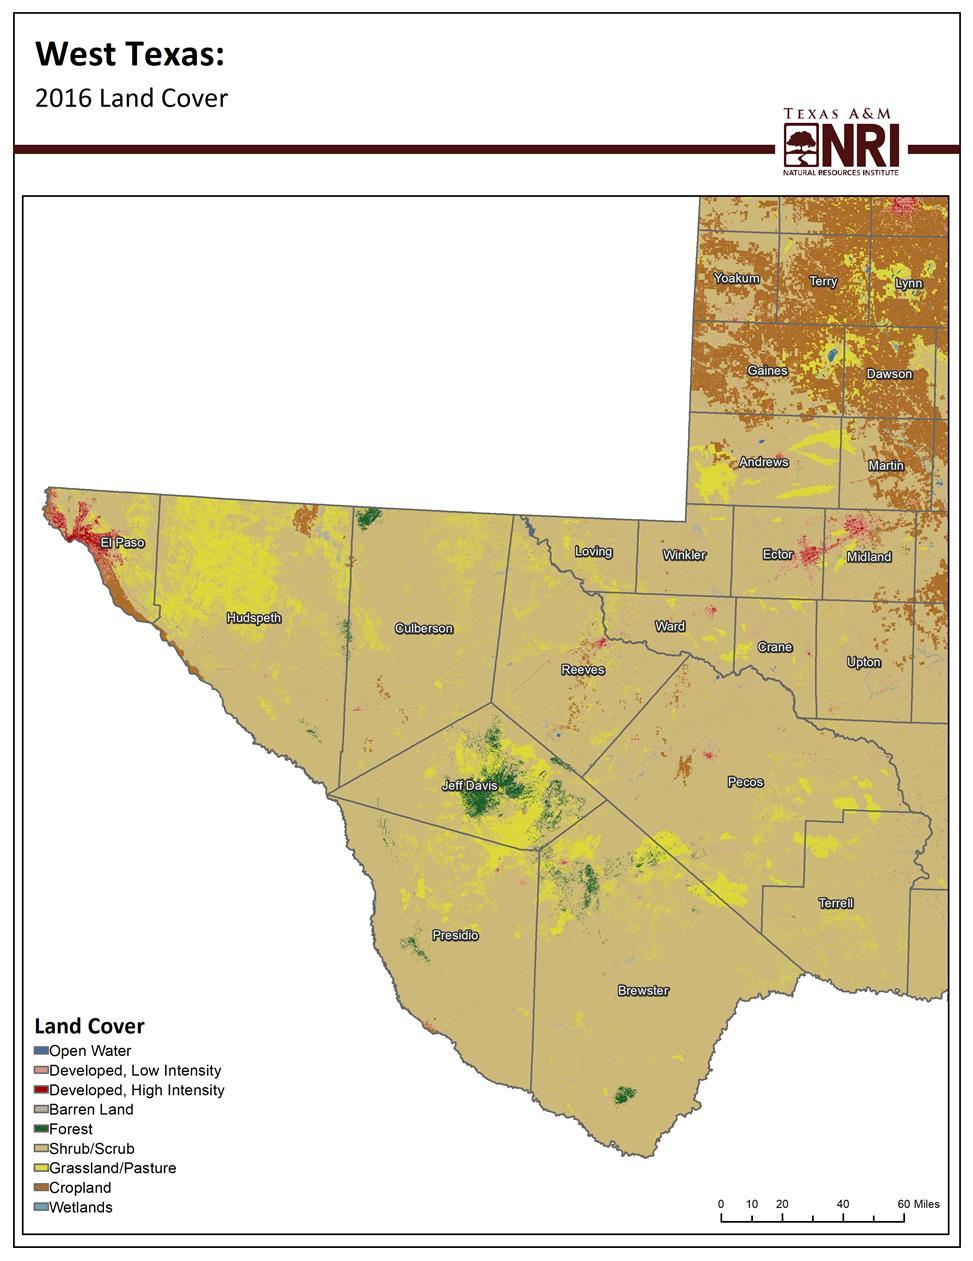
Figure 3a. Night illumination map (2012).
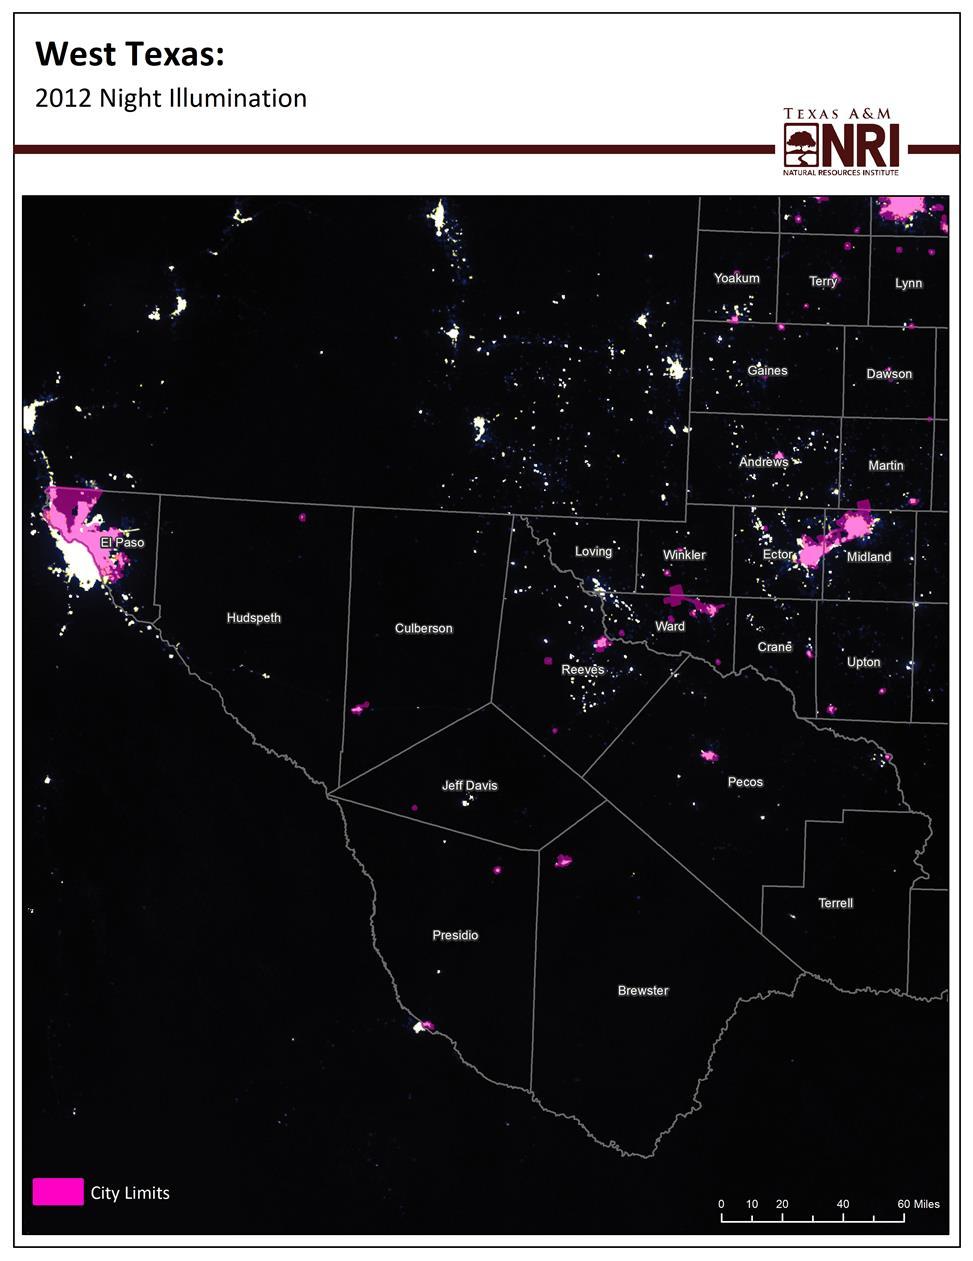
Figure 3b. Night illumination map(2019).
