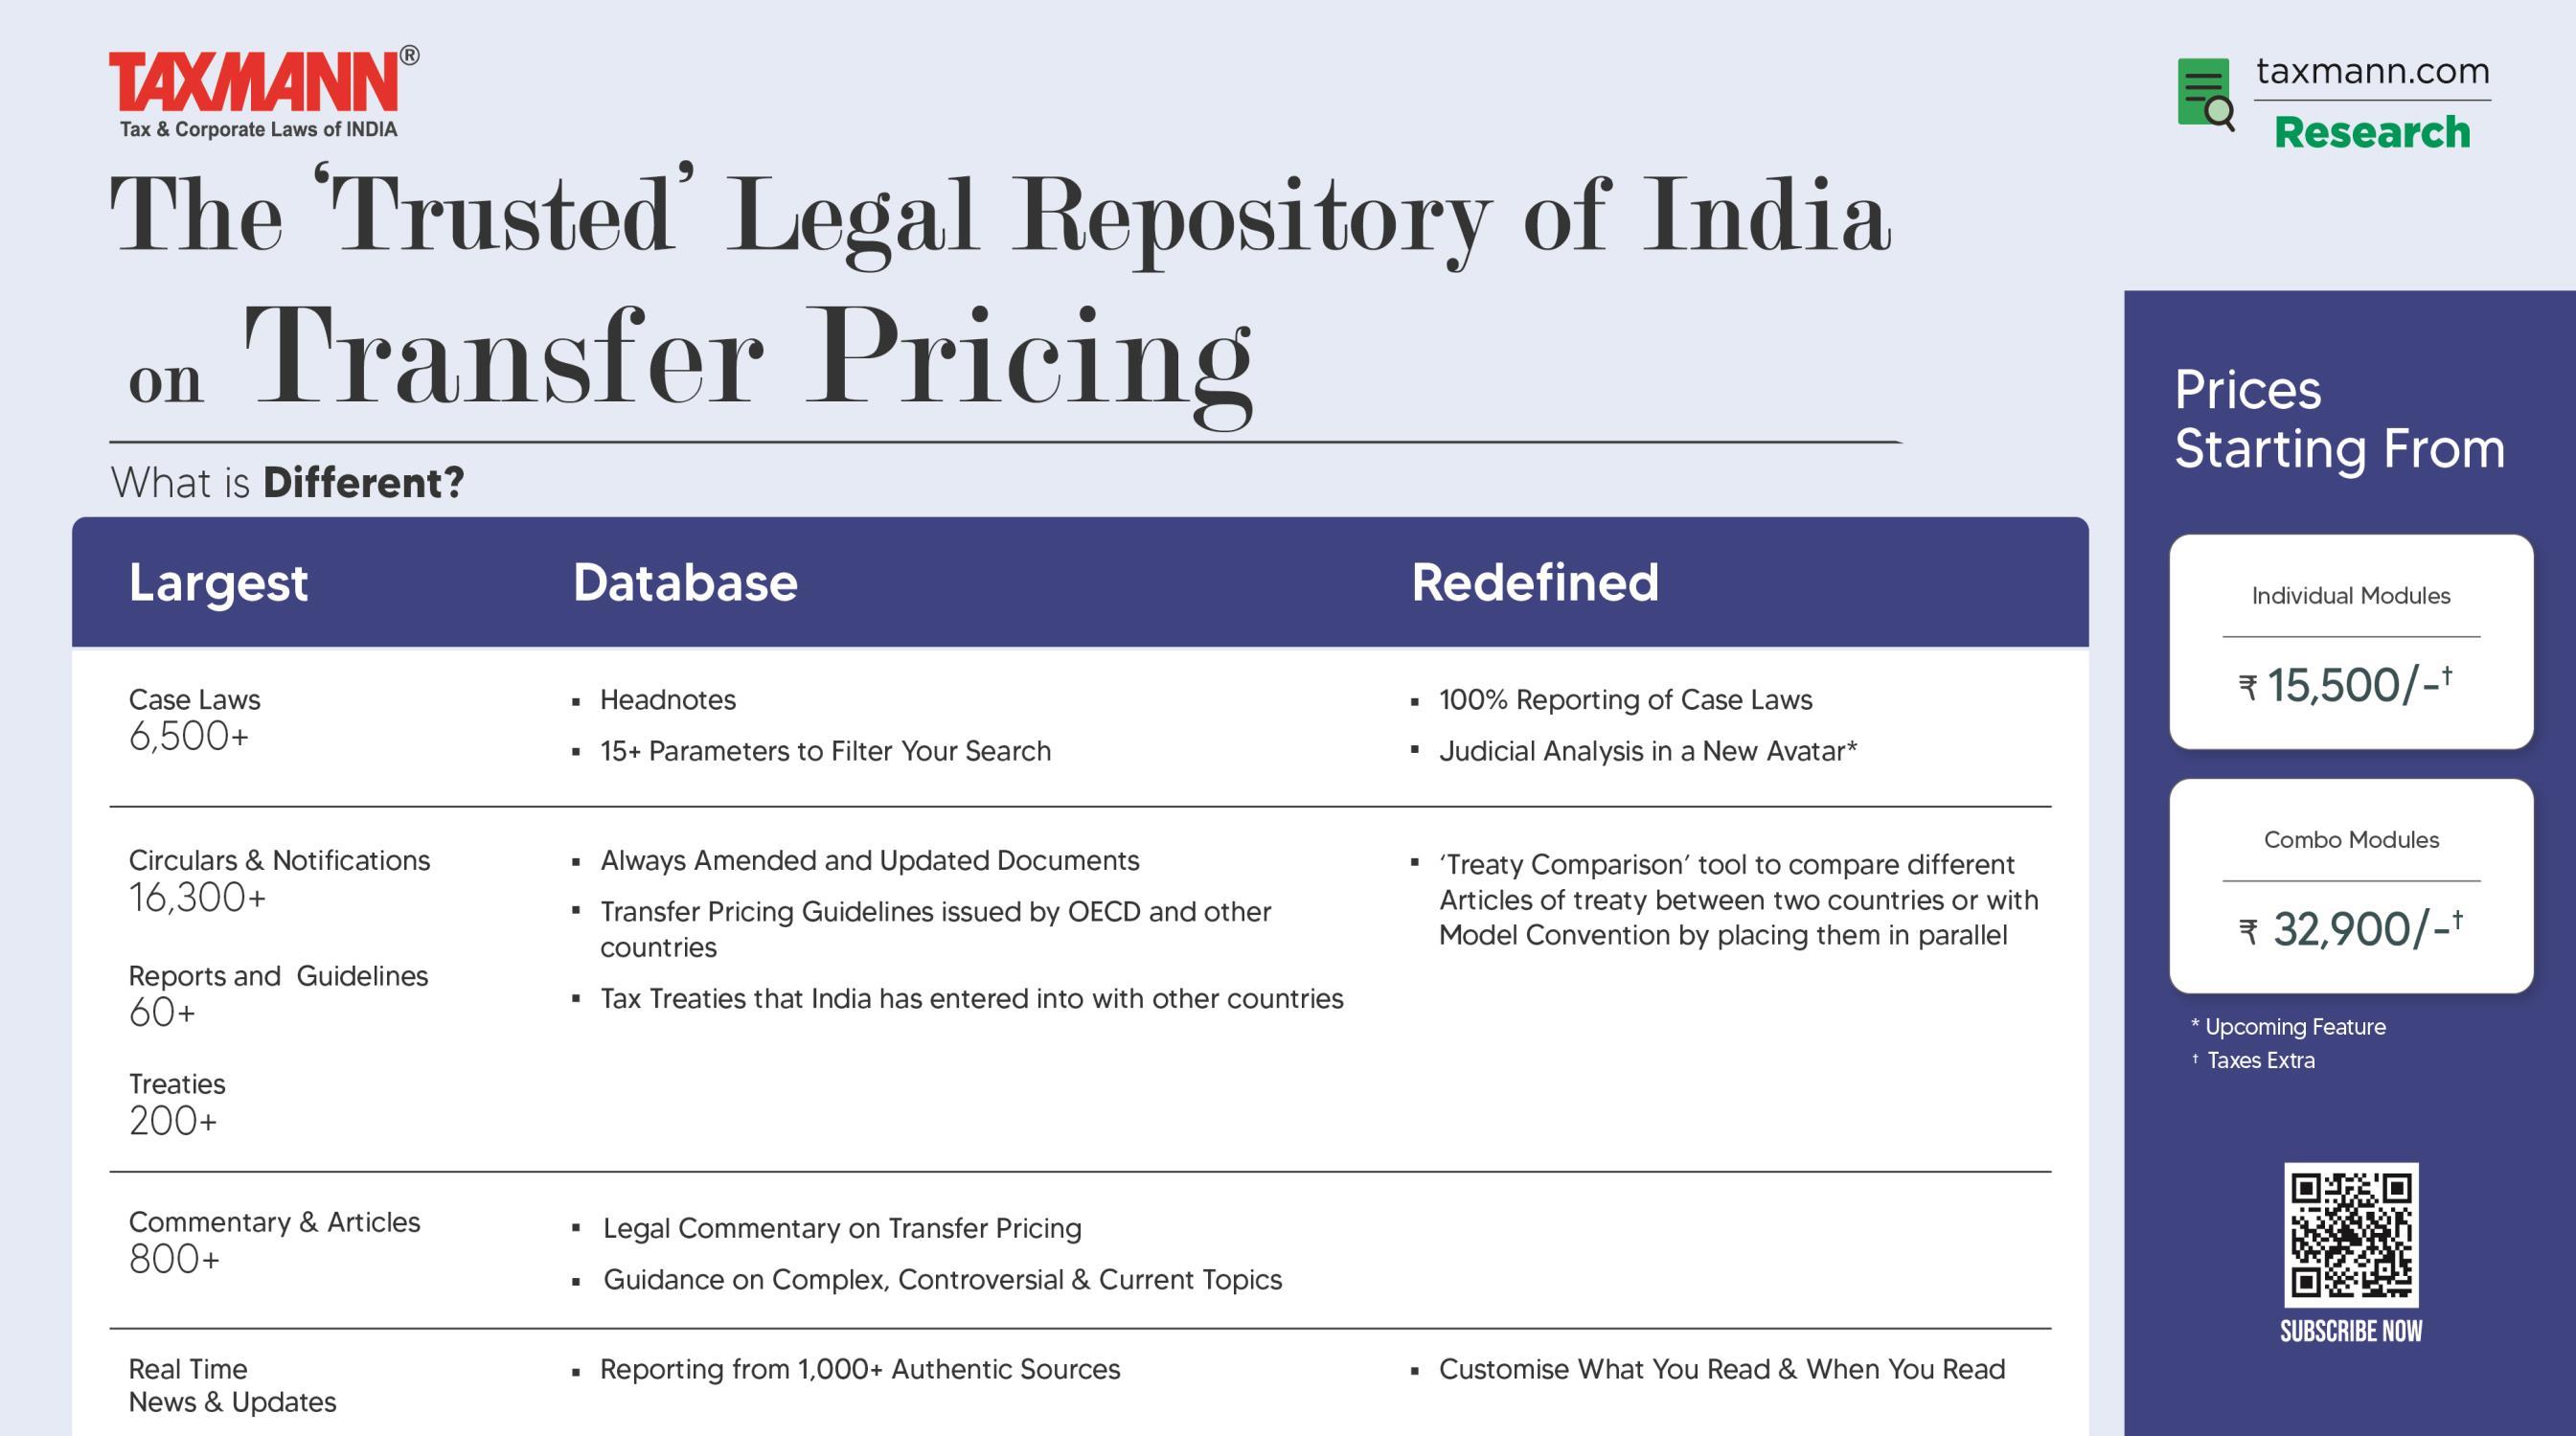
Session on


27th June 2024 - Thursday
5:00 PM – 6:00 PM - IST


Session on
27th June 2024 - Thursday
5:00 PM – 6:00 PM - IST

• The main objective of this session is to provide guidance on databases, as databases have not been specified by the OECD Manual or by Income TaxAuthorities.
• In this session, we will discuss the preferred databases used in benchmarking analysis, considering those utilized by transfer pricing authorities, consultants, and Big Four firms, along with their sources and limitations.
Preventing Tax Avoidance and Profit Shifting
Aligning Taxation with Value Creation
Protecting Tax Revenues of Jurisdictions
Why Transfer Pricing Regulations ?
Levelling the Playing Field for Businesses
Enhancing Transparency and Compliance
Ensuring Arm's Length Transactions via Single Entity Approach for MNEs

• The Income-tax Act was introduced in 1961 adopting the erstwhile Act of 1922 wherein the laws of taxation of MNEs became significantly important soon after the globalization of the Indian Economy. India has never become part of the OECD; however, UN Model has already adopted the OECD Model of Transfer Pricing back in the 1980s.
• Following the UN Model in line with the OECD Model Transfer Pricing was introduced in India with effect from April 2001 under Sections 92 to 92F of the Income Tax Act, 1961 (“the Act”) which covers intra-group cross-border transactions.
• The sections became applicable from 1st April 2001 for cross border transactions and from 1st April 2012 for Specified Domestic transactions.

Transfer Pricing was introduced in India with effect from April 2001 under Sections 92 to 92F of the Income Tax Act, 1961 (“Act’)
• Domestic Transfer Pricing Regime (Specified Domestic Transactions)
•Advance Pricing Agreement Regime
• International Transaction has been expanded

• Safe Harbour Rules
Framework for use of multiple year data and range concept in benchmarking analysis, three tier TP documentation structure as per BEPS (Base Erosion and Profit Shifting) Action Plan 13
Secondary adjustment provisions and limiting interest deduction for thinly capitalized companies

Customs (Assessable Value/Market Valuation)
VAT 2017 (Market Value for Related Party Transactions)
ESR 2019 (Substance Test for Relevant Activities – Holding Cos, HQ, IP, Distribution & Service Centres, Banking, Insurance, Investment Fund Management & Shipping)
Country-by-Country Report (BEPS Action Plan 13) 2019
BEPSAction Plans (AP) Implementation
AP 5 (Counter harmful tax practices)
AP 6 (Preventing treaty abuse)
AP13 (TPdocuments, including CbCR)
AP 14 (Make dispute resolution mechanisms more effective)
AP 15 (Develop a multilateral instrument)

Present (2023-25)
Corporate Tax & Transfer Pricing.
ALP test for Related Party & Connected Persons Payments
Year-end TP compliances (Disclosure Form, Local File & Master File)
Primary & Corresponding adjustments
BEPSAction Plans Implementation
AP 4 (Thin cap/interest deductions)
AP 7 (Prevent artificial avoidance of PE)
AP8 (Align TPwith value creation –Intangibles)
AP9 (Align TPwith value creation –Risk and Capital)
AP10 (Align TPwith value creation –high risk transactions)
UAE Transfer Pricing Rules
APA/MAP framework
Possible safe harbour rules
TP audit/litigation mechanism
Possible secondary adjustment provisions
Transfer Pricing Technology – Tools & AI
BEPS Pillar 2 (Global Minimum Tax Rules)
BEPS Pillar 1 (Market/users Jurisdictions)

Associated Enterprise as per Section 92A(1) of Income TaxAct, 1961
(1) For the purposes of this section and sections 92, 92B, 92C, 92D, 92E and 92F, “associated enterprise”, in relation to another enterprise, means an enterprise
(a) which participates, directly or indirectly, or through one or more intermediaries, in the management or control or capital of the other enterprise; or
(b) in respect of which one or more persons who participate, directly or indirectly, or through one or more intermediaries, in its management or control or capital, are the same persons who participate, directly or indirectly, or through one or more intermediaries, in the management or control or capital of the other enterprise.
Deemed Associated Enterprise as per Section 92A(2) of Income TaxAct, 1961
1. >= 26% direct / indirect holding by enterprise
2. By same person in each enterprise 3. Loan >= 51% of Total Assets 4. Guarantees > = 10% of debt
5. > 10% interest in Firm / AOP / BOI
6.Appointment > 50% of Directors / one or more Executive Director by an enterprise
7.Appointment by same person in each enterprise 8. 100% dependence on use of intangibles for manufacture/processing/ business 9. Direct / indirect supply of > = 90% Raw Materials under influenced prices and conditions 10. Sale under influenced prices and conditions
11. One enterprise controlled by an individual and the other by himself or his relative or jointly
12. One enterprise controlled by HUF and the other by
- a member of HUF
- his relative or - Jointly by member and relative
• Transactions between two or more AEs, either or both of whom are non-residents
Transactions
Covered
Method
Purchase/Sales of:
• Raw Materials
• Finished Goods
• Capital Goods/Assets
Both Licensing & Transfers of IP:
• Product Intangibles (Knowhow etc.)
• Marketing Intangibles (Brand, Trademarks, Logos etc.)
Debt financing
• Intra-group loans
• Guarantees
• Outstanding dues
Capital transactions
• Share issues & transfers
• IT/ITeS
• Marketing Support Services
• Intra-group Services
• Legal/Accounting/HR services etc.
Change in Supply Chain/Characterizations/Gr oup shareholding
Structure/Business Transfers & Combinations
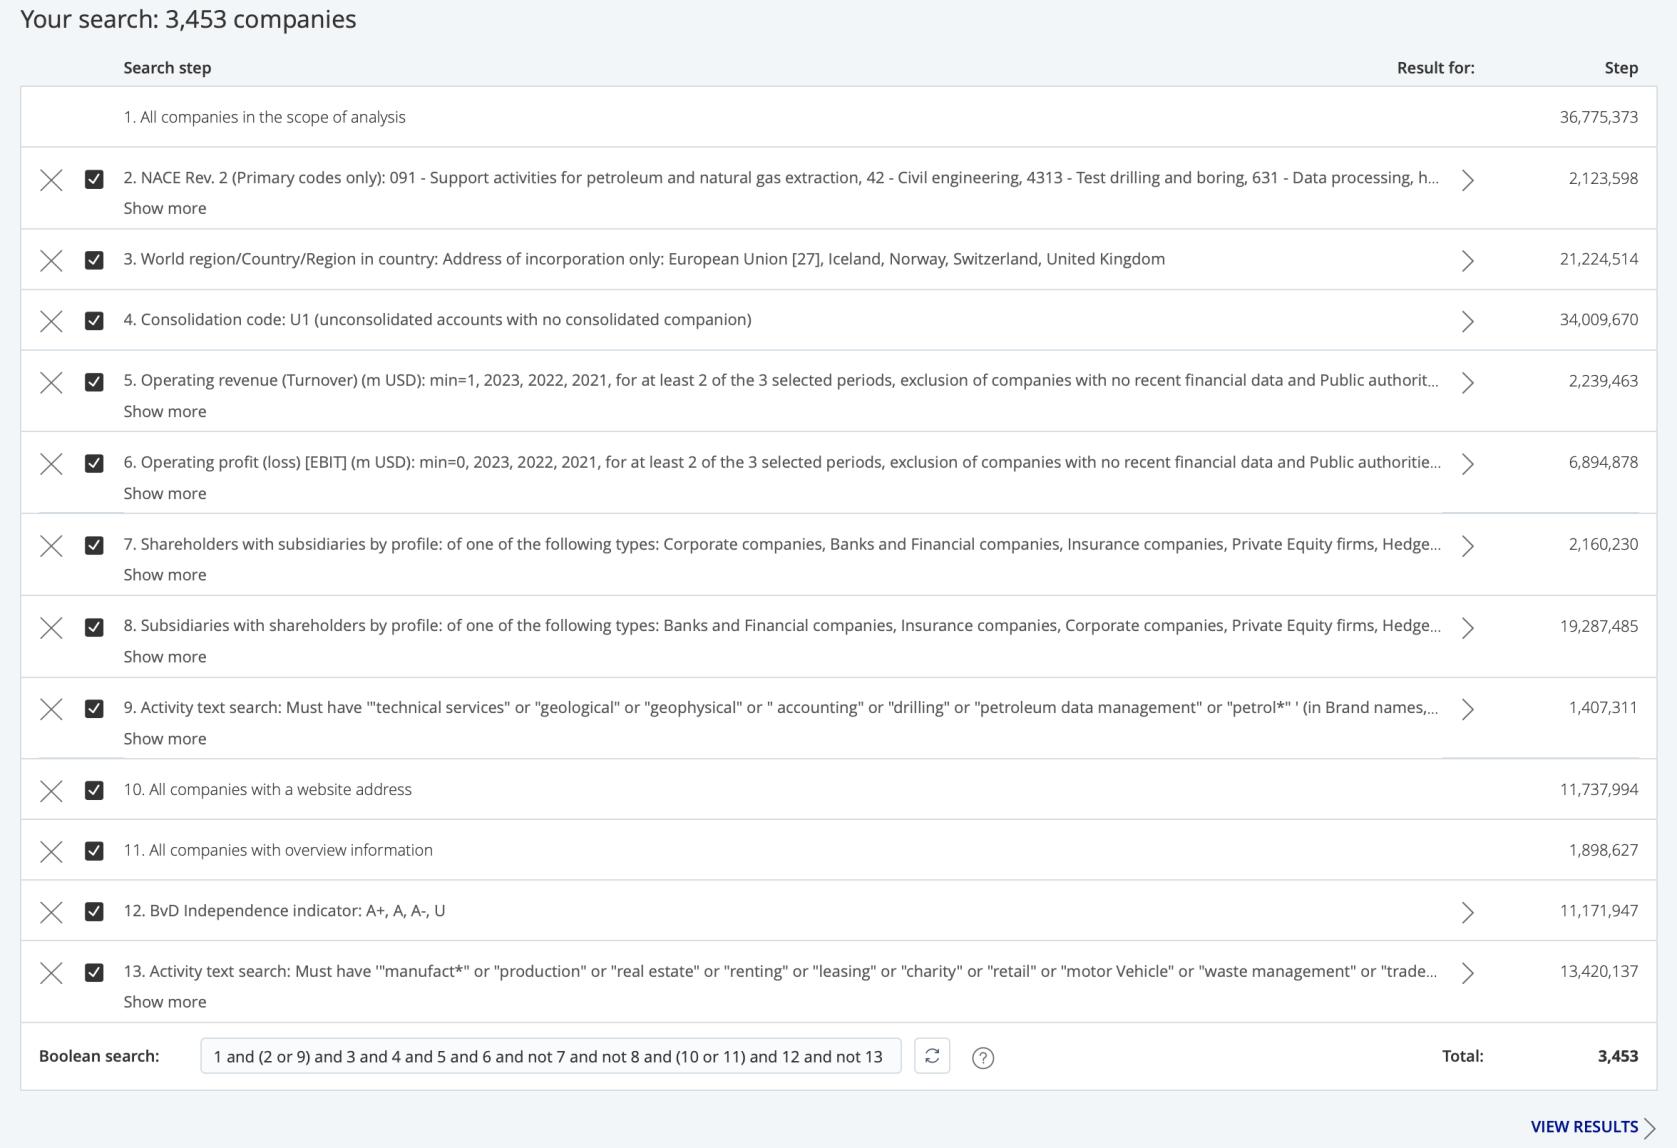
Database
• Trading- RPM
• Manufacturing- CPM, TNMM
• Royalty Payments: CUP,
• Highly Integrated and Unique Intangible Transactions: PSM
• India :Prowessiq, Capitaline, Ace TP
• UAE: TP Catalyst, S&P
Capital IQ
• Financial Transactions: CUP
• Capital Transactions: Other Method
• Services: TNMM
Royaltyrange, Royaltystat
Loan Connector
• India :Prowessiq, Capitaline, Ace TP
• UAE: TP Catalyst, S&P
Capital IQ
• Business Restructuring: Depends on facts
Internal/Management /Industry data
Price applied or proposed to be applied in a transaction between persons other thanAEs, in uncontrolled conditions
Determination of arm’s length prices using one of the Prescribed methods
Whether you arrive at a single price ?
The price thus determined is the arm’s length price
Earlier: The arithmetic mean of such prices, read with sec 92C(2) +1% (upper ceiling) for wholesale traders; and + 3% (upper ceiling) in all other cases
Replaced in current financeAct with a range (to be defined) and mean to apply only in case of inadequate comparables
Traditional Transaction Methods
Comparable Uncontrolled Price Method(CUP)
CUP- Interest rates, Royalty/license fee, Purchase/Sale of goods/Provision of services where close comparables are available etc.
Resale Price Method (RPM)
Cost Plus Method (CPM)
RPM - Trading operations – buy and sale without any value addition etc.
Transactional Profit Methods
Profit Split Method (PSM)
Transactional Net Margin Method (TNMM)
PSM - Transfer of intangibles, Highly integrated business operations etc.)
TNMMManufacturing operations, trading operations where RPM is inadequate, Provision of services etc.
CPM - Sale of semi finished goods, provision of services where cost details are available etc.
Any Other Method
(transactions where valuation reports or third party quotes or standard rate cards etc. are available)
• Some common nature of transactions and the most applicable methods is specified below:
Distribution of goods
Provision of services (IT, ITeS)
Financial transaction (interest on loan, corporate guarantee)
Royalty Payment
Highly Integrated and Unique Intangible transactions
Sale/ purchase of commodities, shares, fixed assets
(where value can be substantiatedwith valuation report, quotation etc.)
Specified Domestic Transaction – Inter-Unit Transfers
Profit Level Indicators (PLIs) are financial ratios that measure the relationship between profits and costs incurred or resources employed.
The use of an appropriate PLI ensures better accuracy in the determination of the arm’s length price of a related party transaction.
The Resale Price Method (RPM), Cost Plus Method (CPM) and Transactional Net Margin Method (TNMM) are the transfer pricing methods that use PLI to determine whether the related party transaction involved is carried out at arm’s length
Factors to consider include but are not limited to in determining the PLI:
• characterization of business;
• availability of comparable data; and
• the extent to which the PLI is likely to produce a reliable measure of arm’s length profit.
Generally used PLIs
direct & indirect cost of production TNMM
plus Markup
Profit/Operating Cost TNMM
Profit/Operating Revenue
Profit/ ValueAddition TNMM
• For the purpose of transfer pricing margin computation, it is important to only consider those items of income / expense which are directly related to core operations of the company
• Operating items - Those relating to the day-to-day operations of the enterprise, being incurred in the normal course of business and related to the principle revenue generating activities.
• Non-operating items - Includes investing and financing activities which are not related to principle revenue generating activities.
ForeignExchange Gains/ Losses
Saleofscrap
Provisions/liabilities/balances no longer required written back
Commission received
Interest from customers on delayed payment
Miscellaneous Income
Deferred/Amortised Expenditure
BankCharges
Businessdevelopment expense
Commission paid
Rent paid
Payment orreceipt ofInterest/Dividend
RentReceived
Write-backof provision for diminutionin the value of investments /impairment of assets
Profitor Loss on sale ofAssets/Investments/Assets written-off
Finance charges
Priorperiodexpense
Donations/ CSR expenses Loss on fire/ naturalcalamities/thefts etc.
Preliminary and pre-operating cost
Provision for doubtful debts or other contingent provisions
Extra-ordinary incomes or expenses
Applicability to Methods
Evolution over years

Data


Tolerance
Before 2014 –Single year Data
After 2014 –
Multiple year data up to preceding 2 years
Finance Act
2011- +/- 5% on Transfer Price
Finance Act 2012+/- 1% for wholesalers +/3% for others On TransferPrice
RangeTransactions before 01-04-2014


Arithmetic
Mean with benefit of Tolerance Range


Arithmetic
Mean- If the *conditions are not satisfied
RangeTransactions after 01-04-2014

35th & 65th
Percentile- if Transaction price is within the range if 6 or more comparables are present
TP Adjustment to be calculated on Median- If transaction price falls outside the range

International Practices
Range – Inter-Quartile range : 25th & 75th Percentiles
All methods are applicable for Range and Multiple Year data concept
No minimum comparables required for Range Concept
Applicability of Range concept
As per Rule 10CA, the ‘range concept’shall be applicable when:
(a) the MAM is either CUP, RPM, CPM, or TNMM; and
(b) there are at least 6 comparables.
“Range” concept followed internationally; also propounded by OECD
Use of inter-quartile range is amongst the globally accepted best practice and also closer to economic realities wherein prices, and or margins, are compared to those within a range and not at to a particular point.
India has adopted percentile concept instead of inter-quartile range
Arithmetic mean concept is also used where number of comparable is inadequate

RelevantAspect of TP
Comparability
Comparability
RSM – High
PSM, RSM - Difficult to apply as high degree of comparability required
CUP- Very difficult to apply as very high degree of comparability required PSM - Complex method, sparingly used
- Most commonly used method
Conclusion
Economic analysis
(CbC) Report
Selection of most appropriate method
Selection of
TransactionAnalysis
• Activity –Services/Manufacturing/Tradi
ng
• Scope ofActivities
• Transaction Flow –Domestic/International
• Entities Involved
• Segment/Industry
• Remuneration Mechanism/TP Model
• Existing Price/Margin
• Functions Performed
• Assets Employed
• Risks Borne
Characterisation of Entities
• Full-fledged or Contract Manufacturer
• Full-fledged or Limited Risk Distributor
• High-End or Low-End Services Provider Economic Analysis
• Selection of TP Method (CUP/RPM/CPM/PSM/TNMM /Other Method)
• Selection of Tested Party (Indian Taxpayer or Foreign AE)
• Selection of Profit Level Indicator (PLI)
• Selection of TP database
• Comparability Analysis
• Arm’s Length Range
Requirement: Companies are obligated to comply with the relevant TP regulations in the country (Ex: In India Sec 92 and Rule 10, in UAE Article 34) which necessitates that transactions with Related Parties meet the arm's length standard for determining taxable income.
This standard implies that transactions should produce results consistent with what unrelated parties would achieve in similar circumstances/same industry in open market.
To determine arm's length prices, companies utilize various transfer pricing methods, such as CUP, RPM, CPM, TNMM, and PSM.
Methods such as CUP, RPM, CPM, and TNMM rely on external data to establish comparable pricing. Even in cases where internal comparable data is present, tax authorities may consider it unreliable or tailored specifically for transfer pricing compliance. Thus, it is imperative to conduct an external industry benchmark for transfer pricing planning and compliance.
Data Sources: To find potential comparables, companies explore various sources, including TP databases, internal data, and other publicly available information.
TPDatabases: TPdatabases
(TPCatalyst, S&PCapital IQ, RoyaltyStat & Loan Connector) compile publicly available company data in an accessible format, making them a practical and costeffective source of external comparables.
Geographic Expansion:
Normally, the relevant jurisdiction will be considered based on the Service provider, Place of supply or Service Recipient. Depending on the tested party the jurisdiction of search would be relevant. For example, in cases where financial data in a particular region, such as the UAE, is limited, companies may need to broaden their search to regions like Middle East, Africa and Eastern Europe. Multi-jurisdictional data has to be used in case regional companies are not available.
It is worth noting that there is no government database containing such financial information. Based on our experience, none of the mature transfer pricing jurisdictions publish similar financial information for transfer pricing in the public domain.
The only realistic option available to the taxpayer for finding comparables is to rely on a financial database to obtain financial information for companies operating in the Middle East, Africa, and Eastern Europe across a spectrum of industries.
7. Qualitative analysis
1. Select most appropriate TP method
There are two Types of Methods:
1. Traditional Transaction Methods:
• Comparable Uncontrolled Price (CUP)
• Resale Price Method (RPM)
• Cost Plus Method (CPM)
2. Transactional Profit Methods:
• Profit Split Method (PSM)
• Transactional Net Margin Method (TNMM)
2. Select Tested Party
The entity to be selected as the "tested party" should be the least complex and not necessarily unique.
Download the annual report and review business description, service or product profile, segmental info, extraordinary events, IP holdings etc.
3. Select Profit Level Indicator
Selecting the right PLI depends on the transaction's specifics, including: (1) business type; (2) comparable data; and (3) PLI reliability in measuring arm's length profit.


8. Final Set of Comparable Companies
Finalize the set of comparable companies.

4. Select publicly available database
Databases such as CapitaLine, AceTP, Prowess, Capital IQ, Bloomberg, Tracxn, RoyaltyStat, RoyaltyRange, etc can be utilized to access relevant data.
5. Industry classification and key words
Select industry classification and key words pertaining to the entity under consideration.
If there are more than 6, compute the 3year weighted average mark-up and use the 35th to 65th percentile range. Otherwise, use the average mark-up.
6. Quantitative Analysis
Apply filters/screens such as:
• data availability,
• Sales>1 Cr,
• Positive net worth,
• Core services income > 75%,
• Export earnings > 75%,
• RPT transactions < 25% etc.
9. Economic Adjustments
If there are any differences in comparables and test party, adjust those differences undertaking economic adjustments
There are no specific public databases recommended for identifying comparable companies as per the United Nations Transfer Pricing (UN TP) guide, the Organisation for Economic Co-operation and Development (OECD) Guidelines, and the Income Tax Act. Following are the preferred databases
Transaction Database Provider Content Region
Capitaline TP
Manufacturing , Trading, Services
Capital Market Publishers India
Prowess Centre for Monitoring Indian Economy
Ace TP Accord Fintech
TP Catalyst Bureau Van Dijk
Capital IQ –Financials S&P
Interest transactions


Company financial information (Private & Listed Companies) India

Global


Bloomberg Bloomberg Reference Data Services Financial markets data Global
Dealscan/Loan
Connector
Reffinitiv//Thomso n Reuters (Worldwide) Financial transactions data (loans) Global


Royalty, Intangible assets
RoyaltyStat License Agreement Database Intangibles License Agreements (Sourced from US SEC) Global

Royaltysource RoyaltySource
Royaltyrange Royaltyrange


• Data Extracted from Annual Reports
• Information from mandatory filings like 10-K and 20-F, for listed companies.
• Intercompany agreements serve as a valuable source of TPdata, detailing the terms and conditions of transactions between related entities.
• These agreements provide essential information for establishing arm’s length nature of transaction, they also outline roles, responsibilities, risks and rewards for accurate analysis
• Reports from industry analysts and market research firms provide valuable insights.
• Industry-specific studies provide comparative data on margins, royalties, and other pricing metrics.
• Using private company financials as a source offers more accurate and relevant comparables for benchmarking analysis, as private companies often operate in specific markets or industries similar to the tested party.
• However, limited access to reliable and comprehensive financial data for private companies can challenge thorough and accurate analysis compared to public companies.
Data Quality:
• Financial data from public sources can vary in detail and accuracy
• Databases may not be updated in real-time
Timing Issues:
• Financial data is often available only after a significant delay
• Using historical financials may not reflect current market conditions
Veracity of Information:
• Public companies are required to disclose more detailed information compared to private companies, leading to potential biases in available data.
• Errors in data collection, reporting, or entry can affect the reliability
• of the databases.
:
• Some databases have better coverage in specific regions, which may not be representative of the global market.
• Differences in tax laws and accounting standards across jurisdictions can complicate the comparability of data.
• Certain industries may be underrepresented in databases, making it challenging to find comparable data
• Companies with unique or innovative business models may not find adequate comparables in existing databases
Commonly used quantitative filters are:
1.Availability of financial data
2.Different FY Ending
3.Turnover filter
4. Net worth filter
5.Consistently loss-making companies
6.Export filter
7.Employee Cost filter
8.Related party transactions filter
Commonly used qualitative filters are:
1.Employee cost filter
2.Service income /operating income filter
3.Manufacturing income Filter

Directors Report


Notes to Accounts

Management Discussion Auditor's Reports

Available in:
• Capitaline
• ISI Emerging Markets
• ACE Equity
• MCAWebsite
• ProwessIQ
Commonly used qualitative filters are:
1.Product/Service Profile
2.Segments
3.Presence of IP/Brand
4.R&D functions
5.Fluctuating/Abnormal Profits
6.Extra-ordinary events/circumstances
7.Government Companies
8.Exceptional year of operations
Step - 1
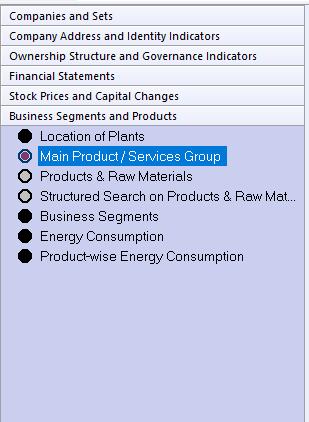
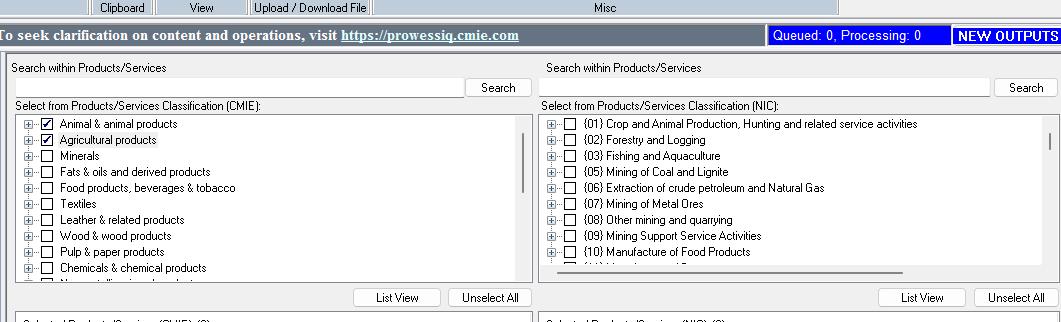
• Login to Prowess with User ID and Password.
• From the left dialog box select “Business segment and products” tab.
Step-2: After selecting main product/ service group, relevant key words may be selected by entering the relevant words in the search box. The Keywords selected will then be reflected in the dialog box below as Selected Product/ Services.
1. Select “main product or service group”
2. Select “Key words”

The same step of selecting keywords can be done from the tabs “Products & Raw materials, Structured search on products & raw materials and Business segment”
Step-3: Once all the relevant keywords are selected,
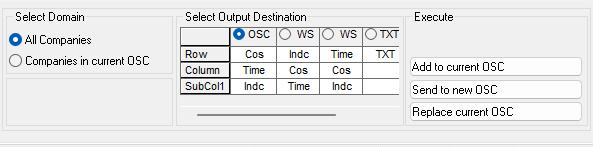
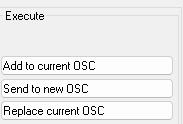
- Under “Select domain”: select “All companies”
- Under “execute” in the bottom right corner, click “send to new OSC”
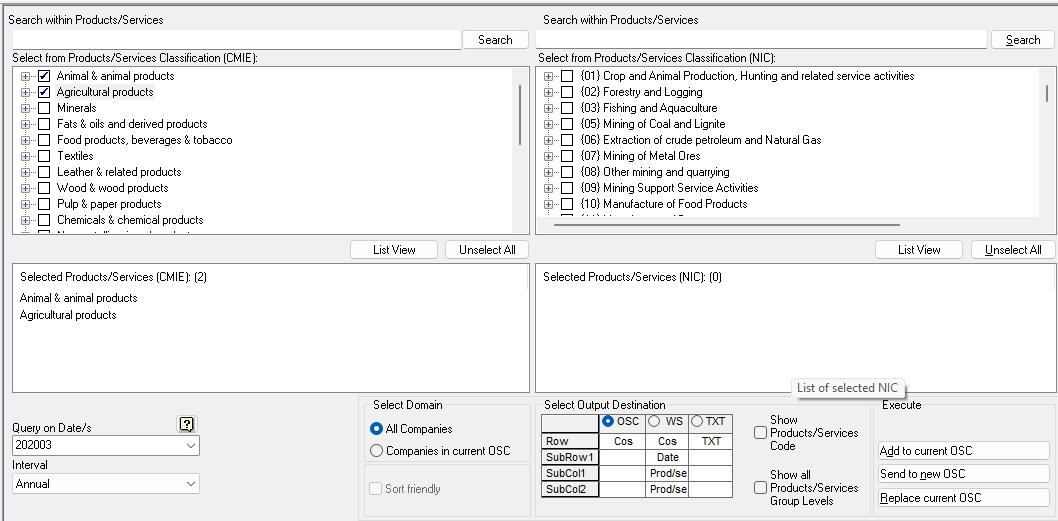
1.All Companies in Domain
2. Send to new OSC
Note: In case keywords are being selected from tabs “Products & raw materials, Structured search on products & raw materials” after selecting from “main products/ services group”, the same shall be “added to current OSC” rather than “sending it to new OSC”.
Step-4: After the Companies get triggered we will be able to see a tab “NEW OUTPUTS” blinking in blue colour on the top right corner. Click on the same and a new dialogue box appears. Press “Continue” and the relevant companies will be listed in the output view.
1. This will blink in blue. Press 'New Output'.
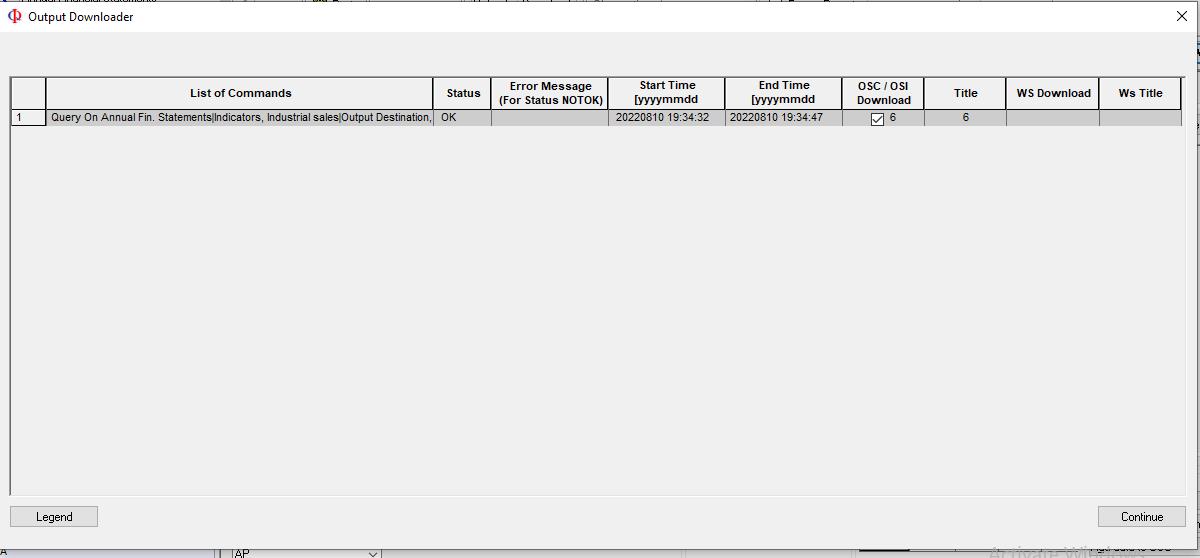
2. Press “continue” here
You will be automatically taken to the “Output View” containing the list of companies triggered with the search criteria selected previously.
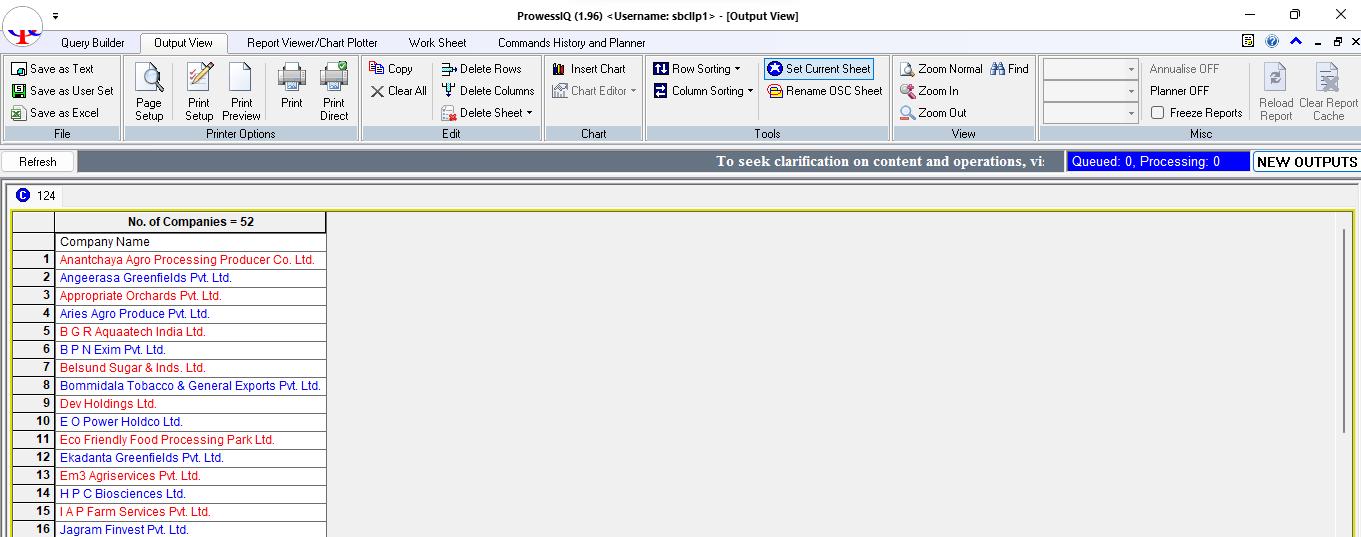
We find companies that are related to our industry
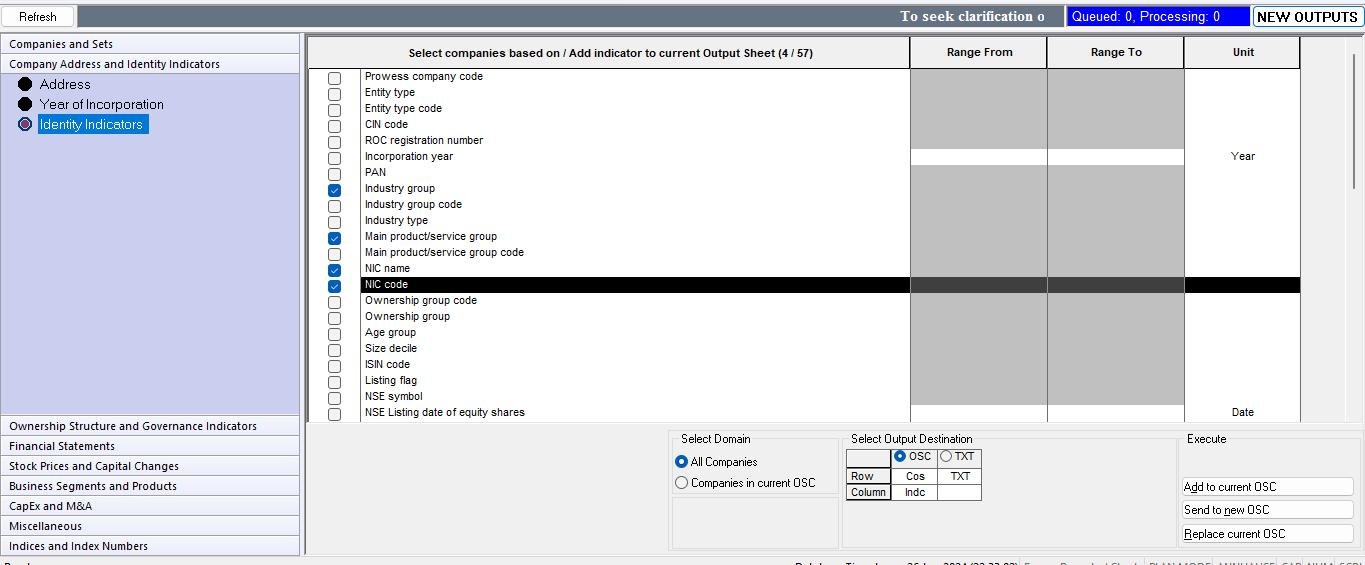
Step-1: Select “Company Address and Identity Indicators” tab from the left dialog box
Step-2: Select NIC Code, NIC name, Industry Type, Main Product/ Service Group and any other fields from the right adjacent dialog box.
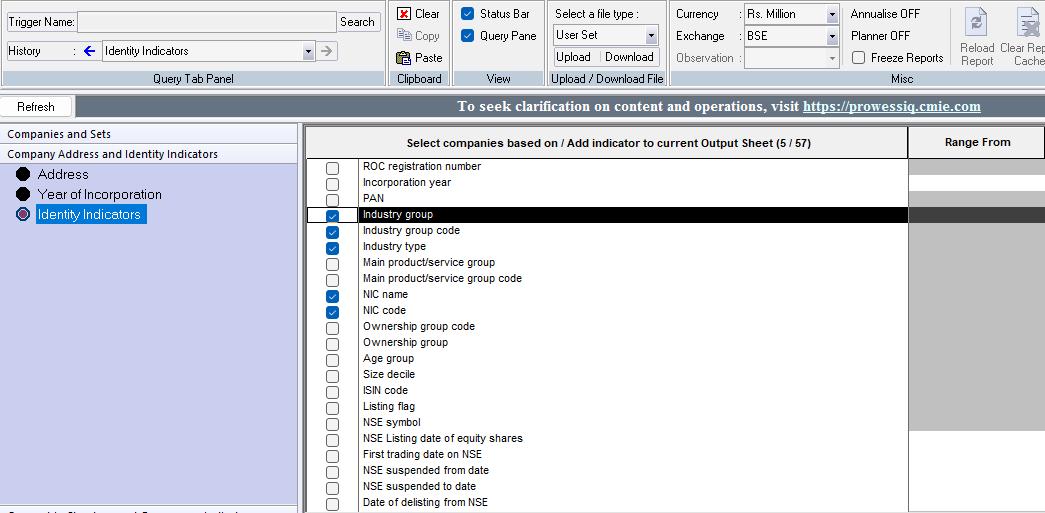
Select “Identity Indicators”
3. Choose “NIC Code”, “NIC name”, “Industry Type”, “Main Product/ Service Group”
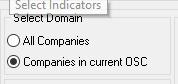
Step-3: After selecting the required data choose “Companies in current OSC” for extracting the selected identity indicators for the companies previously triggered.
1. Select Companies in current OSC in Domain so that Identity indicators will be added to the companies in current OSC
Step-4: Send the data to current OSC from the dialog box at the right corner. The identity indicators would be added to the companies existing in the output view.
2.Add to Current OSC in Execute
Change of currency:
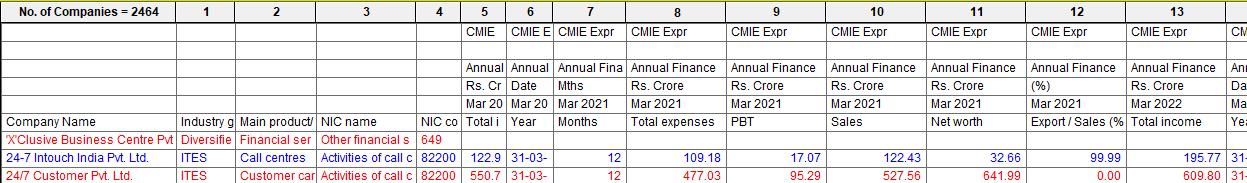
Before extracting the financial information for the companies in output sheet, change the currency from “Rs. Million” to “Rs. Crore”.
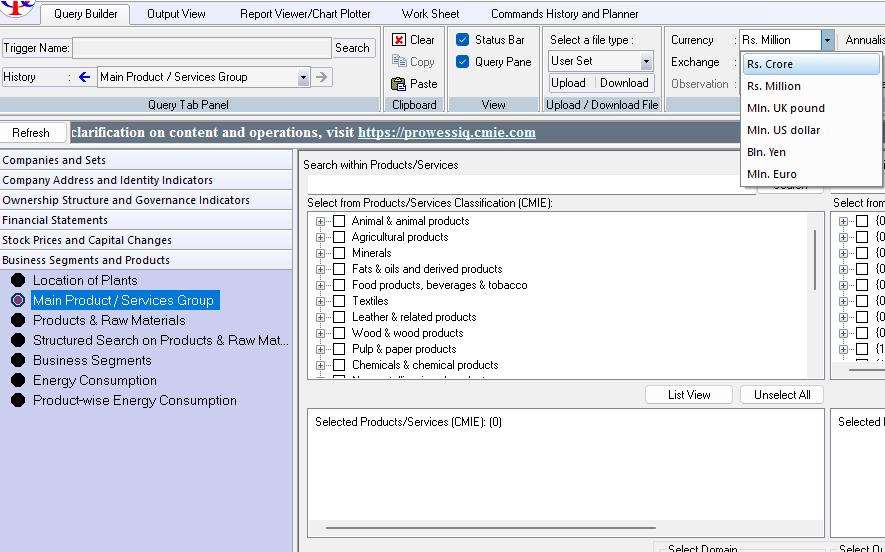
The default currency will be "Rs. Million," so change it to "Rs. Crores."
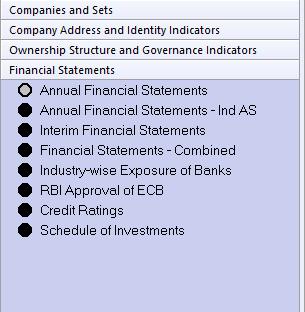
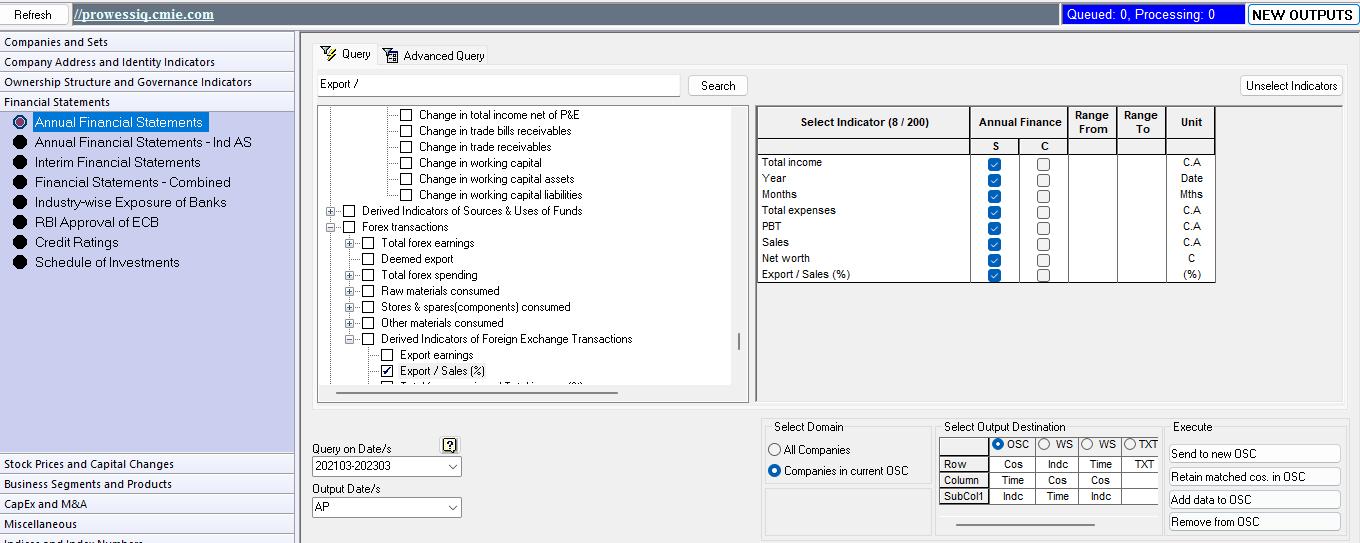
Step-1: Select “Financial Statements” tab from the left dialog box
Step-2: Select “Annual Financial Statements” from the drop down available below.
Step-3: Select the required Annual Information for applying filters from the adjacent dialog box using search box such as :
In “Financial Statements” select “Annual Financial Statements”
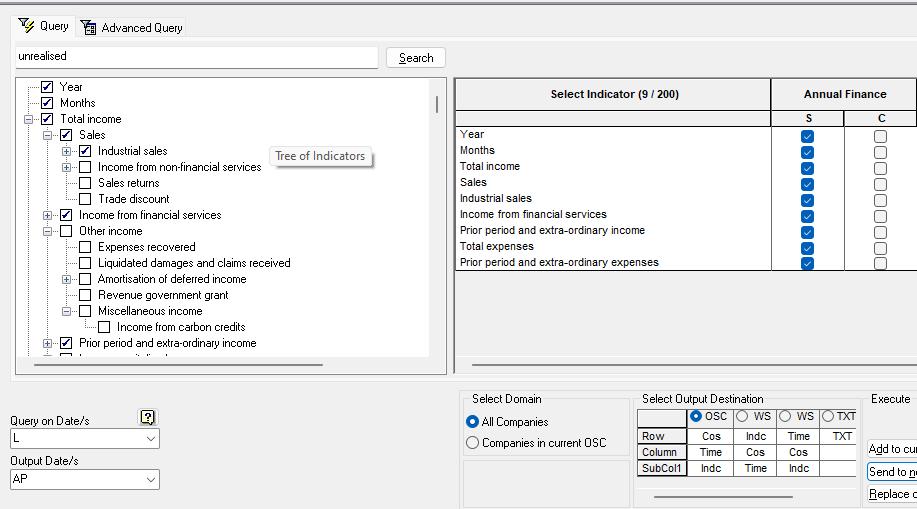
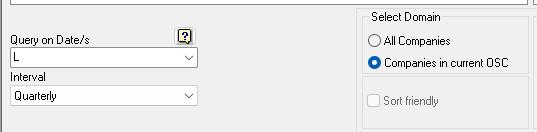
Step-4: Select Query on date for the period for which the data is required for the triggered companies in the format YYYYMM – YYYYMM
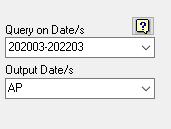
Step 5: Click “companies in current OSC” to extract financial data for the relevant period for the companies already triggered in the output sheet
Step 6: Add data to OSC and continue
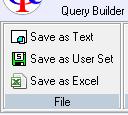
Step 7: Open “Output view” Tab and select “Save as Excel” from the left corner tab to save and extract the output as Excel.
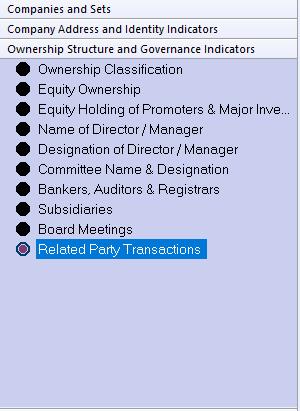
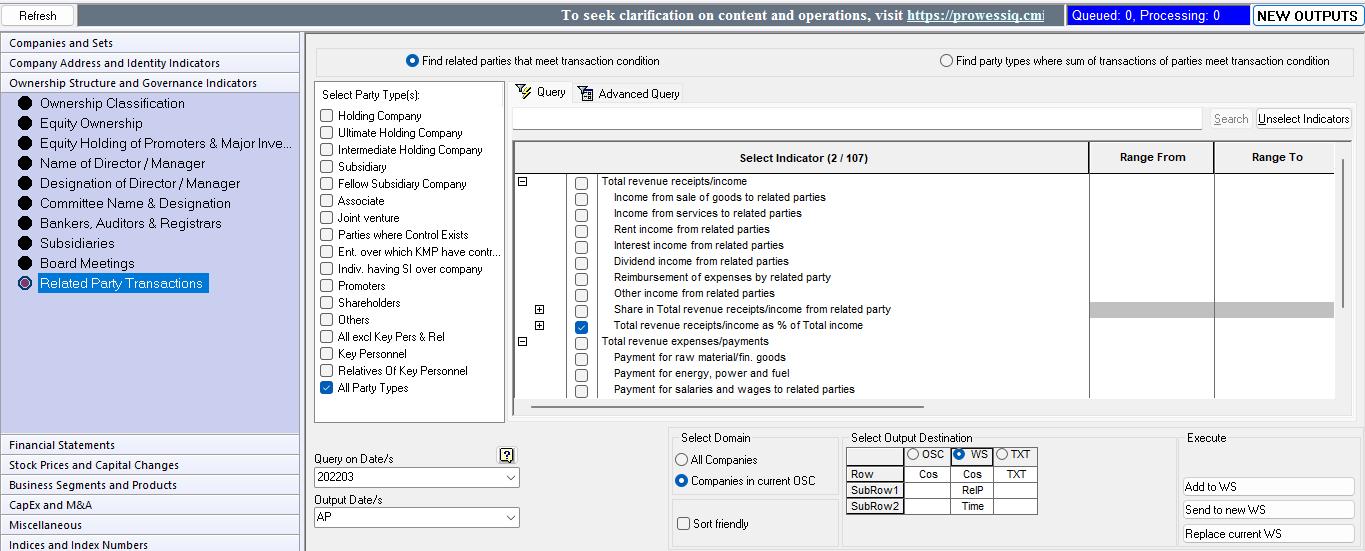
Step-8: Under “Ownership and Governance Indicators tab” from the left dialog box select “Related Party Transactions” from the drop down available below
Step-9: From the “Select Party Type(s)” dialog box select “All Party Types”.
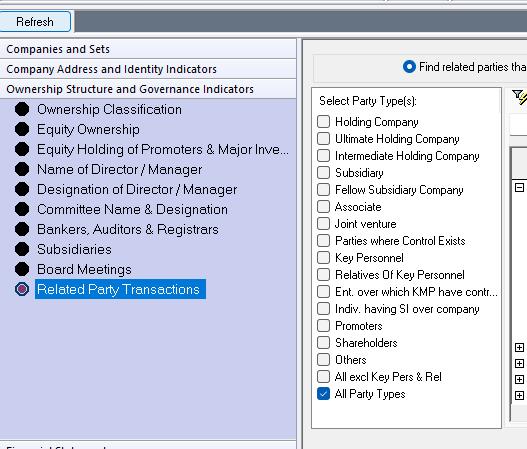
1. Under “Ownership and Governance Indicators tab” select “Related Party Transactions”
2. Select “All Party Types” in Related Party Transactions
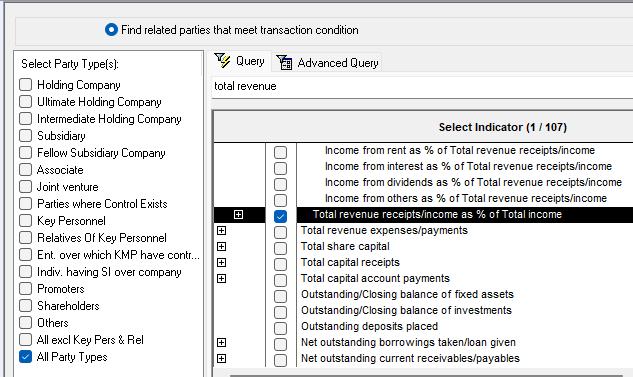
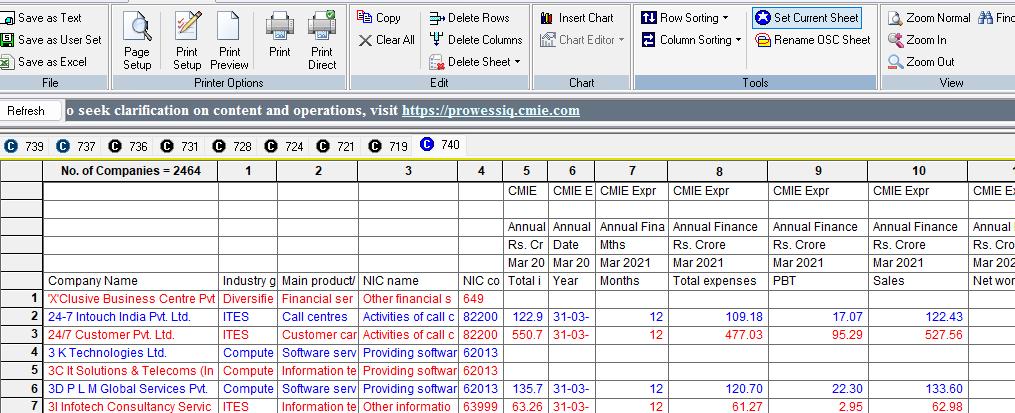
Step-10: Select “Total revenue receipts/income as a % of Total income” and “Total revenue expenses/payments as a % of Total Expenses” from the adjacent dialog box.
1. Select “Total Revenue receipts as a % of Total Revenue 2. Select “Total Expenses as a % of Total Expenses

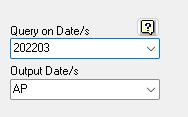
Step-12: Select Query on date as for the period for which the data is required for the triggered companies in the format YYYYMM
1. Select the year to which the filters apply
Step 13: Further select Companies in current OSC from the dialog box at the right corner to extract the Related Party Transactions for the relevant period for the companies already triggered in the output
Step 14: Further select Output destination as WS tab from the dialog box adjacent to Select Domain
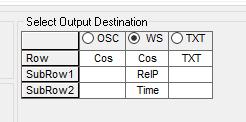
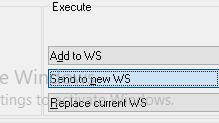
2. Select Output Destination as “Worksheet (WS)”
3. Press “Send to new WS”
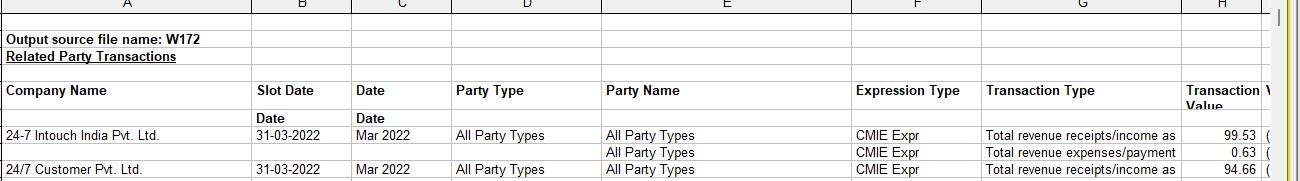
Step 15: Select Send to new WS tab to extract related party data into new work sheet. The data will be triggered after some time
4. Data will reflect here
Step 16: After the Data is triggered the “NEW OUTPUTS” on the right end blinks. Further click on the same and a new dialogue box appears. Press “Continue” and the relevant Related party data will be triggered in the Worksheet.
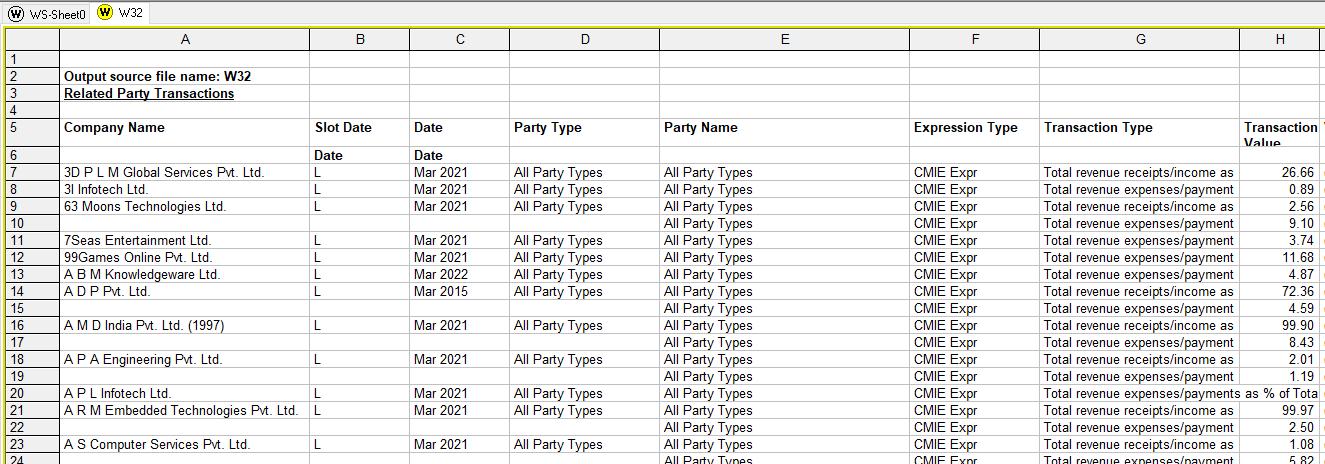
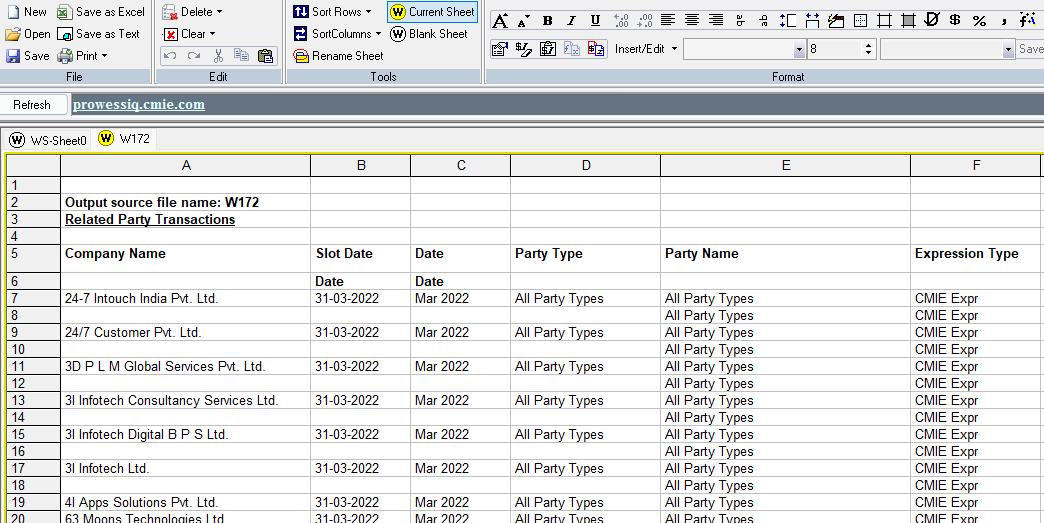
Step 17: We can anytime view data from the “Worksheet Tab” and export it as Excel and save it with the relevant name in any folder.
1. Export it as Excel and save it any folder
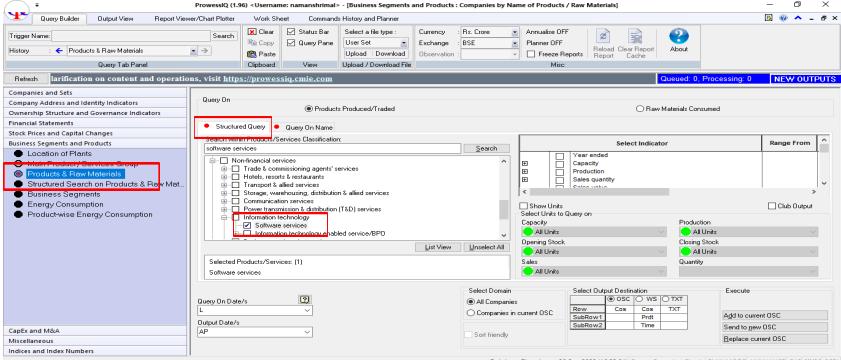
• Indian company providing Software Development Services
• Revenue from operation during the year
• NCP ( Net cost plus markup /Total operating cost)
Provision of Software Development Services
Tested Party Assessee Company
Selection of Method
CUP: No Internal Cup , External CUP data unavailable
RPM: not a reseller Gross Margin of comparable unavailable
CPM: Gross Margin data of comparables unavailable
PSM: No intangibles involved
TNMM: Selected in absence of any other preferred method
Any other method: Since TNMM is selected


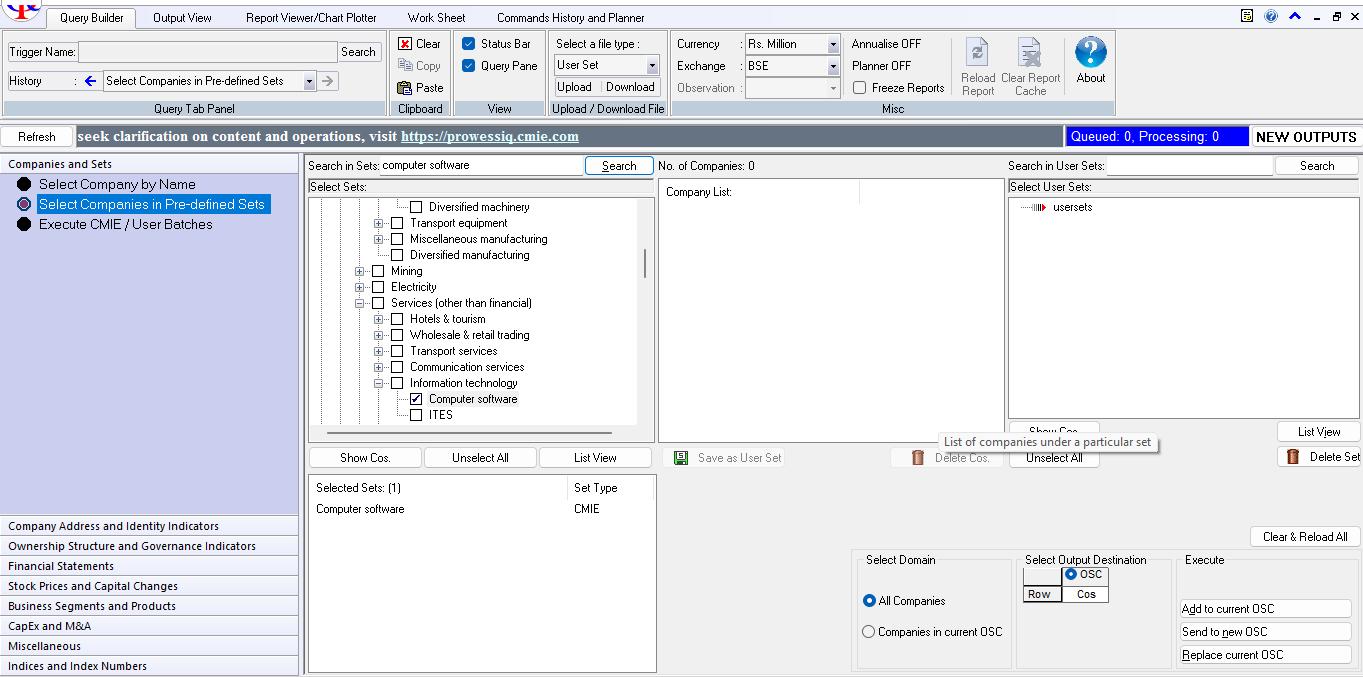
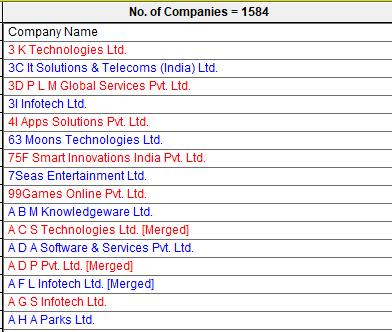
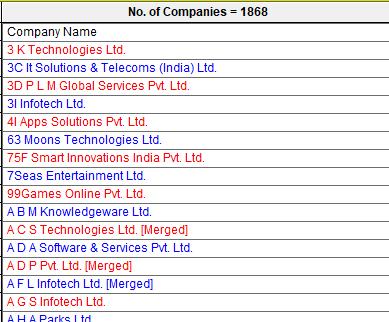
Select Companies in Pre- defined Sets Computer Software No.of Companies Added: 1584
1. Click “Companies in Pre- defined Sets” Tab 2. Select “Keywords relevant for IT Industry
All Companies in Domain
Send to new OSC
1584 companies added
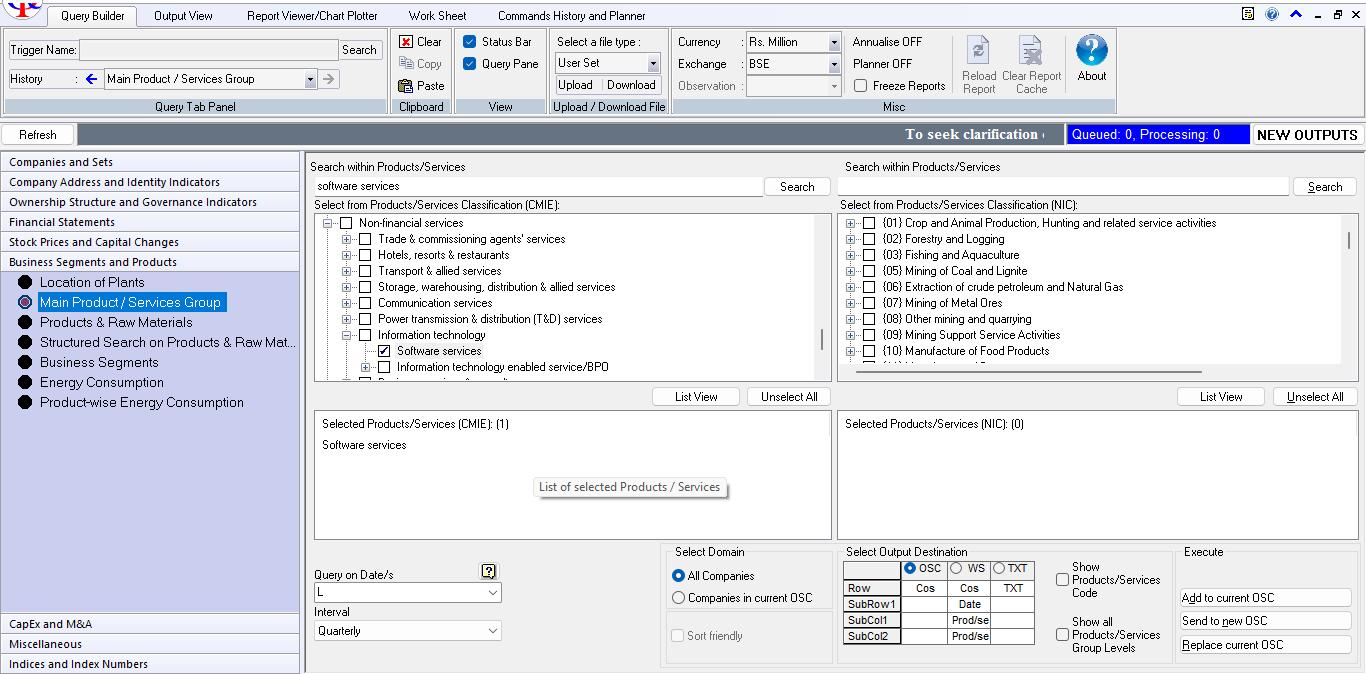
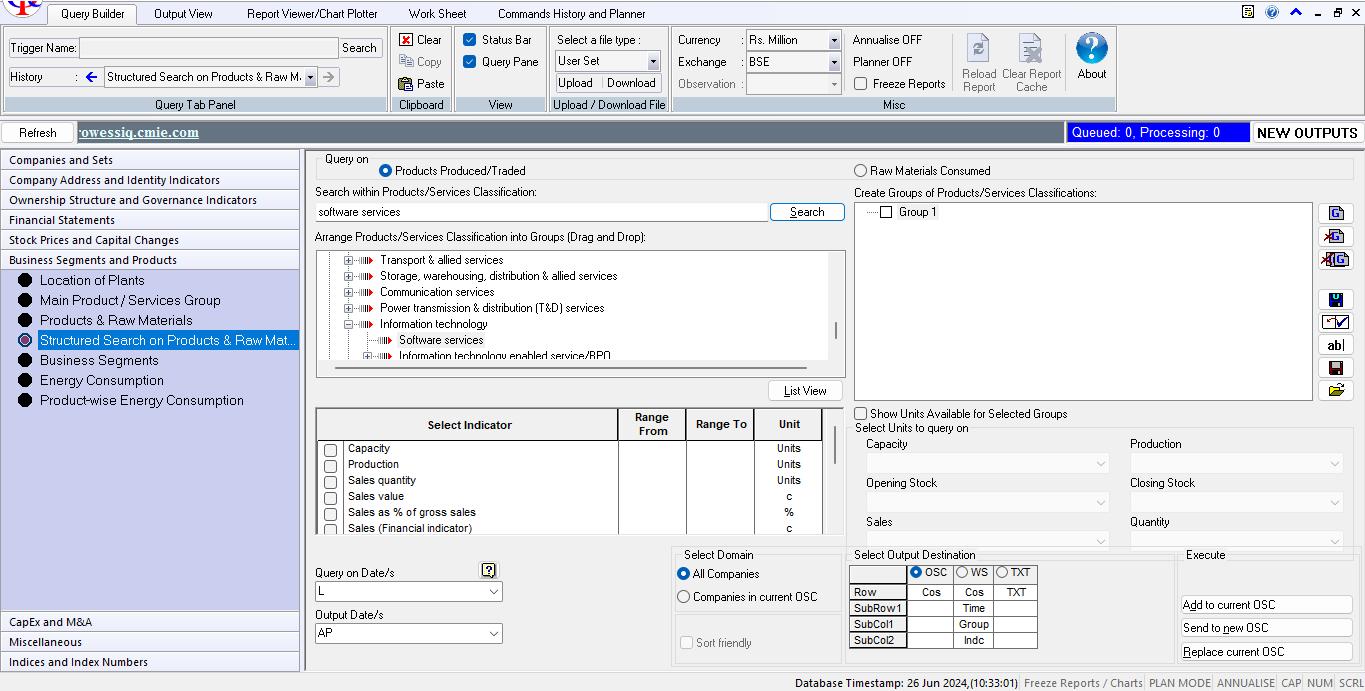
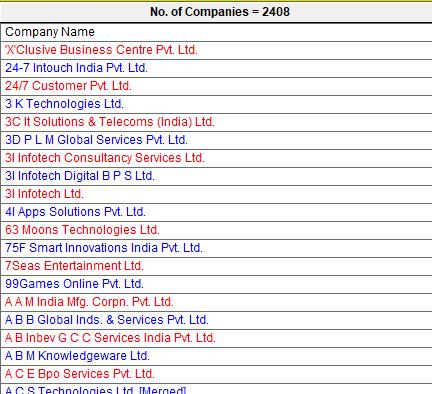
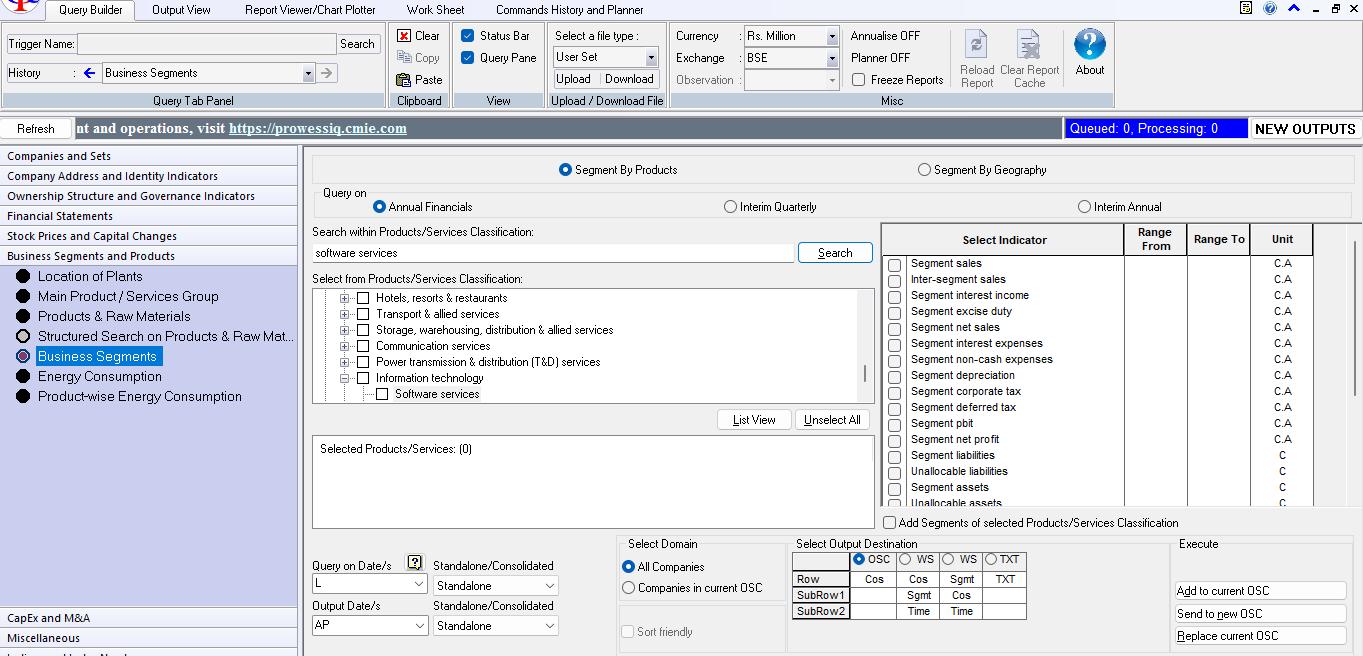
Query by Structure Search on Products & Raw material – Products Produced and traded
Query on Name - Software services
No.of Companies - 2408 1. Click “Structure
1. Click “Identity Indicators” Tab 2. Select “Indicators”
The final data can then be exported/copied to excel worksheet for quantitative analysis.
The final comparable data can be saved as a “user set” for future use and reference.
1. Export it as Excel and save it any folder
SelectAll party types
Select Related party incomes and expenses`
Click “Annual Financial Statements”
Companies in Current OSC in Domain 6. Send to New WS
Select “WS” 7. Output
The final data can then be exported/copied to excel worksheet for quantitative analysis.
1. Export it as Excel and save it any folder
Following Keywords have been used to arrive at the Comparables specific to Software Development Services.
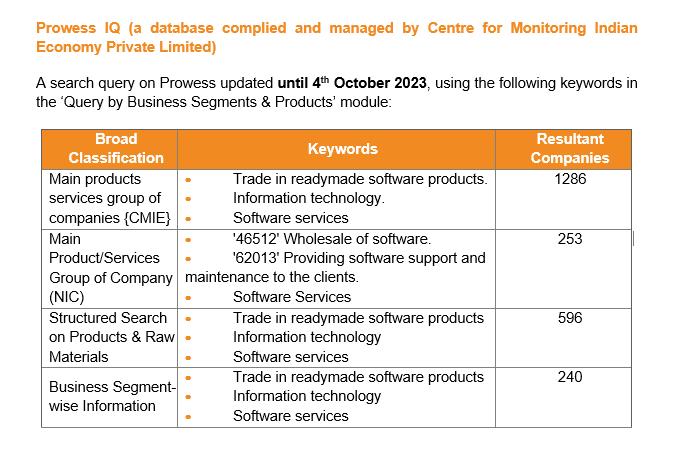
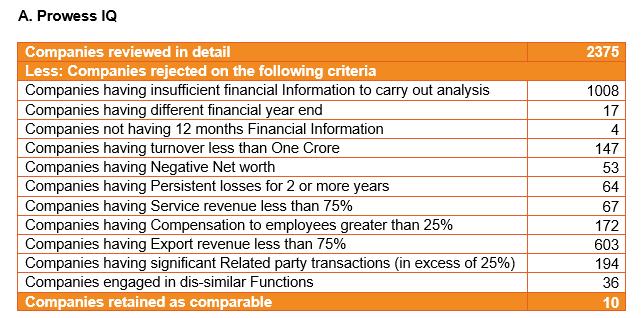
The following qualitative and quantitative filters have been applied to the master data obtained from the Prowess search to arrive at the final list of comparables similar to the tested party.
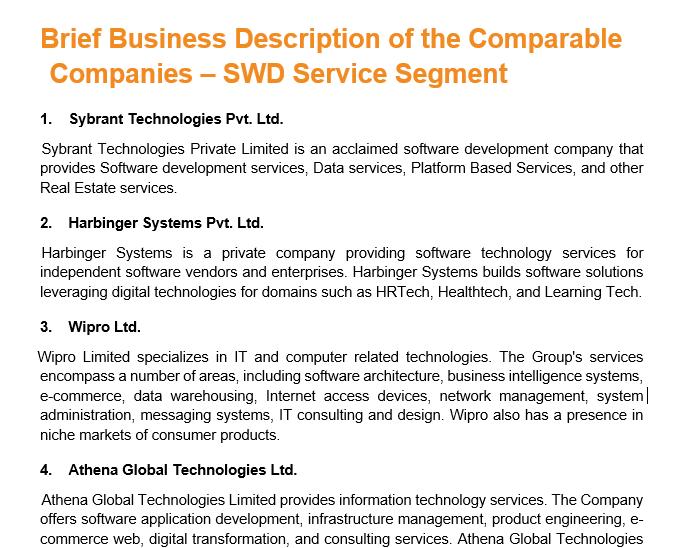
For the final list of comparables, we need to summarize the business descriptions from financial statements, media sources, the company's website, and intercompany agreements or any other Internal data.
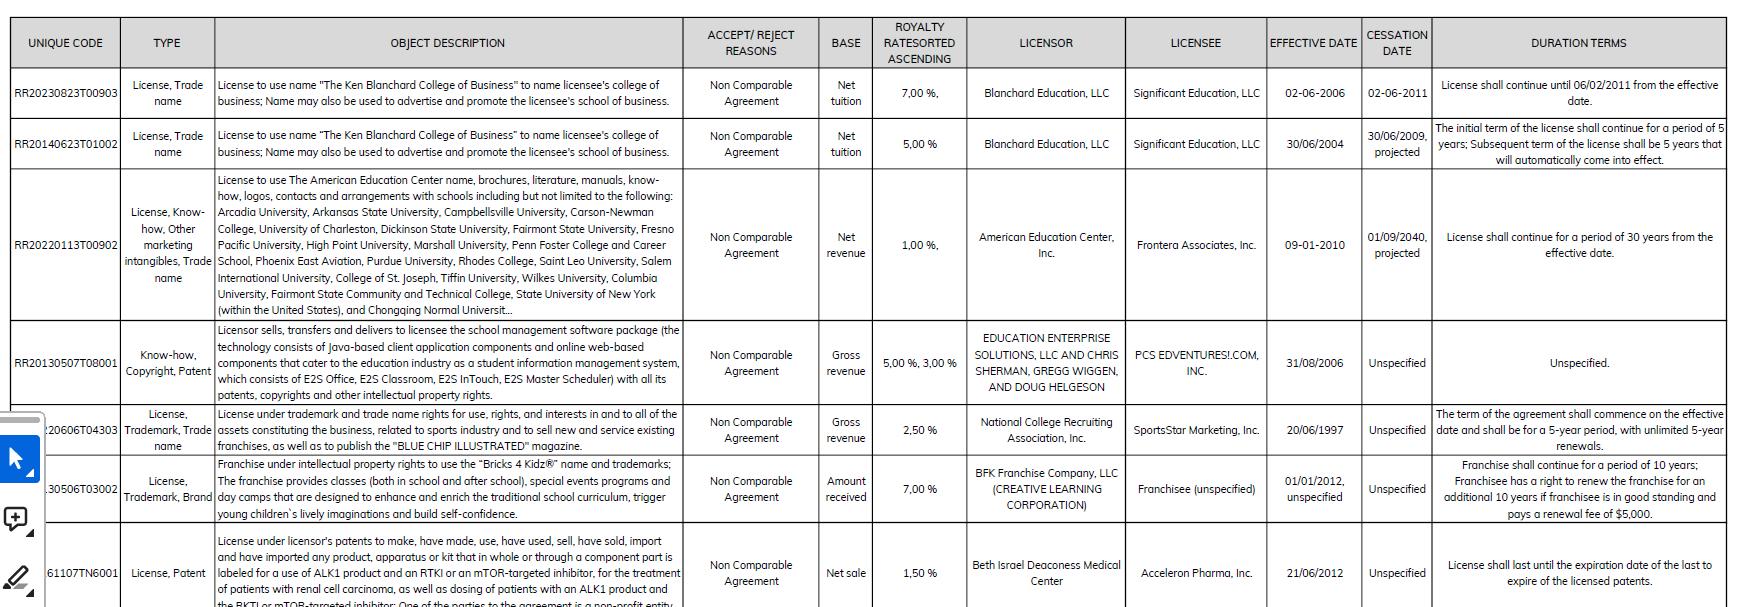
Below is an illustrative example for your reference.
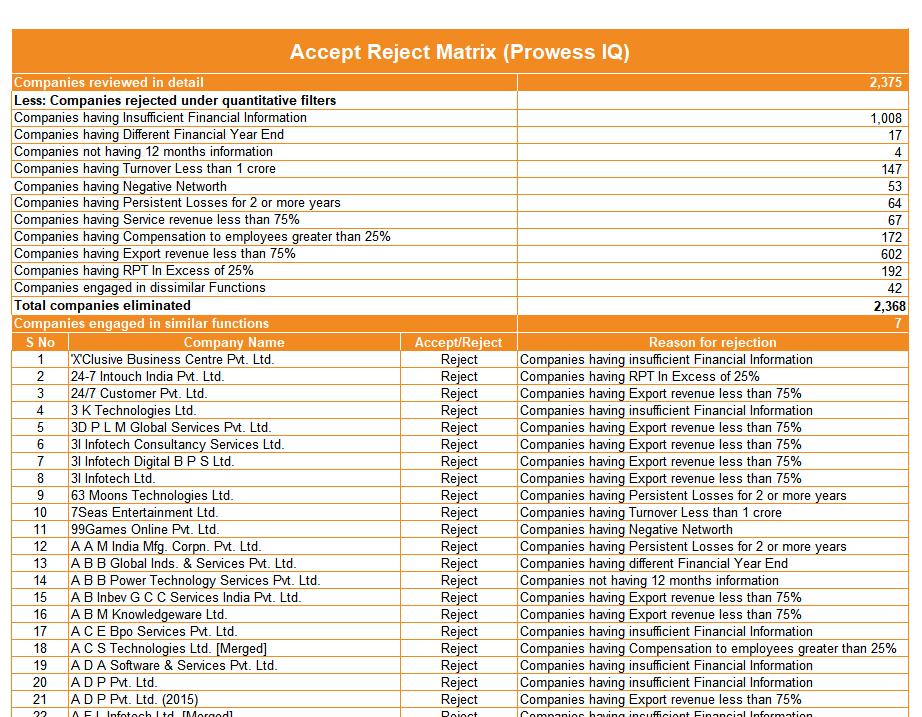
Accept Reject Matrix: Displays the companies that have been accepted or rejected, which have been extracted from the Prowess search, along with the reasons for their acceptance or rejection.
An Illustrative Example is provided below:
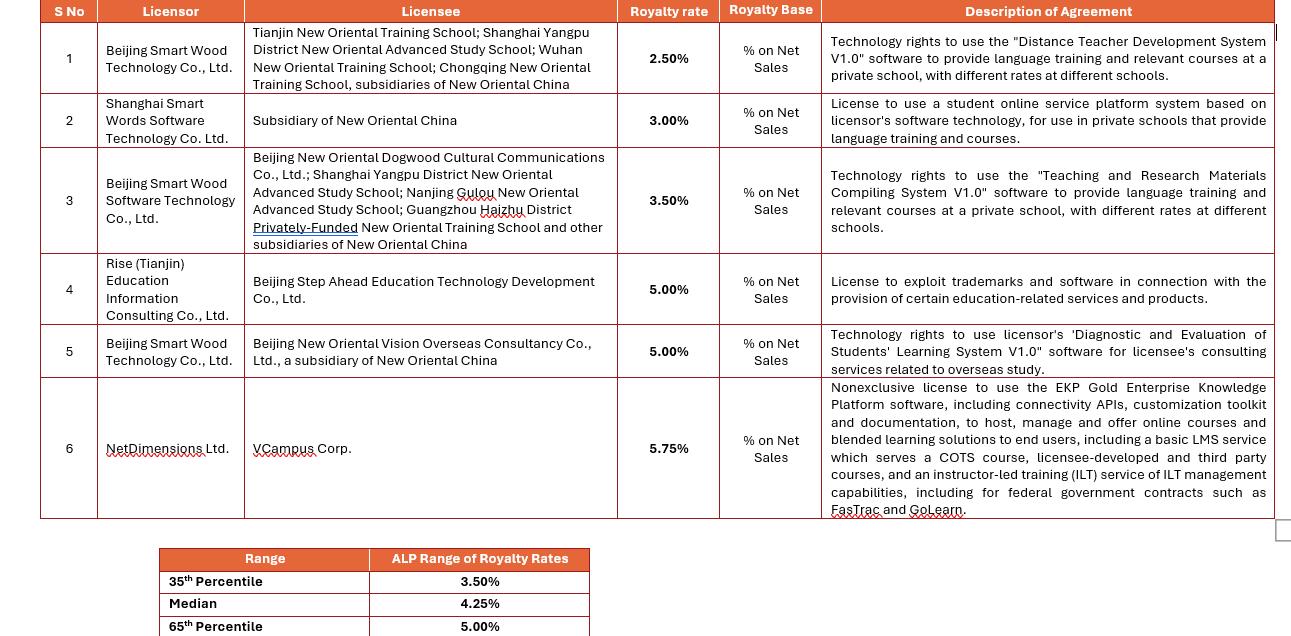
Below is the final list of comparables that pass all the quantitative and qualitative filters specified in the earlier slides (refer to slides 28 and 29).
Among the six methods (Refer slide 9), TNMM has been selected as the most appropriate method, and OP/OC has been chosen as the PLI for the provision of software development services.
Range Concept has been used instead of Average Concept since there are more than 6 comparables.
Multiple year data has considered and had computed weighted average for the past three financial years data.
Since the No.of Comparable is even, Median will be average of 5& 6.
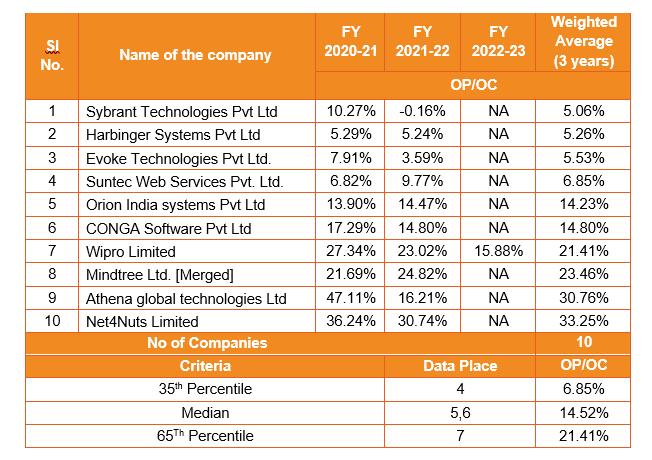
• Tested party Cost Plus mark up is 10%
• Since the tested party percentage is within the range transaction i.e., 6.85% to 21.41%, it can be said to be atArm’s length.
• If the tested party margin is below the range, adjustment will be proposed.

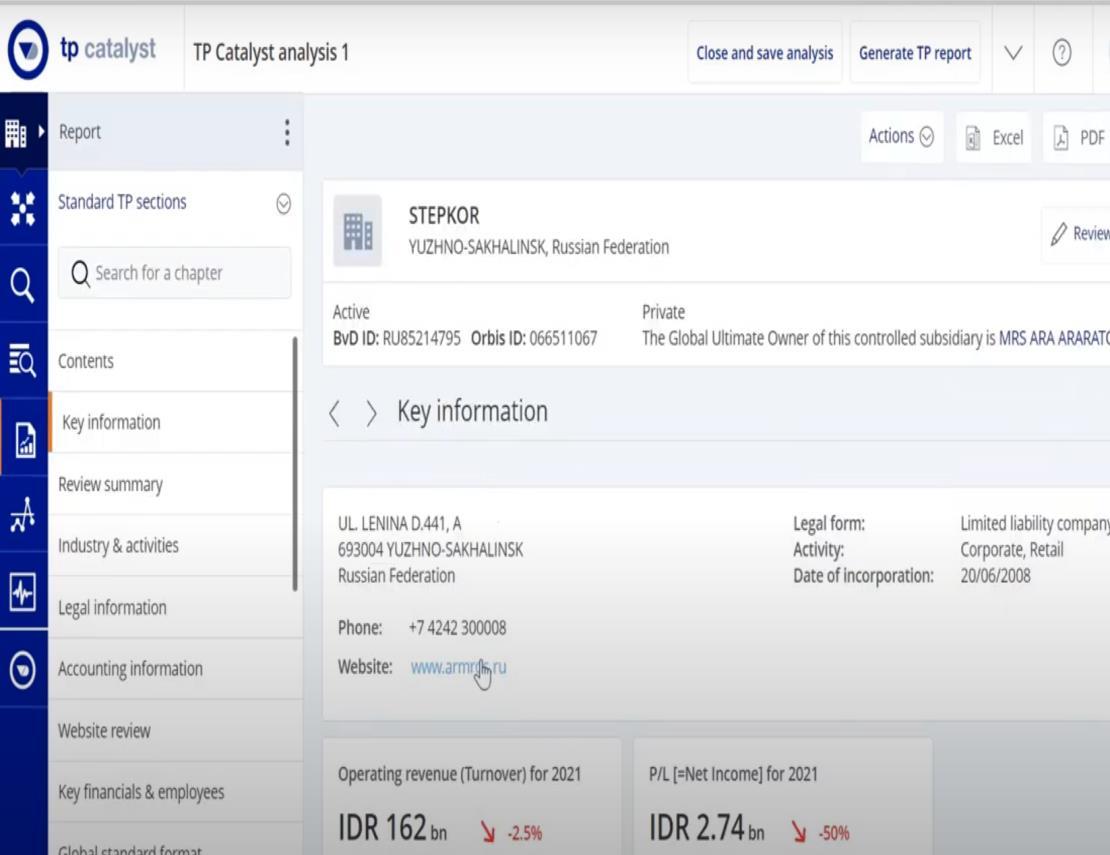
Step 1: To begin the process, access the TP Catalyst database by logging in with your provided credentials.
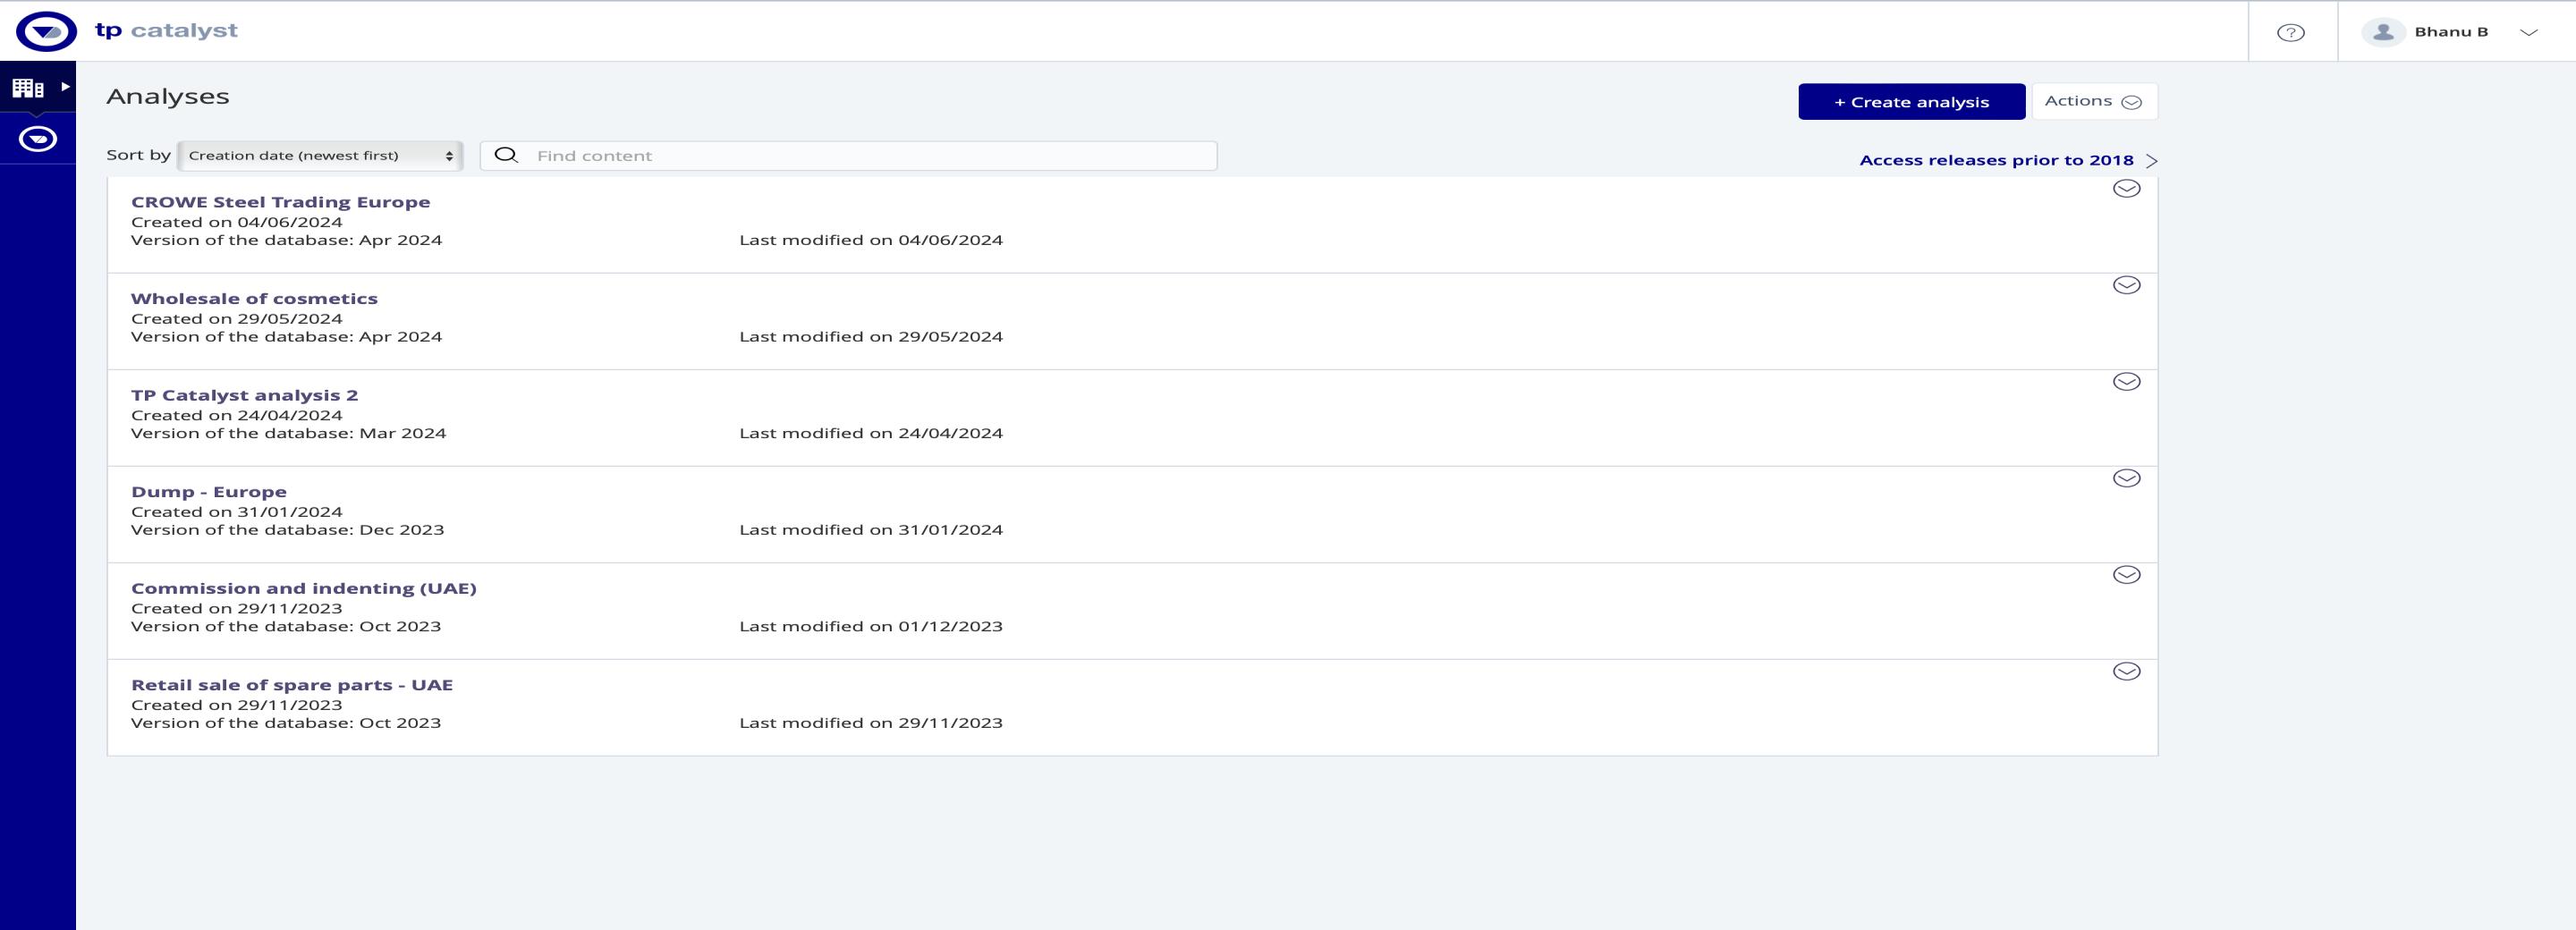
Step 2: Click on the "Create Analysis" box located on the main dashboard. This action will initiate a new analysis session, allowing you to define and execute your search parameters for the desired data.
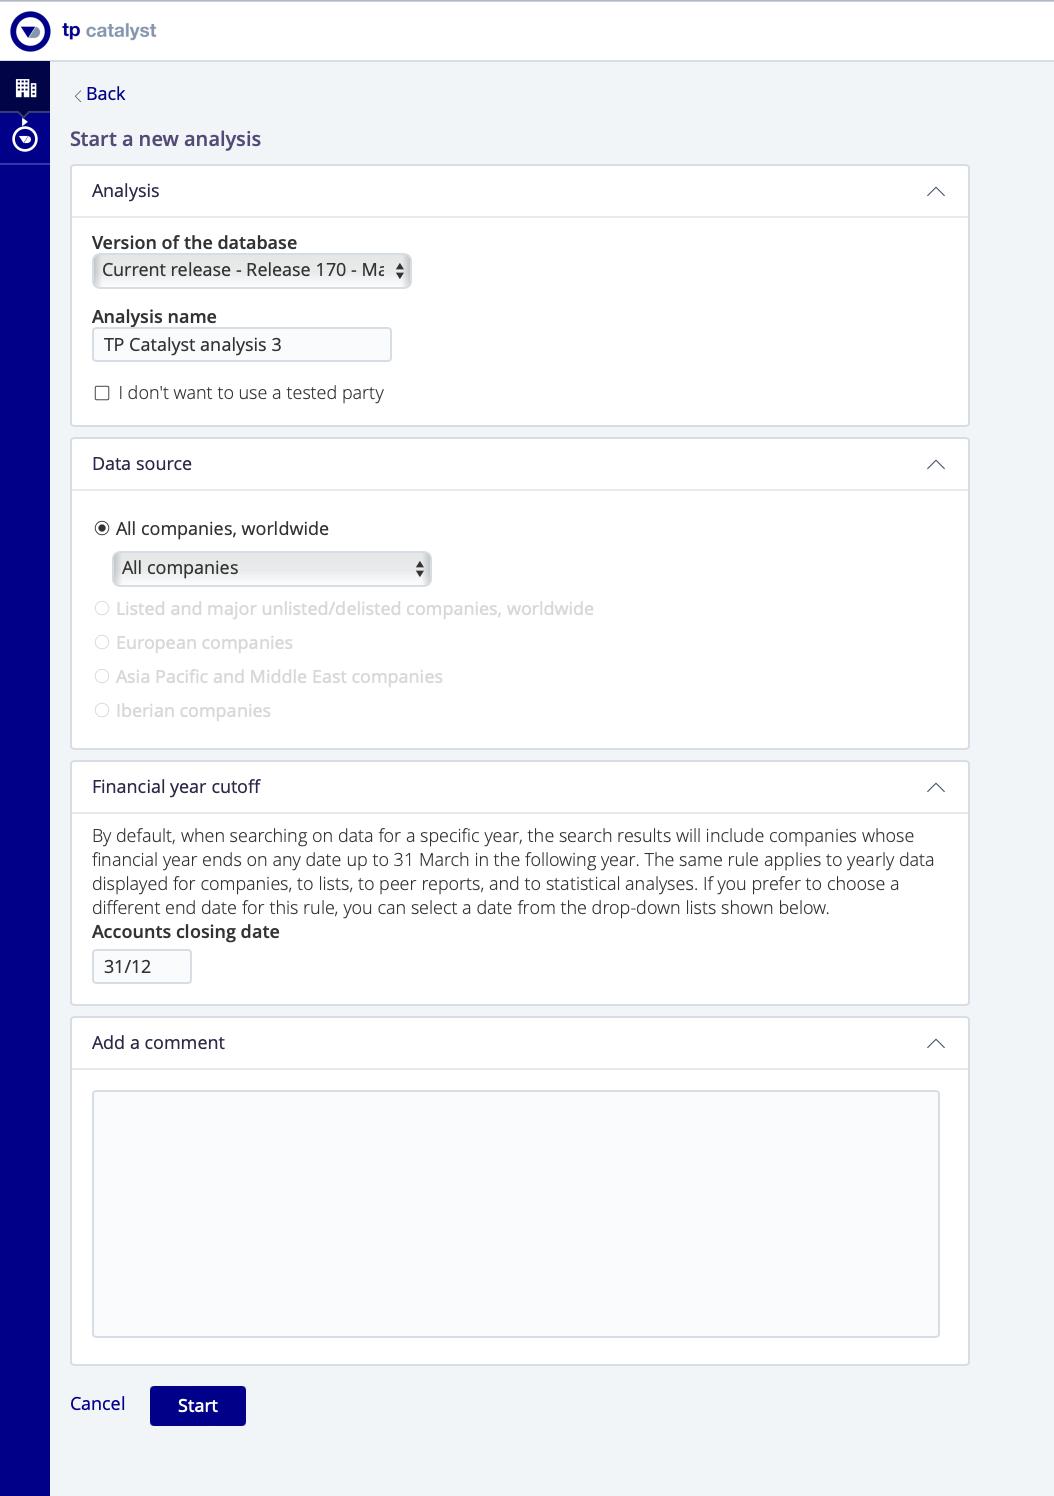
Step 3: In the "Analysis" interface, you will be prompted to select the version of the database you want to use. Choose the appropriate database version that aligns with your analysis requirements.
Choose the relevant FinancialYear
Once the desired version of the database is selected, press the "Start" button to initiate the analysis.
Step 4: The option to choose a tested party before starting the search is available to the users. Alternatively, you can directly click on the "Search" button to proceed without selecting a tested party.
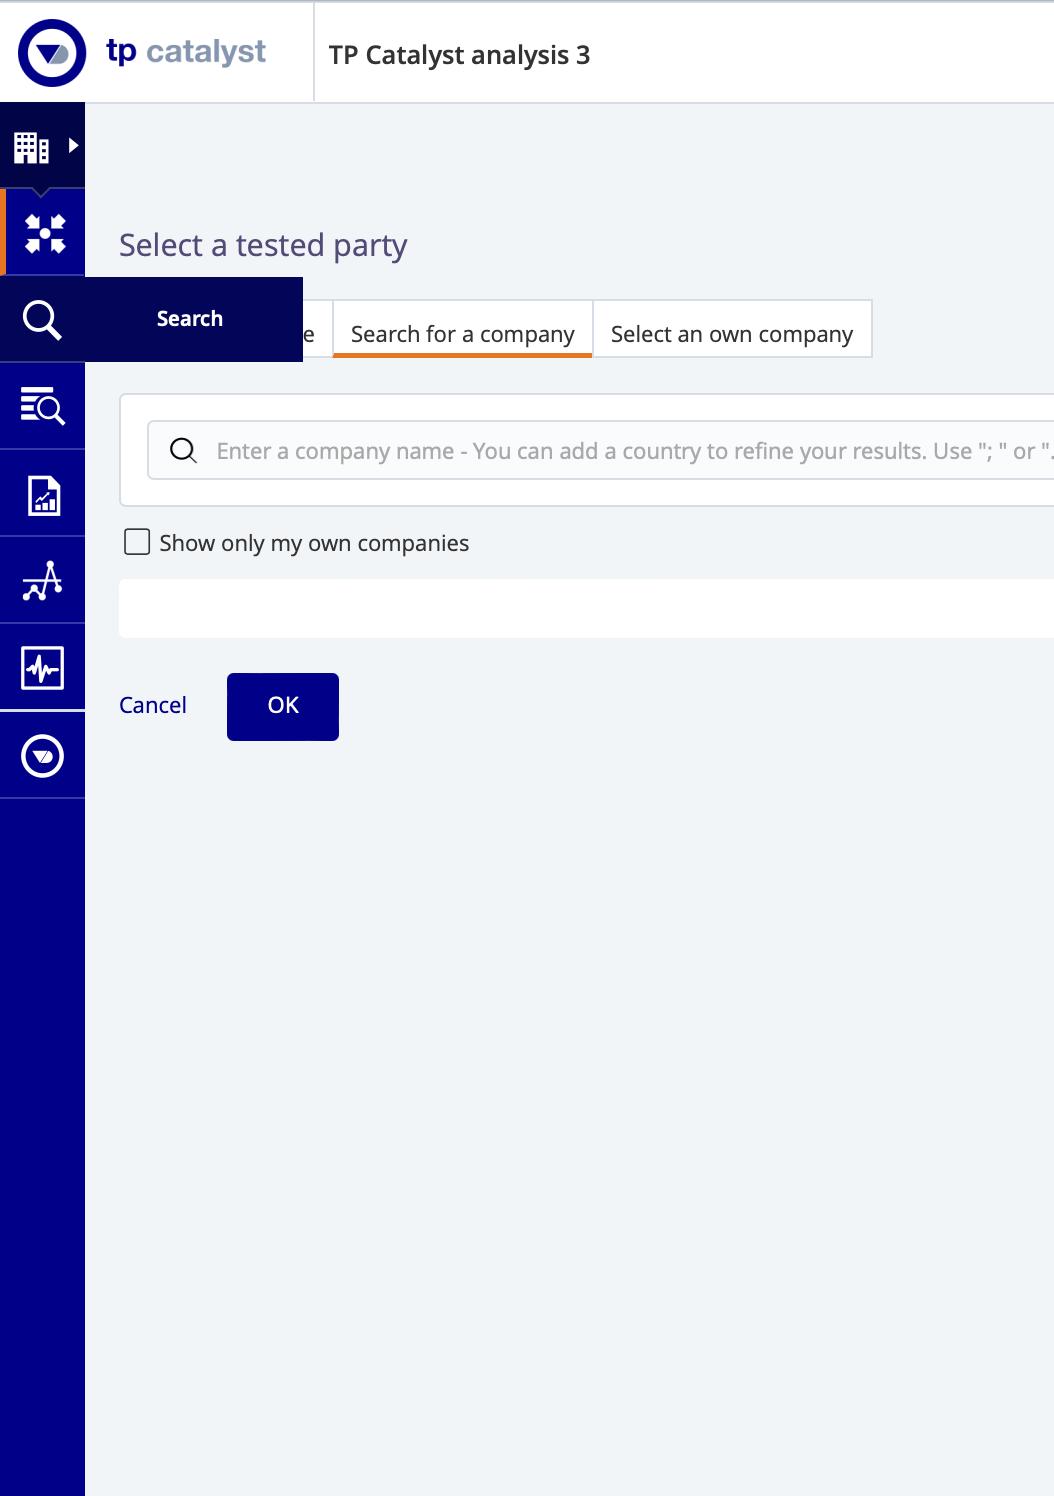
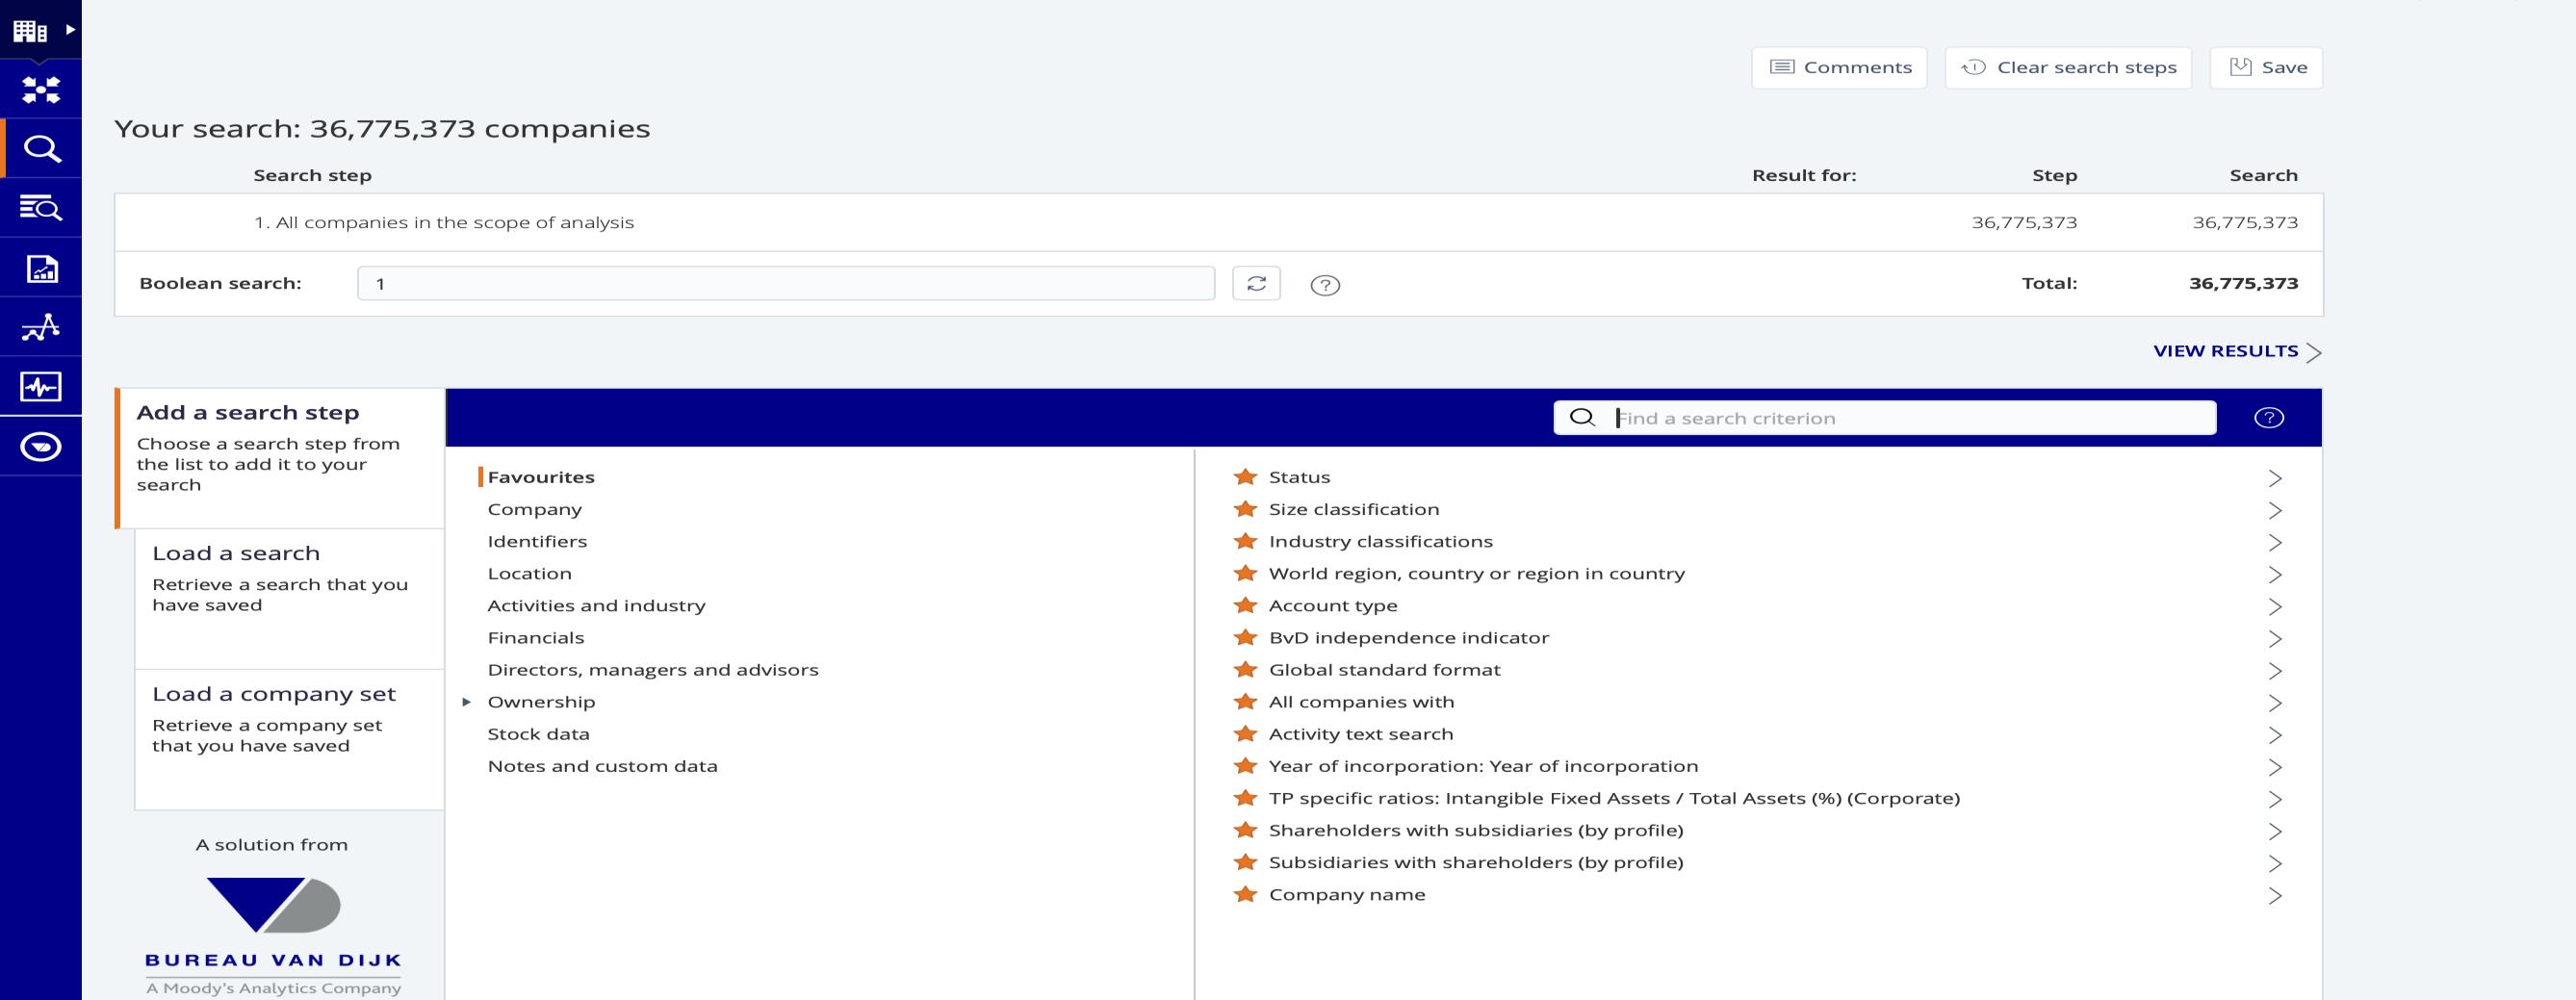
Or you may load a pre-existing search
These are main heads under which further filters will be available
Step 5: Choose a search step/ filter
Most commonly used search steps/ filters can be starred
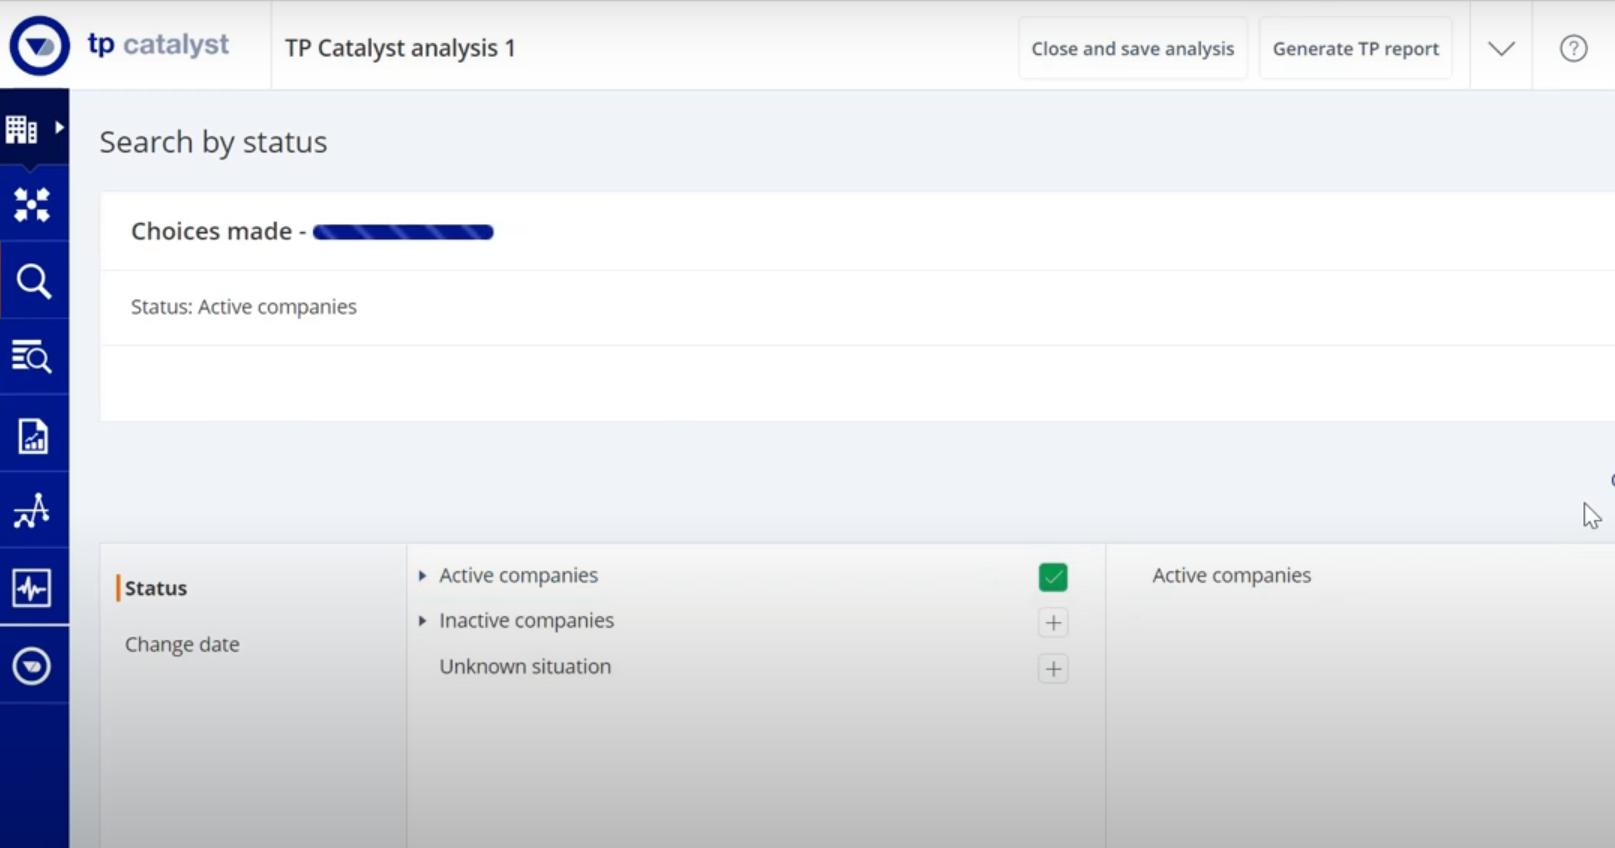
Select Active Companies Among these options
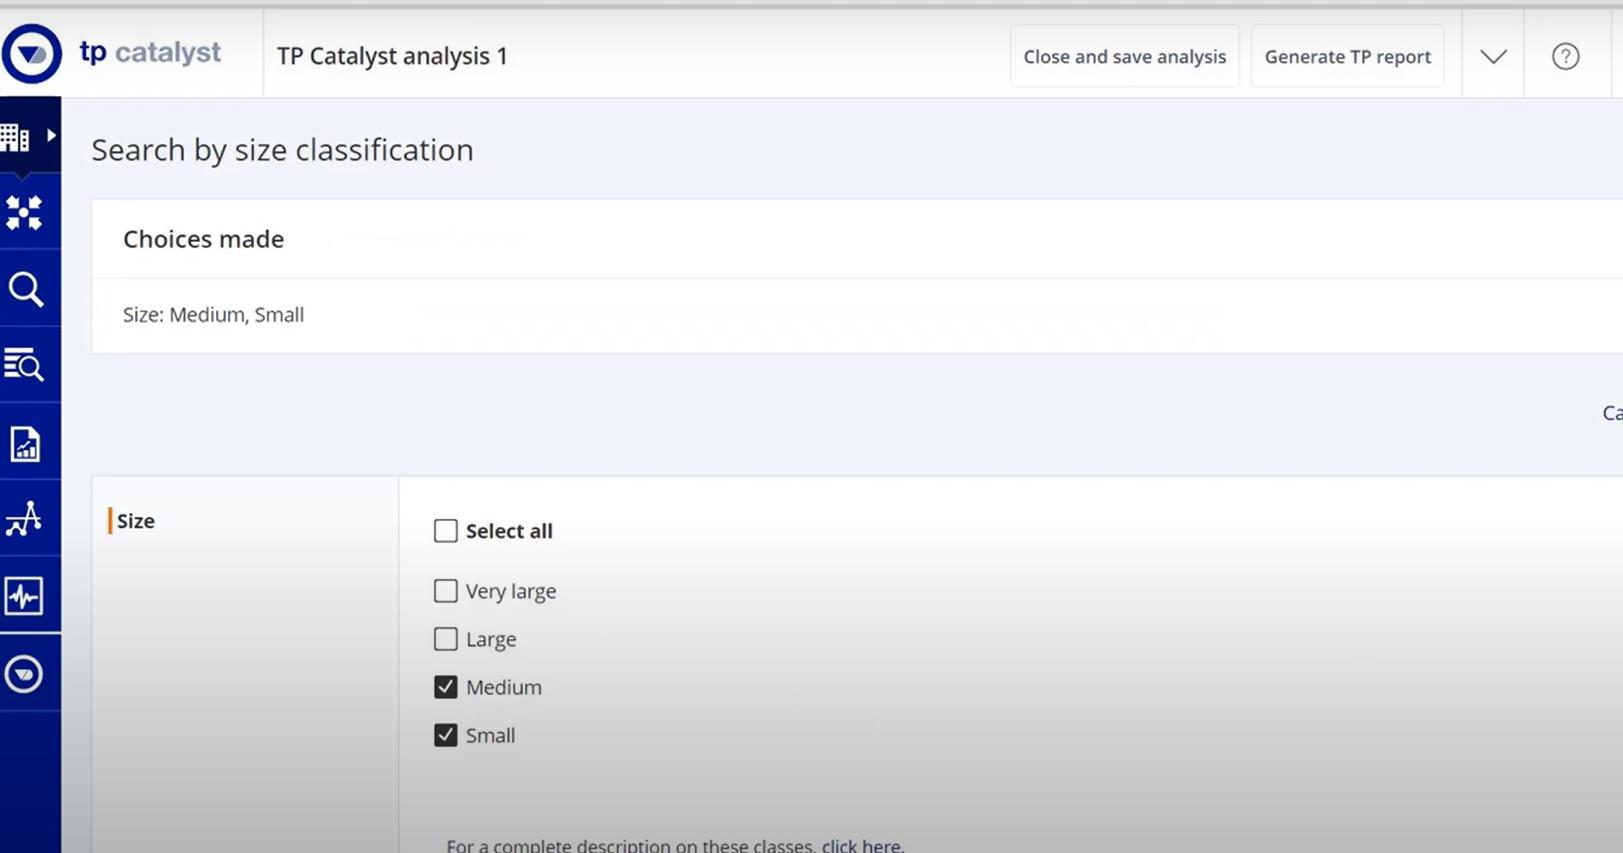
Select the appropriate Size, or u can select all
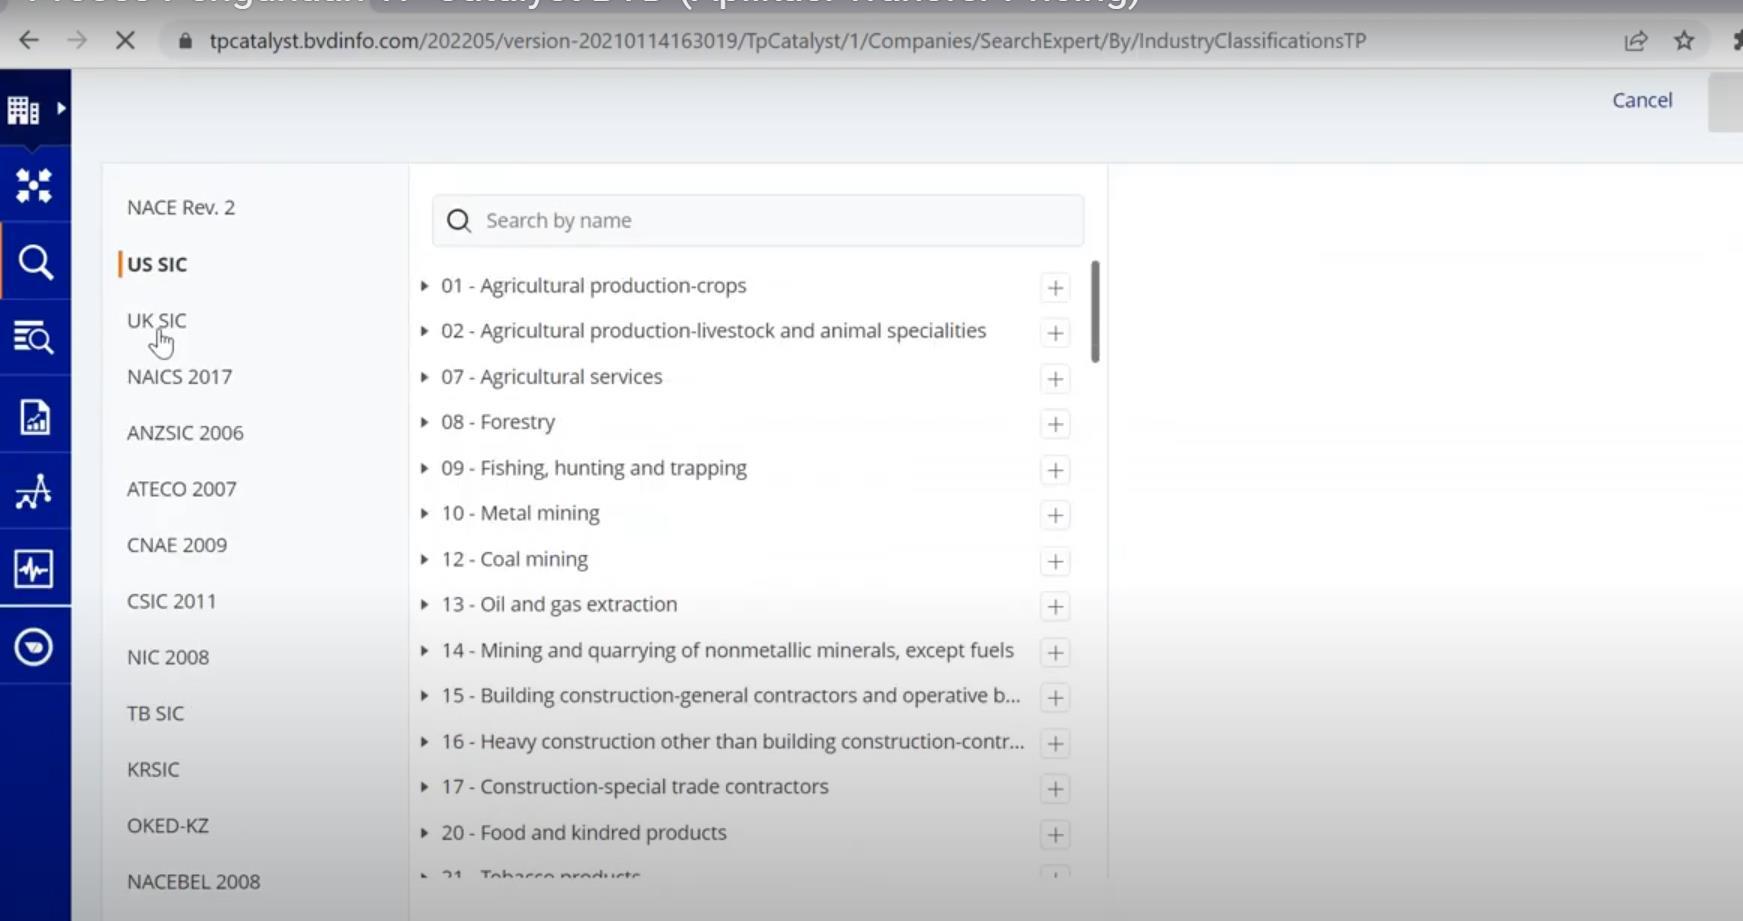
In the “Activities and Industry” main selection , select Industries Classification where u need to choose the NIC Code relevant to your Industry
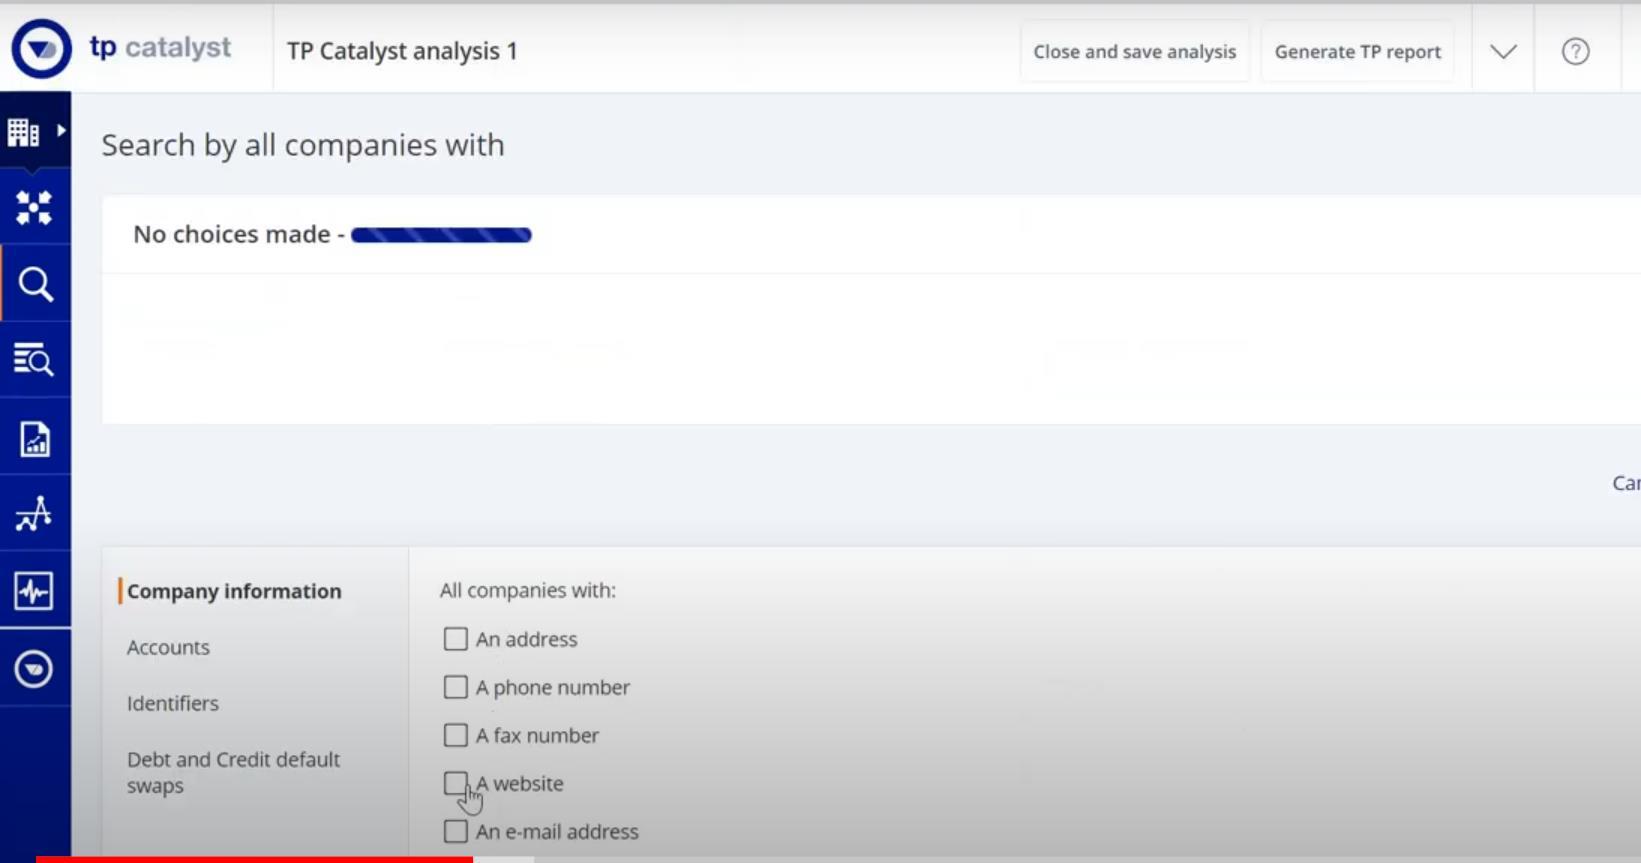
Select the information that is required for a company for Qualitative review
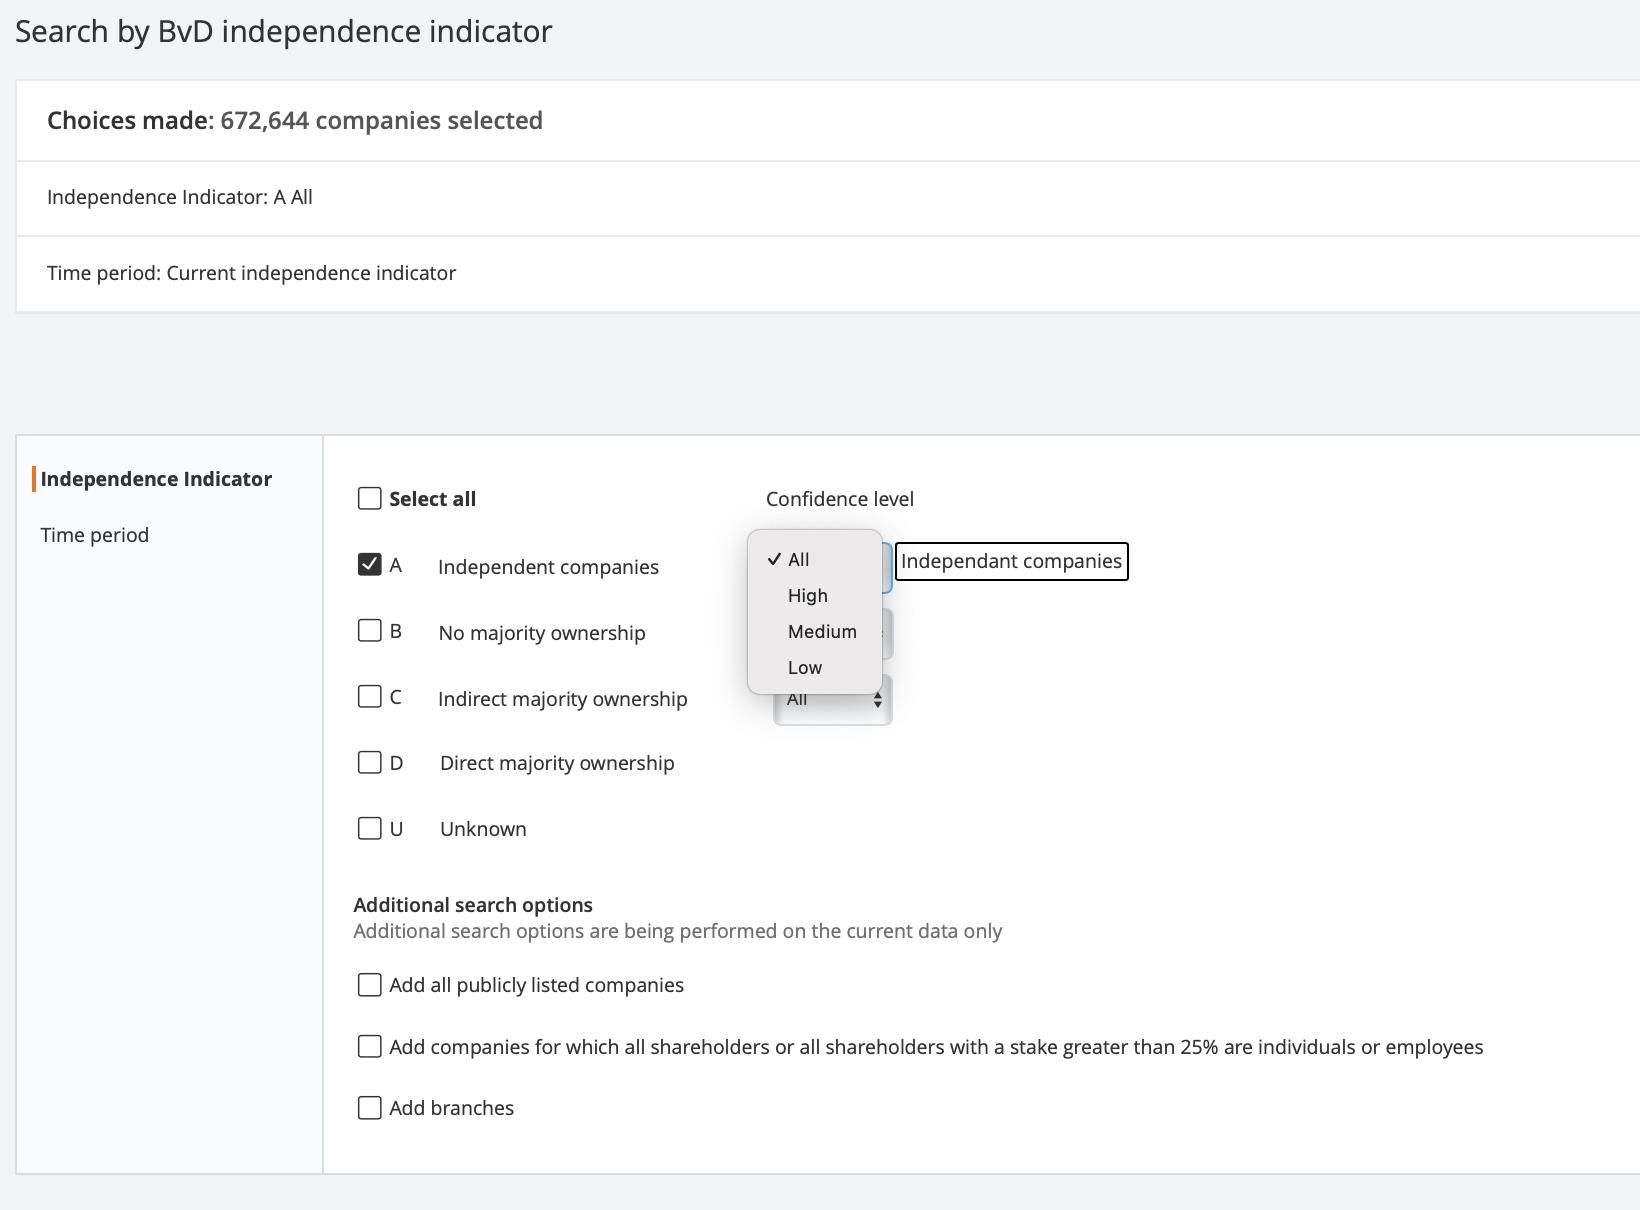
You may choose A/B/C/D/U options with High/Medium/Low confidence level
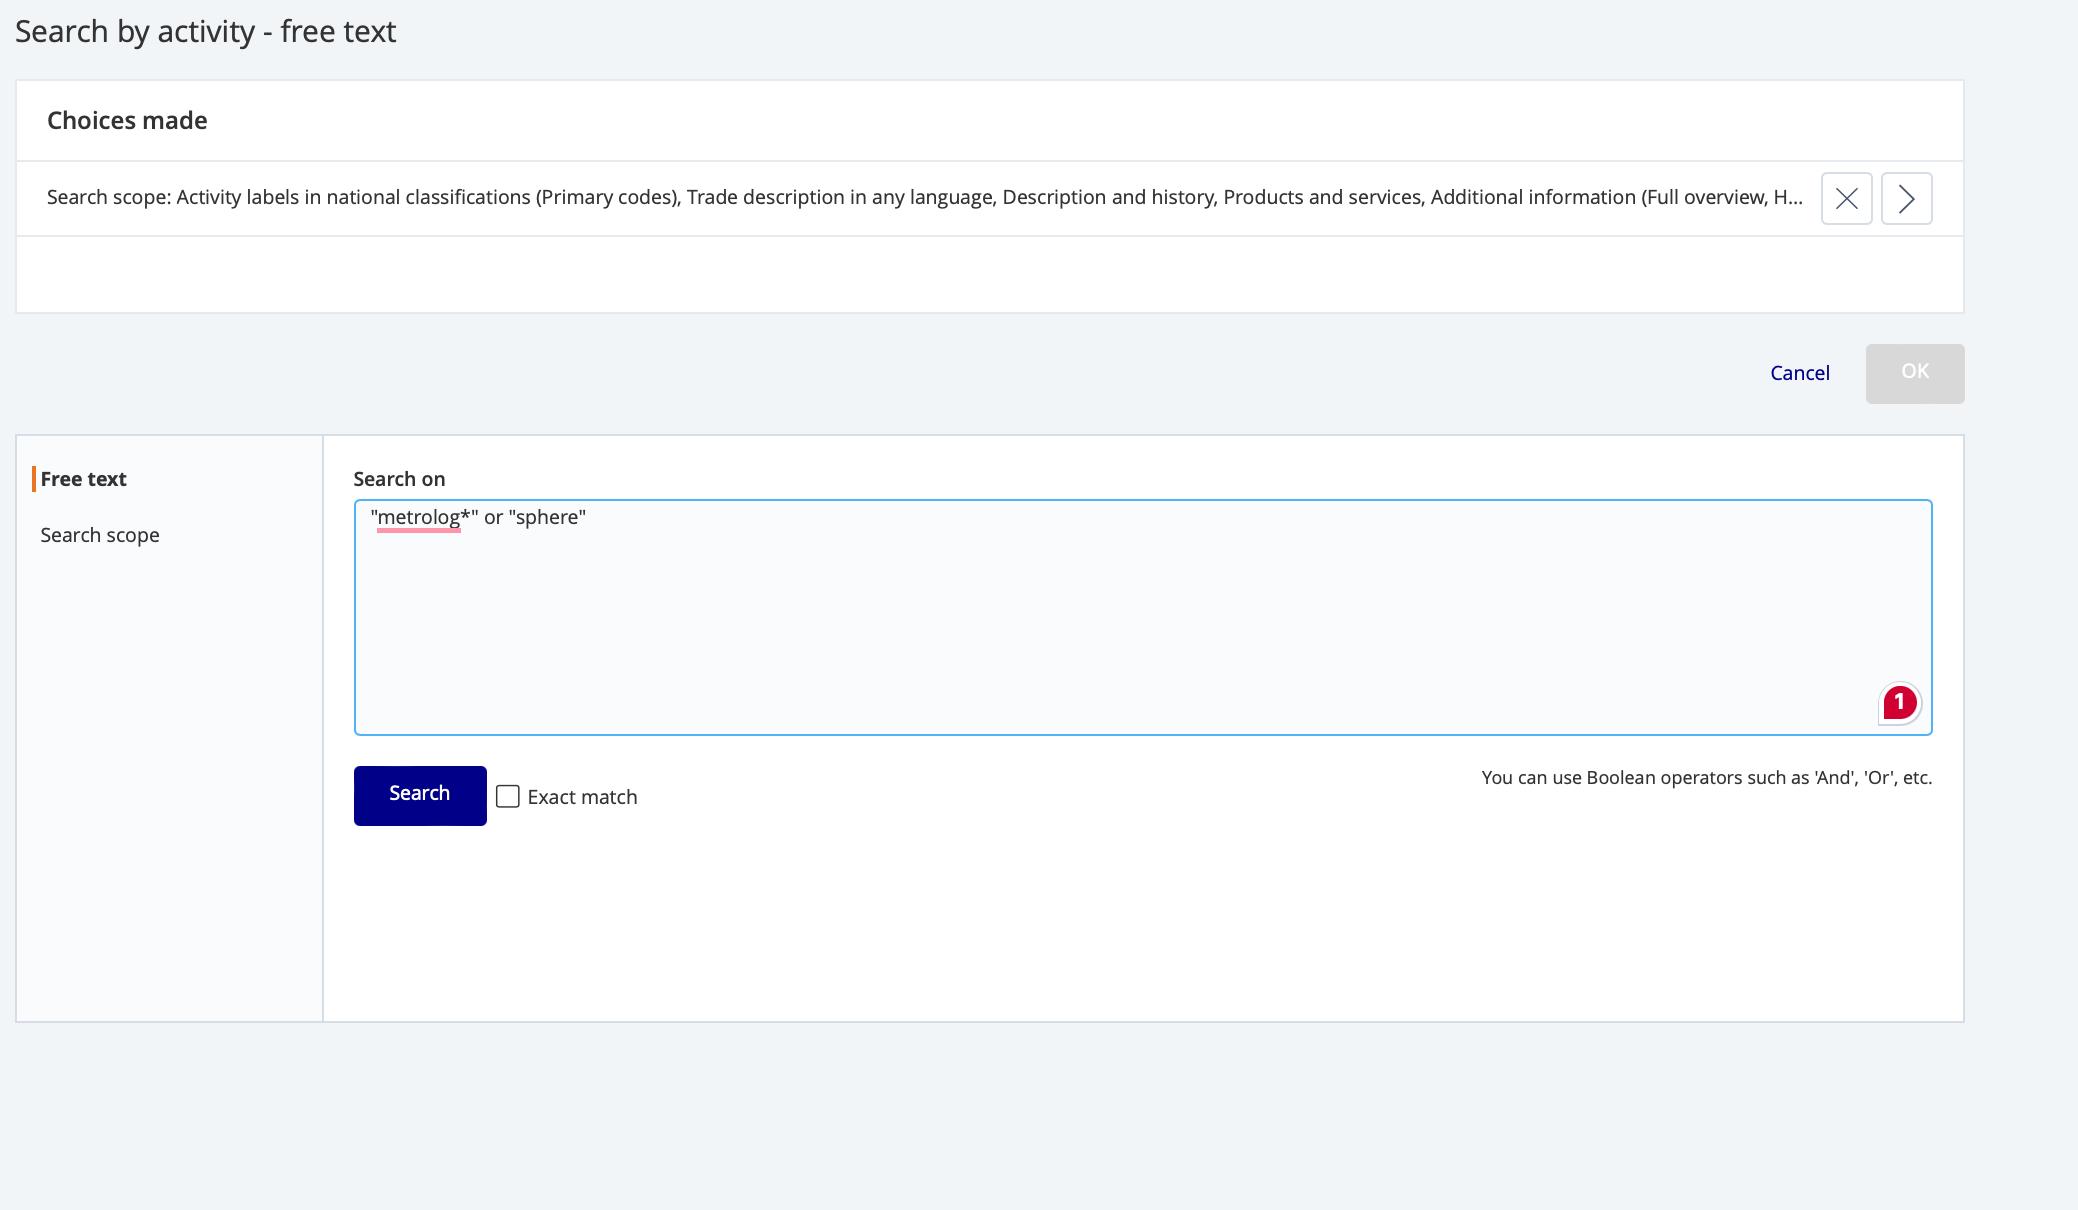
Step 6: Search for any keyword (“ * “ can be used to capture any word that contains a part of a word , example “metrolog*” can be used to capture “metrology” or “metrological”
For financial information, click on the “Financials” main section. Then select "TP Specific Ratios" to add the required financial information.
or, You may search for a particular column/field and add it to your view
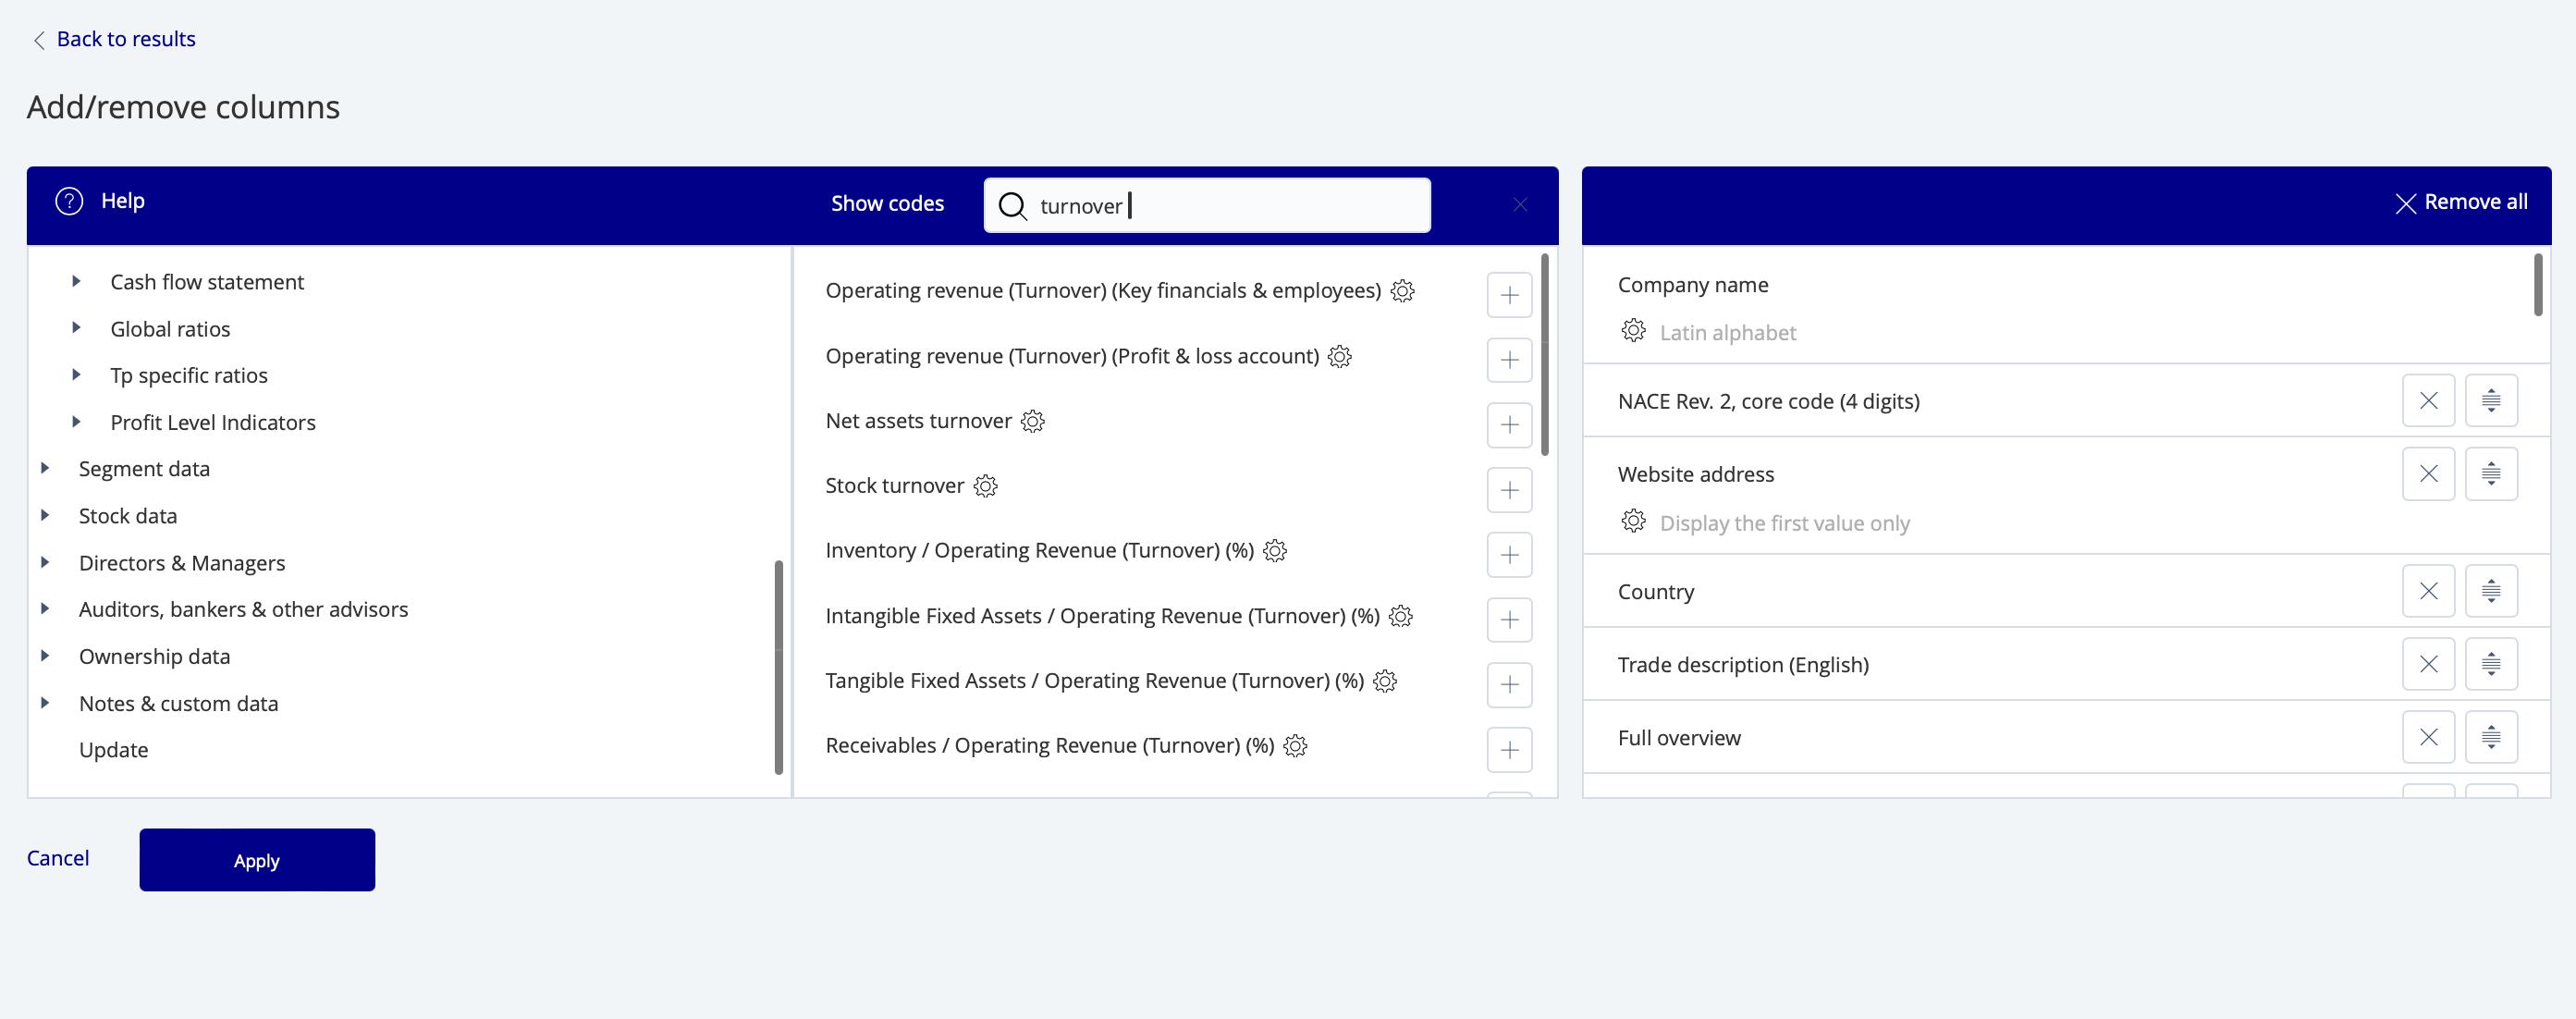
You may browse manually
You may alter the sequence in which the columns appear through this
Under Boolean search“and”/ “(or)”/ “and not” operators can be used”
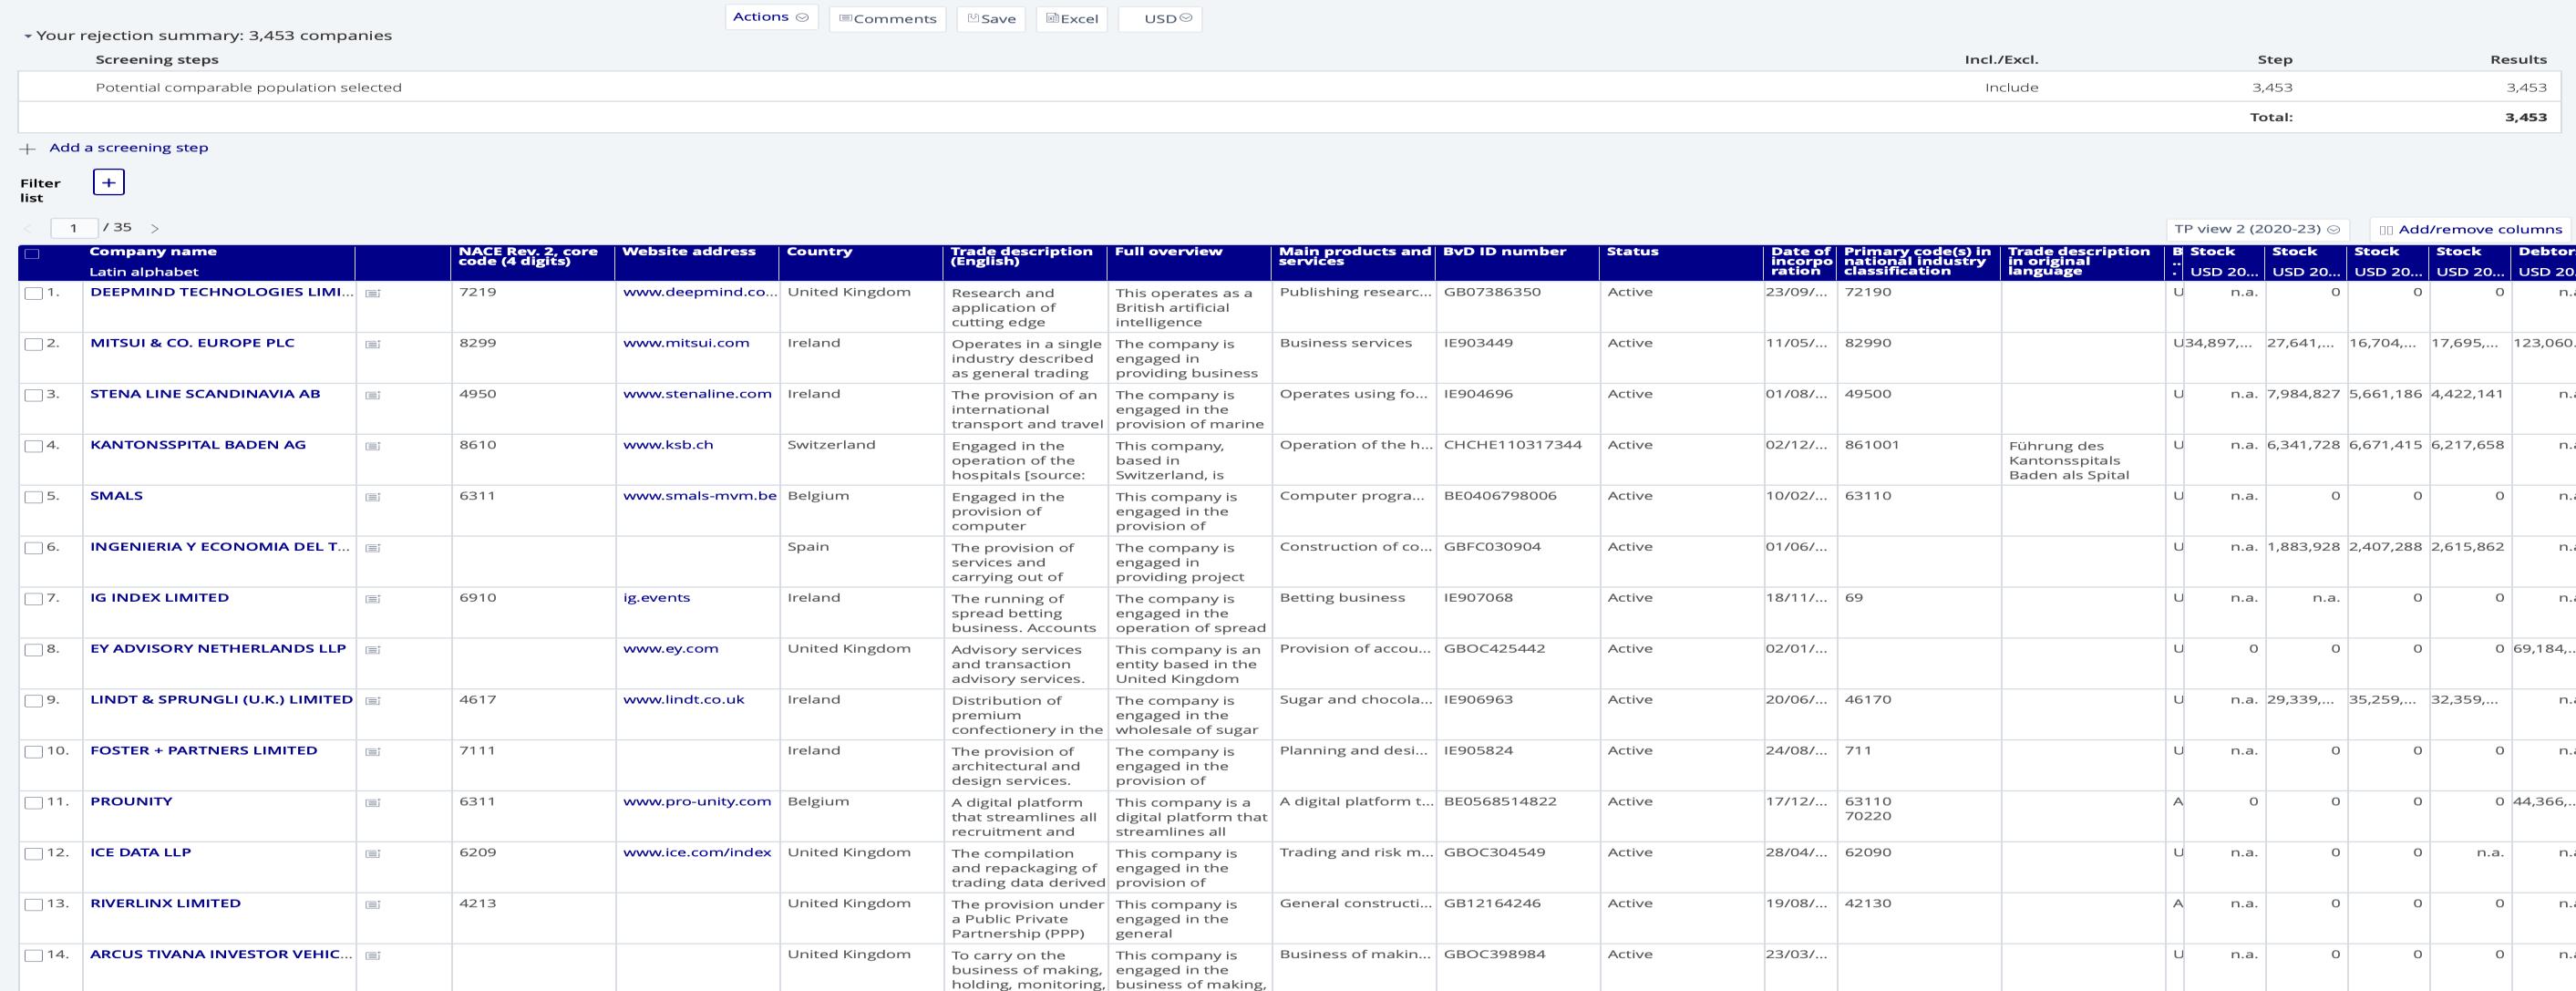
Once the overall search strategy has been formulated, results can be viewed
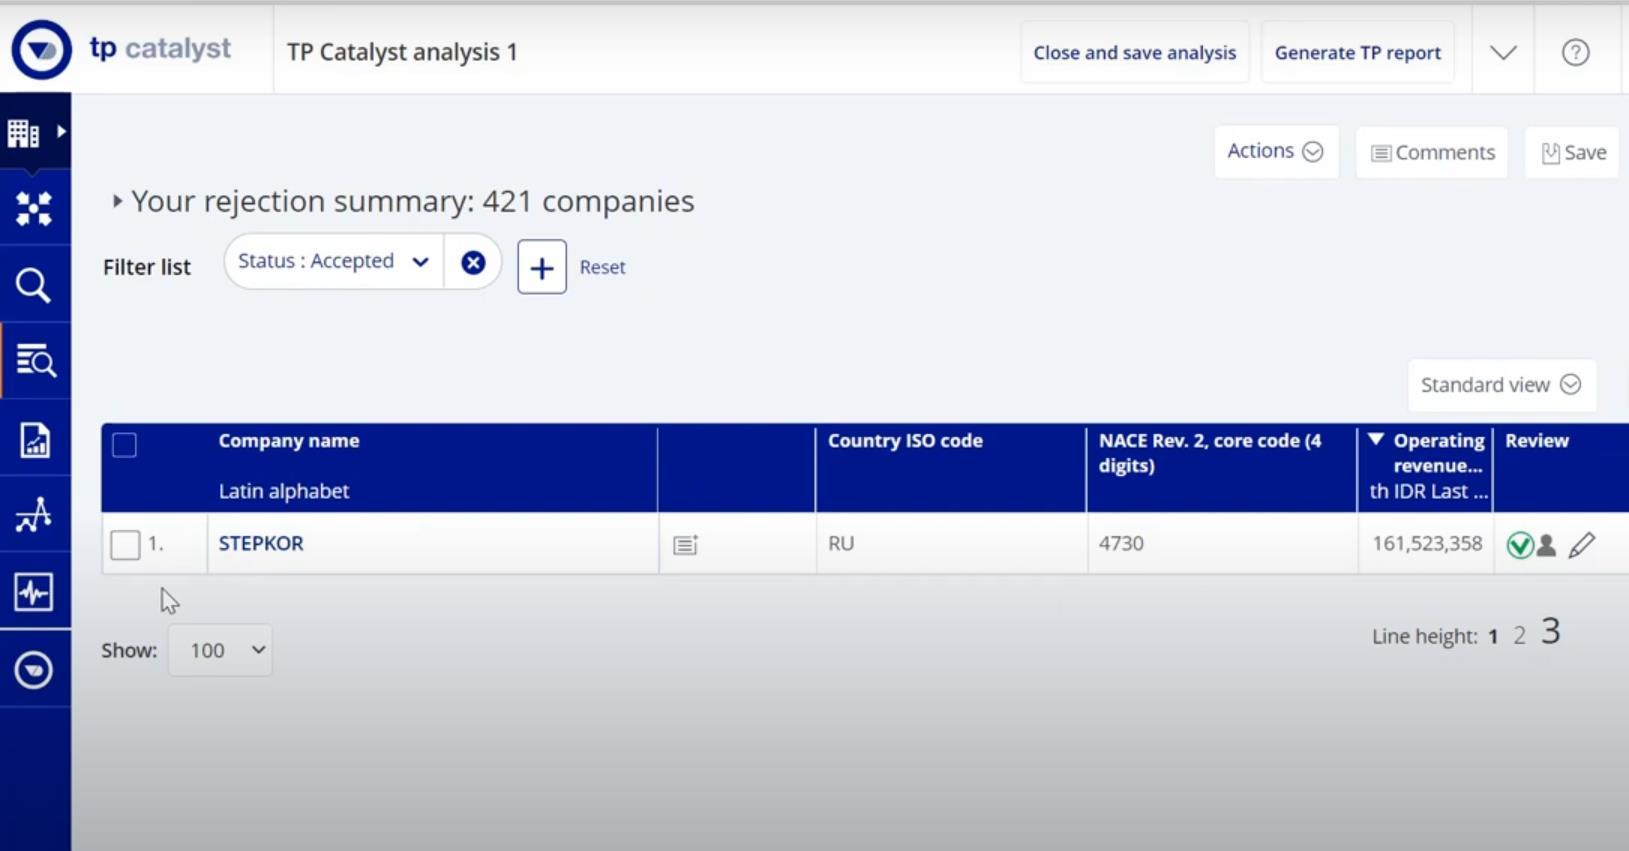
After clicking "View Results," a summary of the rejected companies will appear.
You may select the view that you want in order to display the desired fields (you may create and save a variety of views)
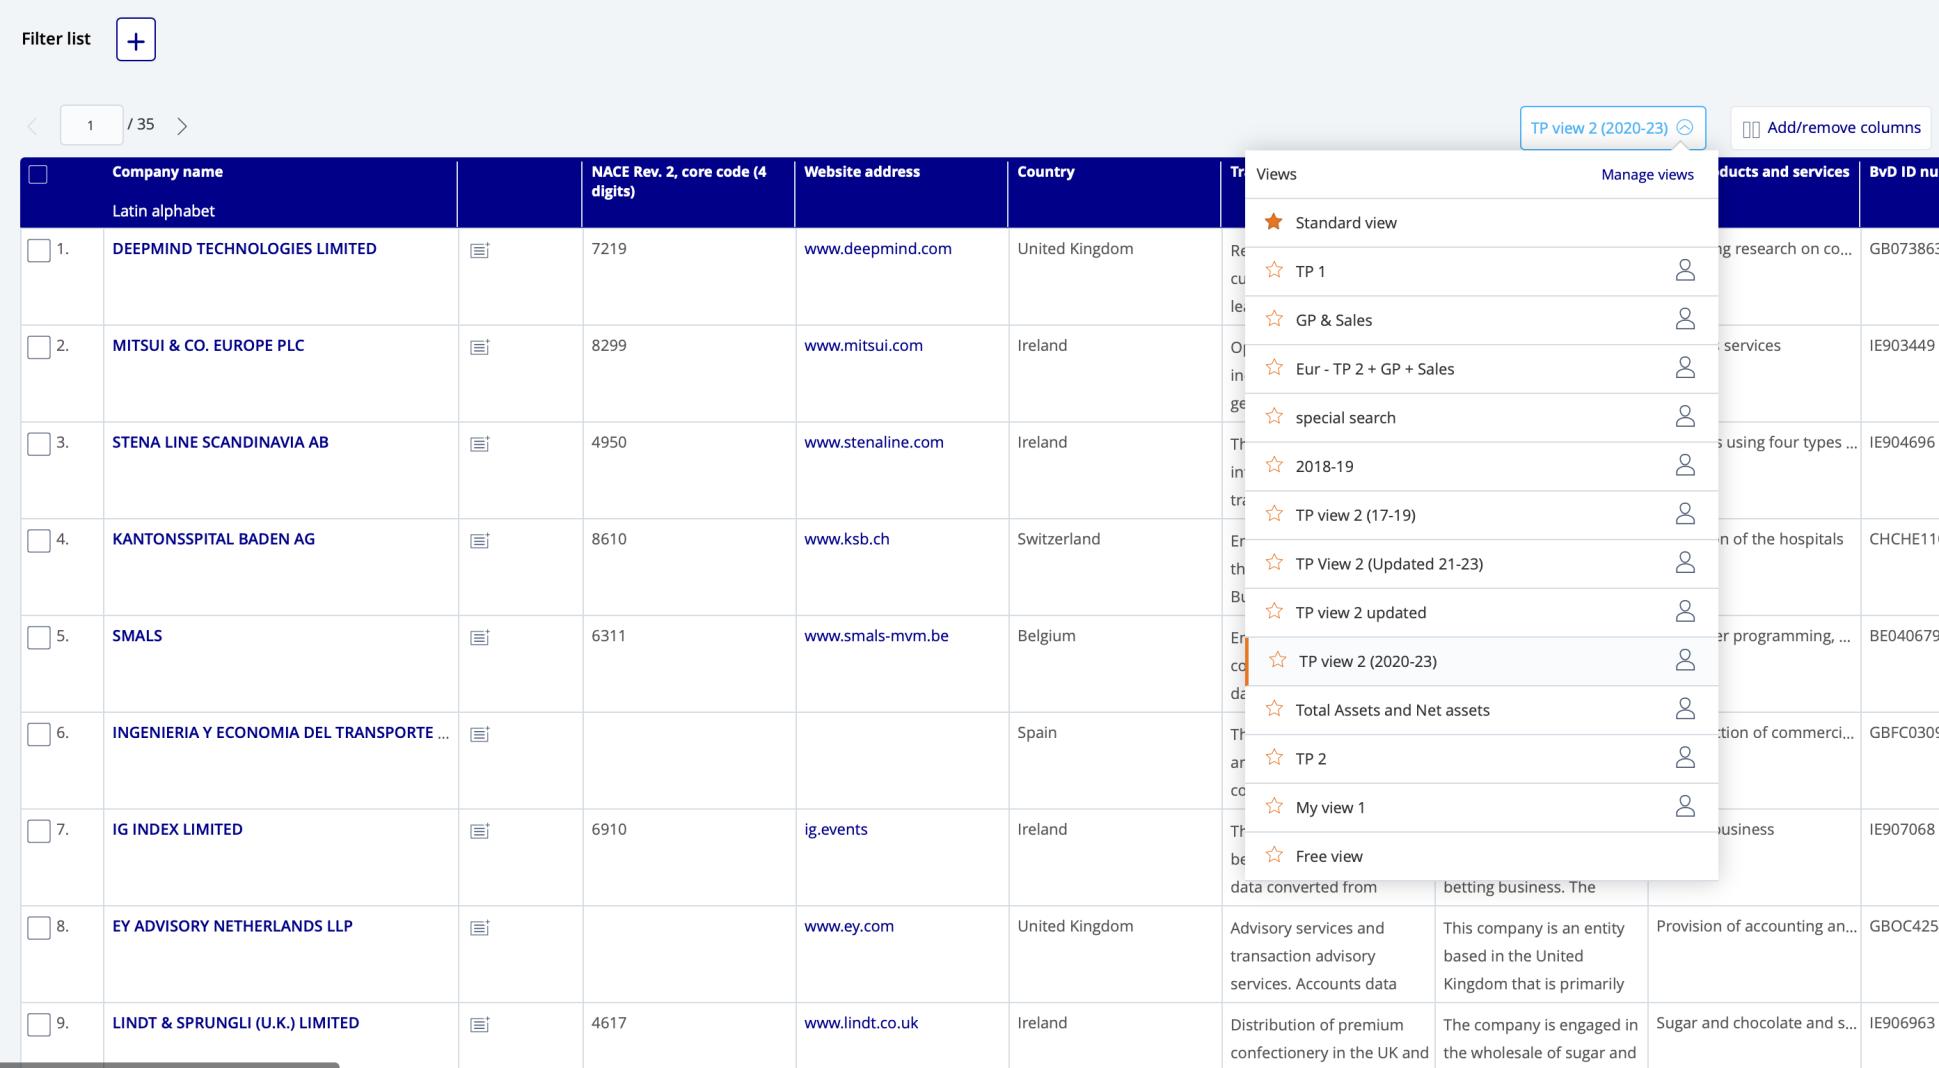
You may choose the desired columns/field to display from here (explained in detail in the next slide)
If you select a company from the rejection summary for qualitative review, then the above key information will be available
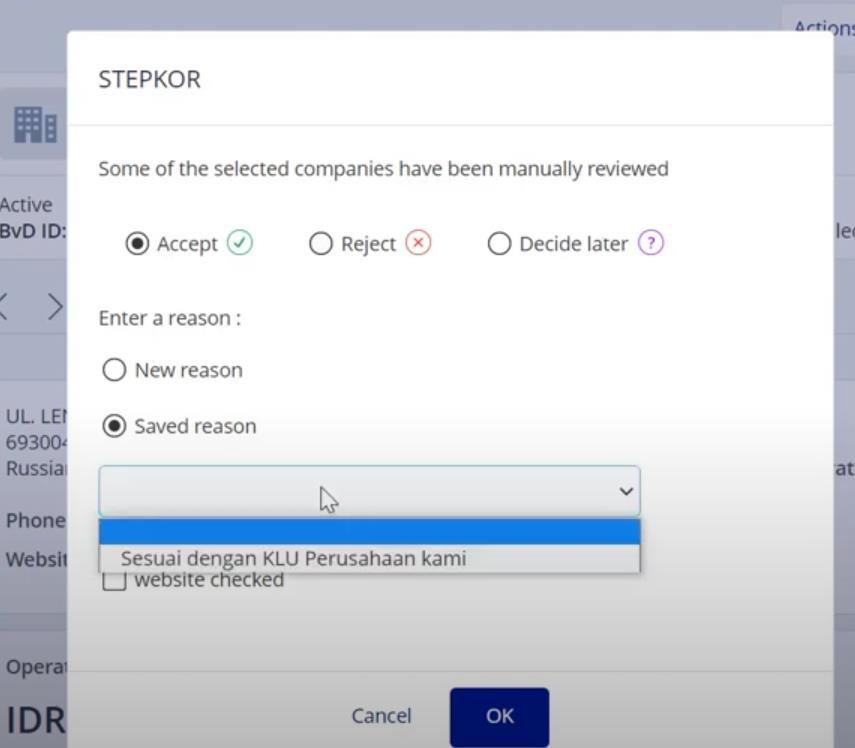
If you click "Website," you will be directed to the company's website. Based on the information available on the website, you can choose to accept or reject the company.
Step 1: Filter those that are accepted
Step 2: Click on Generate TP Report to view search results
After reviewing all the comparables, filter those that are accepted and click on "Generate TPReport" to obtain the search results.
Once all this is done, you are all set to view/ extract the results
Procedure for establishing the arm's length price,taking into account TPandALP
• Analyze the terms of the loan that may impact the pricing including issue date, tenure, currency, interest rate etc.
• Analyze the credit rating of the borrower to understand the credit risk borne by the lender.
• Use reference of third-party loans with similar credit and terms as reference
• Calculate the arm’s length range.
• Internal Comparable Uncontrolled Price (CUP)
Bank transactions
• External CUP
Comparable transactions from databases
Yield curves, statistics (e.g., European Central Bank)
• Cost-plus – especially for pass-through
Lender’s refinancing cost
• Rating
The choice between stand-alone and group ratings impacts perceived risk
• The lender's substance affects loan terms,
• C+: C- rating suggests caution, with debt favored for retaining control and equity for risk-sharing (debt or equity financed loan?)
Step 1 Identify the members of a group
Step 2 Determine a group credit rating (GCP)
Step 3
Assess group status of group members: core, highly strategic, strategically important, moderately strategic, nonstrategic
Step 4
Determine if a stand-alone credit rating is required
• Core members receive a credit rating equivalent to GCP
• Strategic members receive a credit rating within three notches of GCP
Step 5 Assign a potential issuer credit rating based on:
• Criteria for insulated companies (Independent Companies, Less affected by changes in interest rates)
• External credit enhancements (Government support of financial guarantee)
Apply constraints to potential issuer credit rating posed by:
Step 6
• Sovereign risk
• Structural leverage
TermsoftheLoan
Lender XYZ Ltd
Lender Country India
Borrower ABC Ltd
Borrower Country Australia
Loan Type Unsecured Loan
Payment Frequency Upon Maturity
Purpose of IC Loan
ABC Ltd -Australia
XYZLtd-India
Criteria
6% interest on Loan
Accept Reject Matrix: Display the companies that have been accepted or rejected, which have been extracted from the Loan Connector, along with the reasons for their acceptance or rejection.
An Illustrative Example is provided below:
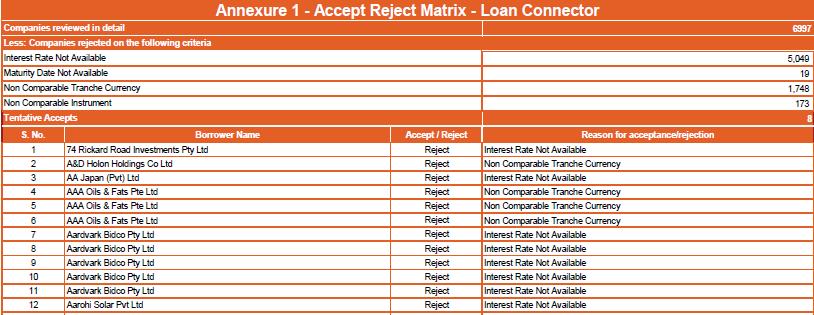
Below is the final list of comparables that pass all the quantitative and qualitative filters specified in the earlier slides (refer to slides 28 and 29).
Among the six methods (Refer slide 9), CUP has been selected as the most appropriate method.
Range Concept has been used instead of Average Concept since there are more than 6 comparables.
Multiple year data has considered and had computed weighted average for the past three financial years data.
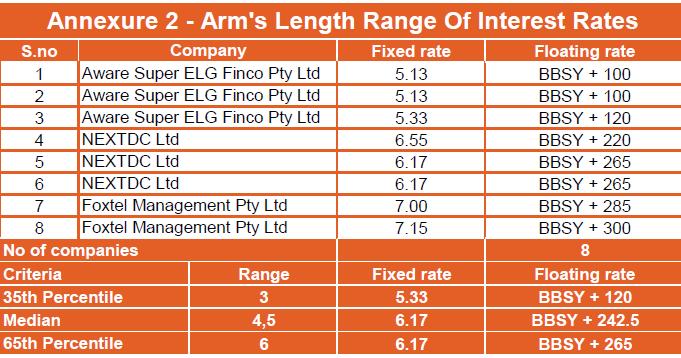
• Tested party receives interest rate at the rate of 6%
• Since the receipt of interest rate by tested party is within the range of comparable companies i.e., 5.33%% to 6.17%, it can be said to be atArm’s length.
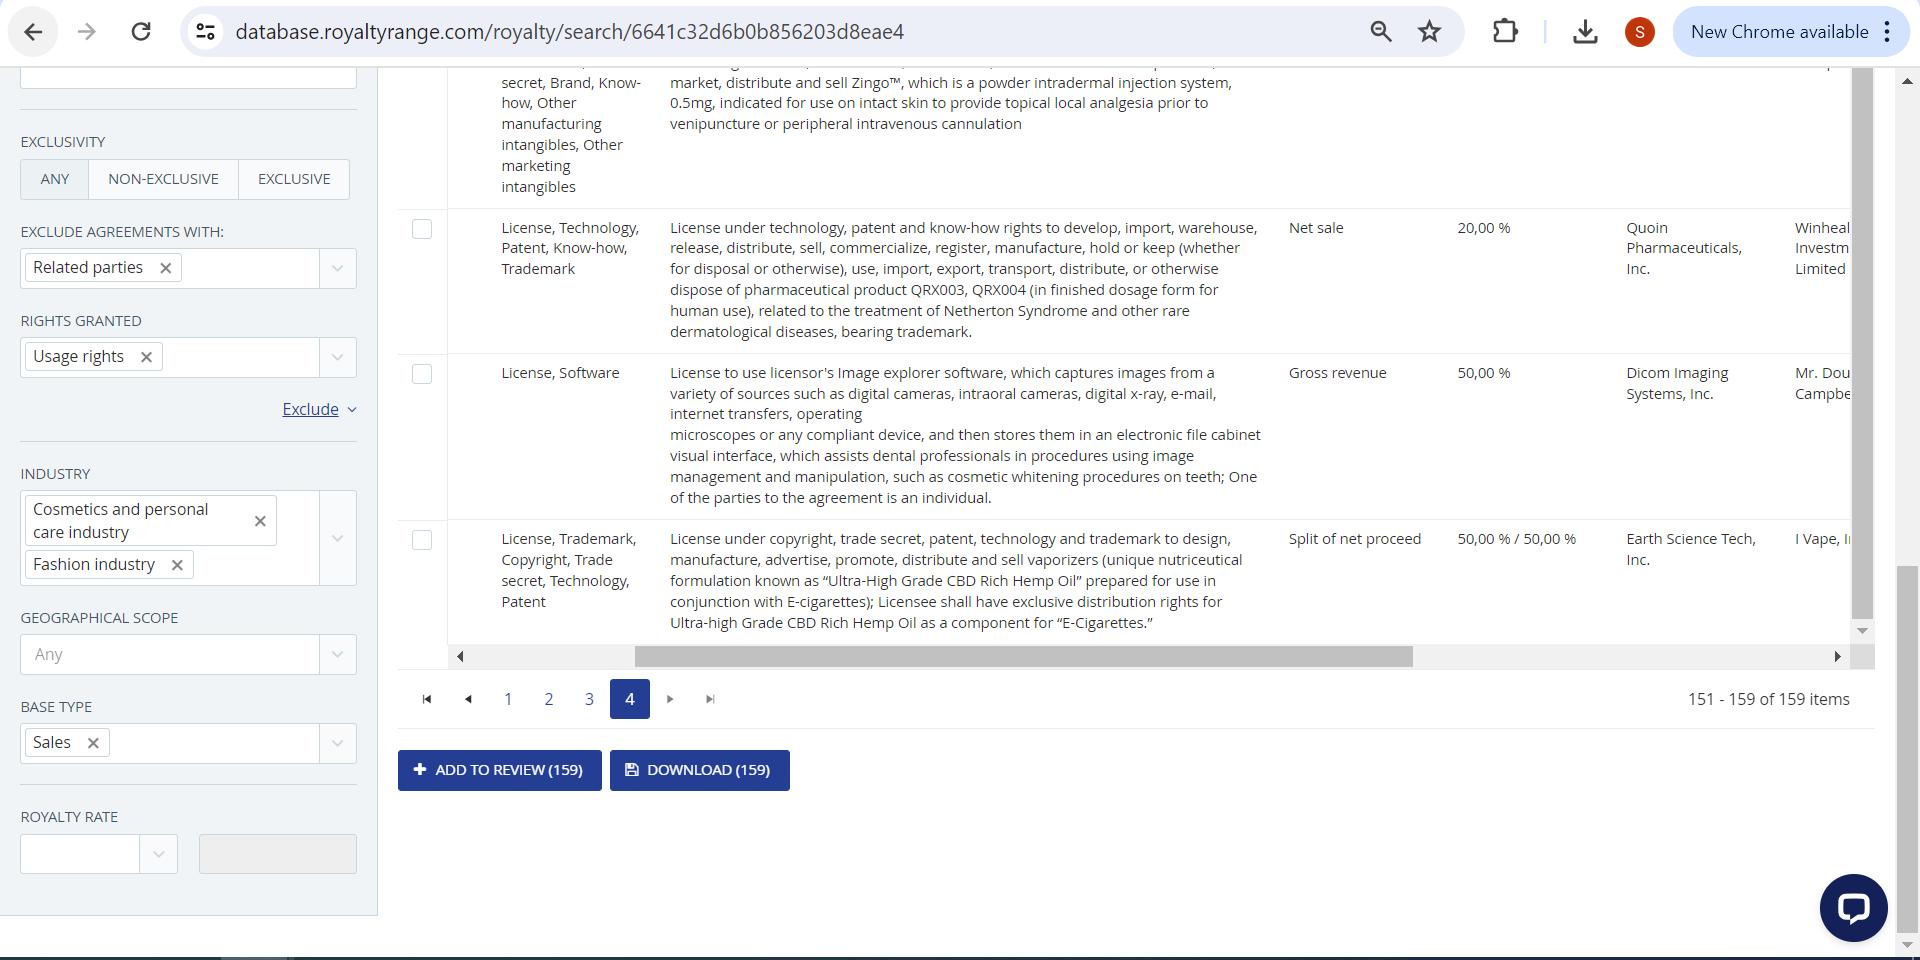
Illustrative Example
Parent Co. - India
Co. B uses the brand/license of Co.A and pays the royalty @ 4% of Net sales of Co. B
Subsidiary Co.Dubai
Co B
CoA
Characteristics of the License Type of Intellectual Property Intellectual Property rights Effective Date 6 May 2022
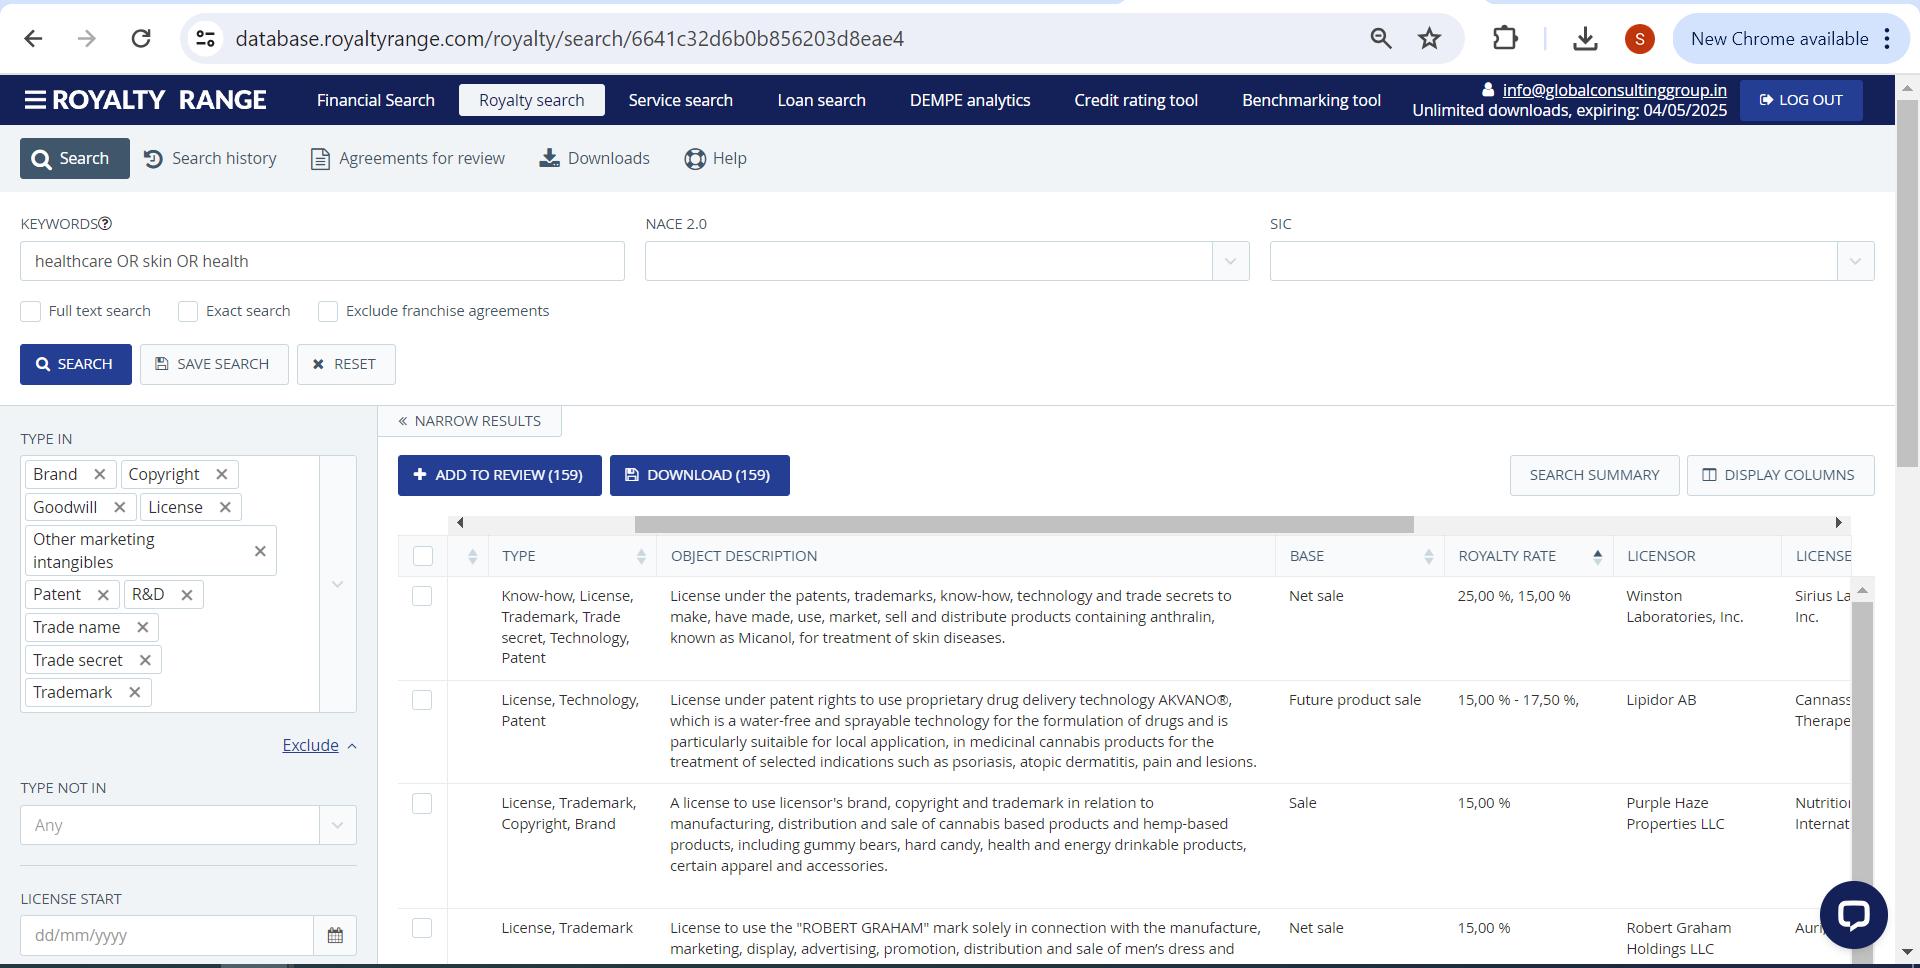
Step 1 - Select the Key Words specific to Industry
Step 2 – Click on Search to arrive at the agreements in the similar industry
Then select the following filters to remove the Non- Comparable agreements
Step 3 - Select the Agreement types in Type in
Step 3 - Select the Agreement types in Type not in
Step 4 – Mention the date of License taken or given
Step 4 – Choose the type of exclusivity
Step 5 – We can exclude arrangements with related parties from this step
Step 6– Choose the Rights Granted
Step 10
Step 7 – Select the Industry
Step 8 – Specify Geographical Scope if any required ex; US, Europe, UAE etc
Step 9 – Select the base Type
Step 11
Step 12
Step 10: After selection of all the filters click on “Exclude”
Step 11: After display of search results Click the “Add to review” to review the agreements manually
Step 12: After reviewing the agreements manually click on download click download to download the file for further analysis.
• Tested party royalty rate is 4% of net sales.
• Since the tested party percentage is within the range transaction i.e., 3.50% to 5.00%, it can be said to be atArm’s length.
Search for comparables can be updated during the assessment proceedings
Include companies accepted last year even if they fall outside the current relevant 'product classifications' after ensuring no new reasons for rejection have surfaced.
If a company which was accepted last year, but was not present on the current database, then we should include this company for both previous and current years after confirming no change in the underlying basis for acceptance and no substantive reasons for its absence. Please note that the above tow positions should only be adopted for updation of study but not for a benchmarking/ new study
In the event of Annual Report review if any subsidiaries or group companies of potentially acceptable companies are identified include this company, even if they are not part of the database.
Even if the Client insists on cherry picking of comparables to be with in the range, it should not be done. There should be a proper basis for the selection of comparables.
Do’s: Consider only transactions with relating parties during the relevant year
Don’ts: Do not consider outstanding balances as at the end of the relevant year
Do’s: To be considered only for International Transaction
Don’ts: Do not consider while evaluation domestic transactions
Do’s: Evaluate the applicability of all the methods
Don’ts: Avoid proceeding directly to TNMM
Do’s: Consider the jurisdictions of both entities during the benchmarking exercise.
Don’ts: It should be not be carried out from only one perspective
Do’s: Entity that performs least complex functions and has lower risks must be selected as tested party.
Don’ts: Do not change/shift the tested party without any base
Do’s: Evaluate and select the comparables after applying all the quantitative and qualitative filters
Don’ts: Cherry picking of companies is not acceptable

Coverage
Domestic Transactions (Non-Tax Neutral)
International Transactions
Deemed International Transactions
TP Methods
ALP computation
Multiple Vs Single Year data
Comparable Selection
Five TP Methods (CUP, RPM, CPM, TNMM, PSM)
Other Method under Rule 10AB
Range Concept
More than 6 comparable: 35th to 65th Percentile Less than 6 comparable: Average (with +/-1%/3% tolerance)
Multiple year data prescribed
Local comparable are preferred (India)
Tested Party
TPAdjustments
Indian tested party preferred
Foreign tested party is highly litigated
Secondary Adjustments
Domestic Transactions (Tax Neutral & Non-Tax Neutral)
International Transactions
Connected Person Payments
Five TP Methods (CUP, RPM, CPM, TNMM, PSM)
Other Method as per Article 34
Range Concept Inter-quartile range is recommended (25th to 75th Quartile)
Multiple year data recommended
Regional comparable selection strategy is recommended (UAE, GCC, Middle East, Eastern Europe, North Africa etc.)
Domestic and foreign test party are recommended based on least complex & data availability criteria.
Corresponding Adjustments

TP database
TP Compliances
Domestic Litigation Framework
Safe Harbour Rules
APA Regime
Overdue receivables
Special considerations
No preferred TP databases
Below are recommended:
Manufacturing/trading/services –Prowess/Capitaline/AceTP
Financial Transactions – Bloomberg, Loan Connecter
Intangibles – RoyaltyRange, RoyaltStat
TP Disclosure Form (Form 3CEB)
Local File (TP Study Report)
Master File
CbCR
Exhaustive domestic litigation framework for past 2 decades
Exclusive Framework of Safe Harbour Rules covering various eligible transactions like IT, ITeS, Contract R&D, KPO services etc, intra-group services and loans.
Exclusive APA Framework for last 10 + years
Notional interest considering overdue as deemed loans
– litigation precedents
Financing Arrangements (loans & guarantees), Intragroup services, CCAs, Business Restructurings etc covered within TP regulations
No preferred TP databases
Below are recommended:
Manufacturing/trading/services – TP Catalyst, S&P
Capital IQ
Financial Transactions – Bloomberg, Loan Connecter
Intangibles –RoyaltStat, RoyaltyRange
TP Disclosure Form
Local File
Master File
CbCR
Tax & TP litigation/audit procedure is yet to be prescribed
Safe harbour margin for low value adding intragroup services (cost plus 5% markup) as per the TP guide
APA is mentioned in law. Detailed framework to be released.
Notional interest considering overdue as purported loans – highlighted in TP Guide
Financing Arrangements (loans & guarantees), Intragroup services, CCAs, Business Restructurings etc highlighted in TP guide