TRENDS

2022 ANNUAL MARKET REPORT


Scan to Explore Your Mortgage Options Bank on Better Finance your next home with 75 years of trusted Florida-based mortgage expertise at your side. Extensive local real estate experience and market knowledge. Flexible home loans with competitive rates.1 Personalized service from application to close. Primary Residences & Second Homes Vacation Homes & Investment Properties New Construction & Land Acquisition Member FDIC NMLS#412469 1 Loan products are subject to credit approval and program requirements. Terms and conditions apply. This is not a commitment to lend. Loan programs, terms, rates, and conditions are subject to change without notice. © 2023 City National Bank of Florida 2966168977 / r07/22 DAN CAMPANELLA NMLS #459788 Senior Vice President, Mortgage Market Manager e: dan.campanella@citynational.com c: 1.877.511.4CNB
LOCAL EXPERTISE WITH A GLOBAL PERSPECTIVE
I’m thrilled to share our annual market report for 2022, offering meaningful insights about the state of the market, comparisons to 2021, and indicators of what we can look forward to in 2023. Florida continued to lead the US residential real estate market, with strong demand and pricing offsetting headwinds from rising interest rates and a shifting global economic landscape. Our state is growing both economically and demographically, which has resulted in record-high prices for single-family homes and condos.
ONE Sotheby’s International Realty continued to build upon our unparalleled network and further position our brand as the preeminent source for luxury real estate across Florida’s entire east coast. In 2022, we experienced tremendous growth and expanded to new markets, including Jacksonville, St. Augustine, Palm Coast, Ponte Vedra Beach, Amelia Island, and Brevard County - with acquisitions that included First Coast Sotheby’s International Realty and SunCoast Real Estate Group in Brevard. We also opened our new headquarters in Coconut Grove and an office in Cocoa Village. Our exceptional agents broke numerous price records and continued to elevate the real estate experience. At the same time, our Development Division launched some of the area’s most prestigious projects, including St. Regis Residences Miami, Pier 66 Fort Lauderdale, and The Village at Coral Gables. Our team and technology received industry-wide accolades including being voted the Best Luxury Brokerage in Florida by Luxury Lifestyle Magazine and Best Brokerage
Website by South Florida Agent Magazine, as well as recognitions from RIS Media, Florida Trend, and South Florida Business Journal. We hosted our largest ONE Summit on record, with over a thousand agents from our global Sotheby’s International Realty’s network who flew in from around the world.
I am incredibly proud of what our team accomplished in 2022. We navigated a quickly changing market and continued to build our footprint and capabilities. Despite the expectation that rates will fluctuate in 2023, all the data we have points to resiliency in buyer demand and limited supply in Florida, which is a recipe for pricing to remain strong. As our market remains the focus of global attention, I look forward to what we will achieve together in 2023.
Daniel de la Vega President ONE Sotheby’s International Realty

ABOUT TRENDS:

ONE Sotheby’s International Realty presents the only market report focused on Florida’s East Coast. From Miami to Amelia Island, data is presented from a macro perspective down to city level.
Data is sourced from local Multiple Listing Service (MLS) organizations. Written analysis created in partnership with the Rosen Consulting Group, a nationally recognized consulting firm and trusted advisor to top public and private real estate operators and capital providers.
THE REAL ESTATE MARKET ALONG FLORIDA’S EAST COAST
Following a record-setting pace in 2021, more than 148,000 single-family homes and condos sold across the east coast of Florida in 2022, a decline of roughly 22%. The drop in sales activity was consistent along the northeast and southeast coastlines. However, sales tallies held up better in some counties, with comparatively smaller declines in Brevard and Nassau counties.

By price range, transactions at the upper tiers generally slowed in comparison to most affordable homes in the past year. In 2022, 18% fewer single-family homes sold in the $3.5 million to $5 million range and 12% fewer in the $2 million to $3.5 million range. Conversely, sales of homes priced less than $1 million increased from 2021. In some counties, trends were reversed. Sales of higher-priced homes increased in Broward, Nassau and St. Johns counties.
Within the condo segment, sales totals were mixed. Sales of condo units priced above $3.5 million were on par with a strong 2021, while sales of units priced between $500,000 and $1 million increased by 7%. Sales of units priced between $1 million and $3.5 million fell by 11%. Trends varied by geography as well, with the highest-priced tiers recording more sales than the previous year in Broward and Palm Beach counties in southeast Florida and Duval and St. Johns counties in northeast Florida.
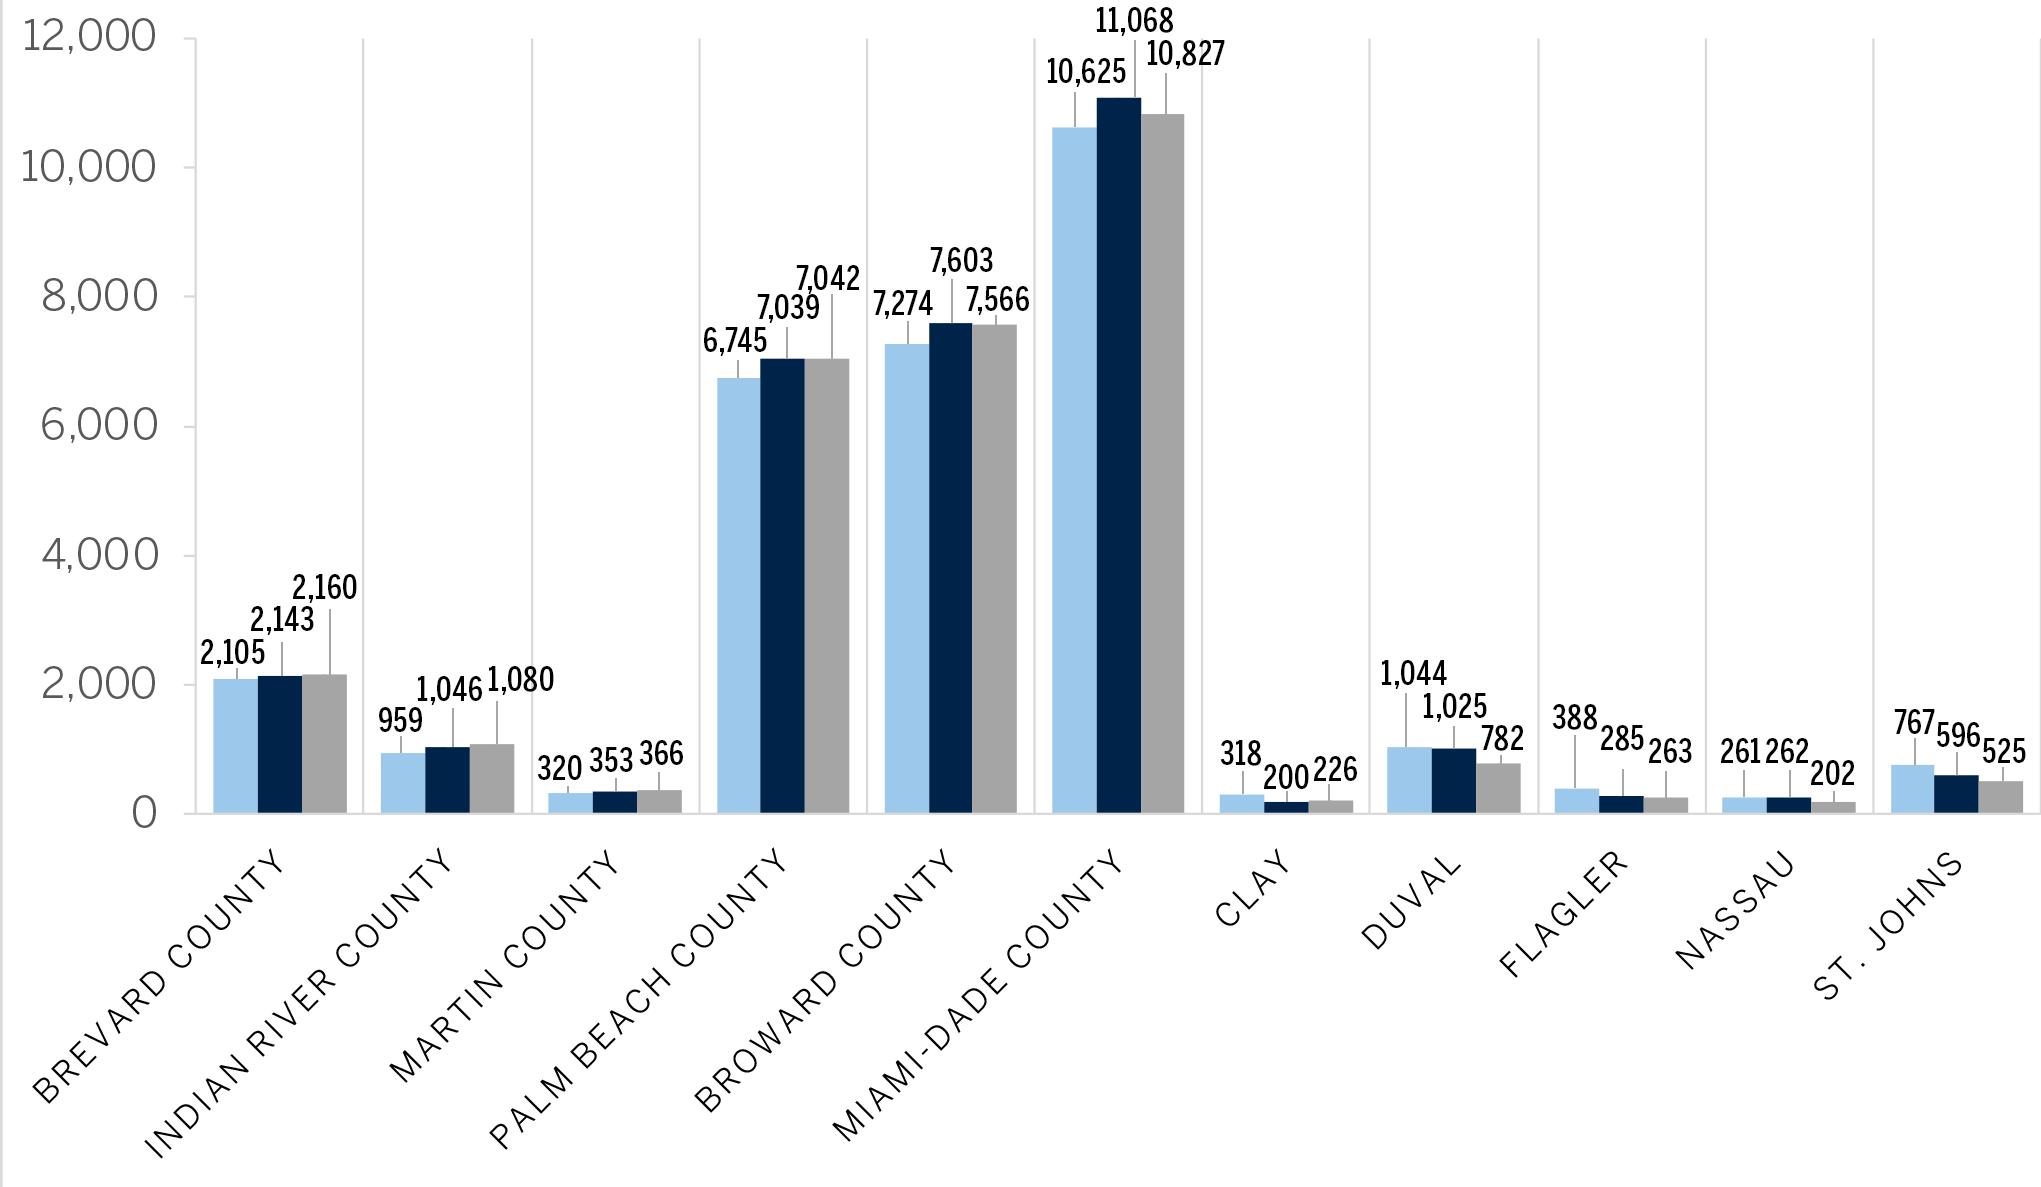
AVERAGE SALES PRICE BY COUNTY

FLORIDA’S EAST COAST

SINGLE- FAMILY HOMES CONDOMINIUMS DEC 2021 DEC 2022 AUG 2021 AUG 2022
ANNUAL 2022 MARKET REPORT
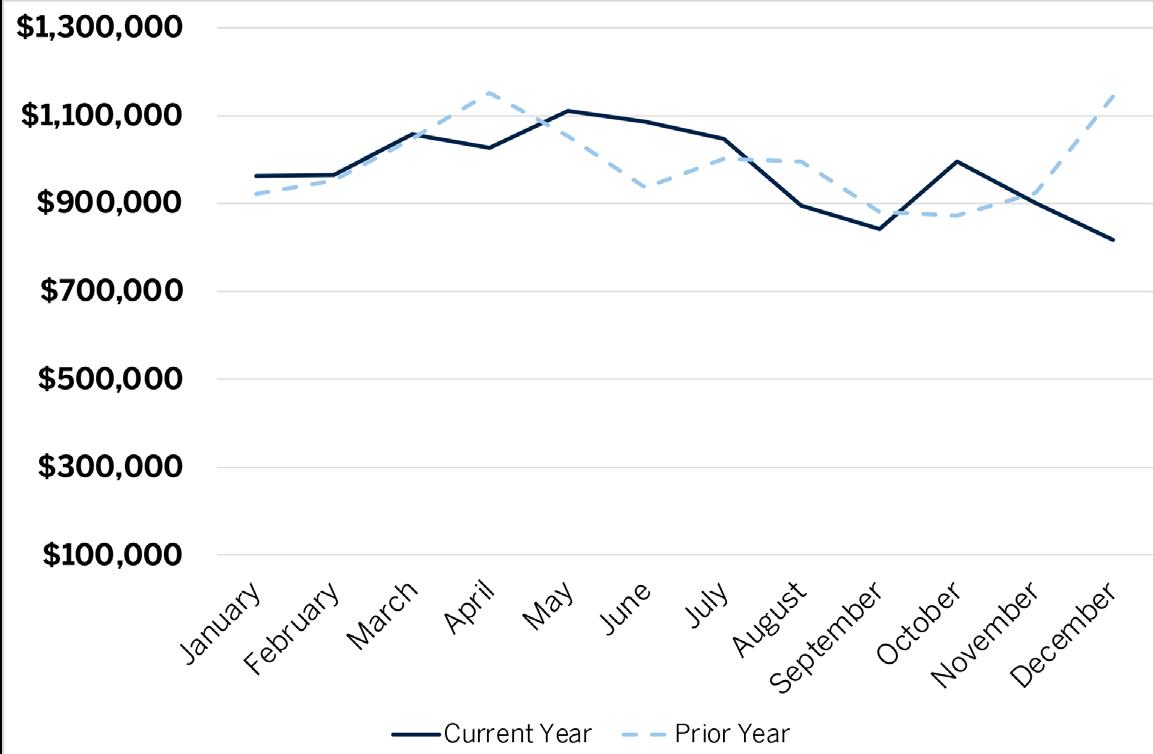
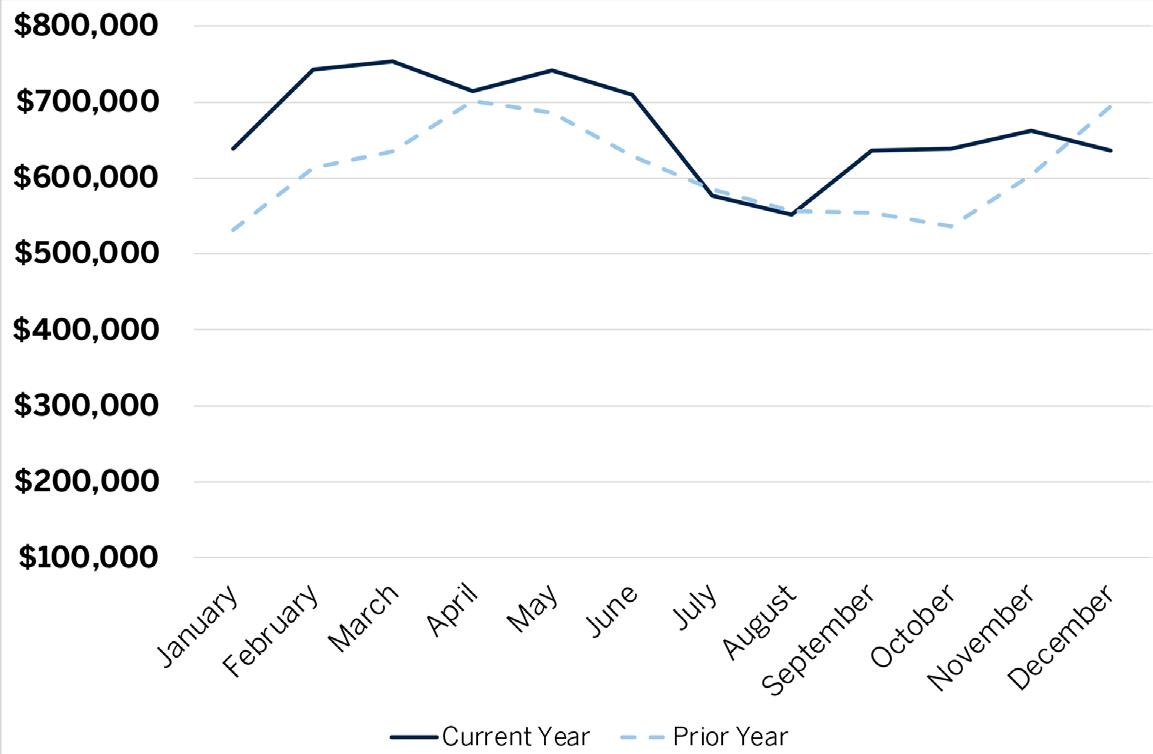
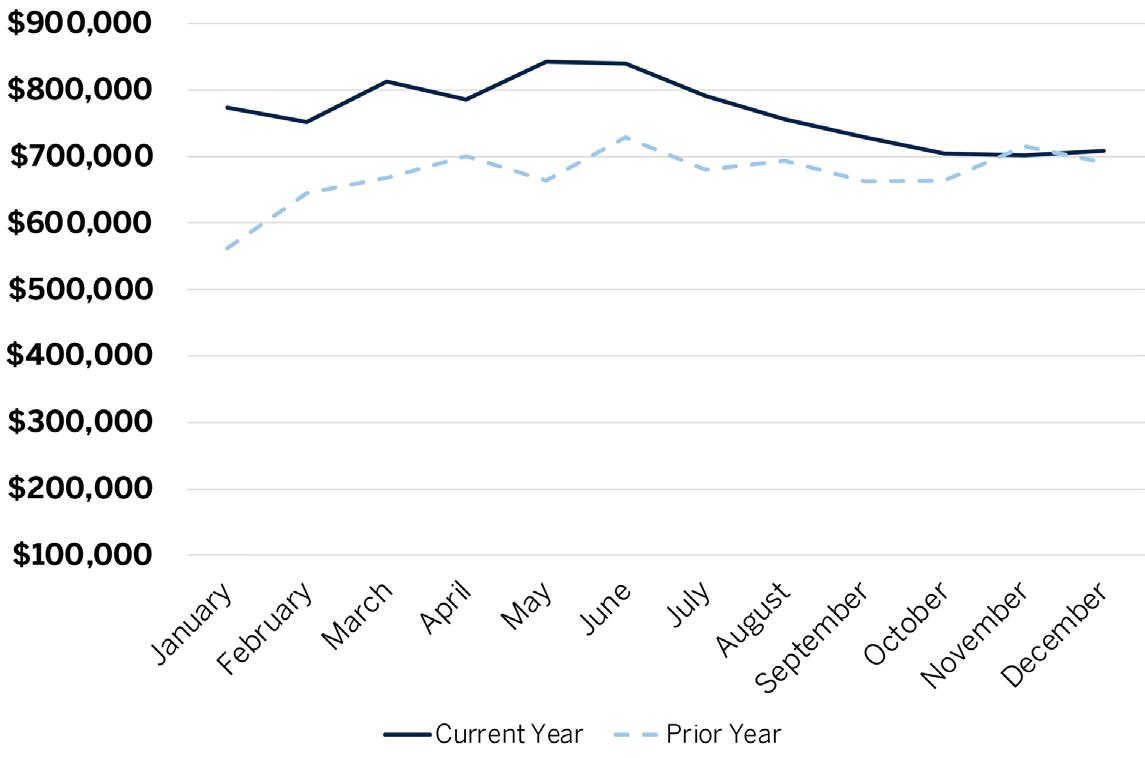
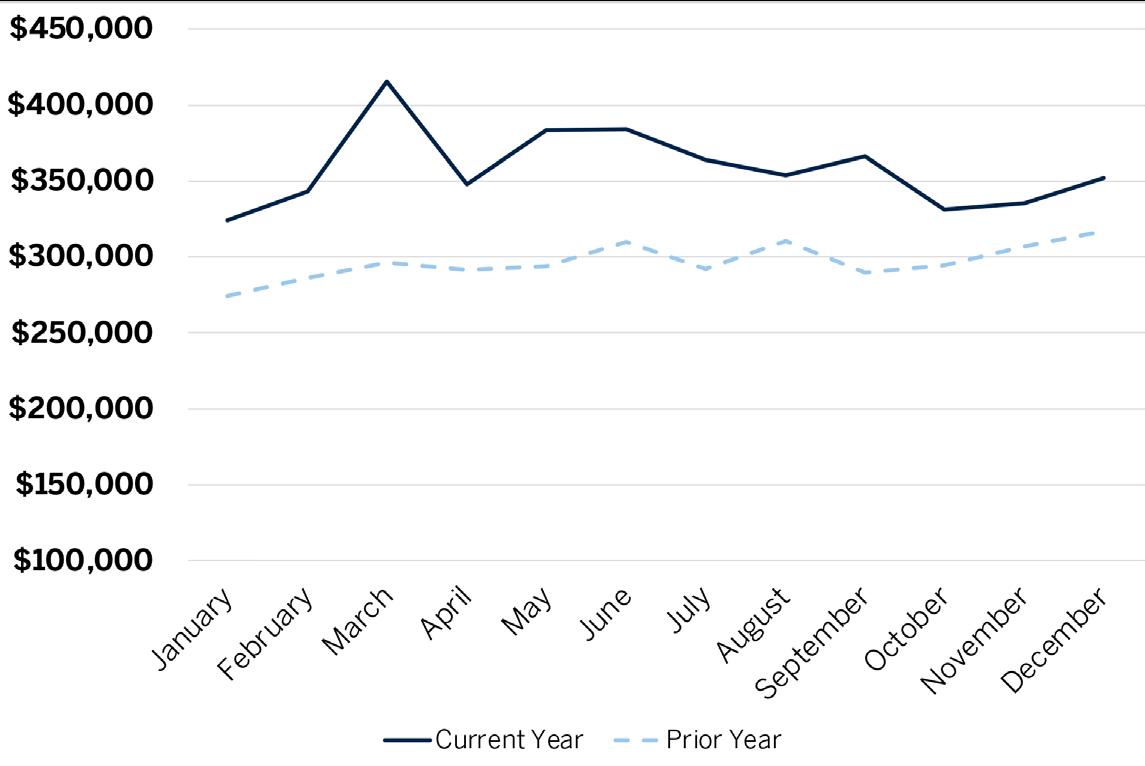
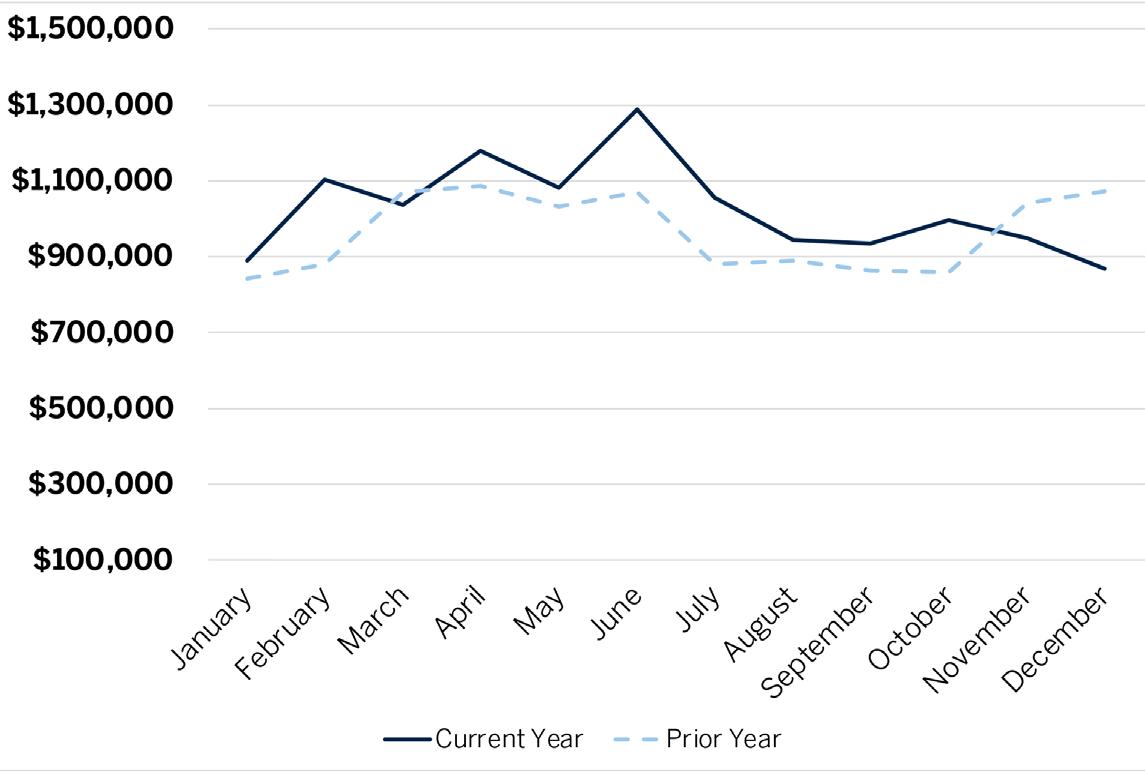
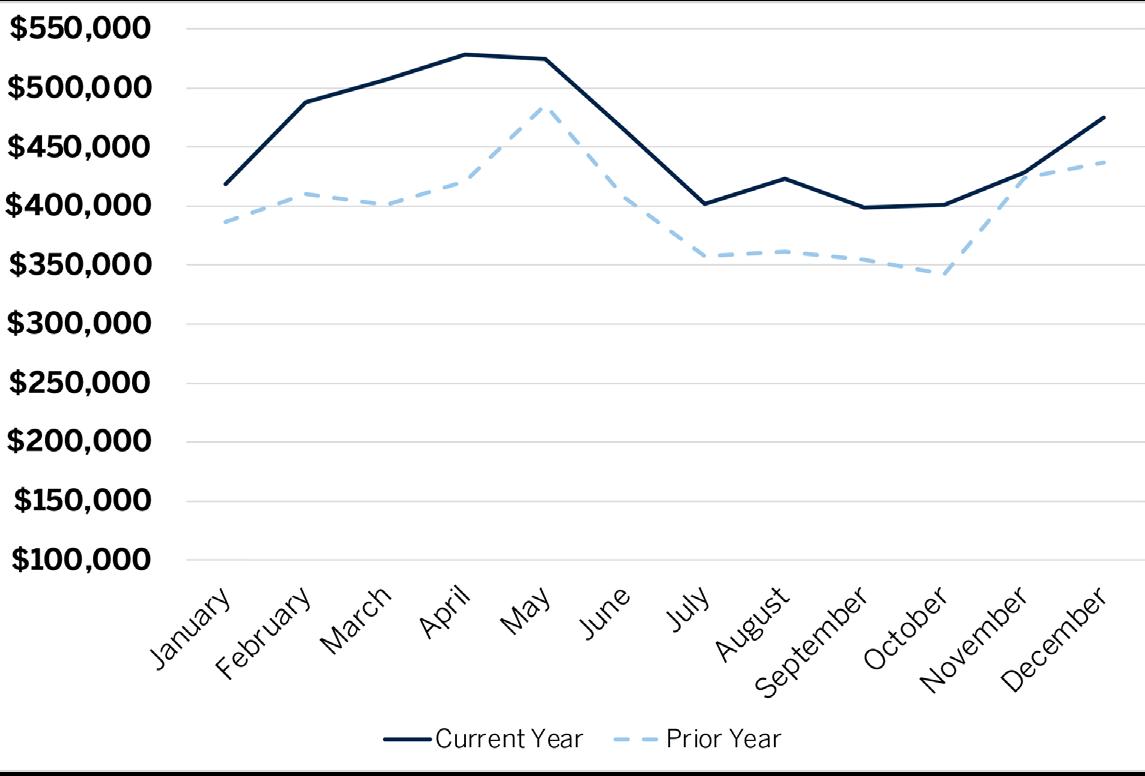
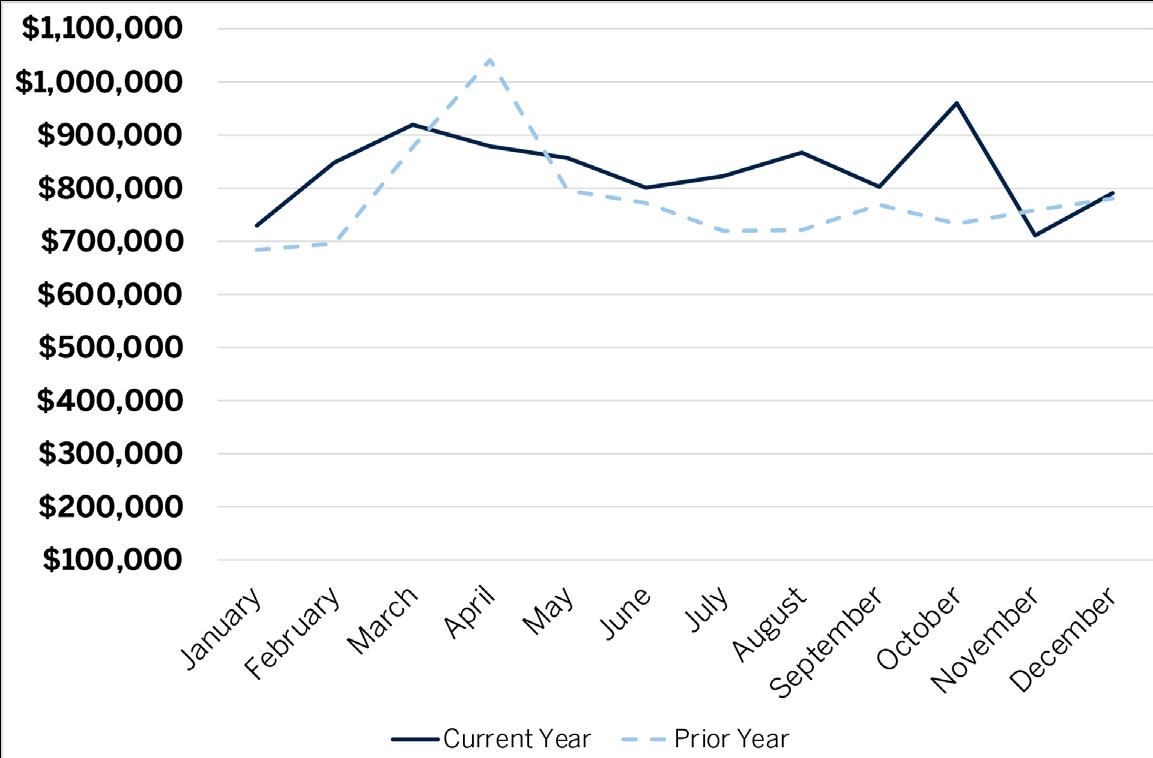
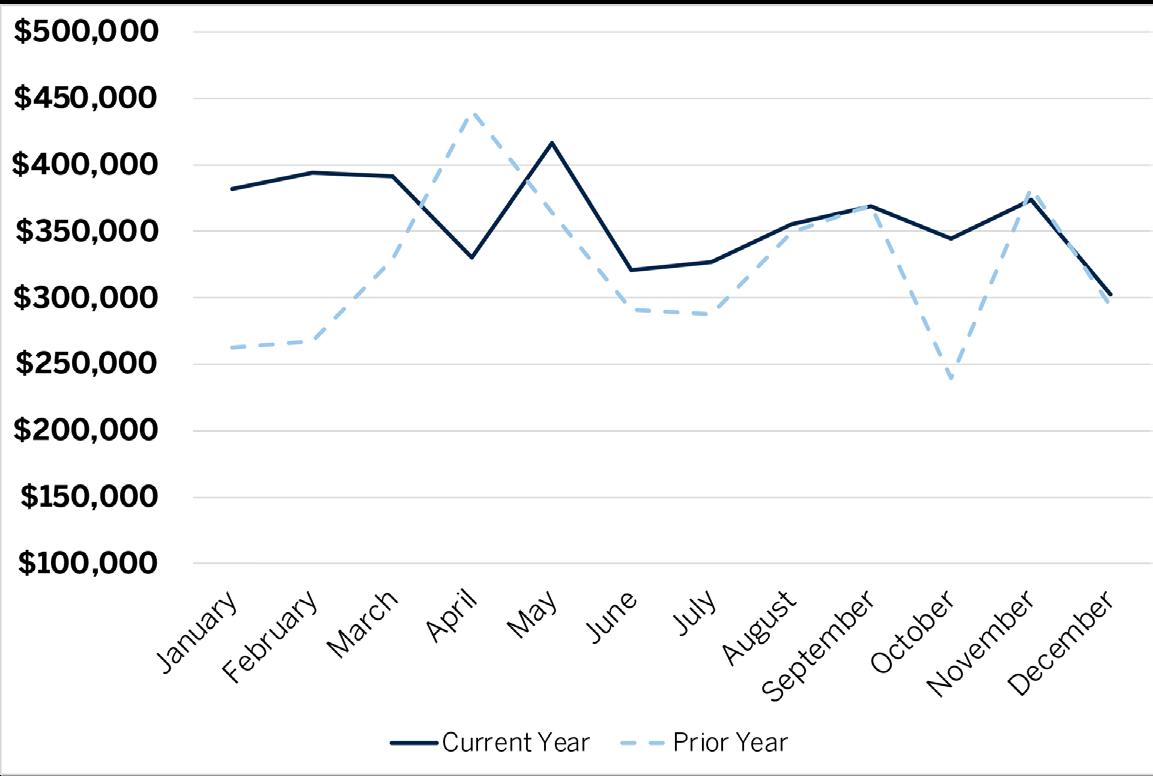
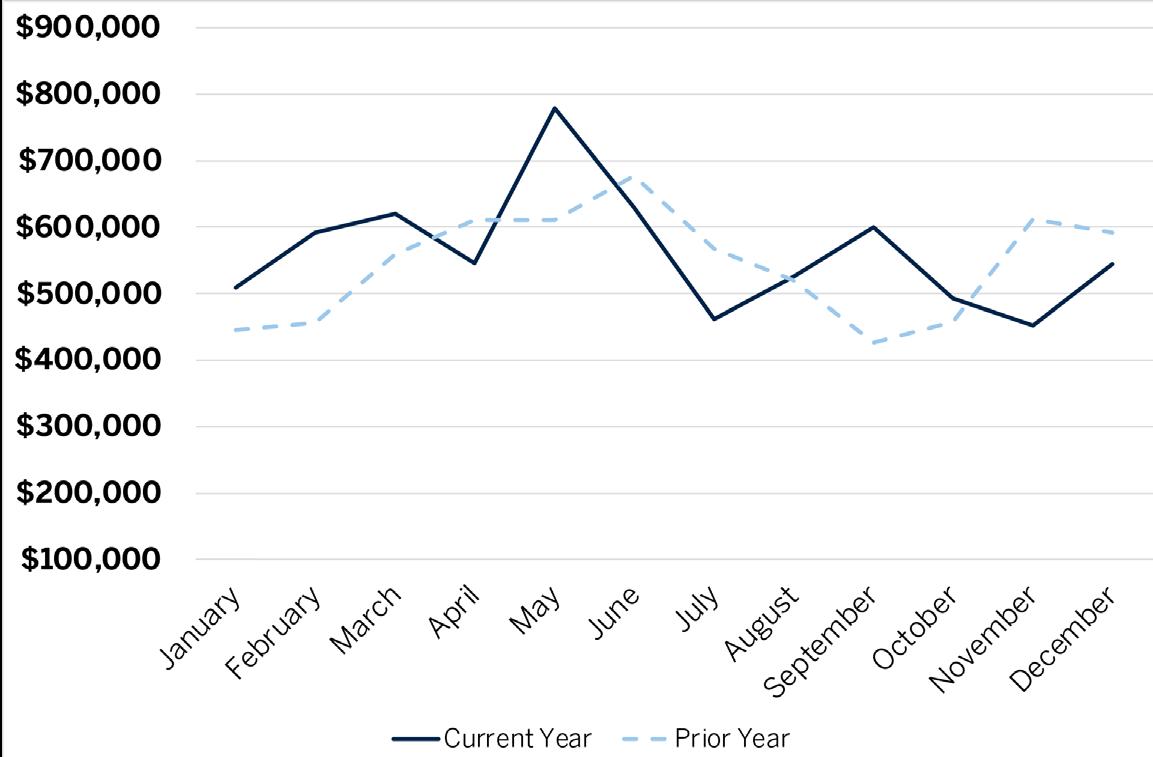
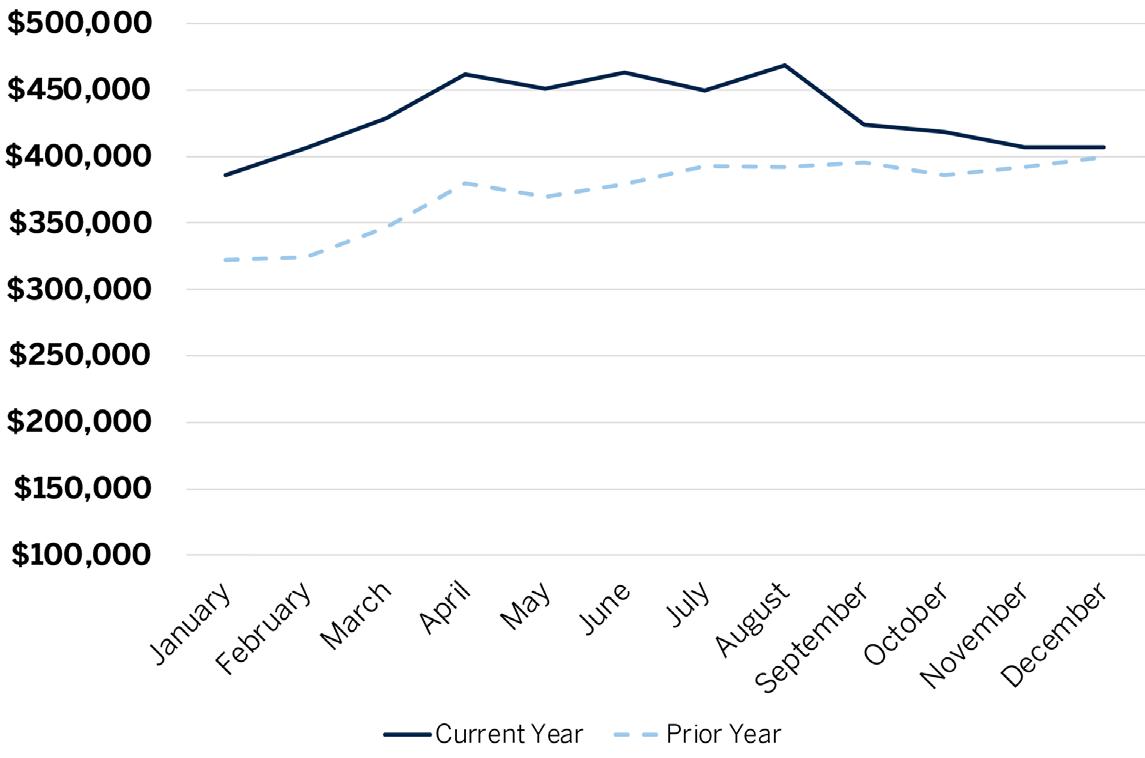
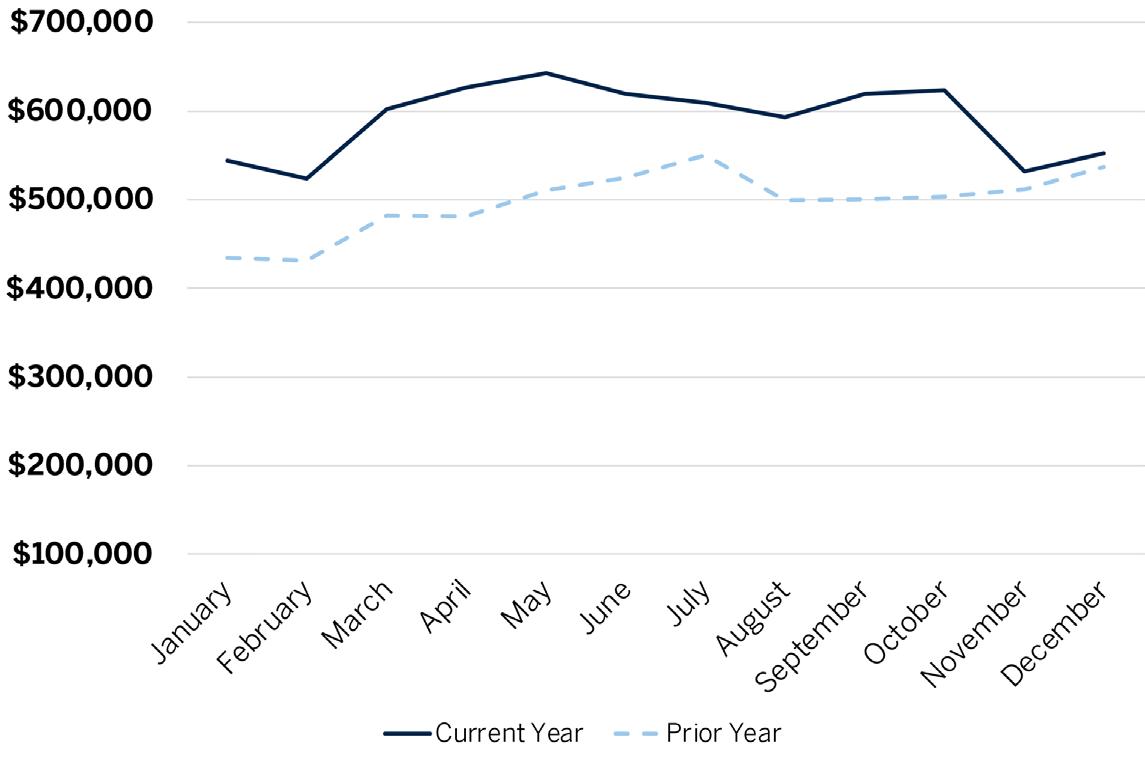
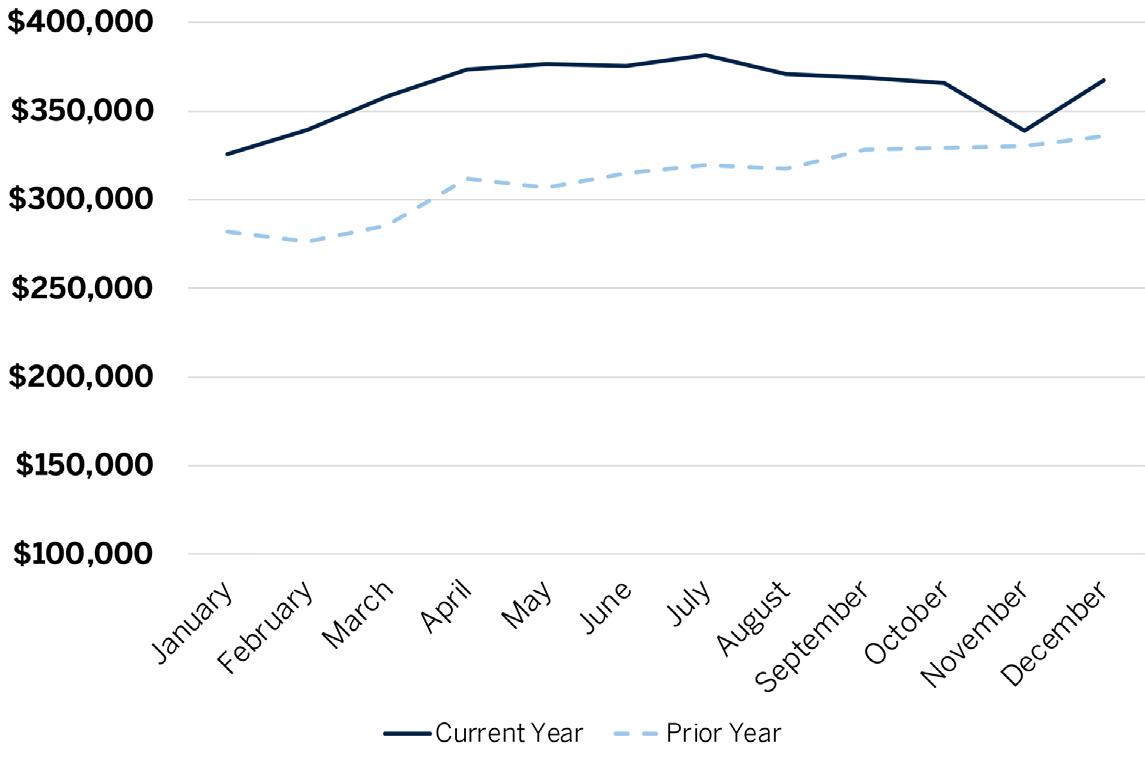
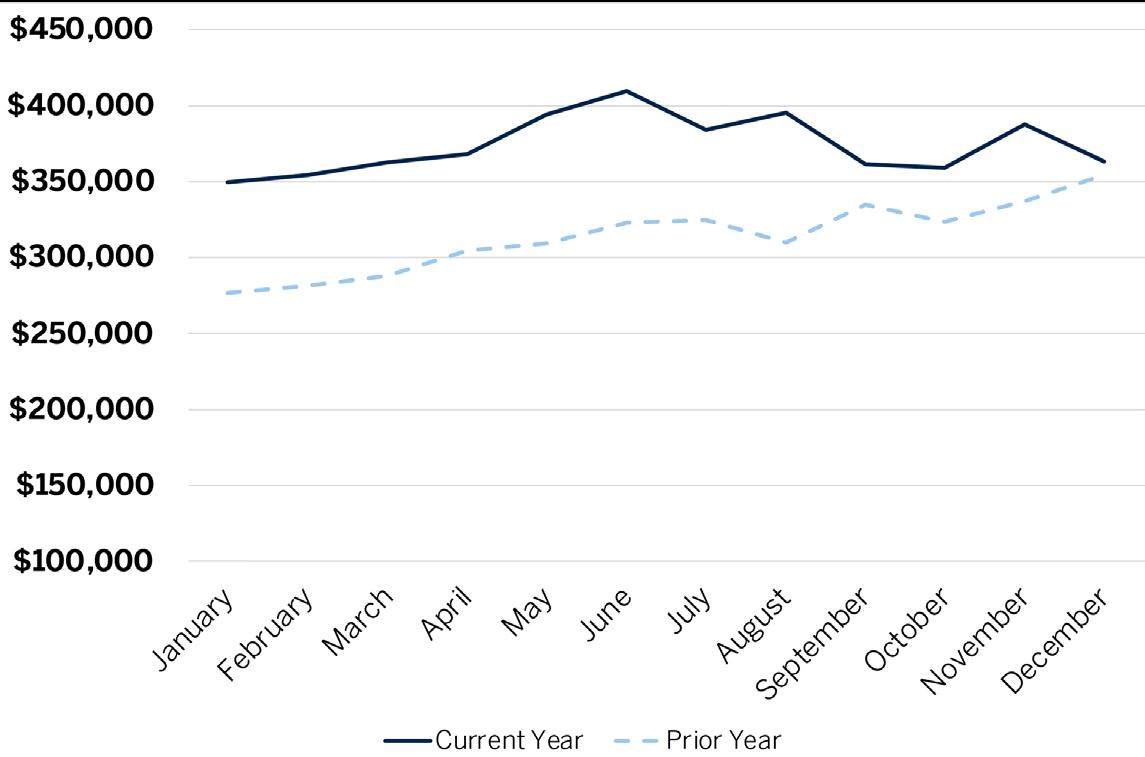
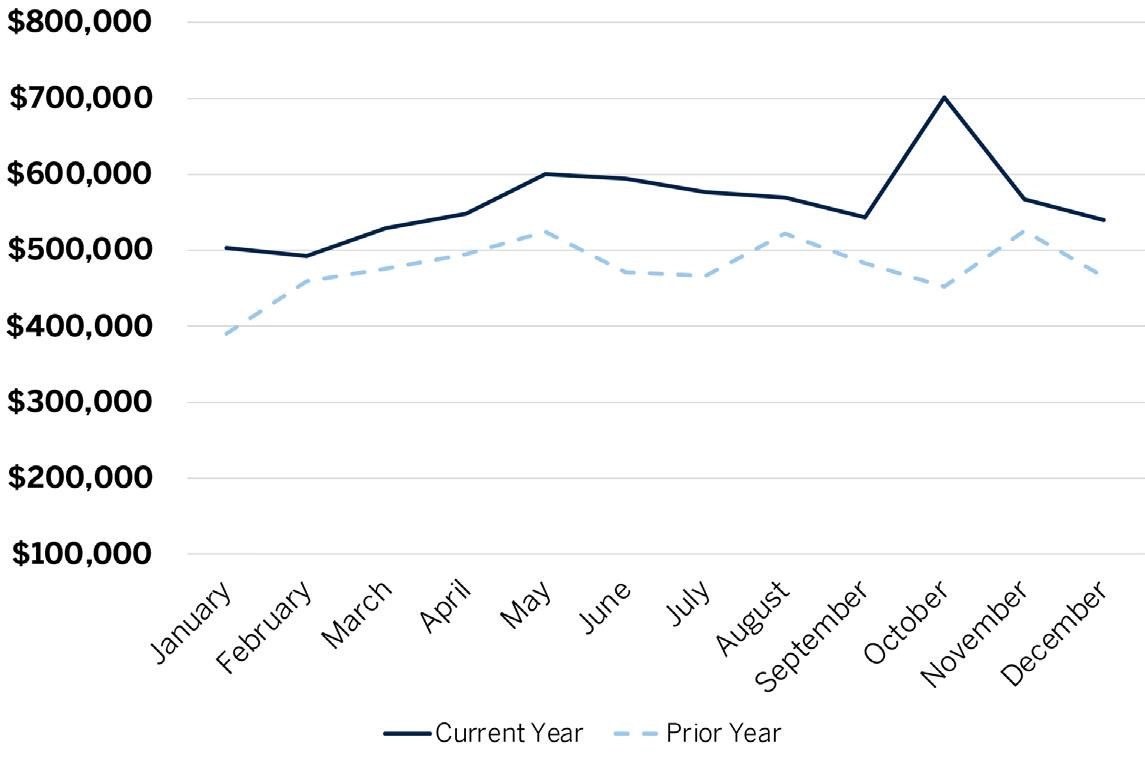
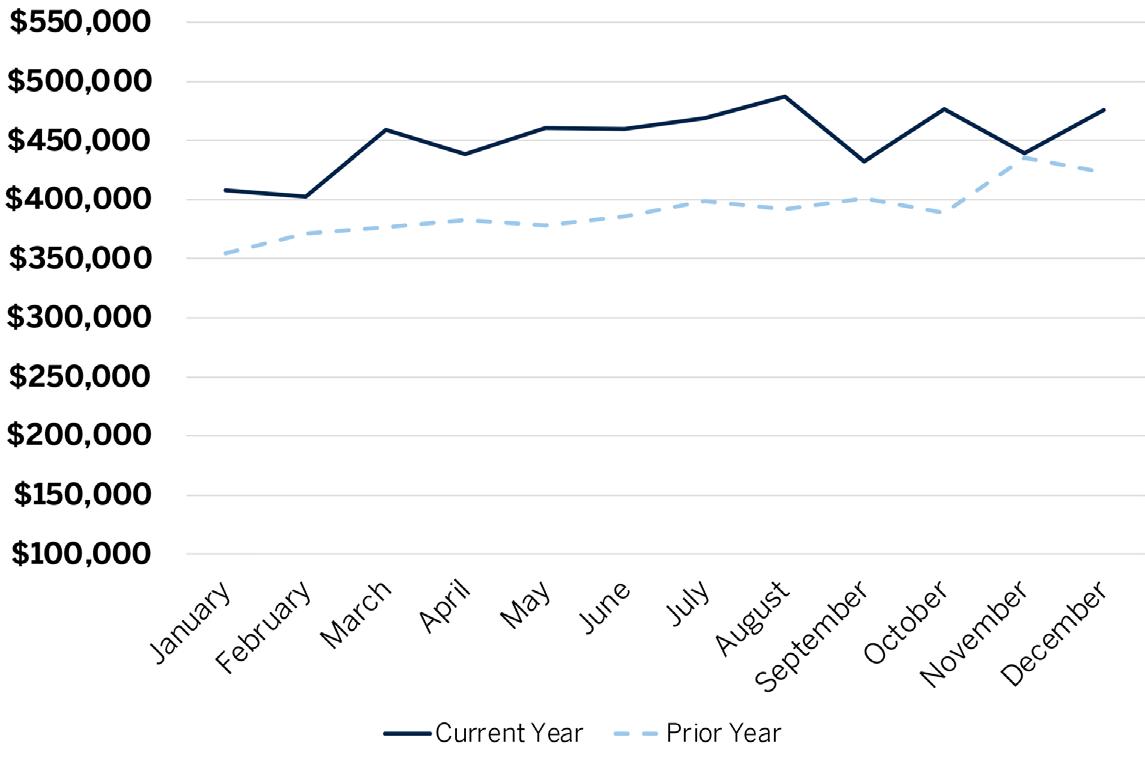
The median price of transactions closed in 2022 was higher than in 2021, with the median for single-family homes up by 15% and condos 17% higher. Much of the increase in pricing occurred through the summer, with some softening in the second half of the year. Price gains in Clay and Flagler counties paced the northeast coast. At the same time, Palm Beach County singlefamily and Brevard and Martin condos outperformed along the southeast coast.
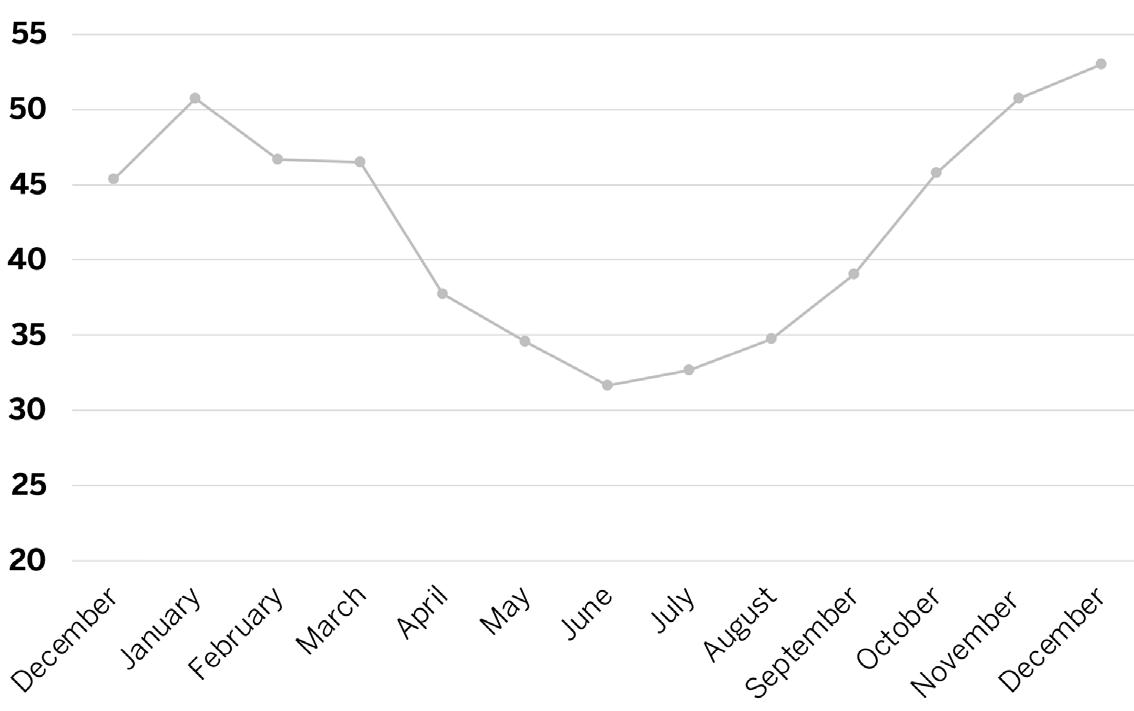
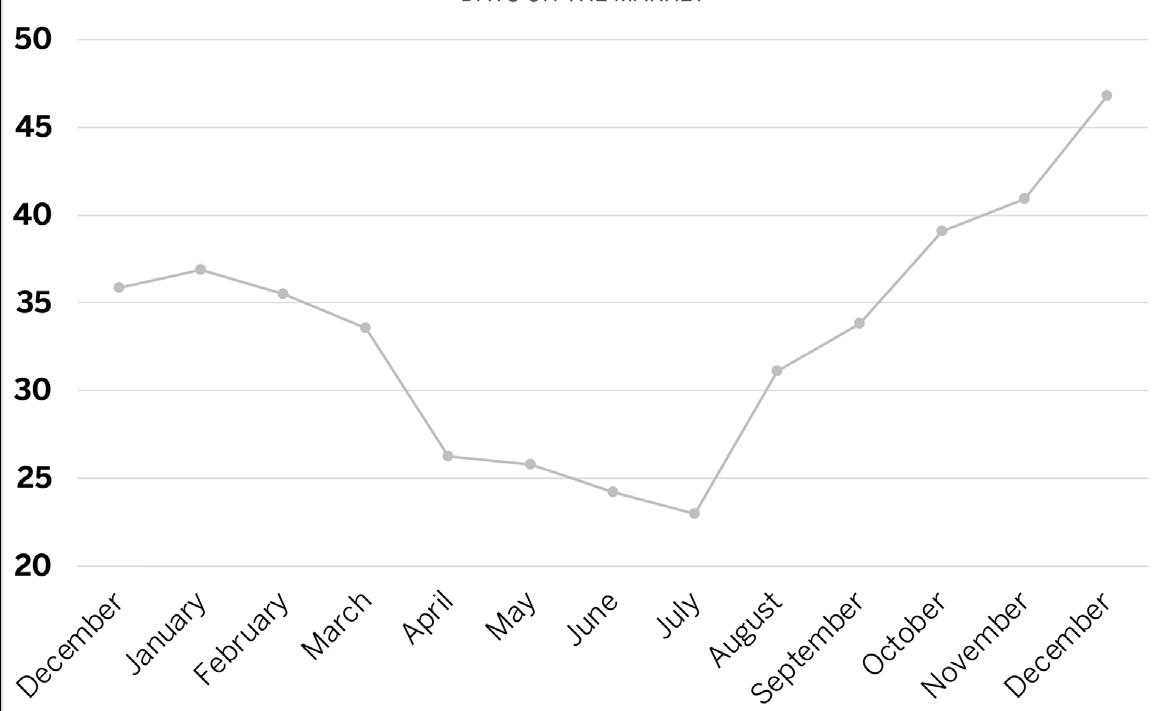
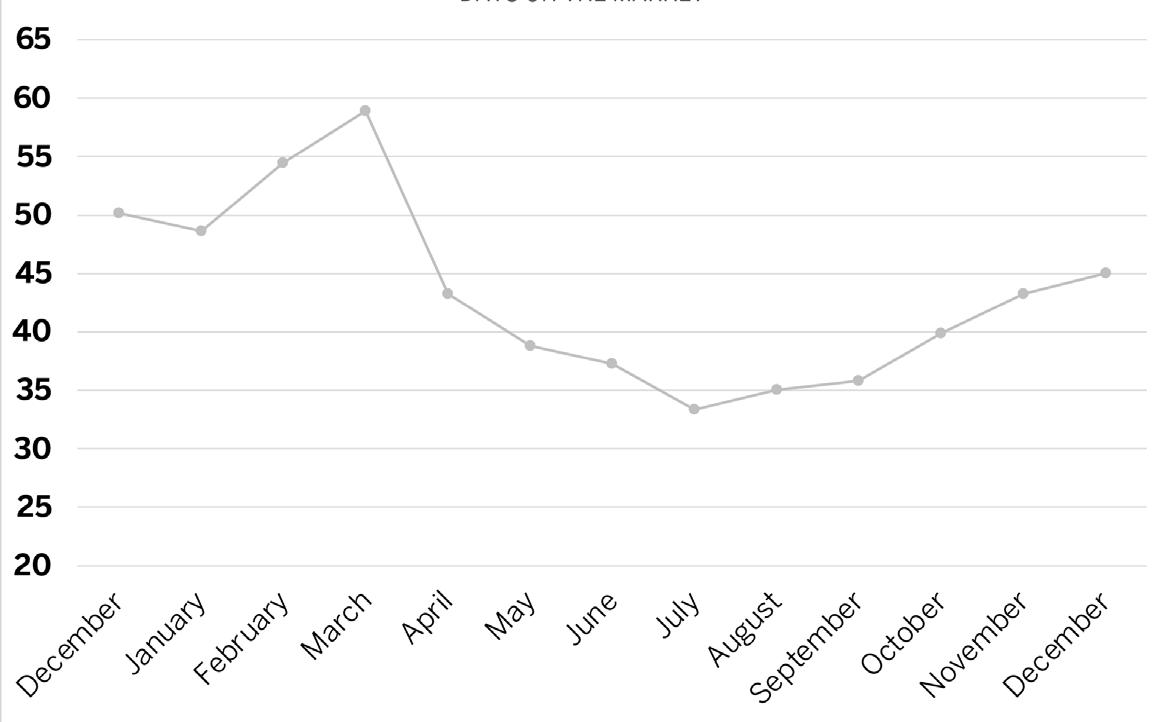
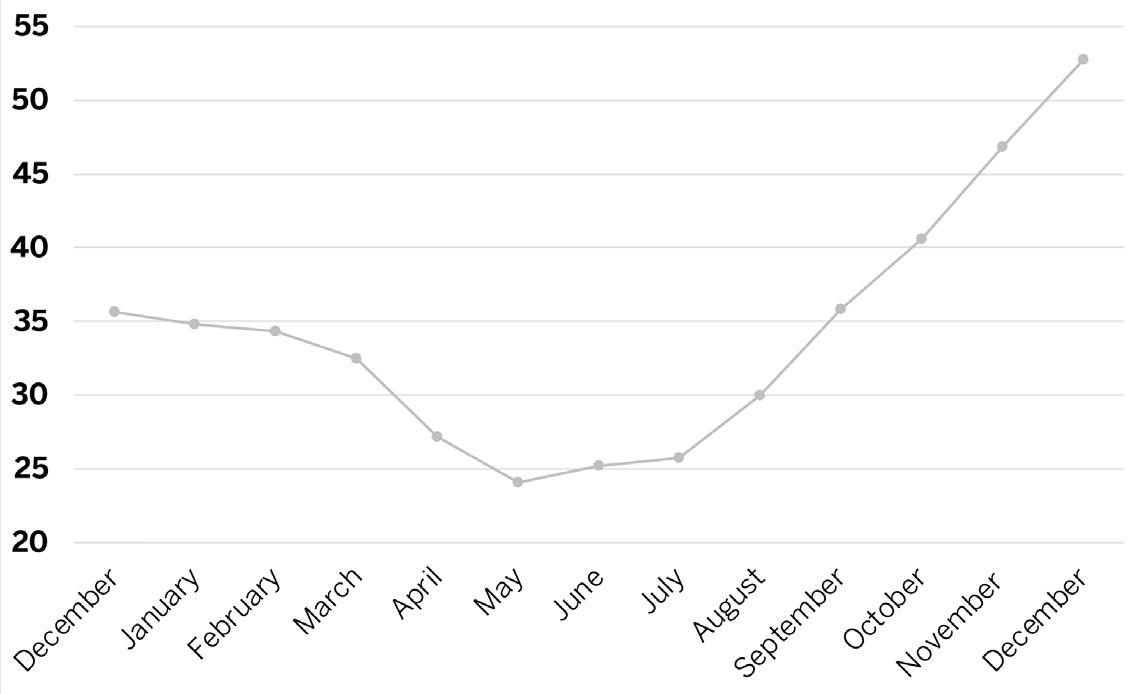
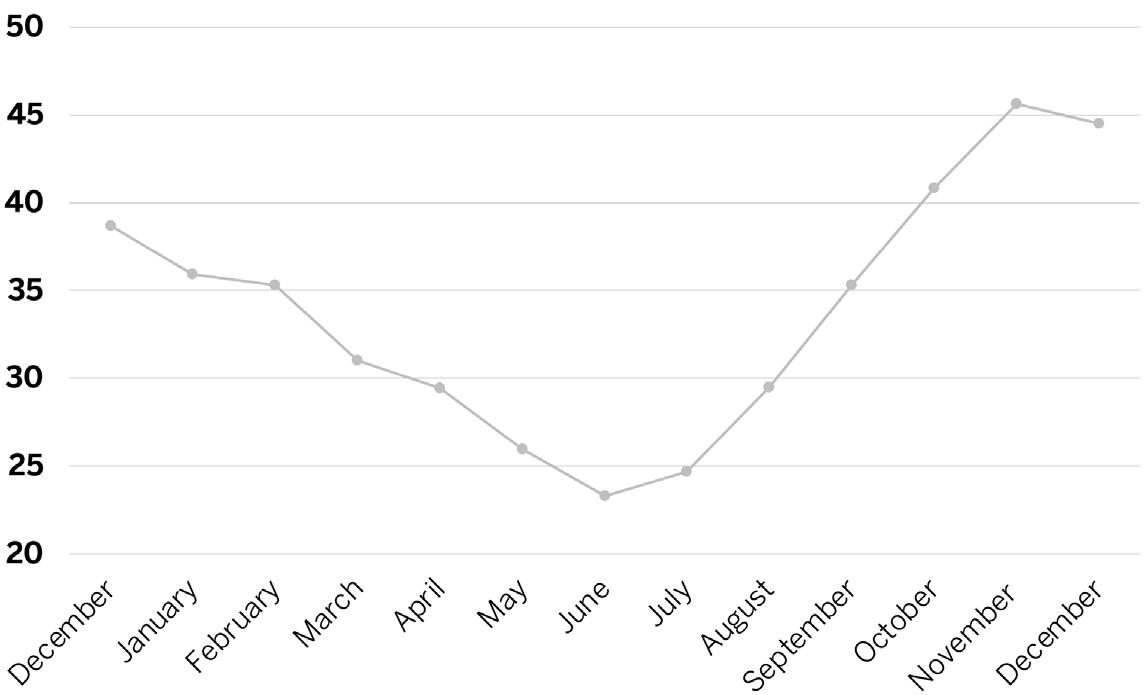
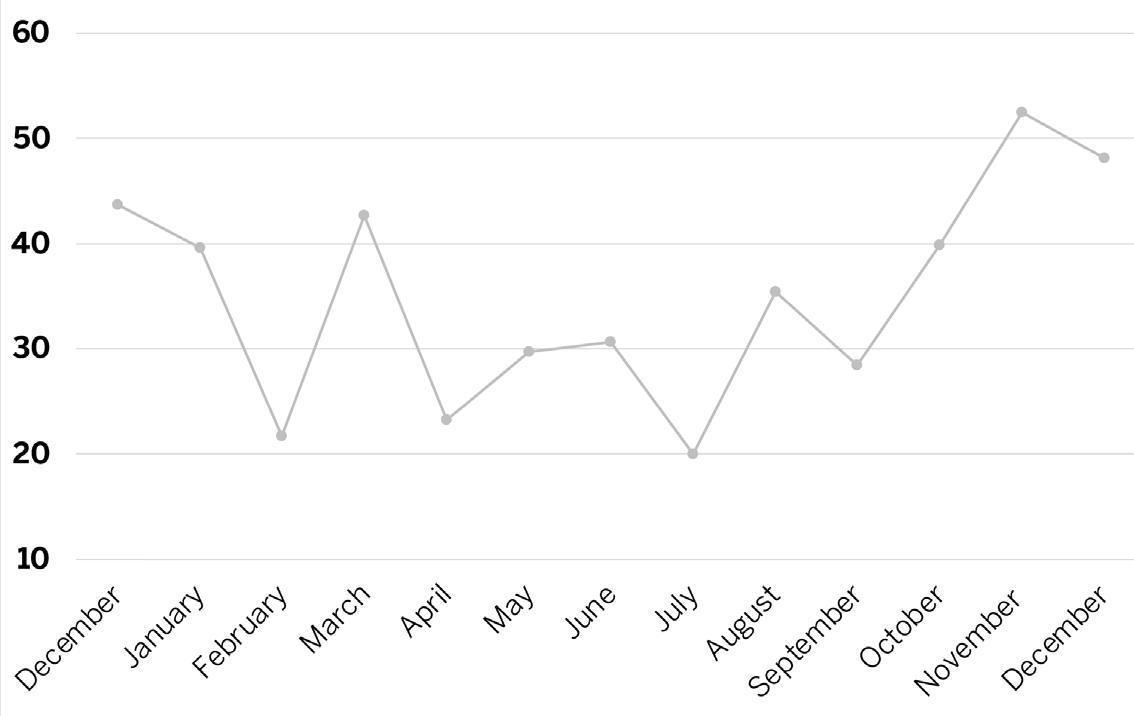
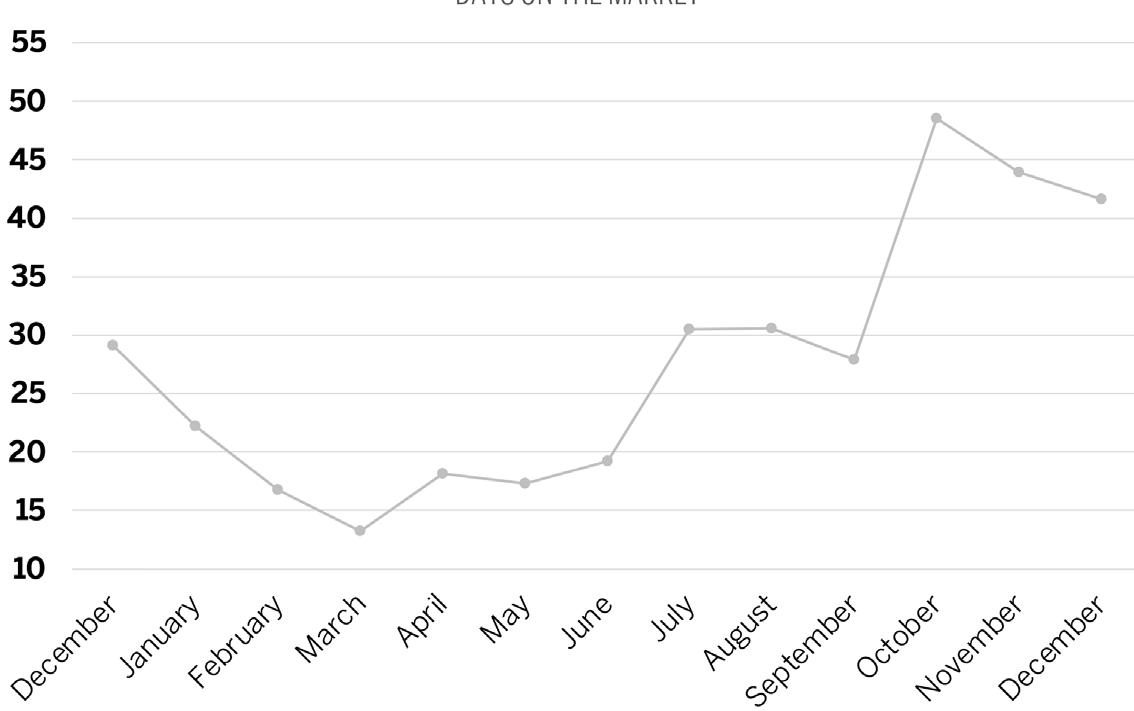
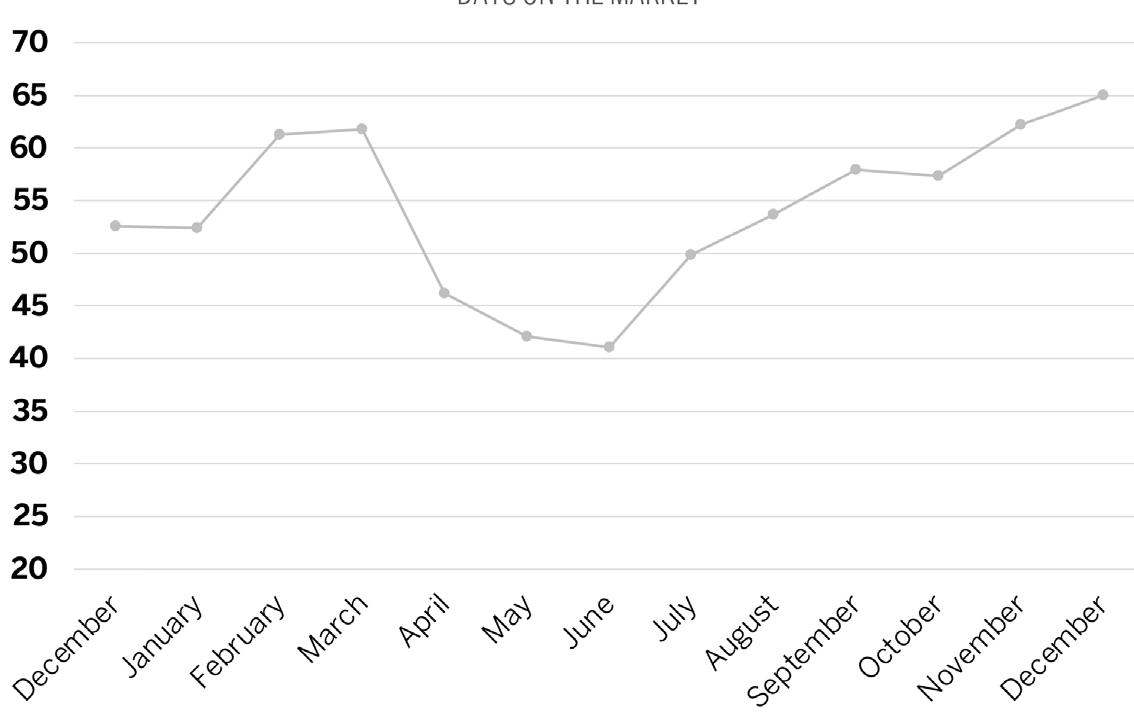
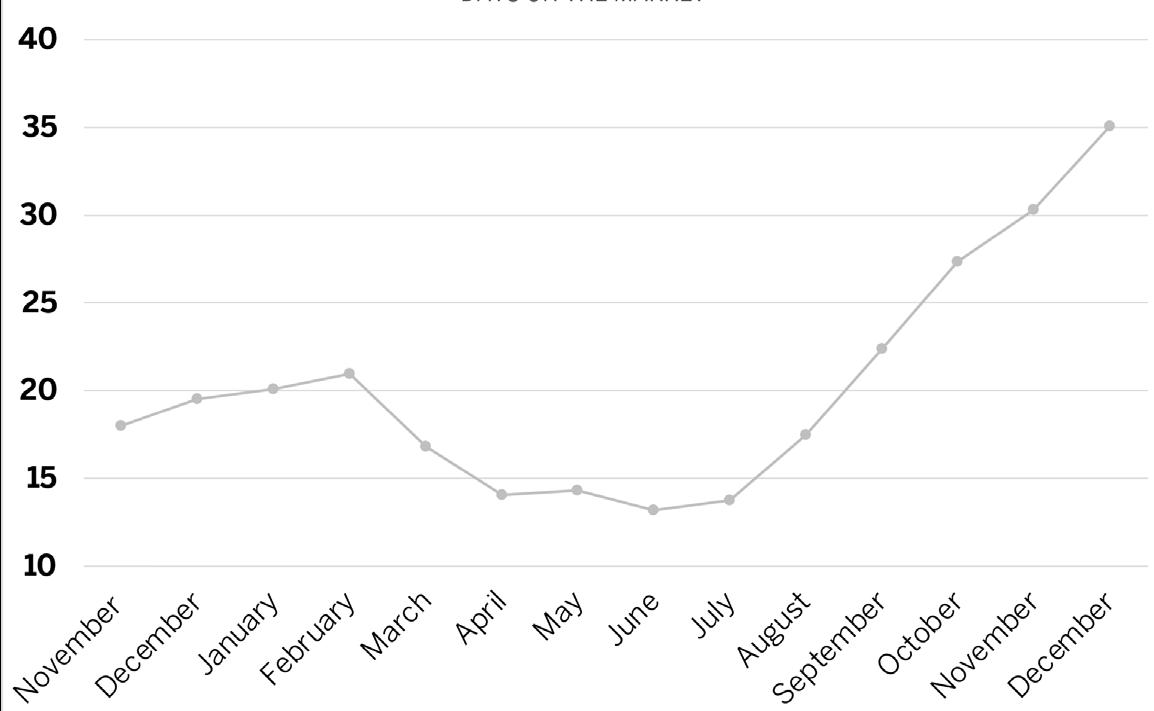
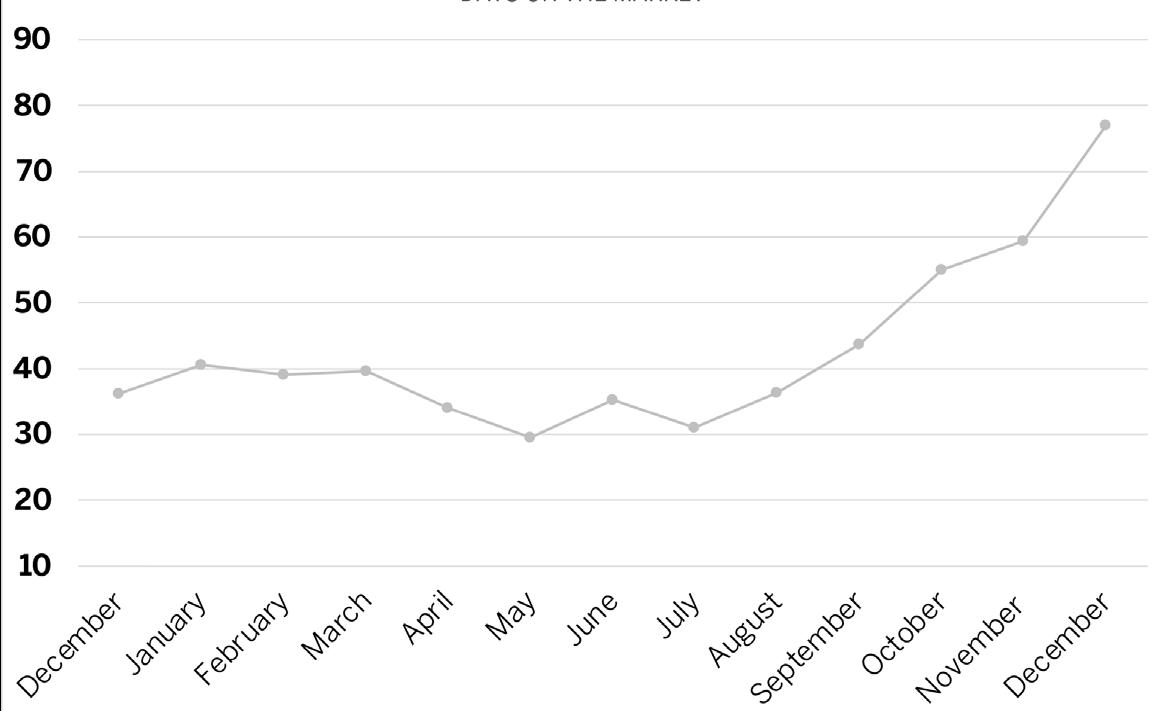
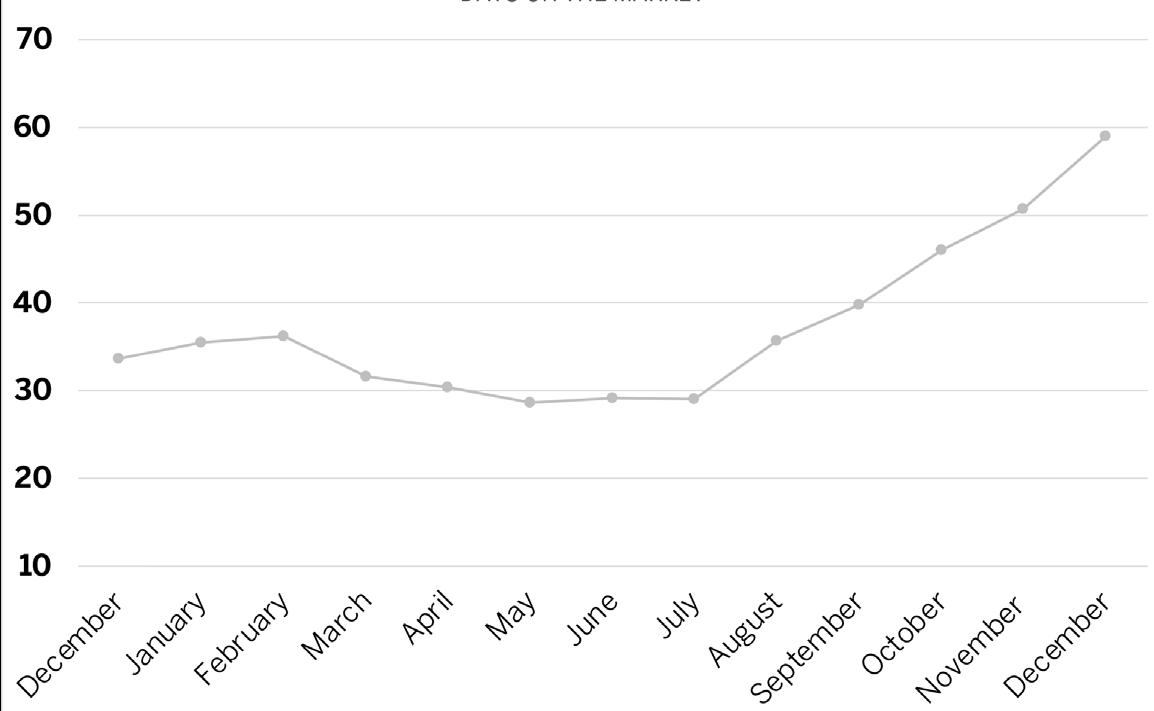
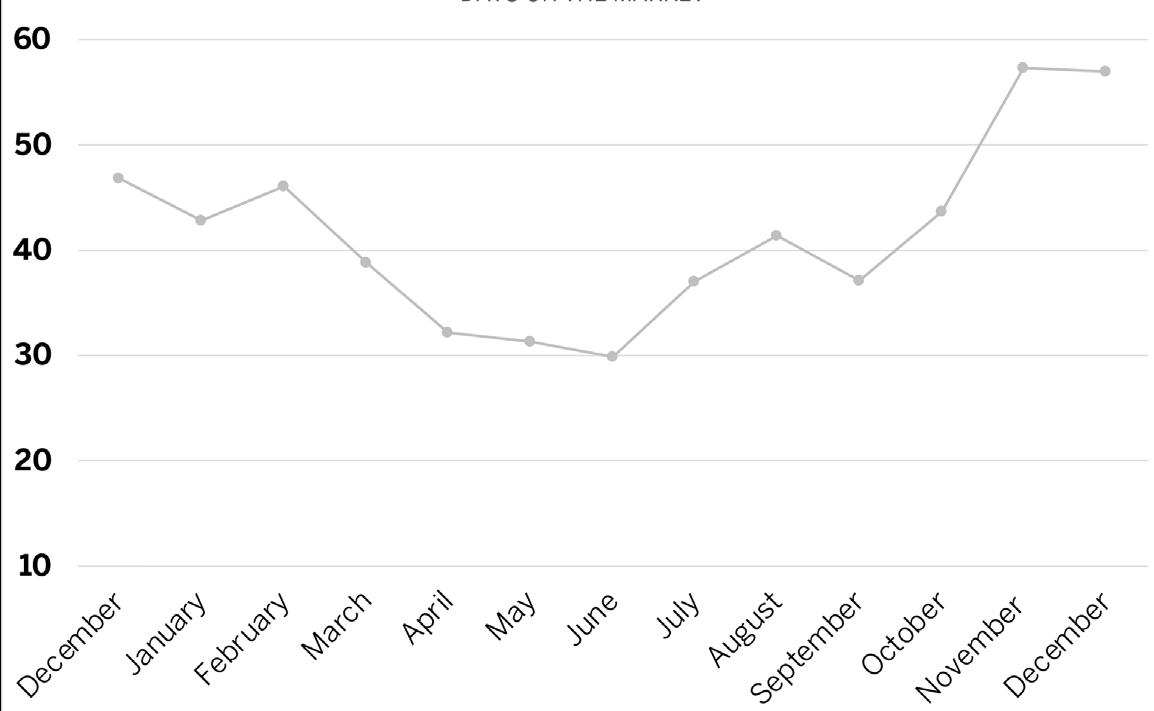
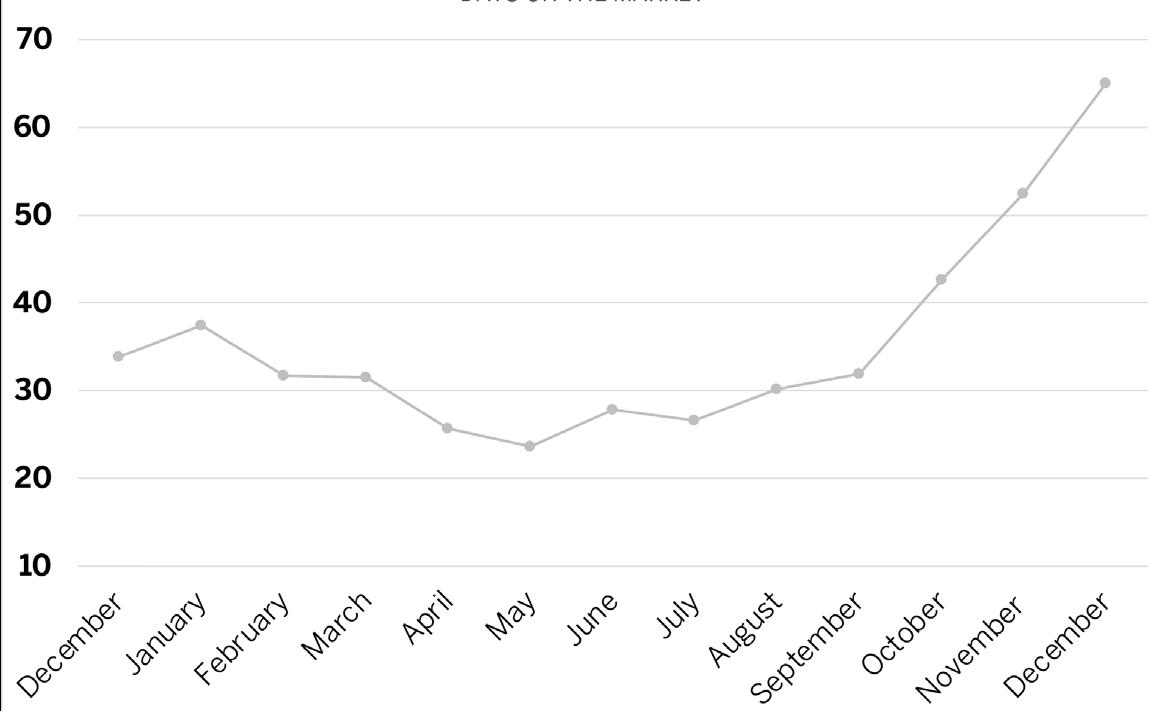
Buyer demand was resilient in 2022 in the face of headwinds and competition for homes in prime neighborhoods persisted. The average time on market of a sold home in 2022 was 40 days, more than 10 days fewer than in 2021. Time on the market less than 60 days typically indicates a seller’s market. Singlefamily homes sold in less than 35 days, on average. The average condo unit sold in 2022 was listed for less than 47 days, a sharp decline from more than 70 days in 2021.
MEDIAN SALES PRICE

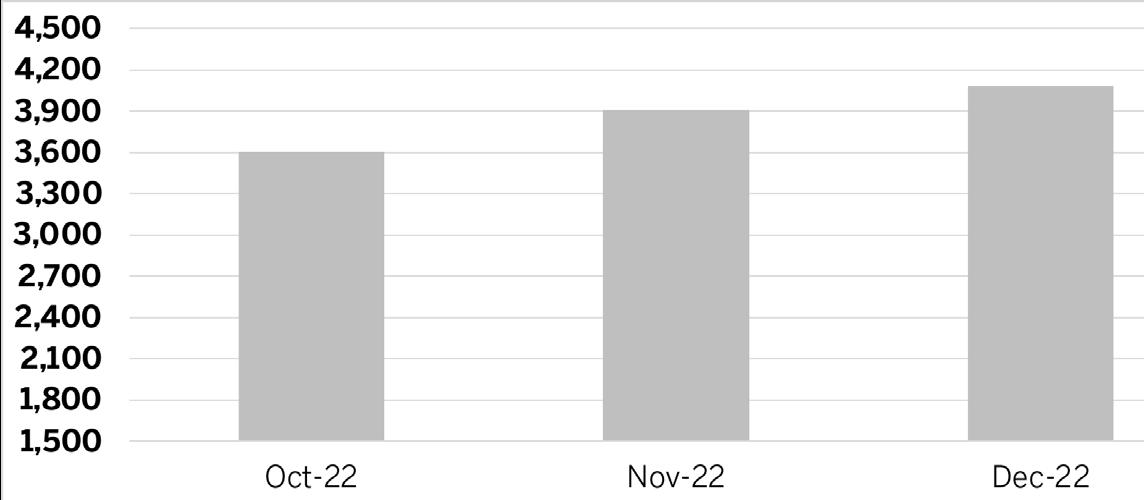
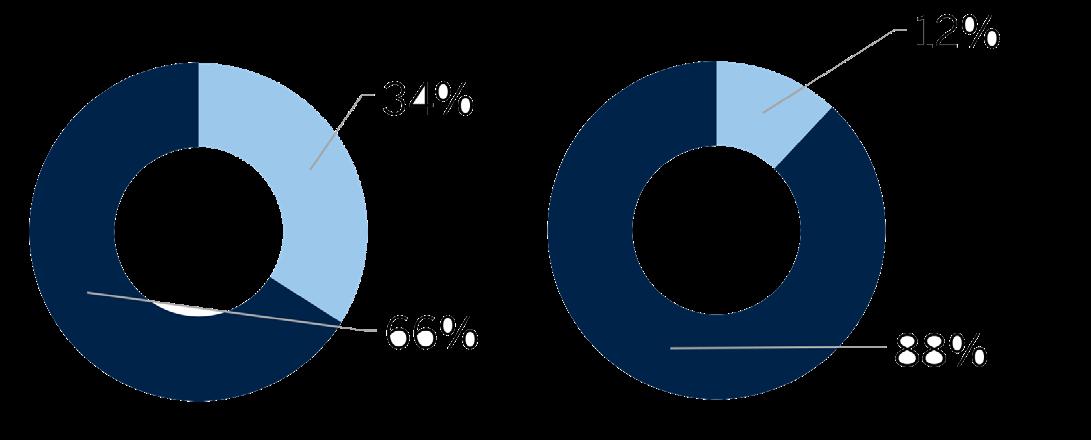
By the end of 2022, slightly more than 33,000 singlefamily homes and condos were listed along the east coast of Florida. Since the close of 2021, single-family home listings have increased by 66% and condo listings by 32%. Despite the surge in listings, the number of available homes remains lower than the historical average. By region, listings increased in southeast Florida and decreased in northeast Florida. Pricing trends for listings varied as well, with the average price of a listed single-family home up by more than 10% in 2022 while the average price of condo listings declined by 3%.
Despite the slower market conditions than the previous year, market activity held up throughout much of the region in 2022. Buyers will adjust to higher mortgage rates and the rebounding equity markets may help fuel cash transactions. A full recovery of international buyers, held back by several factors, including a strong dollar, would boost sales in the coming year.
$445,000 -1%
FLORIDA’S EAST COAST
THE REAL ESTATE MARKET ALONG FLORIDA’S EAST COAST
DEC 22 CHANGE FROM PRIOR YEAR 2022 YOY% CHANGE 2022 YOY% CHANGE 2022 YOY% CHANGE 2022 YOY% CHANGE 2022 MIAMI-DADE COUNTY SINGLE FAMILY HOMES 4,108 70% $560,000 12% $990,951 -1% $420 13% 11,605 -22% $45,250,000 CONDOS 6,719 8% $392,750 15% $678,657 10% $471 19% 18,082 -18% $23,500,000 BREVARD COUNTY SINGLE FAMILY HOMES 1,736 161% $360,000 16% $433,772 16% $226 19% 9,763 -14% $5,300,000 CONDOS 424 87% $285,000 24% $373,412 22% $268 22% 1,859 -20% $2,680,000 BROWARD COUNTY SINGLE FAMILY HOMES 3,483 130% $560,000 16% $774,035 15% $351 20% 13,474 -23% $32,500,000 CONDOS 4,083 51% $250,000 16% $361,515 22% $269 25% 16,750 -17% $15,400,000 INDIAN RIVER COUNTY SINGLE FAMILY HOMES 775 185% $385,000 15% $569,544 2% $265 16% 2,557 -25% $20,000,000 CONDOS 305 228% $266,400 16% $401,706 18% $264 23% 1,010 -33% $3,620,820 MARTIN COUNTY SINGLE FAMILY HOMES 208 235% $630,000 18% $839,631 7% $341 20% 775 -35% $9,000,000 CONDOS 158 690% $285,000 27% $358,597 9% $270 25% 533 -30% $3,100,000 PALM BEACH COUNTY SINGLE FAMILY HOMES 3,664 141% $615,000 21% $1,039,418 7% $383 22% 12,839 -27% $55,000,000 CONDOS 3,378 115% $295,000 22% $463,267 15% $254 19% 12,778 -27% $23,750,000 CLAY COUNTY RESIDENTIAL 226 -34% $350,000 19% $374,770 19% $189 21% 3,966 -21% $4,600,000 DUVAL COUNTY RESIDENTIAL 782 -52% $305,000 15% $362,520 16% $203 19% 16,593 -27% $6,000,000 FLAGLER COUNTY RESIDENTIAL 263 -56% $372,700 18% $451,961 16% $235 20% 4,552 -18% $3,195,000 NASSAU COUNTY RESIDENTIAL 202 -56% $425,990 14% $566,111 18% $267 16% 3,788 -15% $13,350,000 ST. JOHNS COUNTY RESIDENTIAL 525 -61% $480,000 18% $593,027 19% $280 22% 10,004 -21% $12,216,000 FOR SALE MEDIAN SALES PRICE AVG SALES PRICE PRICE PER SF CLOSED TRANSACTIONS HIGHEST SALES ANNUAL 2022 MARKET REPORT
AVAILABLE INVENTORY
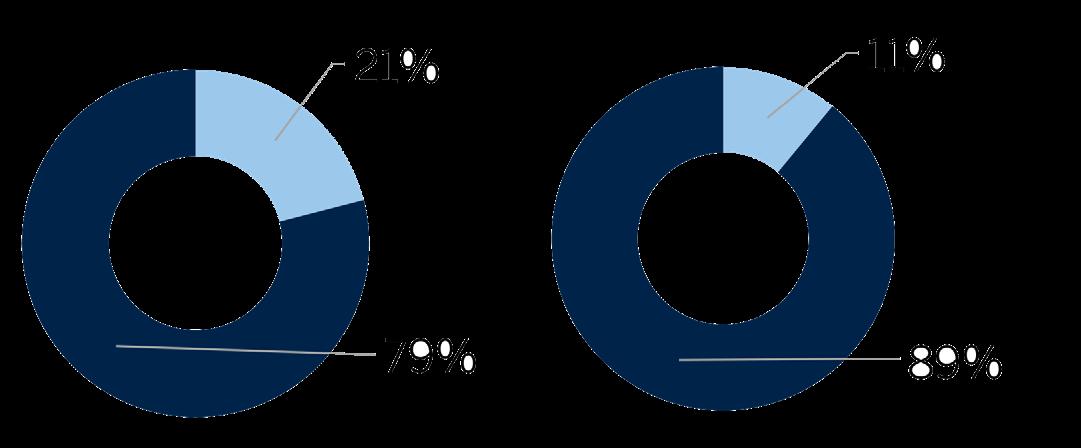
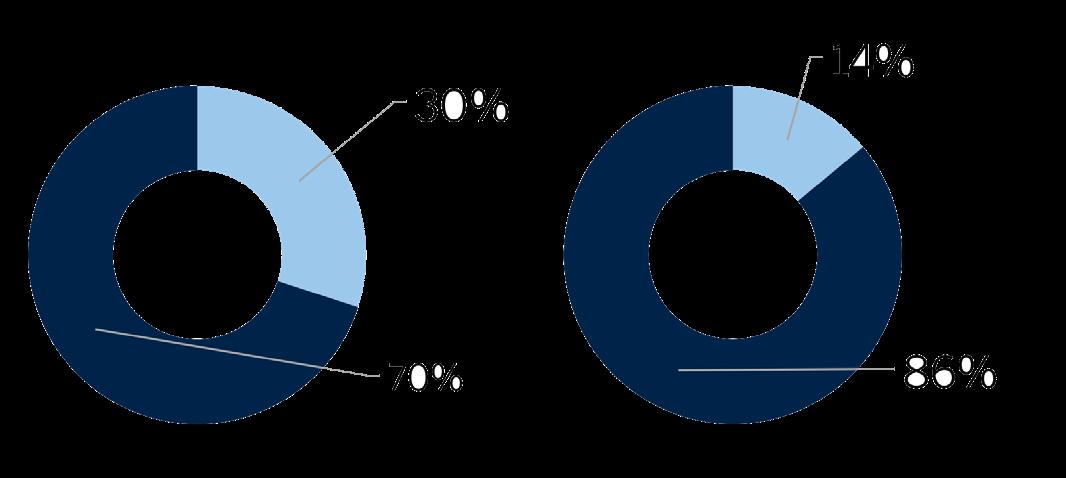
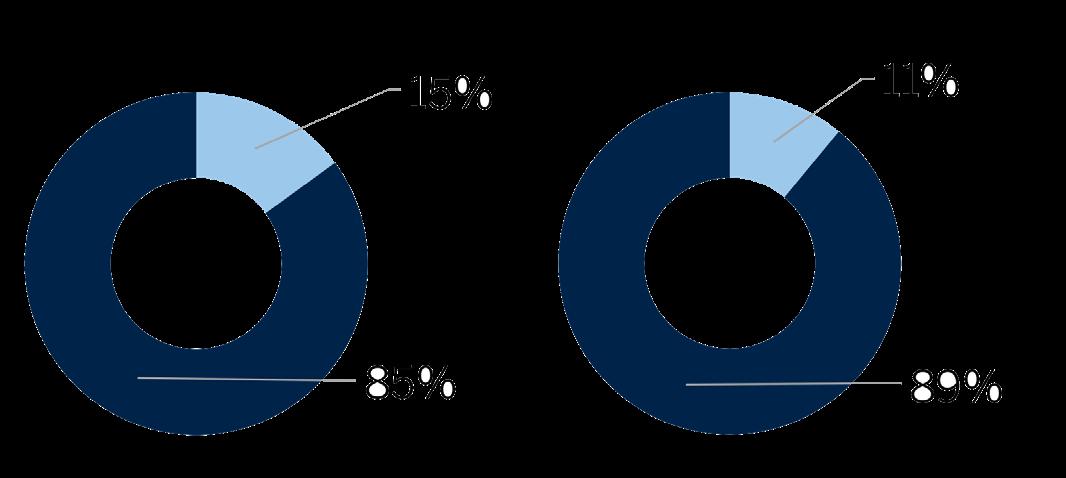
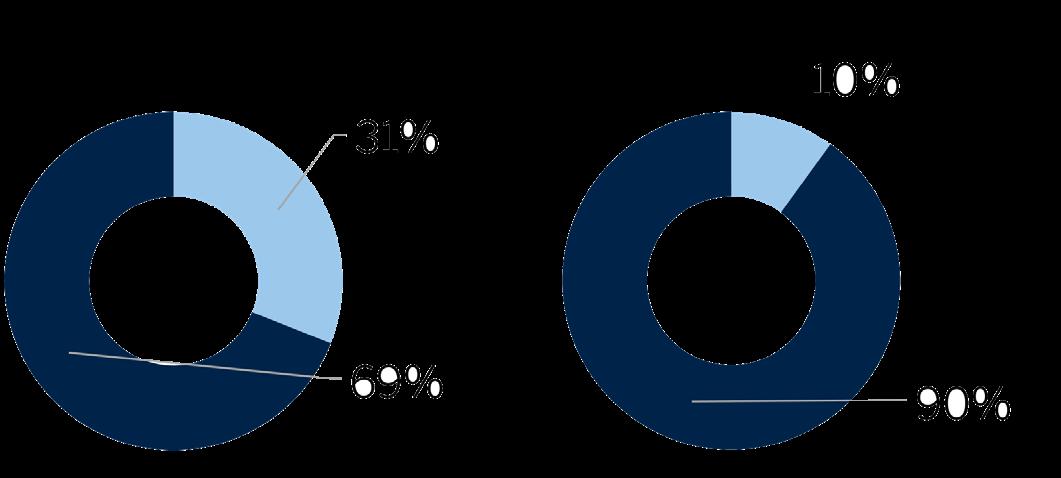
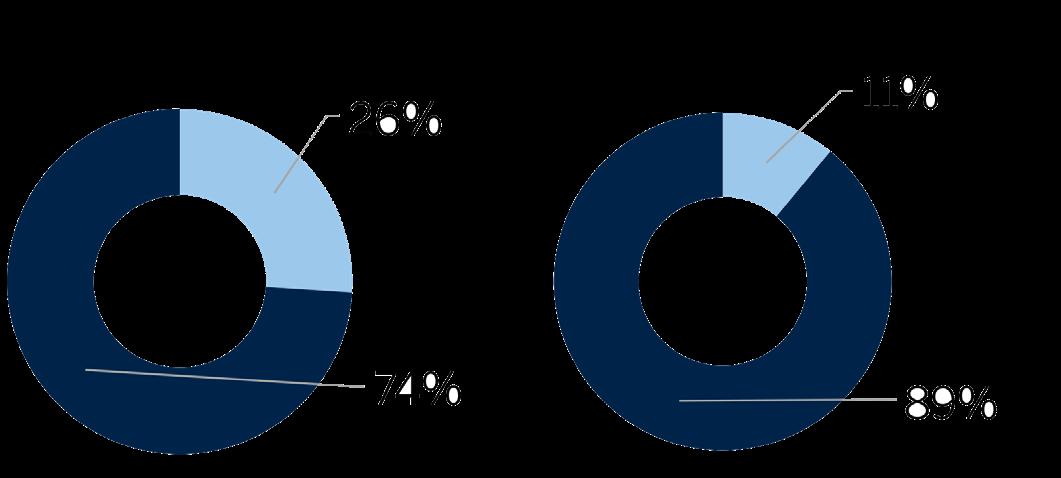
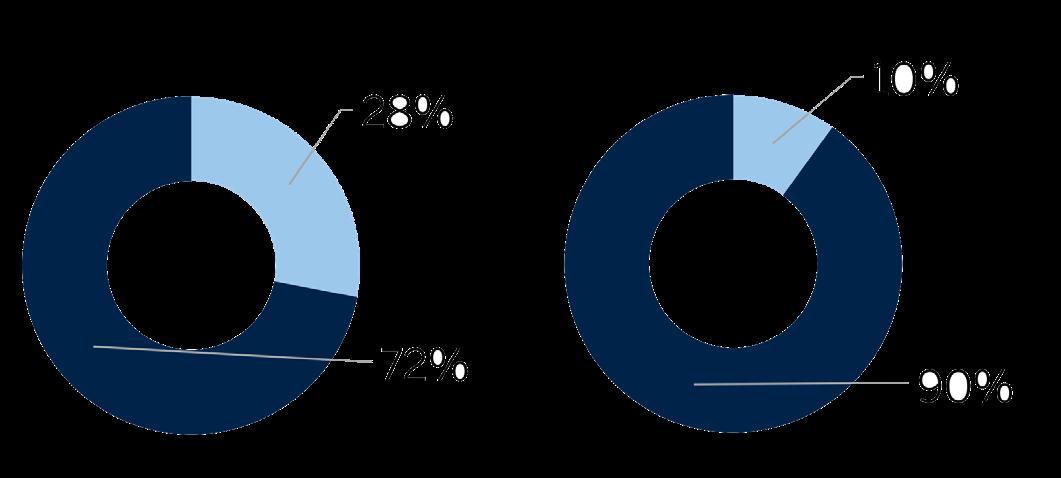
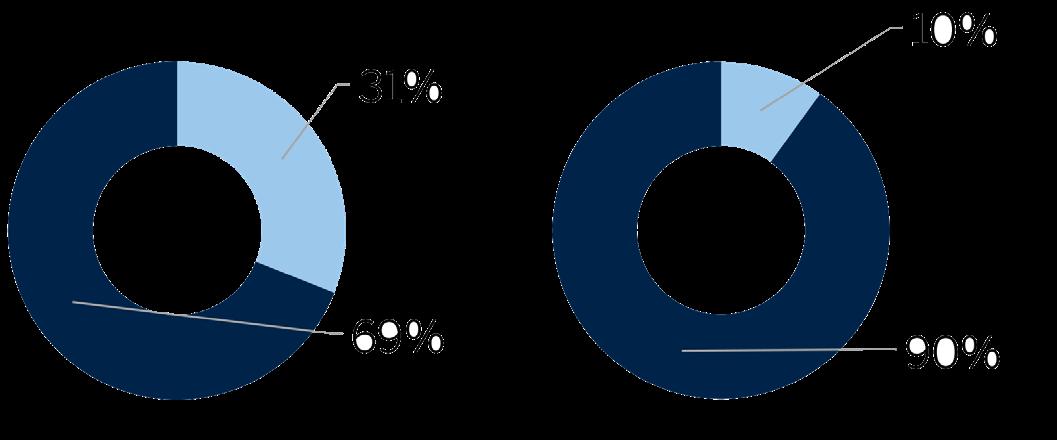
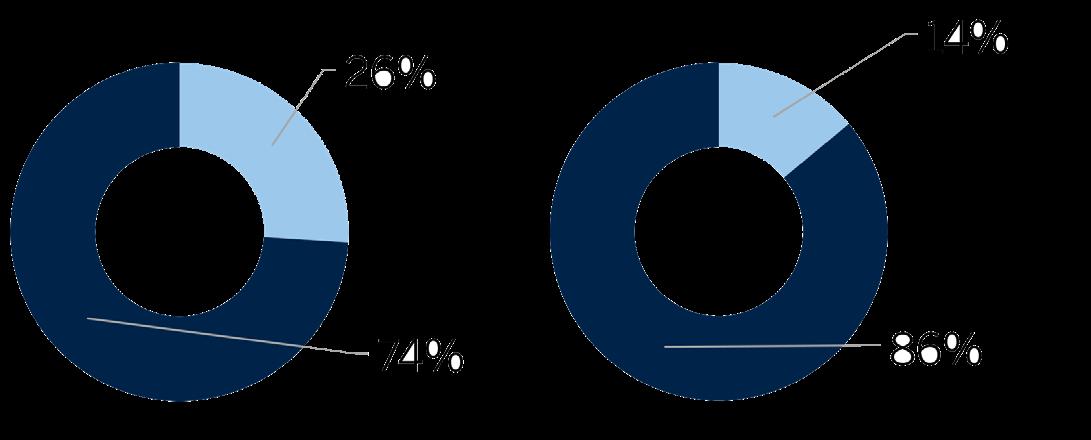
↑ 1% ↑ 3% ↑ 4% 0% ↑ 13% ↓ 24% ↓ 8% ↓ 12% ↓ 23% 0% ↓ 2% DEC 2021 DEC 2022 SINGLE- FAMILY HOMES CONDOMINIUMS
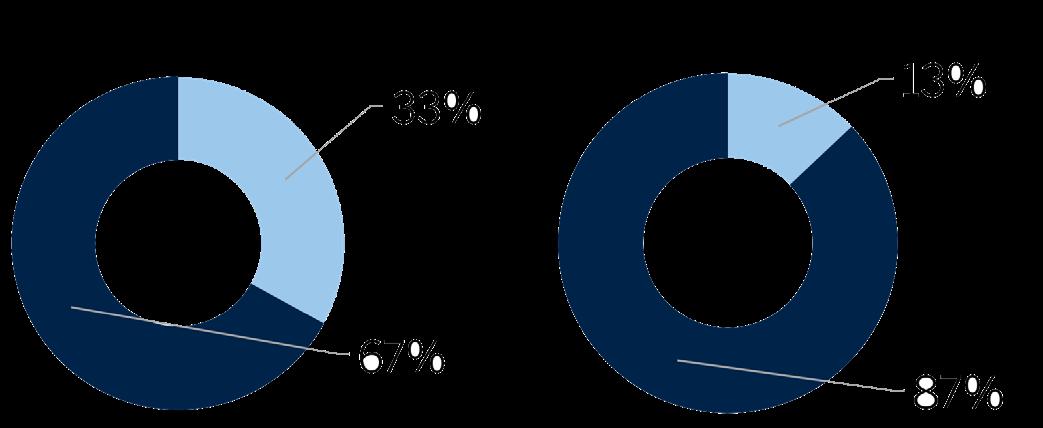
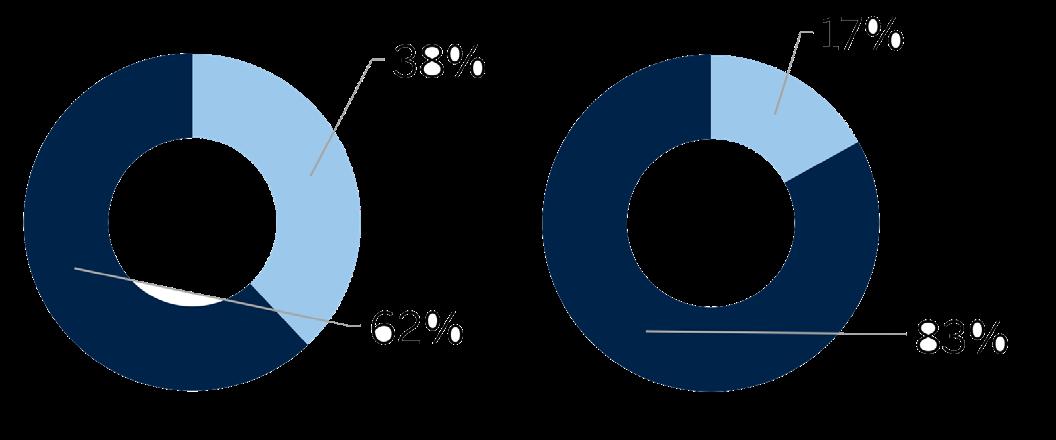
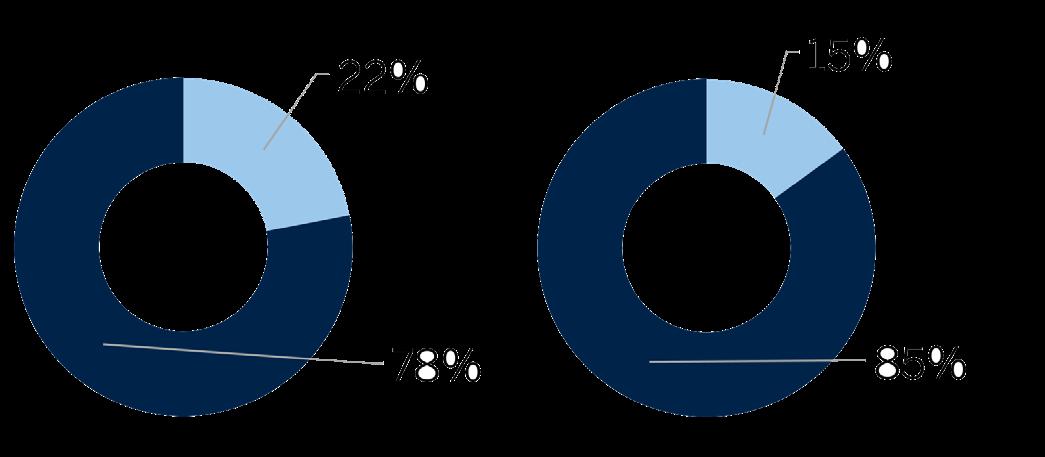
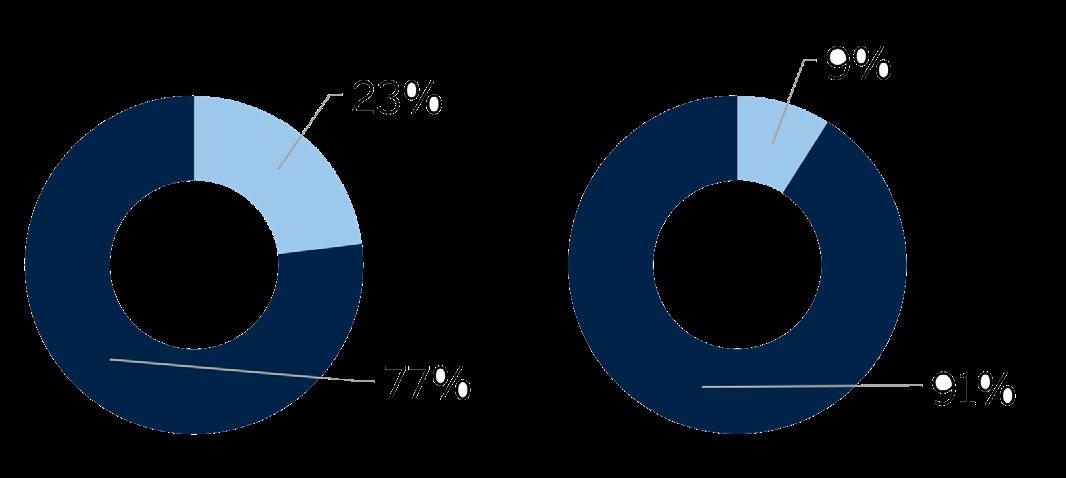
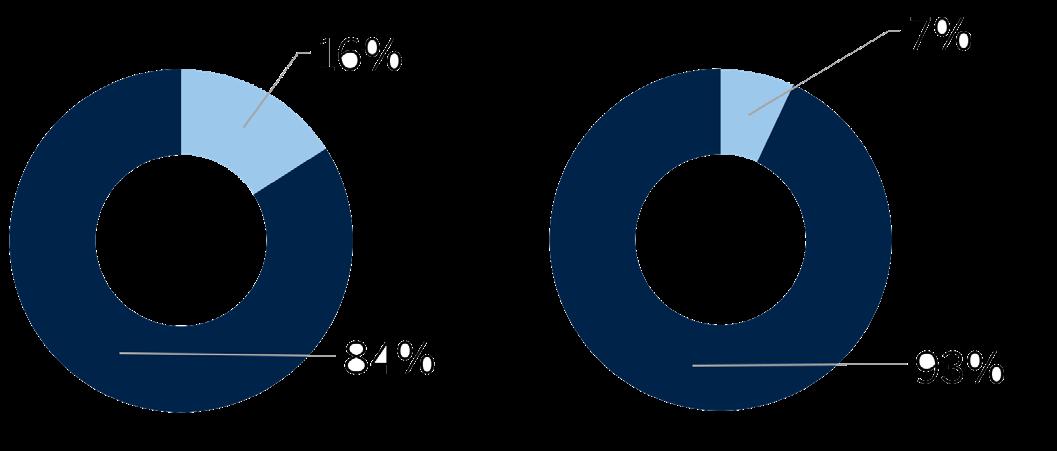
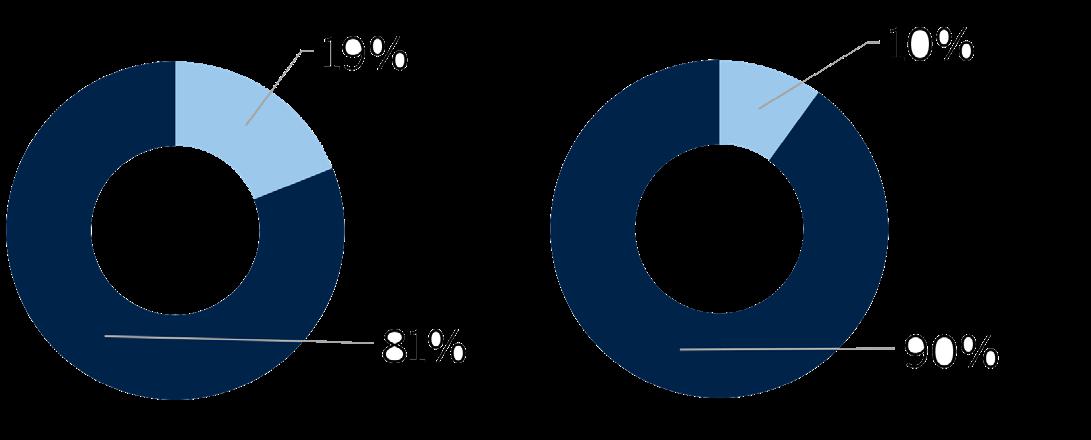
FLORIDA’S EAST COAST ABOVE LISTING PRICE AT LISTING PRICE OR LOWER DEC 2021 DEC 2022
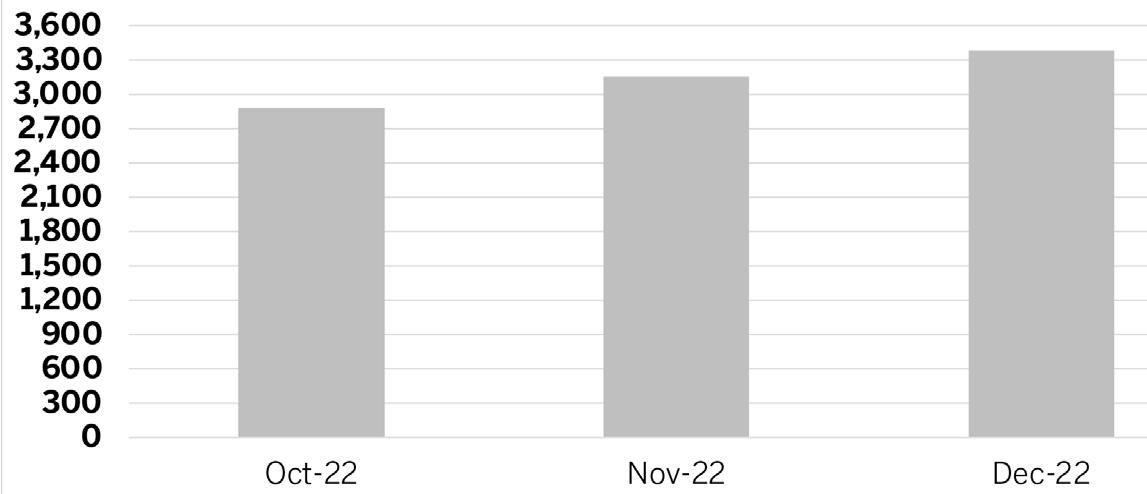
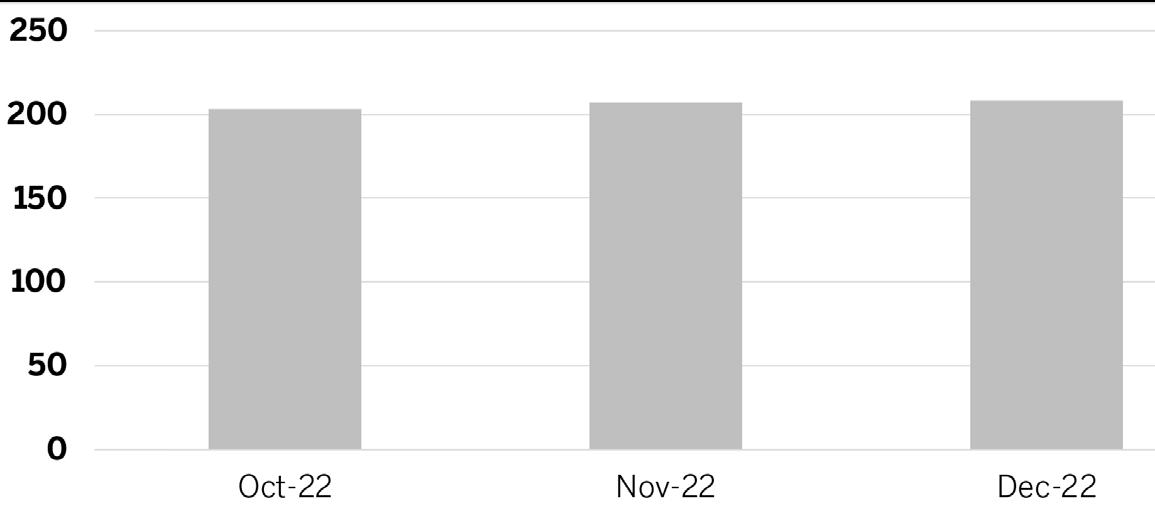
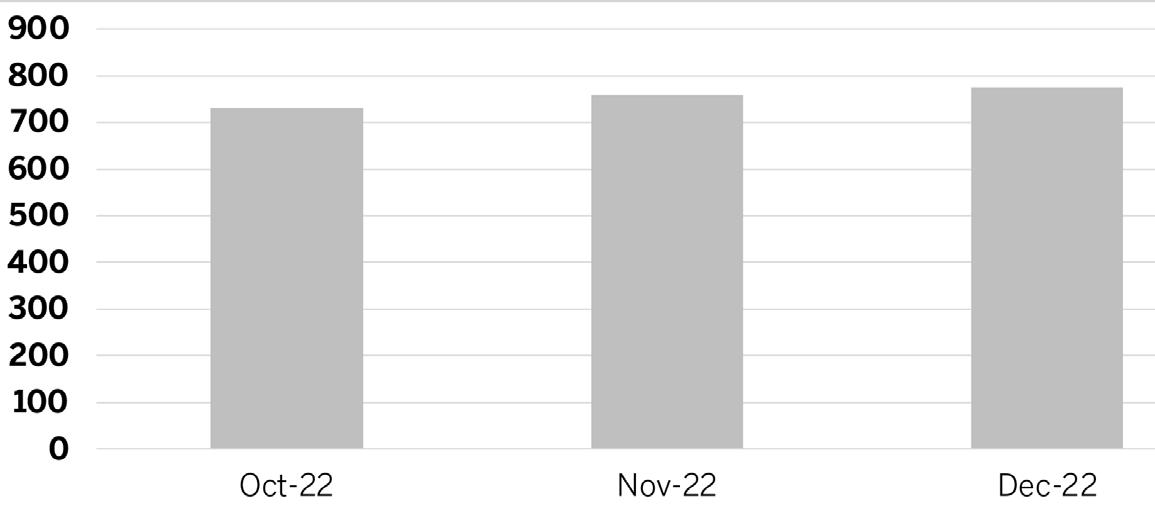
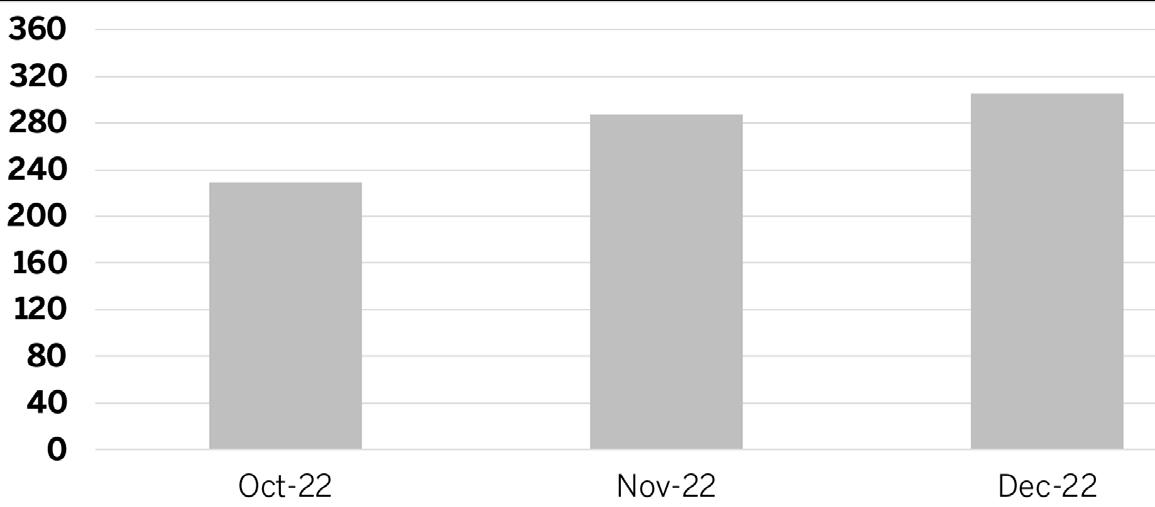
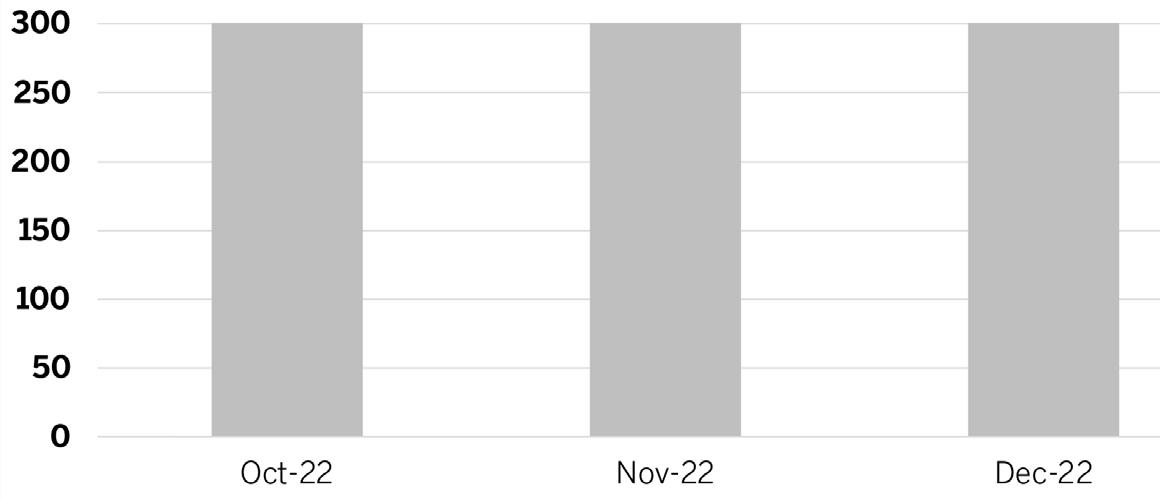
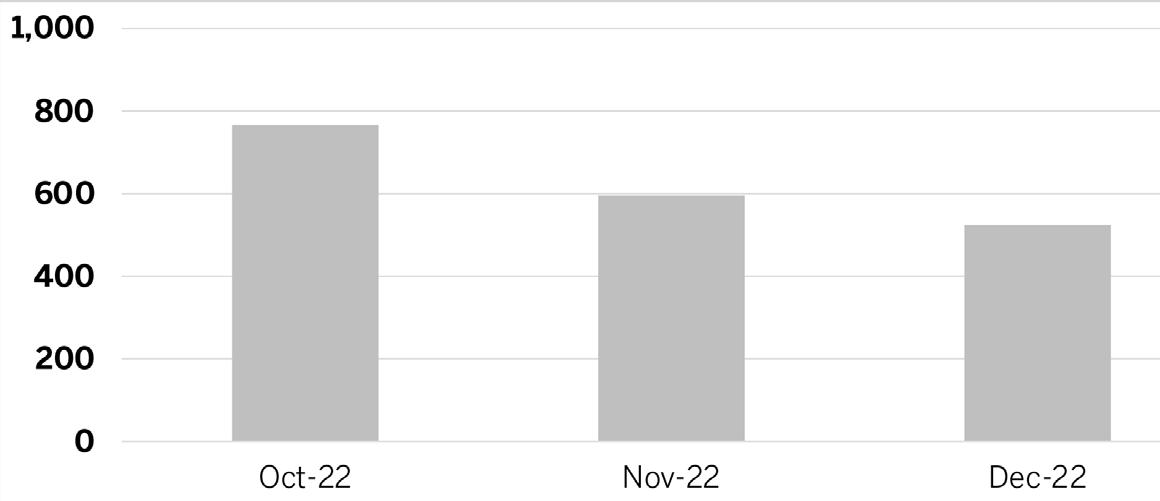
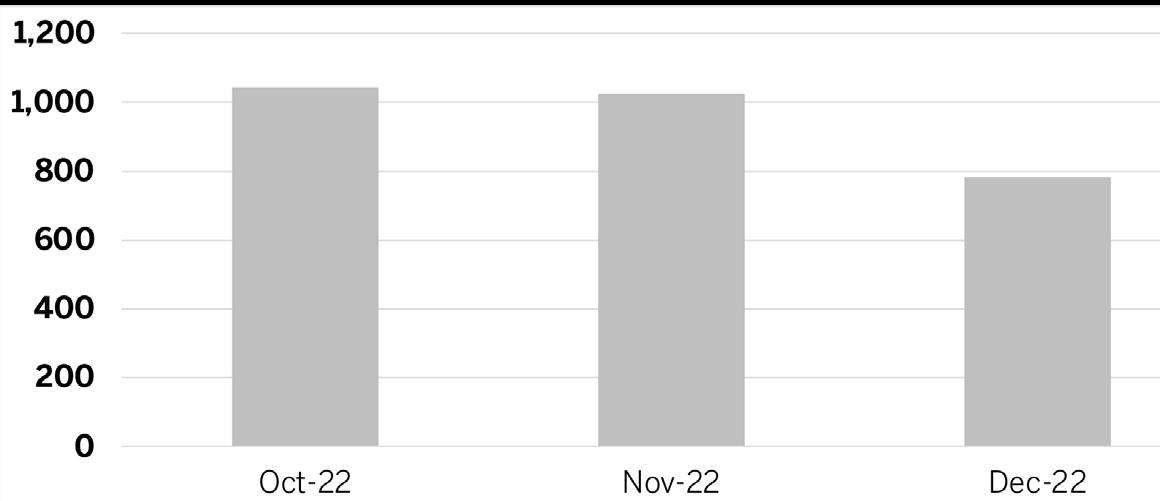
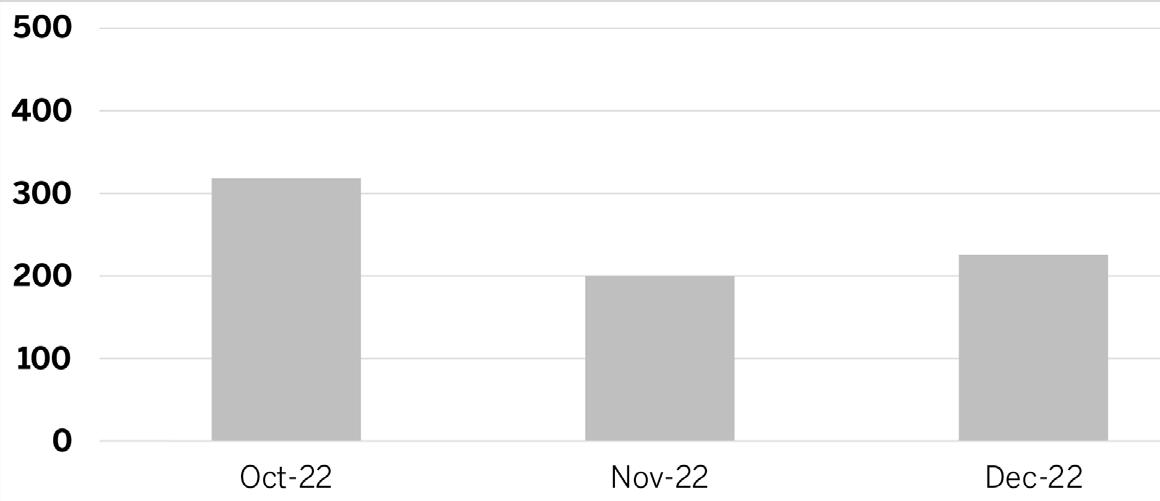
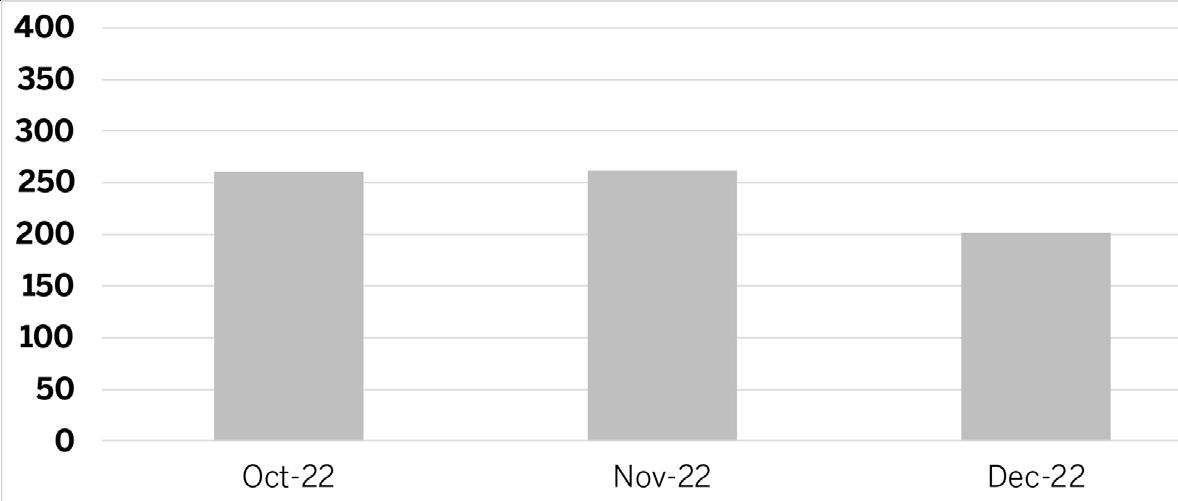
SOLD ABOVE LISTED PRICE
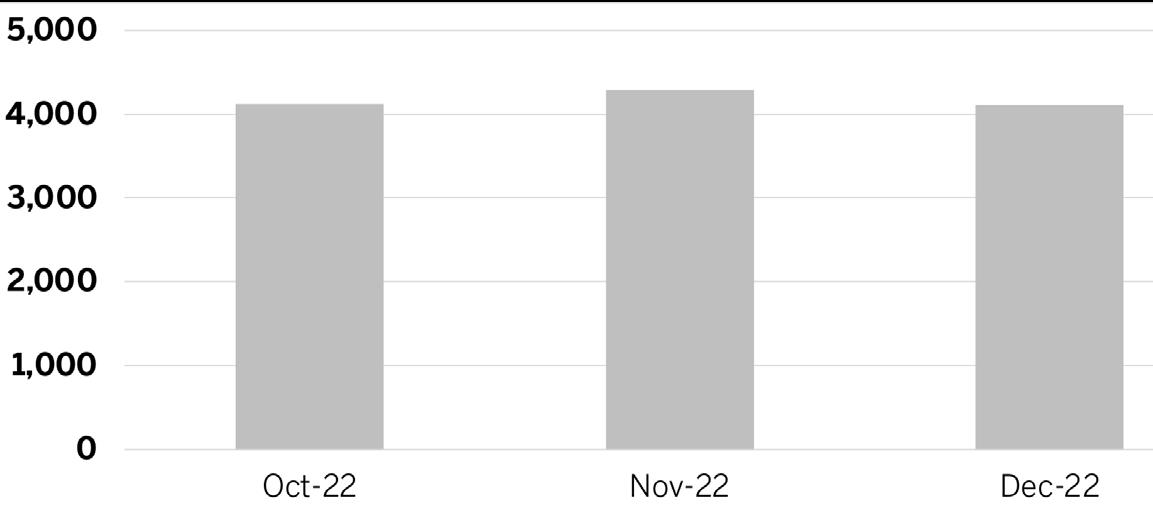
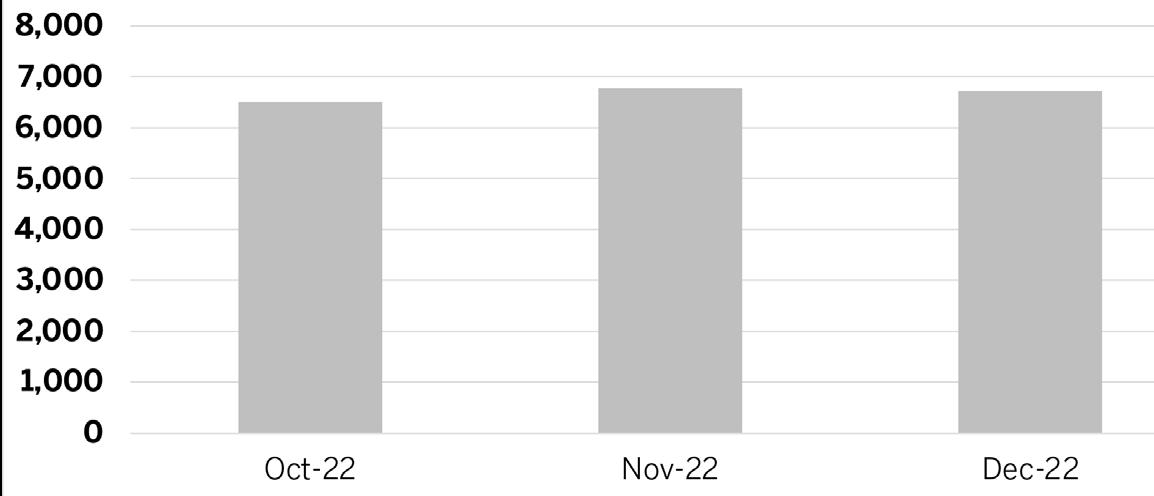
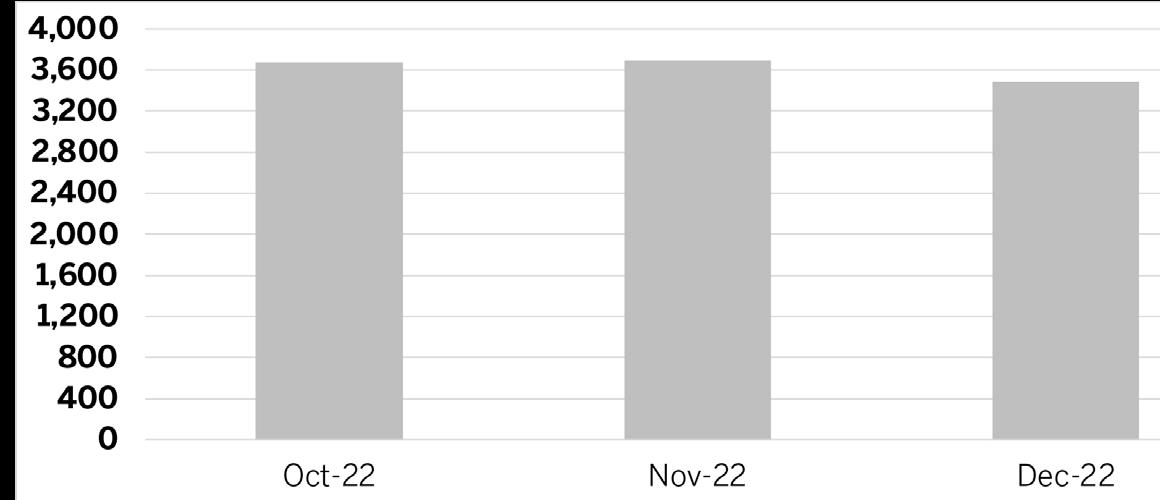
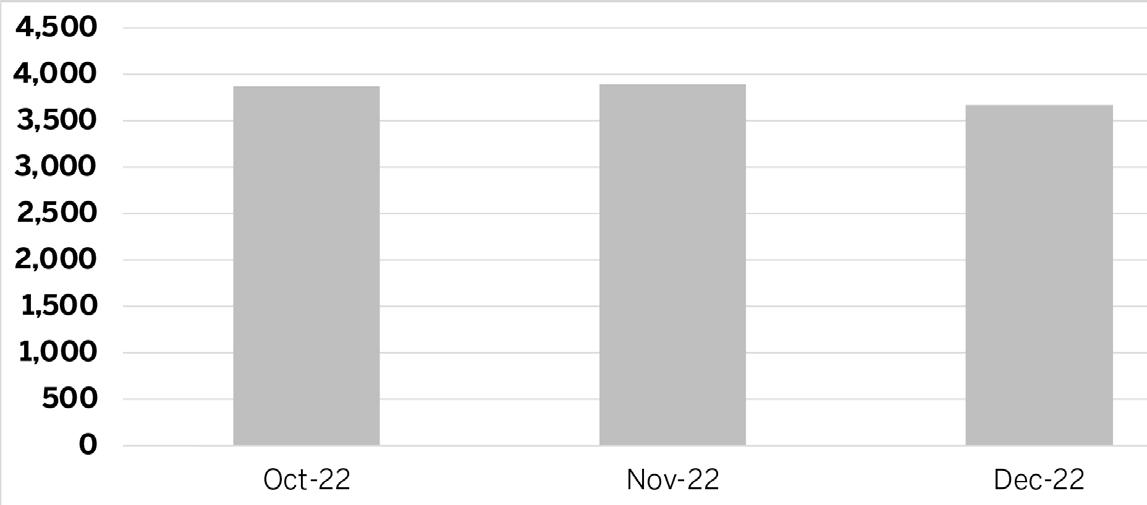
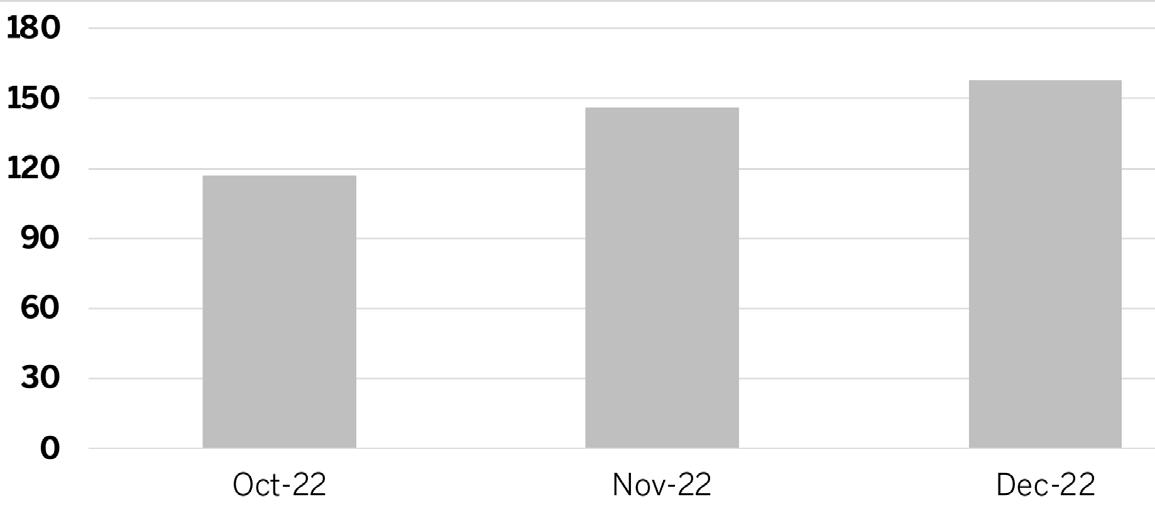
FLORIDA’S EAST COAST SINGLE - FAMILY HOMES AND CONDOMINIUMS Oct 2022 Nov 2022 Dec 2022

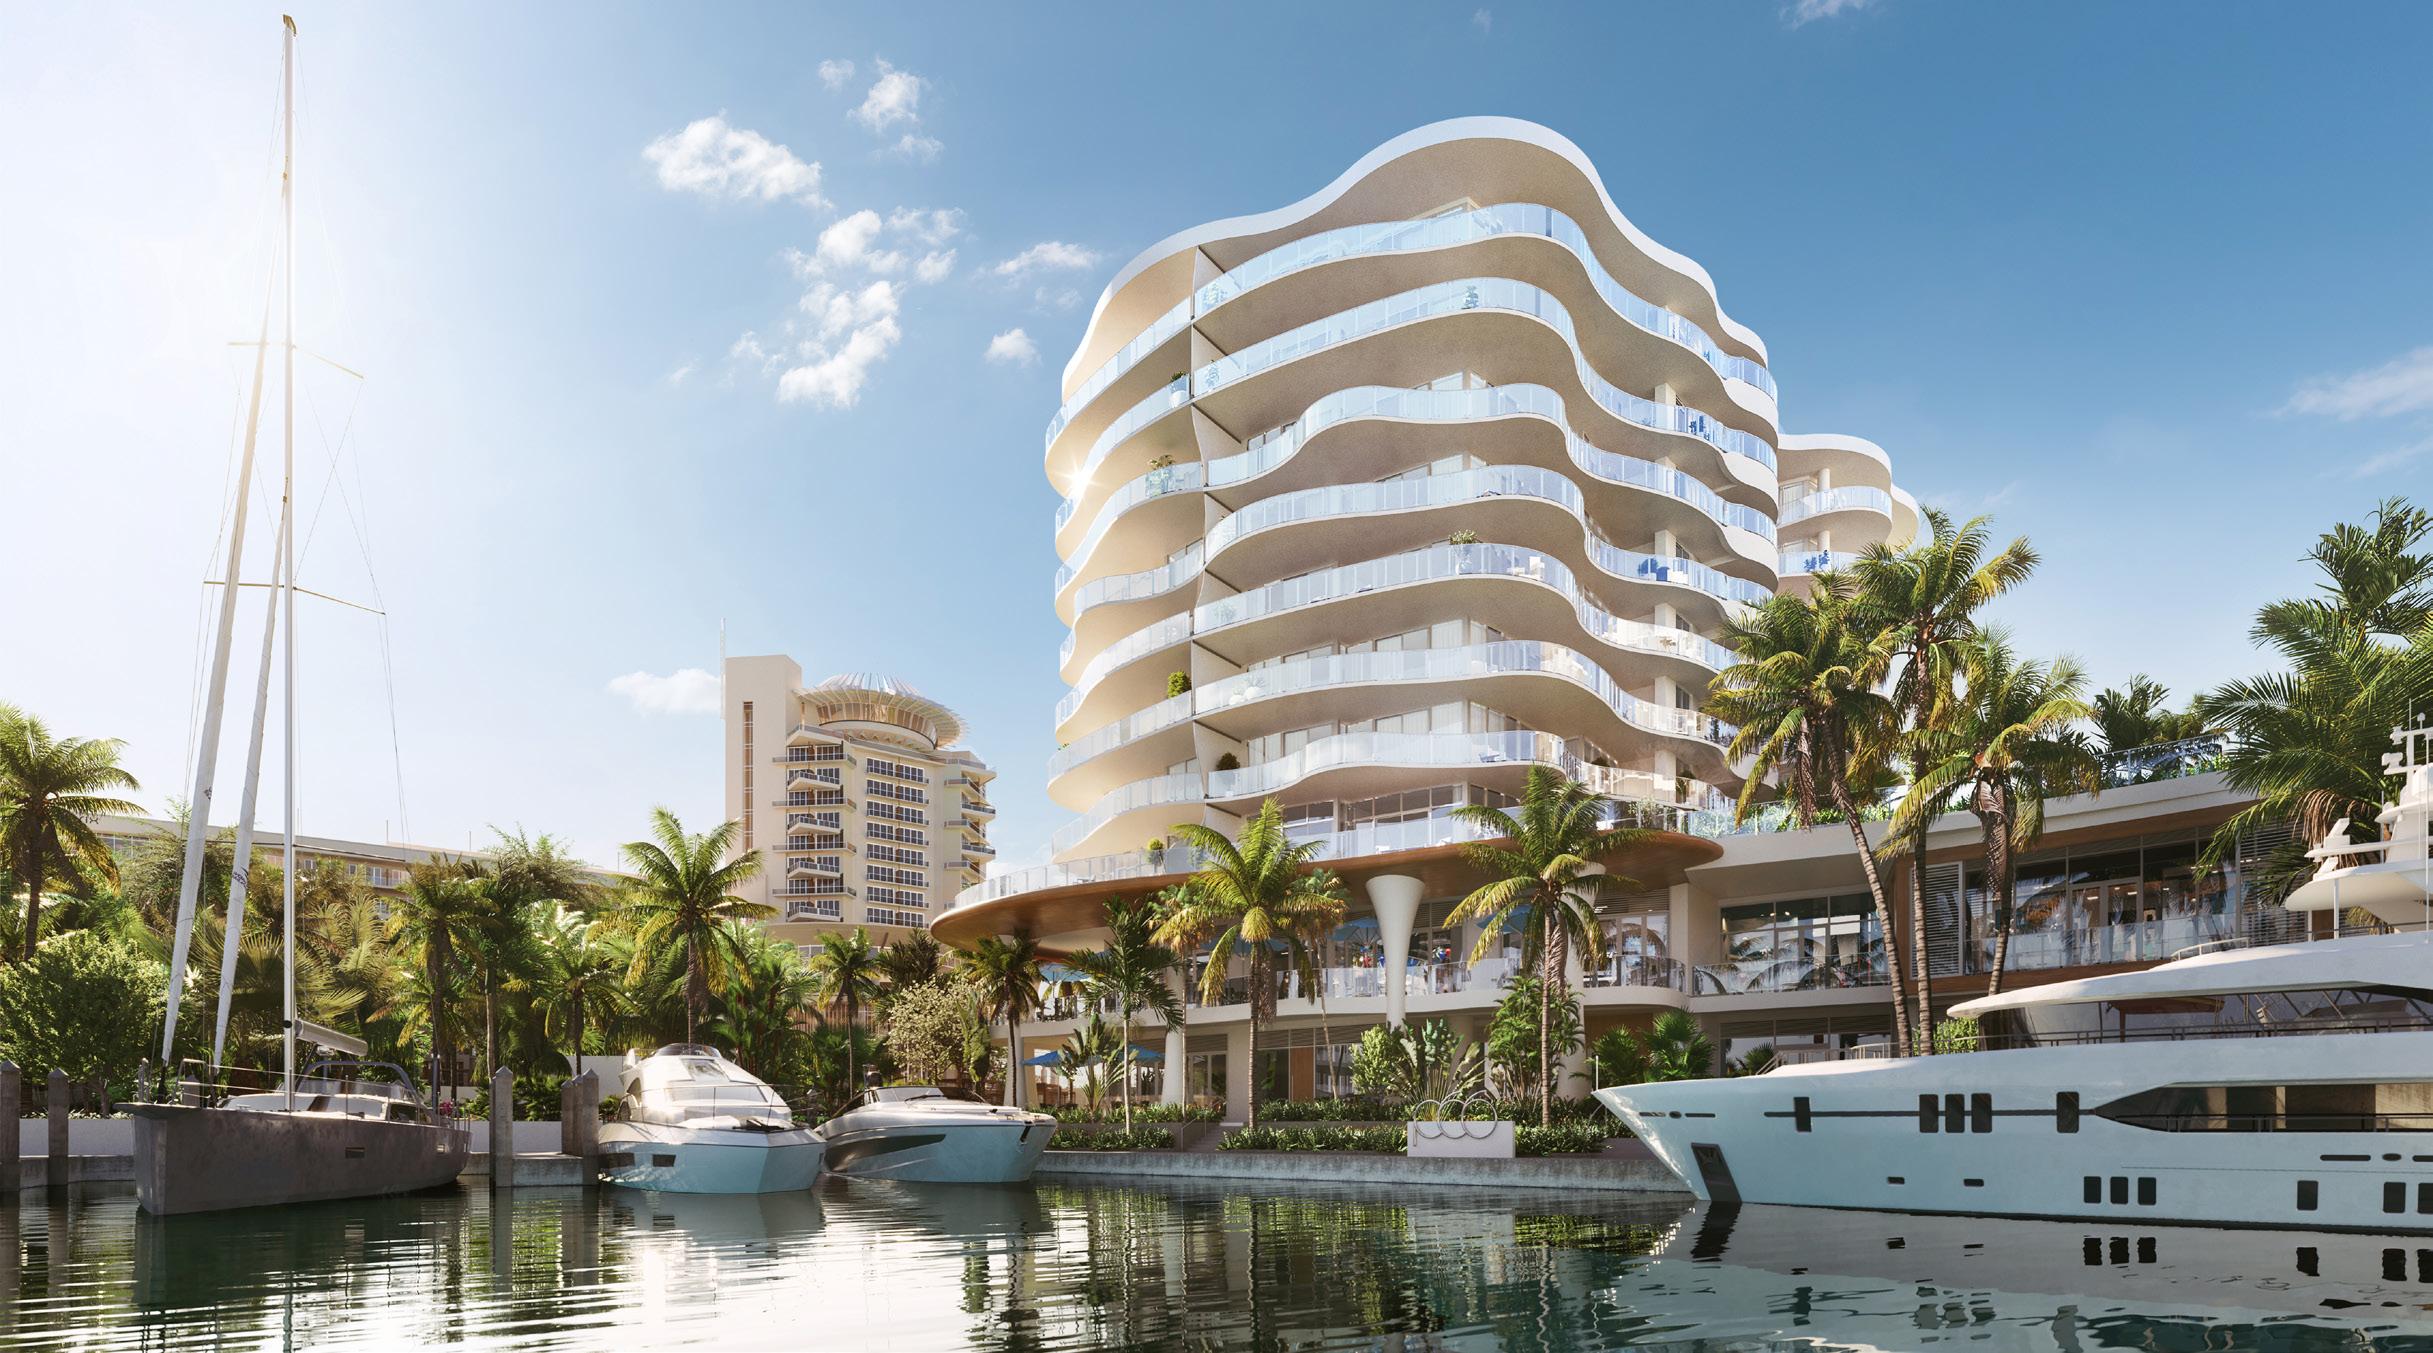
©2022 ONE Sotheby’s International Realty. All rights reserved. Sotheby’s International Realty® and the Sotheby’s International Realty Logo are service marks licensed to Sotheby’s International Realty Affiliates LLC and used with permission. ONE Sotheby’s International Realty fully supports the principles of the Fair Housing Act and the Equal Opportunity Act. Each franchise is independently owned and operated. Any services or products provided by independently owned and operated franchisees are not provided by, affiliated with or related to Sotheby’s International Realty Affiliates LLC or any of its affiliated companies. The information contained herein is deemed accurate but not guaranteed. Oral representations cannot be relied upon as correctly stating the representations of the developer. For correct representations, reference should be made to the documents required by section 718.503, Florida Statutes, to be furnished by a developer to a buyer or lessee. Pricing subject to change without notice. Nestled on 32-acres of intracoastal waterways, The Residences at Pier Sixty-Six will offer a boutique collection of only 92 two- to four-bedroom bespoke condominiums overlooking Fort Lauderdale’s legendary marina and waterways. Own The Waterfront PRICED FROM $3.85M Residences@PierSixtySix.com 754.231.3066 Follow Us on Instagram @PierSixtySixResidences SCHEDULE A PRIVATE PREVIEW
Miami-Dade County
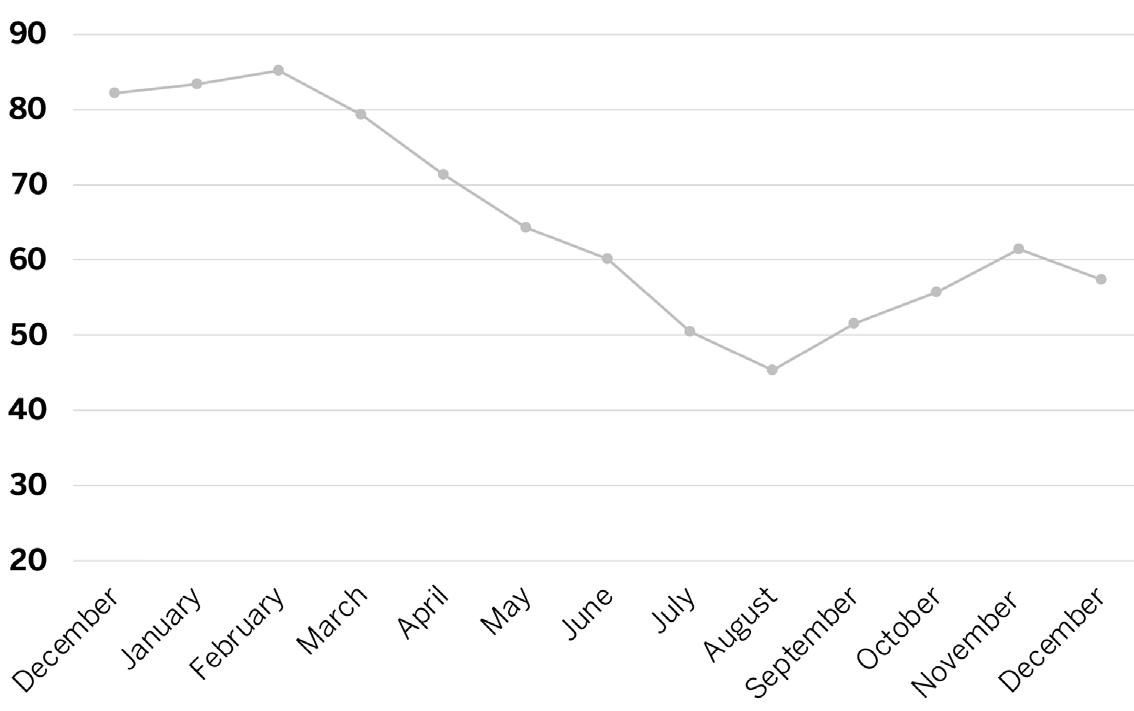
TIGHT MARKET AND FEWER SALES
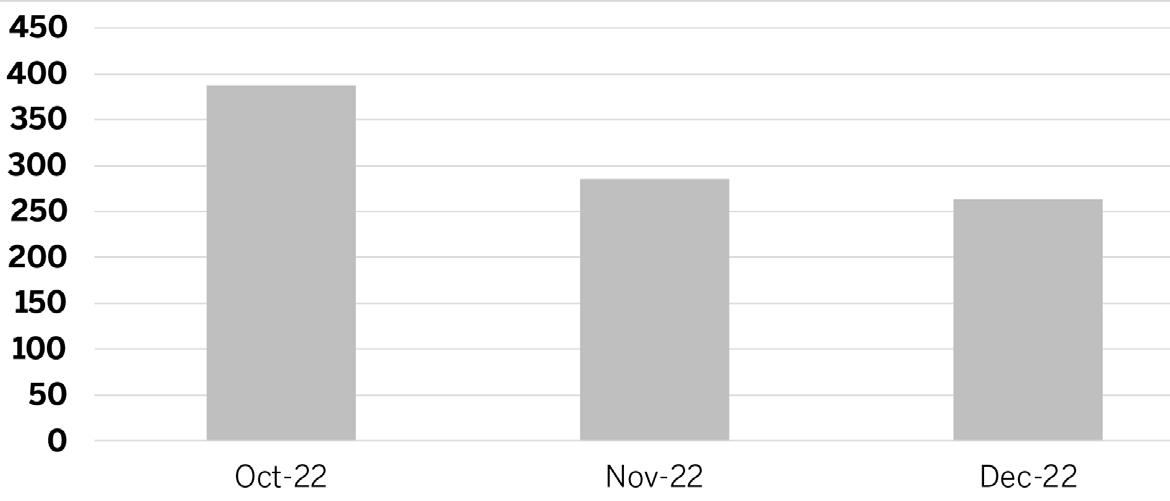
Sales dropped by the second-lowest amount in the region. Though inventory increased, the market remains tight.
AVERAGE SALES PRICE
DAYS ON MARKET
SINGLE-FAMILY HOMES
SINGLE-FAMILY HOMES
Miami-Dade County
SALES BY NEIGHBORHOOD
PRICE RANGE DAYS ON MARKET ABOVE LISTING PRICE AT LISTING PRICE OR LOWER
CLOSED TRANSACTIONS
CLOSED TRANSACTIONS 4% DEC 2021 DEC 2022 ↓
2022 2021 YOY% CHANGE 2022 YOY% CHANGE 2022 YOY% CHANGE 2022 <$500,000 $403,633 $381,185 6% $300 16% 4,608 -38% 36 $500,000-$999,999 $670,580 $680,917 -2% $358 9% 4,776 6% 38 $1MM-$4.99MM $1,989,594 $2,032,730 -2% $692 13% 1,981 -21% 53 >$5MM $10,399,878 $11,110,381 -6% $1,796 7% 240 -31% 115 2022 2021 YOY% CHANGE 2022 YOY% CHANGE 2022 YOY% CHANGE 2022 MIAMI-DADE COUNTY $990,951 $1,003,510 -1% $420 13% 11,605 -22% 41 AVENTURA $2,792,577 $1,466,474 90% $668 50% 26 -60% 71 BAL HARBOUR $24,776,300 $4,883,750 407% $3,431 241% 3 -70% 423 BAY HARBOR ISLANDS $4,535,824 $3,668,065 24% $1,275 57% 17 -45% 70 COCONUT GROVE $1,462,000 $2,955,000 -50.50% $792 -13.90% 10 -67.70% 84 CORAL GABLES $2,810,604 $2,186,848 29% $829 36% 416 -46% 48 FISHER ISLAND N/A N/A N/A N/A N/A - N/A N/A GOLDEN BEACH $9,571,000 $6,427,186 49% $1,852 59% 10 -64% 236 INDIAN CREEK N/A $25,216,667 N/A N/A N/A - N/A N/A KEY BISCAYNE $5,181,788 $4,137,709 25% $1,358 26% 57 -54% 117 MIAMI $756,567 $724,378 4% $378 17% 5,497 -17% 40 MIAMI BEACH $5,470,225 $4,926,000 11% $1,351 27% 240 -55% 80 MIAMI SHORES $1,334,629 $1,056,824 26% $631 34% 153 -33% 35 NORTH BAY VILLAGE $1,836,149 $1,562,626 18% $812 38% 26 -38% 36 PINECREST $2,991,252 $2,166,066 38% $700 40% 195 -47% 52 SOUTH MIAMI $1,479,260 $1,154,829 28% $624 36% 102 -34% 43 SUNNY ISLES BEACH $1,924,091 $2,222,087 -13% $1,036 5% 11 -63% 94 SURFSIDE $2,347,652 $1,420,218 65% $1,036 65% 46 -47% 36
AVG SALES PRICE DAYS ON MARKET
AVAILABLE LISTINGS SOLD ABOVE LISTED PRICE AVG SALES PRICE PRICE PER SF PRICE PER SF
Miami-Dade County
CONDOS SELLING FASTER THAN 2021
The average time on the market for units sold in 2022 fell substantially. During the year, roughly 20% of condos sold for more than the list price.
AVERAGE SALES PRICE
DAYS ON MARKET
CONDOMINIUMS
CONDOMINIUMS
Miami-Dade County
SALES BY NEIGHBORHOOD
CLOSED TRANSACTIONS
AVAILABLE LISTINGS
PRICE RANGE DAYS ON MARKET ABOVE LISTING PRICE AT LISTING PRICE OR LOWER
CLOSED TRANSACTIONS 1% DEC 2021 DEC 2022 ↓
2022 2021 YOY% CHANGE 2022 YOY% CHANGE 2022 YOY% CHANGE 2022 <$500,000 $306,023 $277,961 10% $321 17% 11,698 -26% 54 $500,000-$999,999 $688,832 $696,425 -1% $559 11% 4,084 12% 73 $1MM-$4.99MM $1,874,766 $1,903,364 -2% $941 7% 2,071 -9% 103 >$5MM $8,715,281 $8,832,446 -1% $2,218 6% 229 -12% 178 2022 2021 YOY% CHANGE 2022 YOY% CHANGE 2022 YOY% CHANGE 2022 MIAMI-DADE COUNTY $678,657 $616,706 10% $471 19% 18,082 -18% 66 AVENTURA $642,478 $527,131 22% $368 26% 1,420 -24% 73 BAL HARBOUR $2,449,816 $1,823,639 34% $1,066 27% 169 -31% 145 BAY HARBOR ISLANDS $672,468 $539,960 25% $473 27% 172 -27% 82 BRICKELL/DOWNTOWN MIAMI/EDGEWATER $804,974 $626,135 29% $608 31% 2,236 -21% 79 COCONUT GROVE $1,203,000 $1,162,000 3.50% $823 18.90% 19 -54.80% 61 CORAL GABLES $778,255 $621,984 25% $531 29% 356 -15% 51 FISHER ISLAND $8,640,000 $6,404,549 35% $2,448 43% 5 -83% 31 GOLDEN BEACH N/A N/A N/A N/A N/A - N/A N/A INDIAN CREEK N/A N/A N/A N/A N/A - N/A N/A KEY BISCAYNE $1,814,641 $1,344,266 35% $929 36% 226 -50% 65 MIAMI $462,647 $391,530 18% $380 24% 5,247 -17% 49 MIAMI BEACH $963,433 $1,083,041 -11% $694 7% 2,802 -11% 90 MIAMI SHORES $300,780 $264,691 14% $277 23% 25 -22% 69 NORTH BAY VILLAGE $479,843 $329,042 46% $357 28% 229 -5% 100 PINECREST $484,713 $303,366 60% $348 27% 56 -43% 37 SOUTH MIAMI $362,028 $342,730 6% $358 19% 32 -14% 19 SUNNY ISLES BEACH $1,331,352 $1,064,912 25% $662 24% 1,077 -28% 96 SURFSIDE $2,543,794 $2,068,101 23% $1,021 14% 85 -38% 119
AVG SALES PRICE DAYS ON MARKET
SOLD ABOVE LISTED PRICE AVG SALES PRICE PRICE PER SF PRICE PER SF
Broward County
SALES SLOW MODESTLY
While fewer homes sold in 2022, the decrease was one of the smaller drops in the region. At the same time, competition fell with less homes sold at a premium to the list price.
AVERAGE SALES PRICE
DAYS ON MARKET
SINGLE-FAMILY HOMES
Broward County
SALES BY NEIGHBORHOOD
PRICE RANGE
SOLD ABOVE LISTED PRICE
AVAILABLE LISTINGS
SINGLE-FAMILY HOMES
ABOVE LISTING PRICE AT LISTING PRICE OR LOWER AVG SALES PRICE PRICE PER SF DAYS ON MARKET CLOSED TRANSACTIONS 6% DEC 2021 ↓ DEC 2022
2022 2021 YOY% CHANGE 2022 YOY% CHANGE 2022 YOY% CHANGE 2022 BROWARD COUNTY $361,515 $297,495 22% $269 25% 16,750 -17% 43 COOPER CITY $402,285 $335,443 20% $285 20% 67 -36% 17 CORAL SPRINGS $247,635 $199,267 24% $208 26% 608 -10% 27 DAVIE $286,066 $240,134 19% $221 23% 497 -30% 25 DEERFIELD BEACH $229,862 $194,074 18% $195 24% 1,161 -7% 32 FORT LAUDERDALE $777,857 $557,541 40% $471 38% 2,390 -26% 69 HALLANDALE $376,174 $305,059 23% $314 24% 1,214 -18% 63 HILLSBORO BEACH $794,835 $628,071 27% $482 35% 91 -41% 60 HOLLYWOOD $453,443 $373,261 21% $364 31% 1,423 -15% 60 LAUDERDALE-BY-THE-SEA $790,774 $631,400 25% $454 22% 203 -25% 44 LIGHTHOUSE POINT $230,089 $236,831 -3% $194 14% 120 -8% 26 MIRAMAR $330,073 $278,420 19% $257 23% 390 -20% 26 PARKLAND $537,921 $415,957 29% $313 32% 53 -37% 24 PEMBROKE PINES $268,323 $222,962 20% $220 22% 1,177 -14% 31 PLANTATION $262,314 $222,110 18% $205 17% 460 -28% 33 POMPANO BEACH $354,864 $294,853 20% $277 23% 1,397 -28% 31 SOUTHWEST RANCHES N/A N/A N/A N/A N/A - N/A N/A SUNRISE $218,362 $177,356 23% $188 27% 988 -5% 38 WESTON $369,064 $299,413 23% $274 22% 249 -31% 29 WILTON MANORS $398,659 $317,985 25% $304 24% 162 -16% 32 2022 2021 YOY% CHANGE 2022 YOY% CHANGE 2022 YOY% CHANGE 2022 <$500,000 $388,214 $367,513 6% $287 17% 5,559 -42% 32 $500,000-$999,999 $686,397 $671,390 2% $336 16% 5,918 -2% 27 $1MM-$2.99MM $1,553,991 $1,547,193 0% $521 14% 1,735 4% 42 >$3MM $5,774,785 $5,880,754 -2% $971 7% 262 -10% 98 AVG SALES PRICE DAYS ON MARKET
PRICE PER SF CLOSED TRANSACTIONS
Broward County
HIGHEST NUMBER OF TRANSACTIONS IN DECEMBER
While annual sales slowed in 2022, Broward County had the most condominium sales in the region for the month of December. The number of sales priced above $3 million more than doubled in 2022.

AVERAGE SALES PRICE
DAYS ON MARKET
CONDOMINIUMS
Broward County
SALES BY NEIGHBORHOOD
PRICE RANGE
AVAILABLE
ABOVE LISTING PRICE AT LISTING PRICE OR LOWER
LISTINGS SOLD ABOVE LISTED PRICE
↑4% DEC 2021 DEC 2022 CONDOMINIUMS
AVG SALES PRICE PRICE PER SF DAYS ON MARKET CLOSED TRANSACTIONS 2022 2021 YOY% CHANGE 2022 YOY% CHANGE 2022 YOY% CHANGE 2022 BROWARD COUNTY $361,515 $297,495 22% $269 25% 16,750 -17% 43 COOPER CITY $402,285 $335,443 20% $285 20% 67 -36% 17 CORAL SPRINGS $247,635 $199,267 24% $208 26% 608 -10% 27 DAVIE $286,066 $240,134 19% $221 23% 497 -30% 25 DEERFIELD BEACH $229,862 $194,074 18% $195 24% 1,161 -7% 32 FORT LAUDERDALE $777,857 $557,541 40% $471 38% 2,390 -26% 69 HALLANDALE $376,174 $305,059 23% $314 24% 1,214 -18% 63 HILLSBORO BEACH $794,835 $628,071 27% $482 35% 91 -41% 60 HOLLYWOOD $453,443 $373,261 21% $364 31% 1,423 -15% 60 LAUDERDALE-BY-THE-SEA $790,774 $631,400 25% $454 22% 203 -25% 44 LIGHTHOUSE POINT $230,089 $236,831 -3% $194 14% 120 -8% 26 MIRAMAR $330,073 $278,420 19% $257 23% 390 -20% 26 PARKLAND $537,921 $415,957 29% $313 32% 53 -37% 24 PEMBROKE PINES $268,323 $222,962 20% $220 22% 1,177 -14% 31 PLANTATION $262,314 $222,110 18% $205 17% 460 -28% 33 POMPANO BEACH $354,864 $294,853 20% $277 23% 1,397 -28% 31 SOUTHWEST RANCHES N/A N/A N/A N/A N/A - N/A N/A SUNRISE $218,362 $177,356 23% $188 27% 988 -5% 38 WESTON $369,064 $299,413 23% $274 22% 249 -31% 29 WILTON MANORS $398,659 $317,985 25% $304 24% 162 -16% 32 2022 2021 YOY% CHANGE 2022 YOY% CHANGE 2022 YOY% CHANGE 2022 <$500,000 $241,479 $217,652 11% $219 17% 14,355 -21% 37 $500,000-$999,999 $666,212 $676,609 -2% $453 13% 1,729 16% 56 $1MM-$2.99MM $1,636,357 $1,528,921 7% $729 21% 551 -5% 107 >$3MM $4,655,825 $3,906,832 19% $1,660 68% 115 150% 305 AVG SALES PRICE DAYS ON MARKET
PRICE PER SF CLOSED TRANSACTIONS
Palm Beach County
PRICE LEADER
The median price increase led the southeast Florida region, reaching 21% in 2022. Sales activity in the $1 million to $5 million range were on par with the previous year.
AVERAGE SALES PRICE
DAYS ON MARKET
SINGLE-FAMILY HOMES
Palm Beach County
SALES BY NEIGHBORHOOD
PRICE RANGE
AVAILABLE
ABOVE LISTING PRICE AT LISTING PRICE OR LOWER 6% DEC 2021 DEC 2022 ↓
LISTINGS SOLD ABOVE LISTED PRICE
AVG SALES PRICE PRICE PER SF DAYS ON MARKET CLOSED TRANSACTIONS 2022 2021 YOY% CHANGE 2022 YOY% CHANGE 2022 YOY% CHANGE 2022 PALM BEACH COUNTY $1,039,418 $975,927 7% $383 22% 12,839 -27% 33 BOCA RATON $1,268,418 $1,154,664 10% $423 24% 2,003 -31% 32 BOYNTON BEACH $580,561 $480,170 21% $281 26% 1,922 -10% 26 DELRAY BEACH $1,147,650 $1,123,671 2% $422 25% 1,144 -27% 34 HIGHLAND BEACH $15,325,455 $9,378,513 63% $1,628 29% 11 -50% 75 JUNO BEACH $2,367,250 $1,485,214 59% $781 45% 12 -57% 46 JUPITER $1,376,586 $1,233,962 12% $499 28% 812 -27% 32 JUPITER INLET COLONY $8,786,500 $3,641,562 141% $1,902 58% 6 -14% 63 LAKE PARK $420,475 $347,821 21% $269 30% 48 -16% 34 LAKE WORTH $571,712 $465,574 23% $270 23% 1,229 -28% 30 LANTANA $901,948 $836,341 8% $358 10% 109 -22% 40 NORTH PALM BEACH $2,134,384 $2,643,112 -19% $601 7% 120 -39% 38 MANALAPAN $8,303,571 $1,150,000 -59% $1,764 4% 7 -63% $90 PALM BEACH $15,407,038 $11,981,074 29% $3,366 55% 71 -51% 74 PALM BEACH GARDENS $1,356,055 $1,149,957 18% $439 30% 815 -36% 35 SINGER ISLAND $2,859,615 $1,460,787 96% $940 75% 13 -61% 17 TEQUESTA $1,716,623 $1,462,469 17% $606 19% 63 -26% 33 WELLINGTON $1,244,670 $1,058,062 18% $405 27% 754 -33% 46 WEST PALM BEACH $750,552 $616,391 22% $342 26% 1,634 -28% 36 2022 2021 YOY% CHANGE 2022 YOY% CHANGE 2022 YOY% CHANGE 2022 <$500,000 $386,699 $366,542 5% $246 16% 4,331 -49% 31 $500,000-$999,999 $691,813 $678,402 2% $326 17% 5,805 -3% 28 $1MM-$4.99MM $1,917,032 $1,993,337 -4% $581 11% 2,430 -4% 42 >$5MM $10,974,136 $11,444,902 -4% $1,986 25% 273 -35% 88 AVG SALES PRICE DAYS ON MARKET
PRICE PER SF CLOSED TRANSACTIONS SINGLE-FAMILY HOMES
Palm Beach County
HIGH-PRICED CONDOS PACE COUNTY
Sales of condos priced greater than $5 million increased in the last year while overall sales were lower. The average price per square foot in the upper-price tier increased by nearly 20%.
AVERAGE SALES PRICE
DAYS ON MARKET
CONDOMINIUMS
Palm Beach County
SALES BY NEIGHBORHOOD
PRICE RANGE
AVAILABLE
ABOVE LISTING PRICE AT LISTING PRICE OR LOWER 7% DEC 2021 DEC 2022 ↓
LISTINGS SOLD ABOVE LISTED PRICE
AVG SALES PRICE PRICE PER SF DAYS ON MARKET CLOSED TRANSACTIONS 2022 2021 YOY% CHANGE 2022 YOY% CHANGE 2022 YOY% CHANGE 2022 PALM BEACH COUNTY $463,267 $402,321 15% $254 19% 12,778 -27% 32 BOCA RATON $507,503 $489,092 4% $273 11% 2,293 -32% 37 BOYNTON BEACH $308,843 $224,196 38% $180 33% 1,330 -23% 29 DELRAY BEACH $350,778 $270,734 30% $199 25% 1,948 -23% 29 HIGHLAND BEACH $1,200,741 $939,501 28% $584 29% 201 -38% 45 JUNO BEACH $1,024,869 $675,709 52% $574 58% 86 -48% 27 JUPITER $630,134 $470,765 34% $372 33% 662 -37% 22 JUPITER INLET COLONY N/A N/A N/A N/A N/A - N/A N/A LAKE PARK $266,680 $241,612 10% $165 -3% 66 29% 30 LAKE WORTH $229,500 $180,934 27% $148 25% 717 -18% 31 LANTANA $292,502 $264,408 11% $182 14% 112 -18% 31 NORTH PALM BEACH $602,658 $561,877 7% $288 6% 278 -33% 35 MANALAPAN N/A N/A N/A N/A N/A - N/A N/A PALM BEACH $2,159,913 $1,450,317 49% $923 38% 297 -42% 50 PALM BEACH GARDENS $496,885 $395,712 26% $282 27% 619 -33% 24 SINGER ISLAND $1,165,871 $1,129,171 3% $560 20% 130 -52% 55 TEQUESTA $895,825 $414,723 116% $484 84% 80 -40% 22 WELLINGTON $467,904 $373,985 25% $285 30% 184 -26% 31 WEST PALM BEACH $318,210 $290,515 10% $184 19% 2,182 -26% 32 2022 2021 YOY% CHANGE 2022 YOY% CHANGE 2022 YOY% CHANGE 2022 <$500,000 $256,040 $223,737 14% $165 15% 10,102 -30% 30 $500,000-$999,999 $684,322 $682,862 0% $406 5% 1,769 -8% 32 $1MM-$4.99MM $1,951,369 $1,917,017 2% $865 14% 848 -23% 54 >$5MM $7,928,626 $7,593,153 4% $2,080 19% 59 7% 62 AVG SALES PRICE DAYS ON MARKET
PRICE PER SF CLOSED TRANSACTIONS CONDOMINIUMS
Martin County
MEDIAN PRICE FINISHES THE YEAR STRONG
The median price increased by the secondhighest amount in Southeast Florida even as inventory increased.
AVERAGE SALES PRICE
DAYS ON MARKET
SINGLE-FAMILY HOMES
Martin County
SALES BY NEIGHBORHOOD
PRICE RANGE
SOLD ABOVE LISTED PRICE
AVAILABLE LISTINGS
2022 2021 YOY% CHANGE 2022 YOY% CHANGE 2022 YOY% CHANGE 2022 <$500,000 $397,485 $364,794 9% $263 21% 244 -55% 25 $500,000-$999,999 $699,661 $680,073 3% $312 17% 374 -18% 28 $1MM-$2.99MM $1,518,793 $1,684,681 -10% $491 8% 141 -20% 51 >$3MM $4,869,063 $4,738,707 3% $851 20% 16 -47% 108 2022 2021 YOY% CHANGE 2022 YOY% CHANGE 2022 YOY% CHANGE 2022 MARTIN COUNTY $839,631 $786,654 7% $341 20% 775 -35% 33 HOBE SOUND $615,200 $716,408 -14% $294 10% 76 -45% 22 HUTCHINSON ISLAND $2,887,583 $2,594,831 11% $661 19% 12 -67% 35 JENSEN BEACH $590,658 $513,110 15% $306 21% 107 -36% 23 JUPITER ISLAND $11,949,598 $11,671,500 2% $2,132 40% 15 -57% 63 PALM CITY $842,362 $679,556 24% $327 -40% 524 -34% 29 SEWALL'S POINT $1,883,669 $1,393,033 35% $509 33% 44 -51% 54 STUART $747,713 $714,817 5% $335 19% 250 -35% 33
AVG SALES PRICE DAYS ON MARKET
AVG SALES PRICE PRICE PER SF PRICE PER SF DAYS ON MARKET ABOVE LISTING PRICE AT LISTING PRICE OR LOWER CLOSED TRANSACTIONS CLOSED TRANSACTIONS 0.5% DEC 2021 DEC 2022 ↓ SINGLE-FAMILY HOMES
Martin County
INVENTORY COMES TO MARKET
Inventory increased in 2022, providing potential buyers with more opportunities than in 2021 when the year ended with just 20 units available.
AVERAGE SALES PRICE
DAYS ON MARKET
CONDOMINIUMS
CONDOMINIUMS
Martin County
SALES BY NEIGHBORHOOD
AVAILABLE LISTINGS
CLOSED TRANSACTIONS
PRICE RANGE DAYS ON MARKET ABOVE LISTING PRICE AT LISTING PRICE OR LOWER
CLOSED TRANSACTIONS 8% DEC 2021 DEC 2022 ↓
2022 2021 YOY% CHANGE 2022 YOY% CHANGE 2022 YOY% CHANGE 2022 <$500,000 $279,915 $225,763 24% $235 29% 458 -33% 26 $500,000-$999,999 $660,934 $654,355 1% $438 16% 60 50% 27 $1MM-$2.99MM $1,441,071 $1,743,153 -17% $640 3% 14 -65% 42 >$3MM $3,100,000 N/A N/A $1,015 N/A 1 N/A 5 2022 2021 YOY% CHANGE 2022 YOY% CHANGE 2022 YOY% CHANGE 2022 MARTIN COUNTY $358,597 $327,647 9% $270 25% 533 -30% 26 HOBE SOUND $308,891 $274,857 12% $219 26% 32 -52% 15 HUTCHINSON ISLAND $657,207 $632,507 4% $456 26% 98 -24% 30 JENSEN BEACH $346,538 $240,268 44% $245 36% 66 50% 30 PALM CITY $294,665 $212,469 39% $182 63% 47 -37% 27 STUART $274,063 $266,780 3% $227 19% 292 -38% 27
AVG SALES PRICE DAYS ON MARKET
SOLD ABOVE LISTED PRICE AVG SALES PRICE PRICE PER SF PRICE PER SF
Indian River County
BUYER COMPETITION PERSISTS
More homes sold above the asking price in 2022, with 28% of homes in Indian River County sold at a premium. Homes priced greater than $3 million sold more quickly than in 2021.
AVERAGE SALES PRICE
DAYS ON MARKET
SINGLE-FAMILY HOMES
Indian River County
SALES BY NEIGHBORHOOD
PRICE RANGE
SOLD ABOVE LISTED PRICE
AVAILABLE LISTINGS
2022 2021 YOY% CHANGE 2022 YOY% CHANGE 2022 YOY% CHANGE 2022 <$300,000 $244,111 $234,827 4% $202 21% 645 -53% 47 $300,000-$999,999 $473,761 $476,326 -1% $240 10% 1,689 -3% 53 $1MM-$2.99MM $1,725,845 $1,688,391 2% $573 20% 198 -18% 72 >$3MM $6,278,972 $5,824,800 8% $1,143 31% 25 -58% 113 2022 2021 YOY% CHANGE 2022 YOY% CHANGE 2022 YOY% CHANGE 2022 INDIAN RIVER COUNTY $569,544 $556,724 2% $265 16% 2,557 -25% 53 BARRIER ISLAND $1,967,841 $1,711,618 15% $595 34% 240 -52% 67 MAINLAND VERO BEACH $358,587 $431,571 20% $230 25% 1,281 -30% 61 SEBASTIAN/FELLSMERE $363,491 $317,279 15% $213 17% 460 -10% 58
AVG SALES PRICE DAYS ON MARKET
AVG SALES PRICE PRICE PER SF PRICE PER SF DAYS ON MARKET ABOVE LISTING PRICE AT LISTING PRICE OR LOWER CLOSED TRANSACTIONS CLOSED TRANSACTIONS 2% DEC 2021 DEC 2022 ↓ SINGLE-FAMILY HOMES
Indian River County
SALES DECREASE
Transactions fell by one-third in 2022, the largest decrease in the region. Despite the decline, pricing remains higher than the previous year.
AVERAGE SALES PRICE
DAYS ON MARKET
CONDOMINIUMS
Indian River County
PRICE RANGE

SOLD ABOVE LISTED PRICE
AVAILABLE LISTINGS
2022 2021 YOY% CHANGE 2022 YOY% CHANGE 2022 YOY% CHANGE 2022 <$300,000 $199,261 $176,270 13% $181 25% 594 -41% 50 $300,000-$999,999 $503,402 $529,580 -5% $324 4% 356 -19% 49 $1MM-$2.99MM $1,664,828 $1,611,031 3% $699 31% 56 -10% 64 >$3MM $3,730,205 $3,350,000 11% $1,607 81% 4 100% 11 2022 2021 YOY% CHANGE 2022 YOY% CHANGE 2022 YOY% CHANGE 2022 INDIAN RIVER COUNTY $401,706 $341,430 18% $264 23% 1,010 -33% 50 BARRIER ISLAND $865,909 $657,577 32% $491 40% 215 -49% 52 MAINLAND VERO BEACH $258,809 $211,086 23% $197 29% 664 -28% 53 SEBASTIAN/FELLSMERE $302,222 $240,204 26% $228 27% 41 -46% 50
AVG SALES PRICE DAYS ON MARKET
SALES BY NEIGHBORHOOD
AVG SALES PRICE PRICE PER SF PRICE PER SF DAYS ON MARKET ABOVE LISTING PRICE AT LISTING PRICE OR LOWER CLOSED TRANSACTIONS CLOSED TRANSACTIONS 6% DEC 2021 DEC 2022 ↓ CONDOMINIUMS
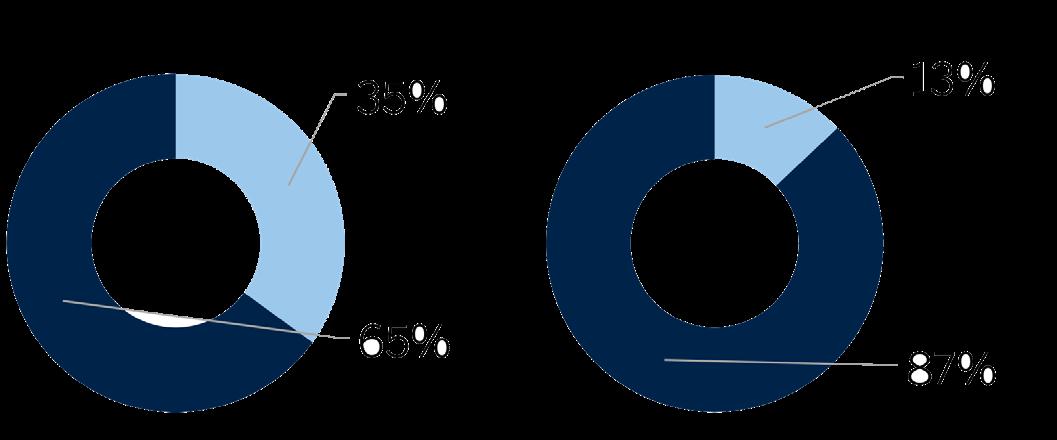
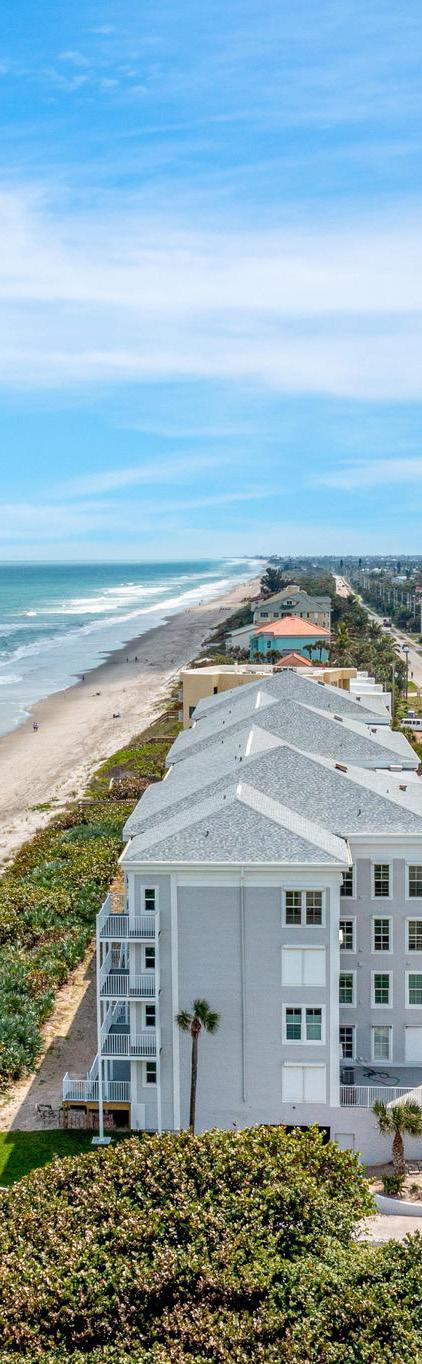
Brevard County
HOMES SELL QUICKLY COMPARED TO REGION
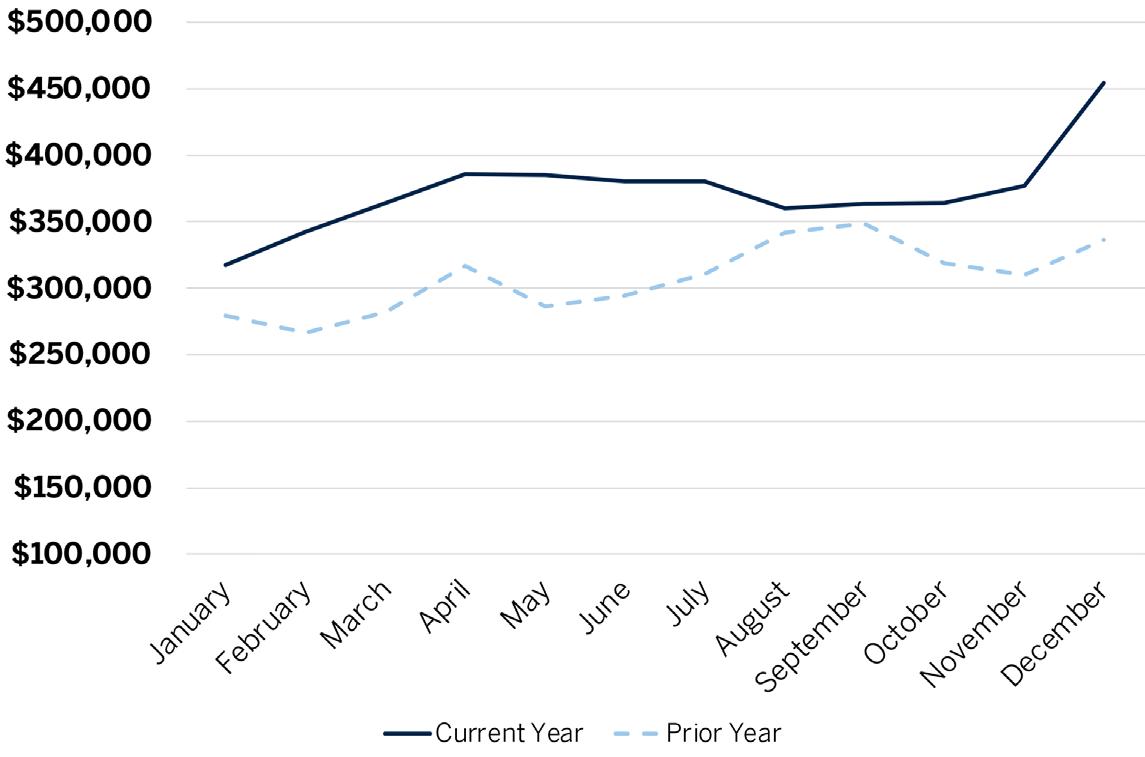
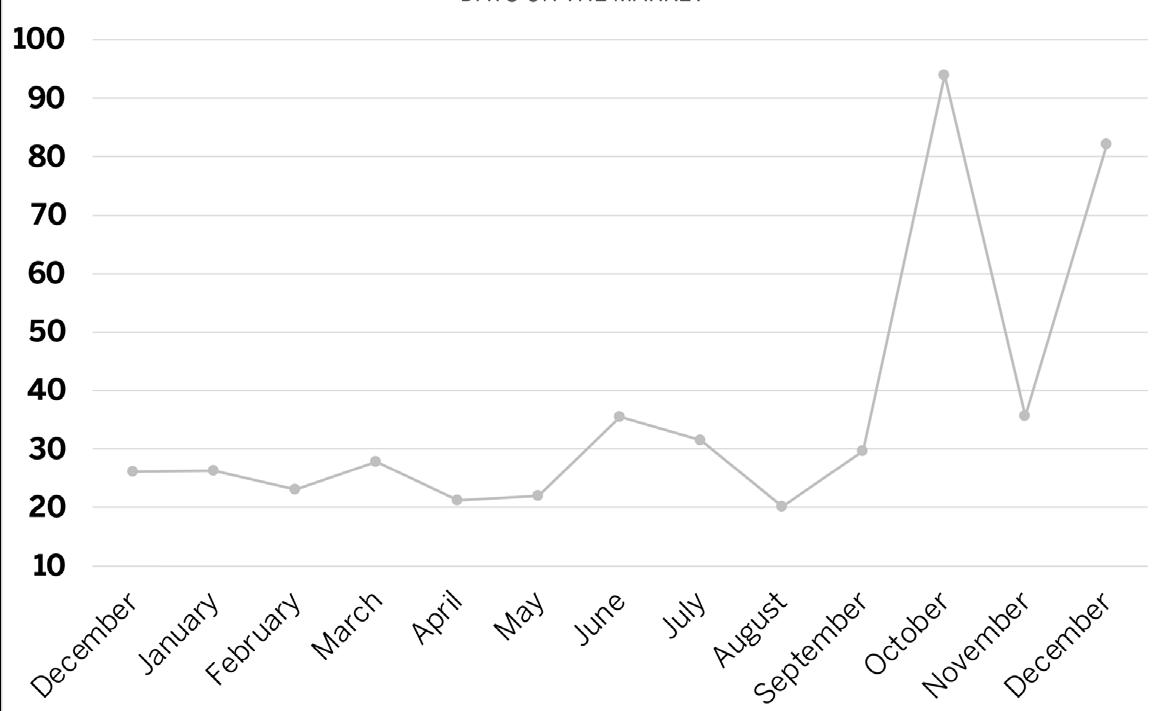
Brevard County led in fewest days it takes to sell a home by the end of 2022, even as the average days on market was 81% higher than in 2021. The median price increased by 16% from the previous year.
AVERAGE SALES PRICE
DAYS ON MARKET
SINGLE-FAMILY
HOMES
Brevard County
SALES BY NEIGHBORHOOD

PRICE RANGE
SOLD ABOVE LISTED PRICE
AVAILABLE LISTINGS
SINGLE-FAMILY HOMES
ABOVE LISTING PRICE AT LISTING PRICE OR LOWER AVG SALES PRICE PRICE PER SF DAYS ON MARKET CLOSED TRANSACTIONS 2% DEC 2021 ↓ DEC 2022
2022 2021 YOY% CHANGE 2022 YOY% CHANGE 2022 YOY% CHANGE 2022 BREVARD COUNTY $433,772 $374,994 16% $226 19% 9,763 -14% 20 COCOA $332,433 $269,442 23% $205 22% 989 -7% 19 COCOA BEACH $941,217 $779,555 21% $424 23% 120 -22% 36 GRANT $443,115 $539,279 -18% $223 -5% 147 48% 26 INDIALANTIC $751,841 $665,189 13% $341 22% 136 -37% 19 MALABAR $580,669 $521,939 11% $262 24% 63 -26% 27 MELBOURNE $458,345 $401,123 14% $230 19% 2,207 -22% 18 MELBOURNE BEACH $1,239,627 $902,630 37% $443 27% 162 -25% 33 MERRITT ISLAND $593,991 $485,788 22% $270 20% 688 -24% 23 MIMS $380,970 $318,633 20% $203 20% 225 9% 19 PALM BAY $330,304 $266,929 24% $193 22% 3,104 3% 19 ROCKLEDGE $485,852 $420,439 16% $236 19% 569 -21% 16 SATELLITE BEACH & INDIAN HARBOUR BEACH $671,080 $569,824 18% $334 24% 301 -26% 17 TITUSVILLE $334,493 $269,504 24% $192 23% 835 -18% 22 WEST MELBOURNE $458,711 $367,708 25% $226 32% 131 -63% 16 2022 2021 YOY% CHANGE 2022 YOY% CHANGE 2022 YOY% CHANGE 2022 <$300,000 $244,230 $231,195 6% $191 20% 2,708 -50% 19 $300,000-$999,999 $458,974 $457,286 0% $230 9% 6,779 19% 19 >$1MM $1,674,477 $1,580,942 6% $479 14% 276 5% 38 AVG SALES PRICE DAYS ON MARKET
PRICE PER SF CLOSED TRANSACTIONS
Brevard County
PRICE GAINS HOLD IN 2022
Brevard County produced one of the largest year-over-year price appreciations in the region, with the median price increasing by 24%.
AVERAGE SALES PRICE
DAYS ON MARKET
CONDOMINIUMS
Brevard County
SALES BY NEIGHBORHOOD
PRICE RANGE
SOLD ABOVE LISTED PRICE
AVAILABLE LISTINGS
ABOVE LISTING PRICE AT LISTING PRICE OR LOWER AVG SALES PRICE PRICE PER SF DAYS ON MARKET CLOSED TRANSACTIONS 16% DEC 2021 ↓ DEC 2022
2022 2021 YOY% CHANGE 2022 YOY% CHANGE 2022 YOY% CHANGE 2022 BREVARD COUNTY $373,412 $307,015 22% $268 22% 1,859 -20% 36 COCOA $302,904 $263,117 15% $209 16% 97 -6% 23 COCOA BEACH $480,428 $396,009 21% $351 23% 333 -21% 26 GRANT N/A N/A N/A N/A N/A - N/A N/A INDIALANTIC $596,654 $474,664 26% $371 27% 96 -30% 87 MALABAR N/A N/A N/A N/A N/A - N/A N/A MELBOURNE $275,170 $229,298 20% $203 23% 298 -21% 28 MELBOURNE BEACH $700,130 $484,157 45% $368 37% 71 -1% 62 MERRITT ISLAND $255,062 $242,976 5% $203 19% 116 -21% 26 MIMS N/A N/A N/A N/A N/A - N/A N/A PALM BAY $186,858 $171,645 9% $169 17% 60 -35% 23 ROCKLEDGE $242,320 $202,056 20% $190 22% 114 -19% 12 SATELLITE BEACH & INDIAN HARBOUR BEACH $543,701 $451,426 20% $343 22% 186 -31% 40 TITUSVILLE $254,900 $162,987 56% $190 35% 190 9% 72 WEST MELBOURNE $206,890 $140,000 11% $172 19% 29 -9% 13 2022 2021 YOY% CHANGE 2022 YOY% CHANGE 2022 YOY% CHANGE 2022 <$300,000 $196,291 $174,945 12% $203 17% 995 -32% 21 $300,000-$999,999 $529,195 $499,892 6% $333 13% 809 -1% 52 >$1MM $1,286,277 $1,415,031 -9% $486 16% 55 72% 69 AVG SALES PRICE DAYS ON MARKET
PRICE PER SF CLOSED TRANSACTIONS CONDOMINIUMS
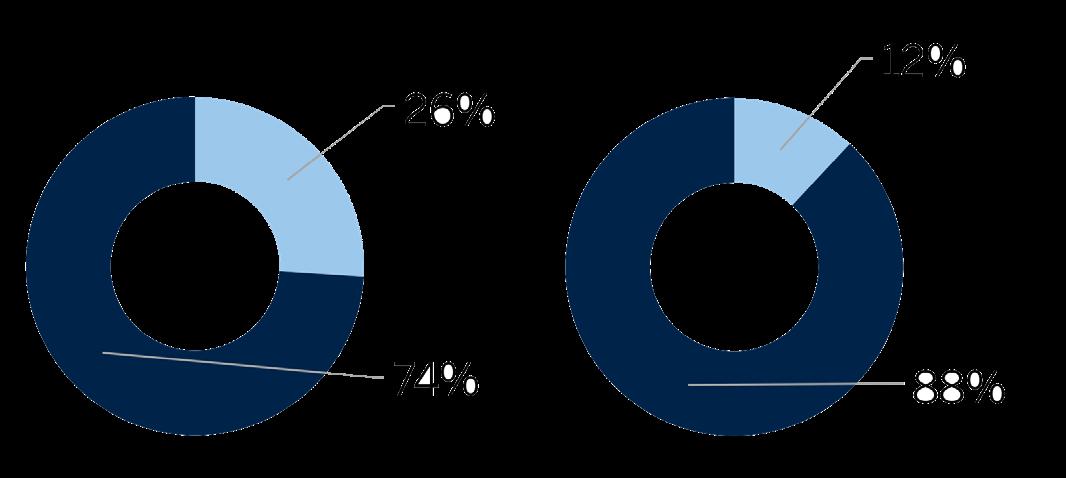
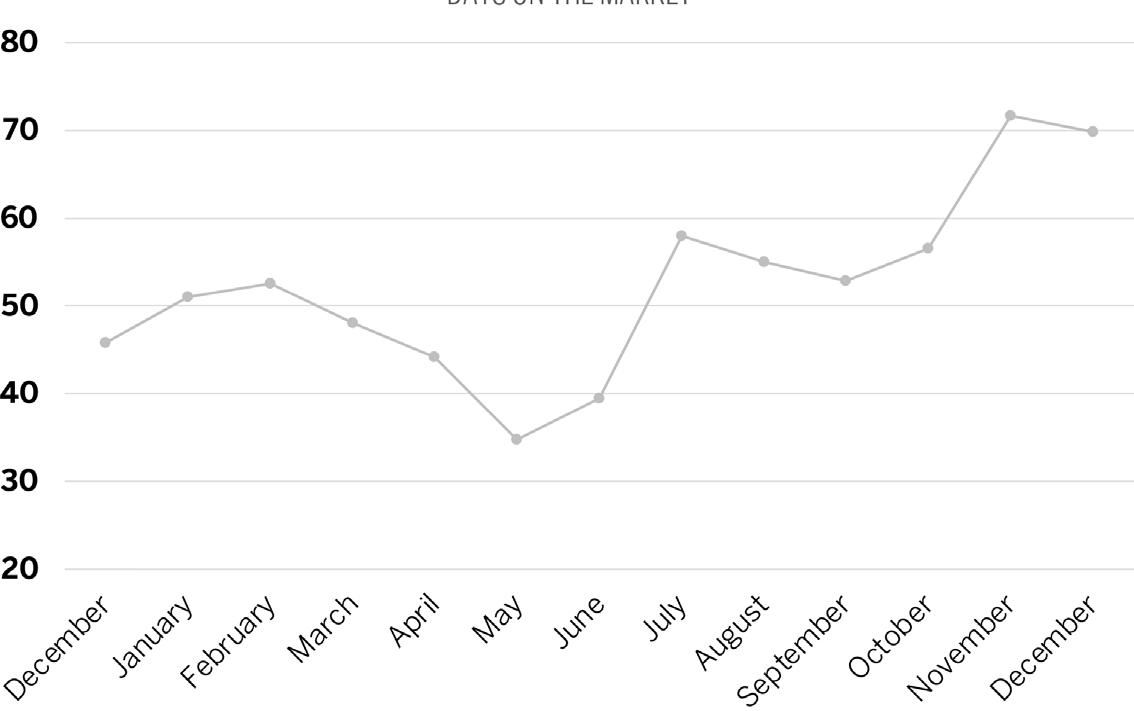
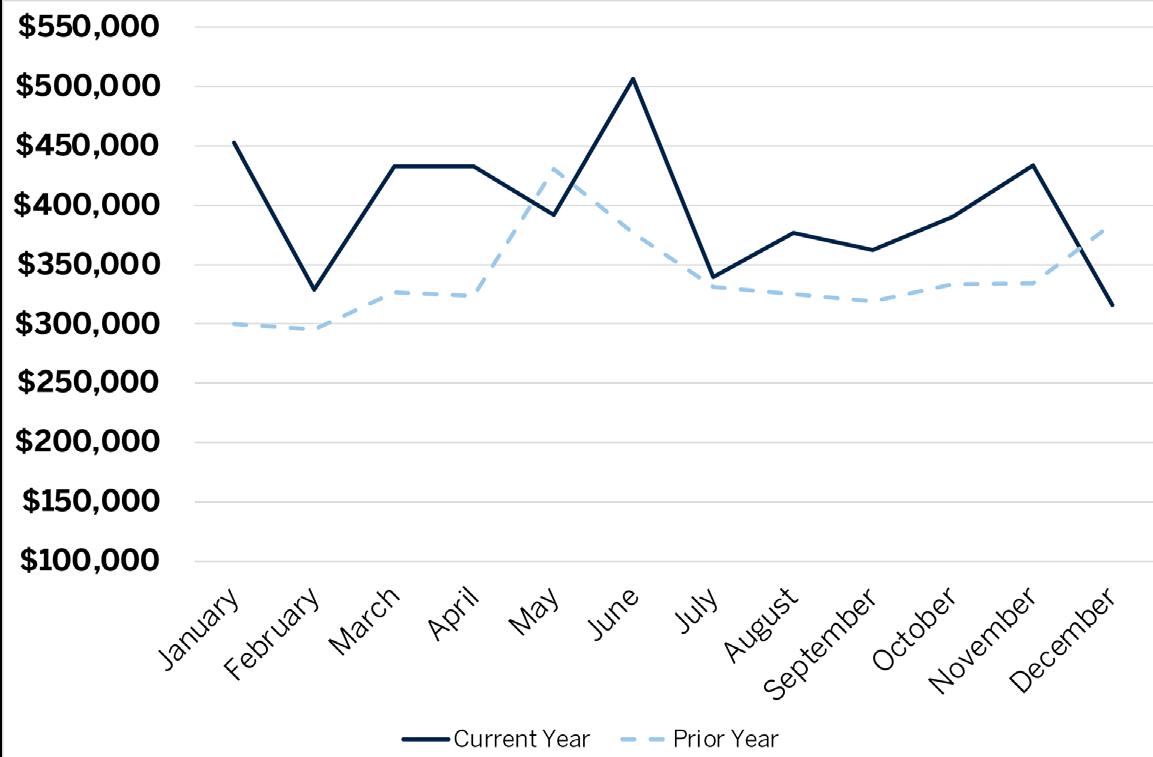
St. Johns County
MOST LUXURY HOMES SOLD IN THE REGION
Not only were the most homes priced above $3 million sold in the county, but sales increased from 2021 to 2022 as well.
AVERAGE SALES PRICE
DAYS ON MARKET
RESIDENTIAL
St. Johns County
SALES BY NEIGHBORHOOD
PRICE RANGE
SOLD ABOVE LISTED PRICE
AVAILABLE LISTINGS
ABOVE LISTING PRICE AT LISTING PRICE OR LOWER AVG SALES PRICE PRICE PER SF DAYS ON MARKET CLOSED TRANSACTIONS 12% DEC 2021 ↓ DEC 2022
2022 2021 YOY% CHANGE 2022 YOY% CHANGE 2022 YOY% CHANGE 2022 ST. JOHNS COUNTY $593,027 $498,997 19% $280 22% 10,004 -21% 42 JULINGTON CREEK AREA $600,030 $480,748 25% $234 23% 989 -31% 32 NOCATEE $737,266 $599,342 23% $295 23% 758 -16% 32 PONTE VEDRA BEACH $1,199,197 $991,068 21% $436 32% 653 -29% 39 SOUTHEAST ST JOHNS COUNTY $583,695 $490,473 19% $348 22% 768 -34% 43 ST. AUGUSTINE BEACHES/ANASTASIA ISLAND $408,408 $330,217 24% $238 20% 911 8% 54 ST. JOHNS $559,717 $460,781 21% $243 25% 989 -12% 41 SOUTHWEST ST JOHNS COUNTY $404,219 $344,442 17% $236 23% 307 -37% 38 ST. AUGUSTINE/VILANO BEACH $690,794 $526,406 31% $313 29% 458 -23% 47 WORLD GOLF VILLAGE AREA/PALENCIA $514,733 $445,342 16% $234 23% 1,235 -20% 44 2022 2021 YOY% CHANGE 2022 YOY% CHANGE 2022 YOY% CHANGE 2022 <$500,000 $368,009 $340,230 8% $239 19% 5,404 -38% 44 $500,000-$999,999 $666,284 $652,882 2% $290 12% 3,809 18% 39 $1MM-$3MM $1,532,460 $1,526,338 0% $467 12% 730 13% 46 >$3MM $4,710,707 $4,503,770 5% $1,022 38% 61 11% 89 AVG SALES PRICE DAYS ON MARKET
PRICE PER SF CLOSED TRANSACTIONS RESIDENTIAL
Duval County
FEWER AND HIGHER-PRICED HOMES SELL
Annual transaction volume decreased by the largest amount in the region compared with one year ago. The median price per square foot increased by more than 20%.
AVERAGE SALES PRICE
DAYS ON MARKET
RESIDENTIAL
Duval County
SALES BY NEIGHBORHOOD
PRICE RANGE
SOLD ABOVE LISTED PRICE
AVAILABLE LISTINGS
LISTING PRICE AT LISTING PRICE OR LOWER AVG SALES PRICE PRICE PER SF DAYS ON MARKET CLOSED TRANSACTIONS 24% DEC 2021 ↓ DEC 2022
ABOVE
2022 2021 YOY% CHANGE 2022 YOY% CHANGE 2022 YOY% CHANGE 2022 DUVAL COUNTY $362,520 $312,771 16% $203 19% 16,593 -27% 36 ARLINGTON/FORT CAROLINE $293,915 $265,904 11% $182 21% 1,495 -20% 43 AVONDALE/RIVERSIDE/ORTEGA $504,110 $428,691 18% $268 19% 536 -27% 42 BARTRAM $362,137 $306,678 18% $205 22% 415 -36% 24 BEACHES $752,996 $659,378 14% $394 16% 873 -32% 36 BEAUCLERC/MANDARIN $423,668 $352,902 20% $210 21% 1,242 -31% 33 DOWNTOWN JACKSONVILLE $157,648 $134,754 17% $126 24% 1,605 -15% 43 INTRACOASTAL $577,087 $460,282 25% $253 23% 1,626 -25% 34 NOCATEE (DUVAL) $413,624 $343,758 20% $232 22% 181 56% 41 NORTH JACKSONVILLE $339,543 $295,794 15% $178 19% 1,625 -22% 38 SAN MARCO/SAN JOSE $458,592 $374,985 22% $224 17% 567 -34% 39 SOUTHSIDE $300,796 $255,400 18% $194 20% 1,979 -31% 33 WEST JACKSONVILLE $276,406 $232,436 19% $174 22% 3,504 -21% 36 2022 2021 YOY% CHANGE 2022 YOY% CHANGE 2022 YOY% CHANGE 2022 <$500,000 $282,851 $256,099 10% $184 17% 14,135 -31% 36 $500,000-$999,999 $665,515 $654,970 2% $281 8% 2,064 11% 36 $1MM-$3MM $1,464,198 $1,544,878 -5% $445 6% 367 8% 54 >$3MM $3,933,898 $4,009,048 -2% $834 -2% 27 -4% 84 AVG SALES PRICE DAYS ON MARKET
PRICE PER SF CLOSED TRANSACTIONS RESIDENTIAL
Clay County
PRICING AND TIME ON MARKET INCREASE

The average price increased by nearly 20% while homes took longer to sell in 2022. The number of homes sold in the $1 million to $3 million range nearly doubled.
AVERAGE SALES PRICE
DAYS ON MARKET
RESIDENTIAL
Clay County
PRICE RANGE
SOLD ABOVE LISTED PRICE
SALES BY NEIGHBORHOOD AVAILABLE LISTINGS
ABOVE LISTING PRICE AT LISTING PRICE OR LOWER AVG SALES PRICE PRICE PER SF DAYS ON MARKET CLOSED TRANSACTIONS 13% DEC 2021 ↓ DEC 2022
2022 2021 YOY% CHANGE 2022 YOY% CHANGE 2022 YOY% CHANGE 2022 CLAY COUNTY $374,770 $316,206 19% $189 21% 3,966 -21% 36 FLEMING ISLAND $495,943 $408,174 22% $209 21% 529 -26% 31 GREEN COVE SPRINGS $374,662 $328,159 14% $193 20% 431 -8% 37 MIDDLEBURG/KEYSTONE $355,877 $295,909 20% $191 22% 985 -21% 37 ORANGE PARK $322,148 $273,135 18% $182 20% 673 -27% 38 OAKLEAF PLANTATION $364,539 $299,473 22% $179 23% 714 -22% 38 2022 2021 YOY% CHANGE 2022 YOY% CHANGE 2022 YOY% CHANGE 2022 <$500,000 $331,322 $292,140 13% $184 20% 3,469 -26% 35 $500,000-$999,999 $626,885 $629,567 0% $213 5% 465 53% 36 $1MM-$3MM $1,318,709 $1,346,147 -2% $346 12% 31 82% 80 >$3MM $4,600,000 N/A N/A $388 N/A 1 N/A 713 AVG SALES PRICE DAYS ON MARKET
PRICE PER SF CLOSED TRANSACTIONS RESIDENTIAL
Nassau County
COMPETITION ABOVE $1 MILLION
Buyer competition persisted throughout much of the county, particularly in homes priced greater than $1 million. The number of sales priced between $1 million and $3 million increased by 17%.
AVERAGE SALES PRICE
DAYS ON MARKET
RESIDENTIAL
Nassau County
SALES BY NEIGHBORHOOD
PRICE RANGE
SOLD ABOVE LISTED PRICE
AVAILABLE LISTINGS
ABOVE LISTING PRICE AT LISTING PRICE OR LOWER AVG SALES PRICE PRICE PER SF DAYS ON MARKET CLOSED TRANSACTIONS 23% DEC 2021 ↓ DEC 2022
2022 2021 YOY% CHANGE 2022 YOY% CHANGE 2022 YOY% CHANGE 2022 NASSAU COUNTY $566,111 $479,640 18% $267 16% 3,788 -15% 40 AMELIA ISLAND/FERNANDINA BEACH $785,141 $609,702 29% $356 23% 1,231 -29% 40 YULEE/WILDLIGHT $384,482 $317,104 21% $194 14% 565 2% 41 2022 2021 YOY% CHANGE 2022 YOY% CHANGE 2022 YOY% CHANGE 2022 <$500,000 $361,820 $328,590 10% $210 13% 2,394 -25% 39 $500,000-$999,999 $679,551 $672,713 1% $310 5% 1,133 8% 41 $1MM-$3MM $1,586,342 $1,589,621 0% $573 1% 238 17% 38 >$3MM $5,684,783 $4,451,071 28% $978 19% 23 64% 75 AVG SALES PRICE DAYS ON MARKET
PRICE PER SF CLOSED TRANSACTIONS RESIDENTIAL
Flagler County
PRICE GAINS LEAD TO NEW PRICING TIER
After a slower 2021, several homes priced above the $3 million mark sold in 2022.
AVERAGE SALES PRICE
DAYS ON MARKET
RESIDENTIAL
Flagler County
SALES BY NEIGHBORHOOD
SOLD ABOVE LISTED PRICE
AVAILABLE LISTINGS
ABOVE LISTING PRICE AT LISTING PRICE OR LOWER AVG SALES PRICE PRICE PER SF DAYS ON MARKET CLOSED TRANSACTIONS 8% DEC 2021 ↓ DEC 2022
2022 2021 YOY% CHANGE 2022 YOY% CHANGE 2022 YOY% CHANGE 2022 FLAGLER COUNTY $451,961 $390,924 16% $235 20% 4,552 -18% 34 BUNNELL $322,030 $281,381 14% $188 16% 155 -29% 32 FLAGLER BEACH $579,262 $506,184 14% $347 22% 183 -38% 42 PALM COAST $449,000 $370,588 21% $228 23% 2,556 -21% 34 2022 2021 YOY% CHANGE 2022 YOY% CHANGE 2022 YOY% CHANGE 2022 <$500,000 $346,123 $304,517 14% $205 17% 3,498 -24% 33 $500,000-$999,999 $667,446 $671,439 -1% $314 14% 891 12% 37 $1MM-$3MM $1,473,452 $1,389,008 6% $435 15% 156 -10% 35 >$3MM $3,147,857 N/A N/A $679 N/A 7 N/A 112 AVG SALES PRICE DAYS ON MARKET PRICE RANGE PRICE PER SF CLOSED TRANSACTIONS RESIDENTIAL
For unmatched real estate expertise © 2023 ONE Sotheby’s International Realty. All rights reserved. Sotheby’s International Realty® and the Sotheby’s International Realty Logo are service marks licensed to Sotheby’s International Realty Affiliates LLC and used with permission. ONE Sotheby’s International Realty fully supports the principles of the Fair Housing Act and the Equal Opportunity Act. Each franchise is independently owned and operated. Any services or products provided by independently owned and operated franchisees are not provided by, affiliated with or related to Sotheby’s International Realty Affiliates LLC nor any of its affiliated companies. The information contained herein is deemed accurate but not guaranteed.
