REAL ESTATE ALONG FLORIDA’S
TODAY’S
EAST COAST
TRENDS MARKET REPORT NOVEMBER 2022


Scan to Explore Your Mortgage Options Bank on Better Finance your next home with 75 years of trusted Florida-based mortgage expertise at your side. Extensive local real estate experience and market knowledge. Flexible home loans with competitive rates.1 Personalized service from application to close. Primary Residences & Second Homes Vacation Homes & Investment Properties New Construction & Land Acquisition © 2022 City National Bank of Florida 2966168977 / r07/22 Member FDIC NMLS#412469 1 Loan products are subject to credit approval and program requirements. Terms and conditions apply. This is not a commitment to lend. Loan programs, terms, rates, and conditions are subject to change without notice.
C
NMLS #459788 Senior Vice President, Mortgage Market Manager e: dan.campanella@citynational.com c: 1.877.511.4CNB
DAN
AMPANELLA
LOCAL EXPERTISE WITH A GLOBAL PERSPECTIVE
I’m proud to share our latest TRENDS Market Report providing meaningful insights on today’s real estate market across Florida’s East Coast. We do business in the strongest housing markets in the country, which have remained resilient to the increasing rate environment and support continued investment.
Our regional housing market continues to buck trends, with pricing remaining strong. Buyer demand remains robust compared to many other high-growth regions across the Southeastern United States, as Florida’s economy and employment opportunities continued to attract new residents. The single-family home segment outperformed, with sales increasing by 5% last month. Inventory is still selling faster than in 2021.
ONE Sotheby’s International Realty makes it a priority to stay at the forefront of innovation, positioning our real estate associates with the best tools and resources to offer their clients an unrivaled level of service. We are incredibly proud to have recently been voted Best Brokerage Website by South Florida Agent Choice Awards 2022—a testament to our innovative strategy, marketing powerhouse, and continued reinvestment in our business.
As we approach the season of gratitude, we are thankful for our associates and team at ONE Sotheby’s International Realty, who consistently deliver exceptional performance and continue to raise the bar in our industry.
There are plenty of opportunities for those ready to make the next move. The best is yet to come!
Daniel de la Vega President


ONE
Sotheby’s International Realty
ABOUT TRENDS:
ONE Sotheby’s International Realty presents the only market report focused on Florida’s East Coast. From Miami to Amelia Island, data is presented from a macro perspective down to city level.
Data is sourced from local Multiple Listing Service (MLS) organizations. Written analysis created in partnership with the Rosen Consulting Group, a nationally recognized consulting firm and trusted advisor to top public and private real estate operators and capital providers.
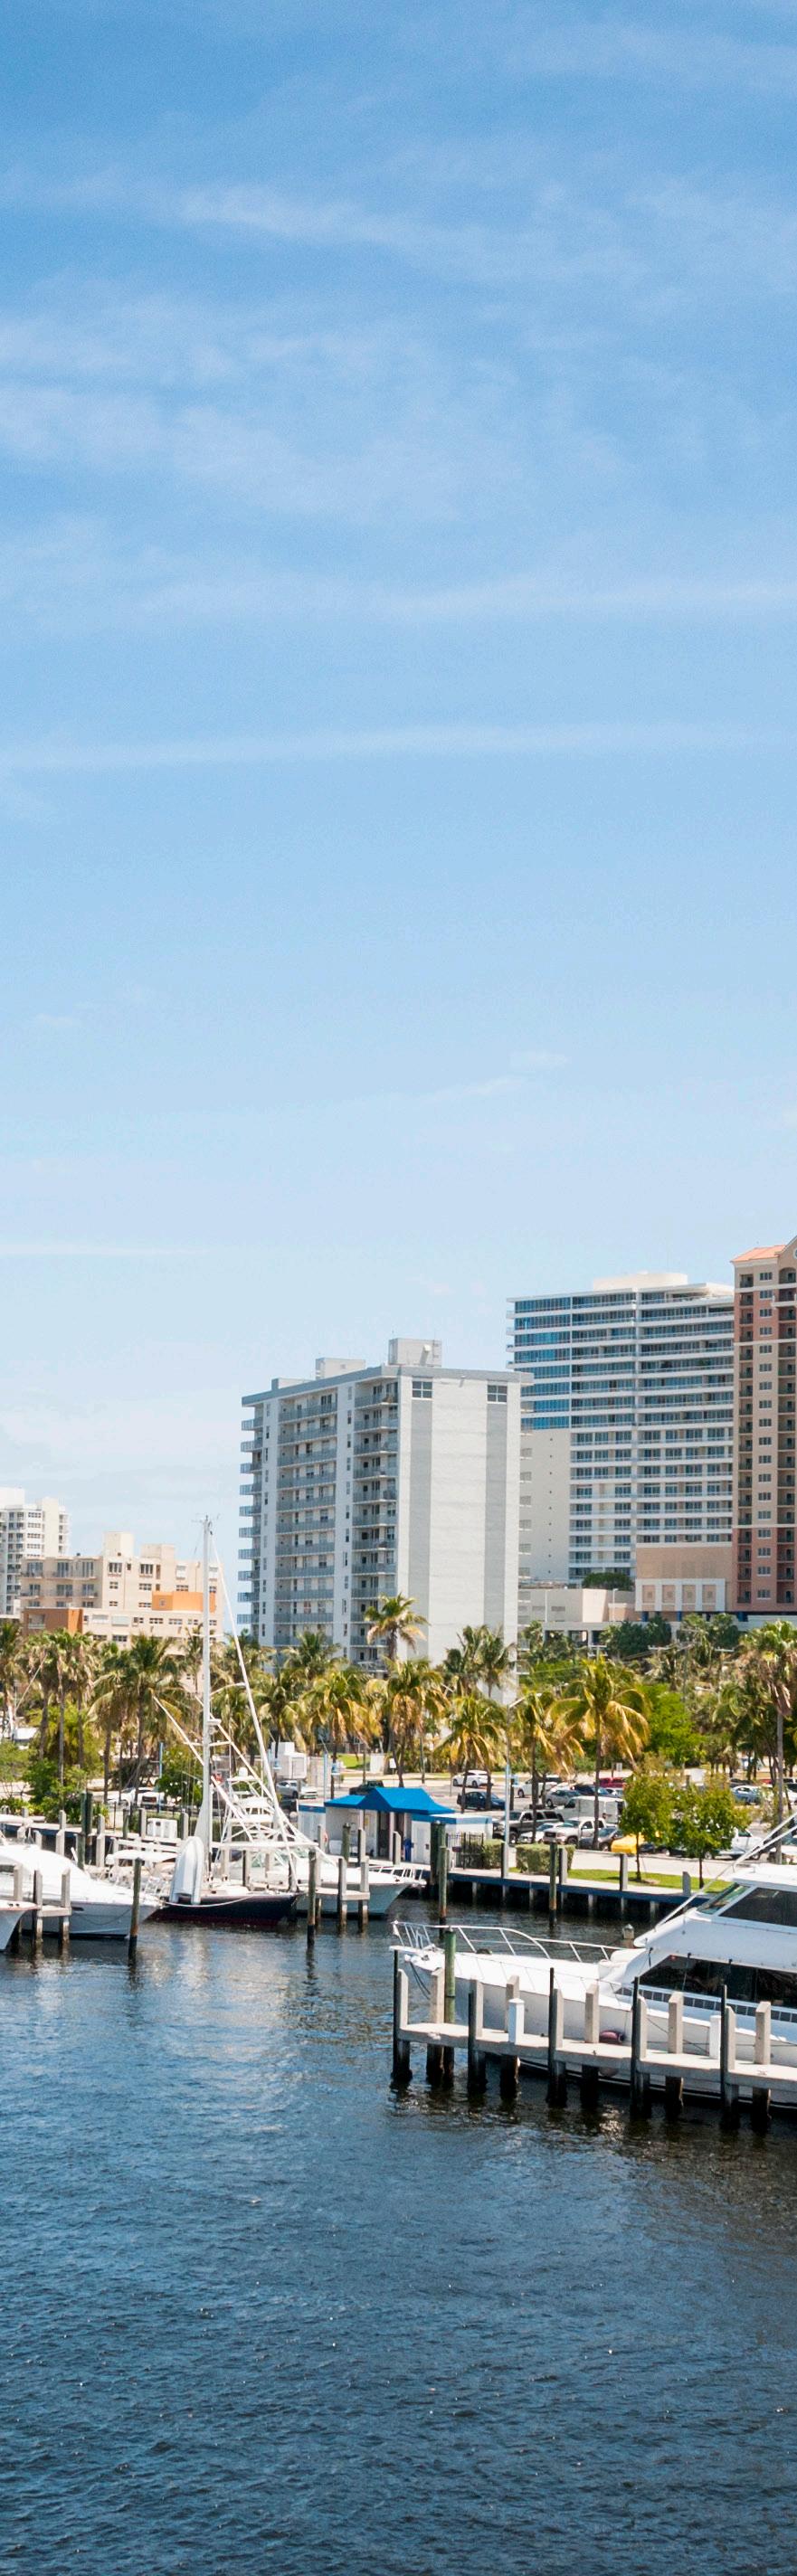
THE REAL ESTATE MARKET ALONG FLORIDA’S EAST COAST
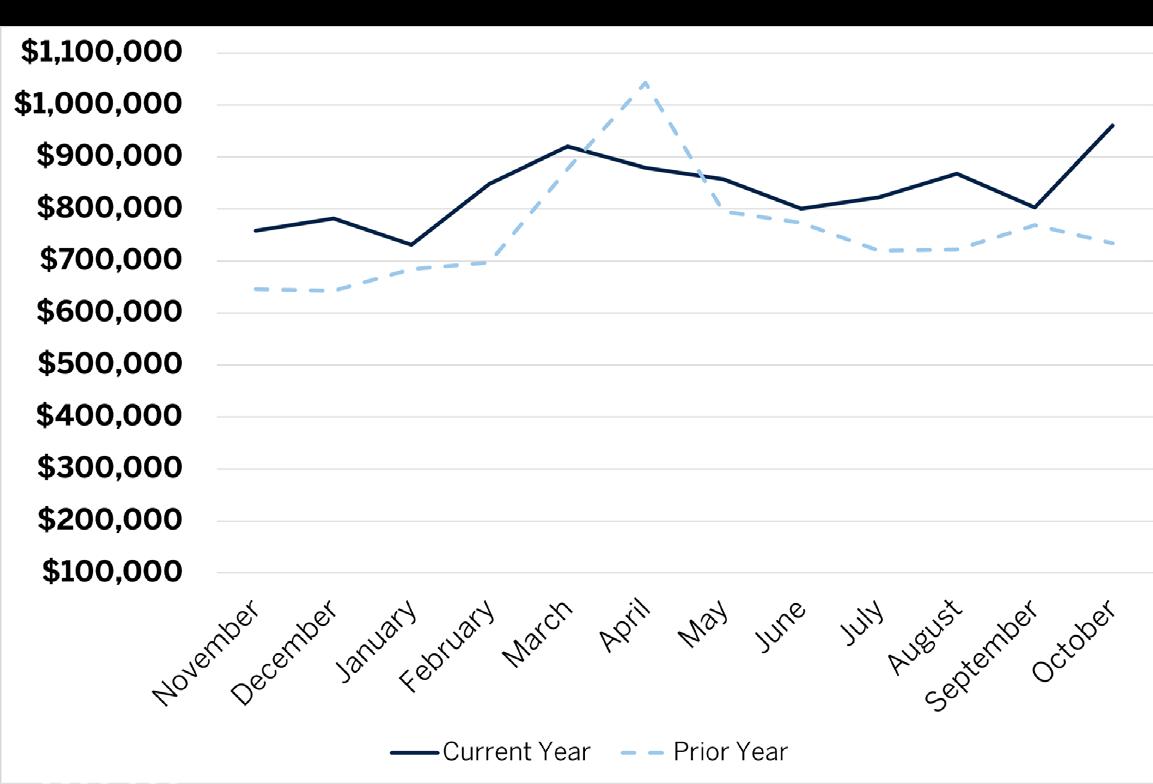
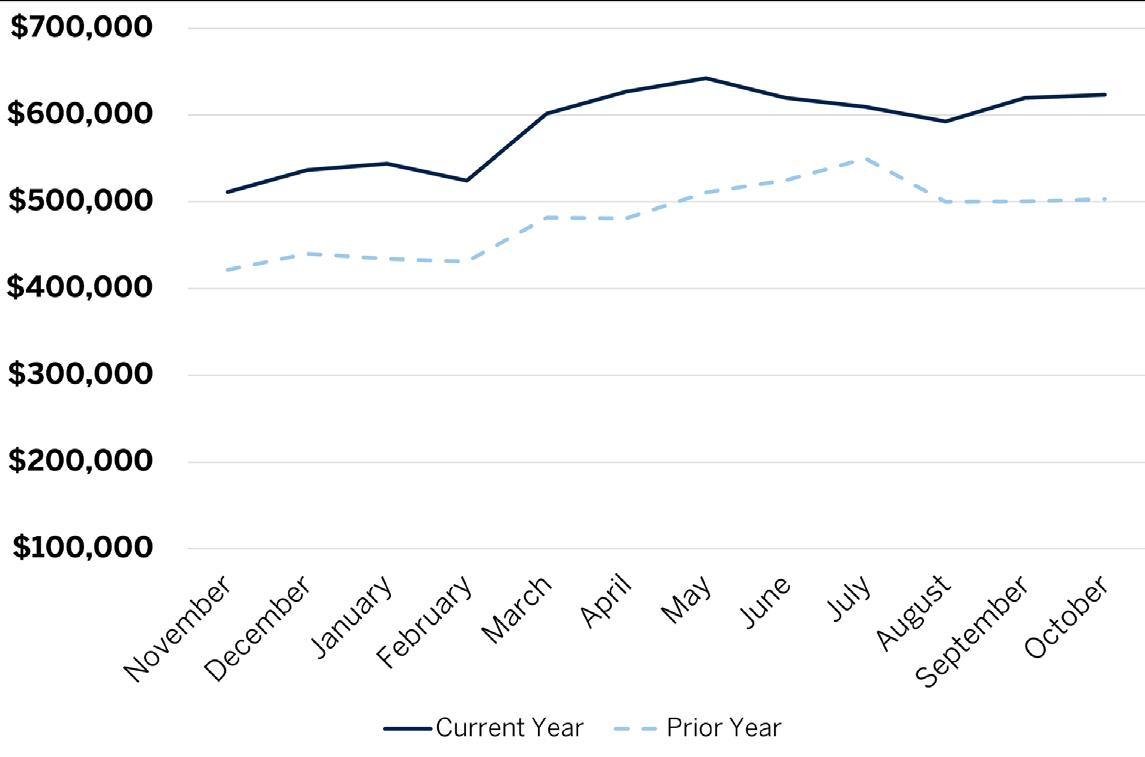
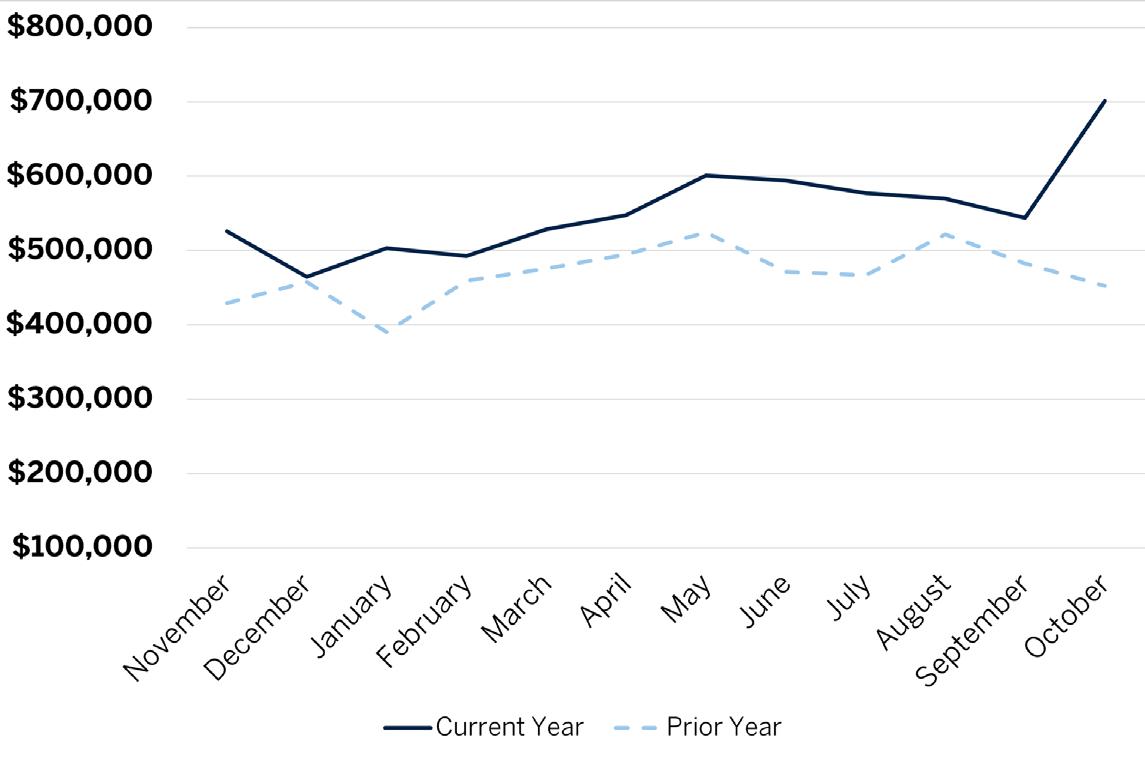
Florida’s buyer demand remained stronger than in many other high-growth regions in October. The strong economy in part offset the rise in mortgage rates that impacted some homebuyer confidence in the last few months. With the unemployment rate in the low-2% range, employment opportunities continued to attract new residents while wage growth helped more households to afford homes despite the rising costs.
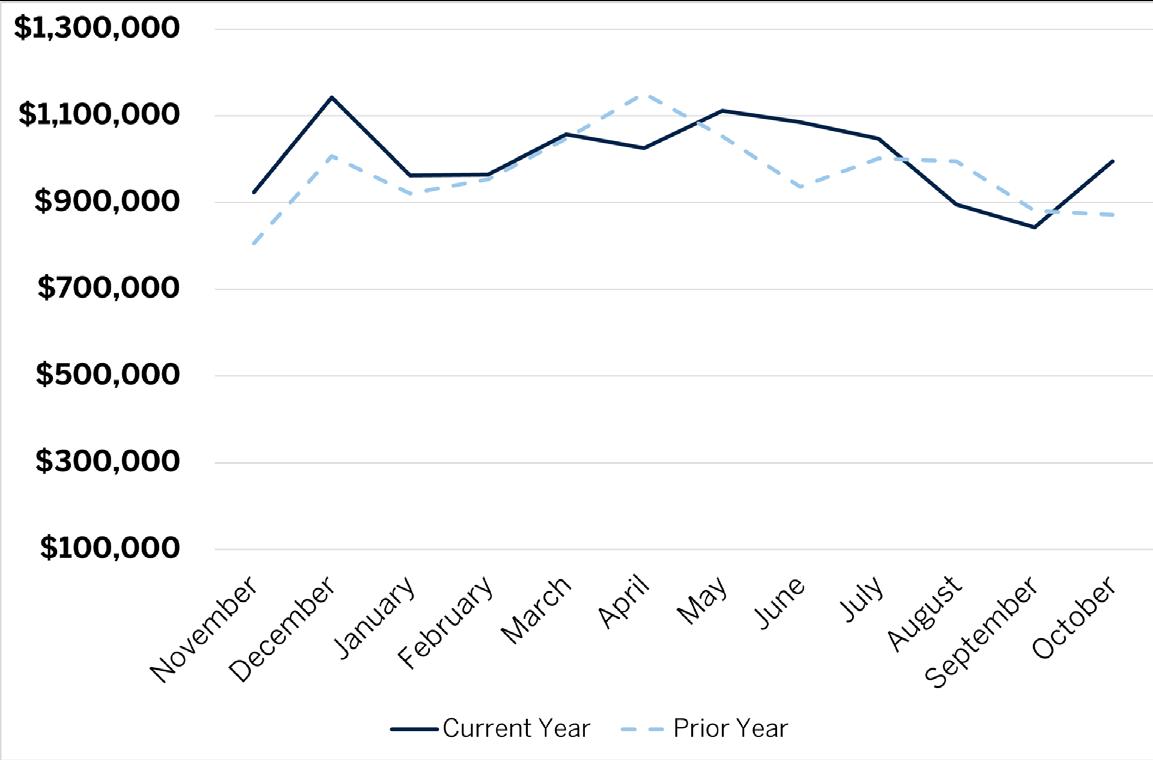
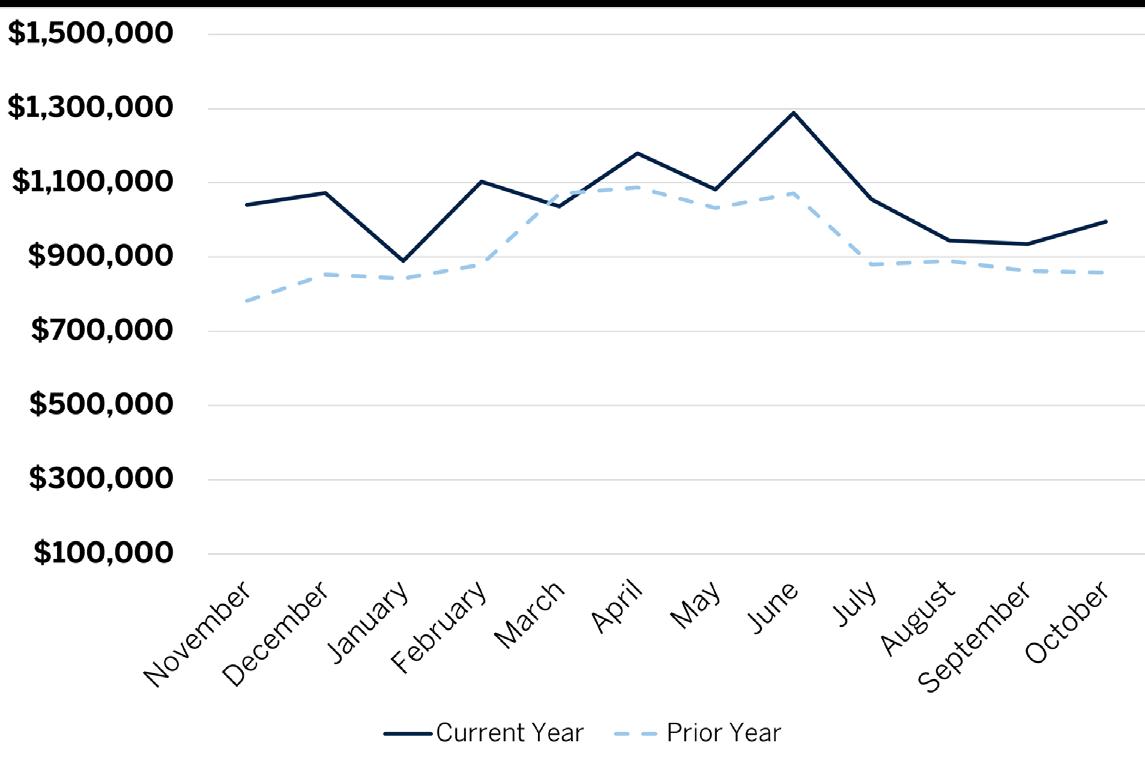
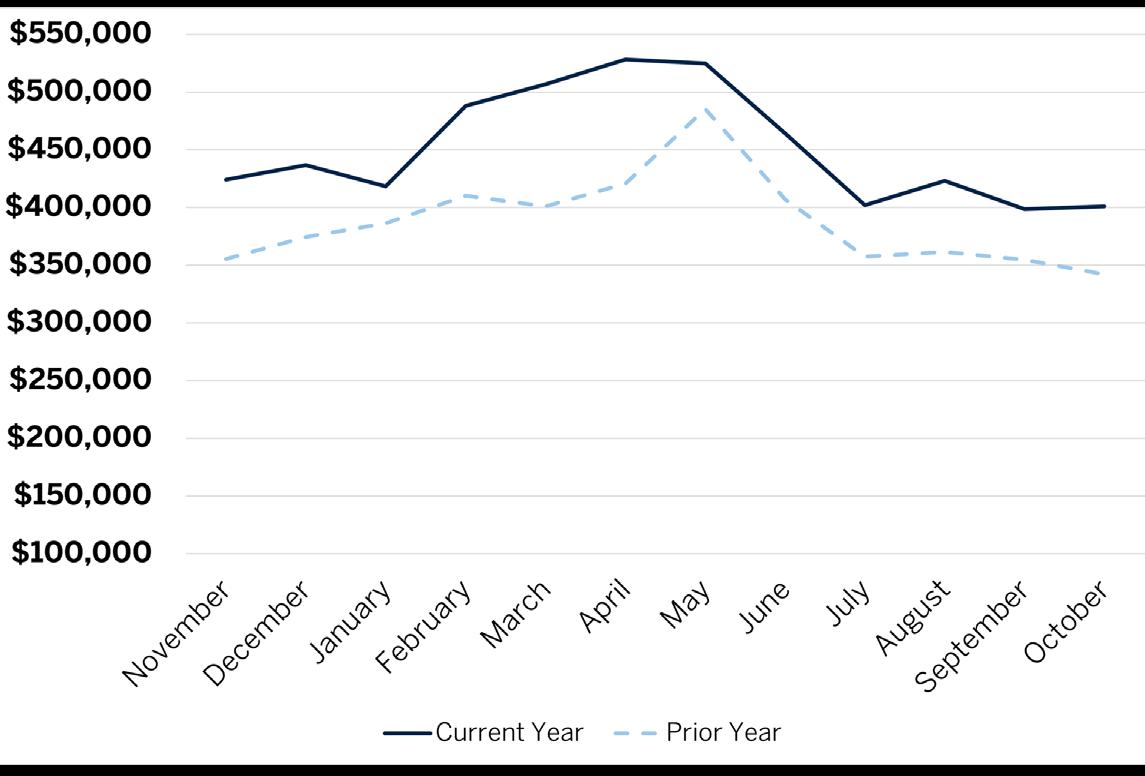
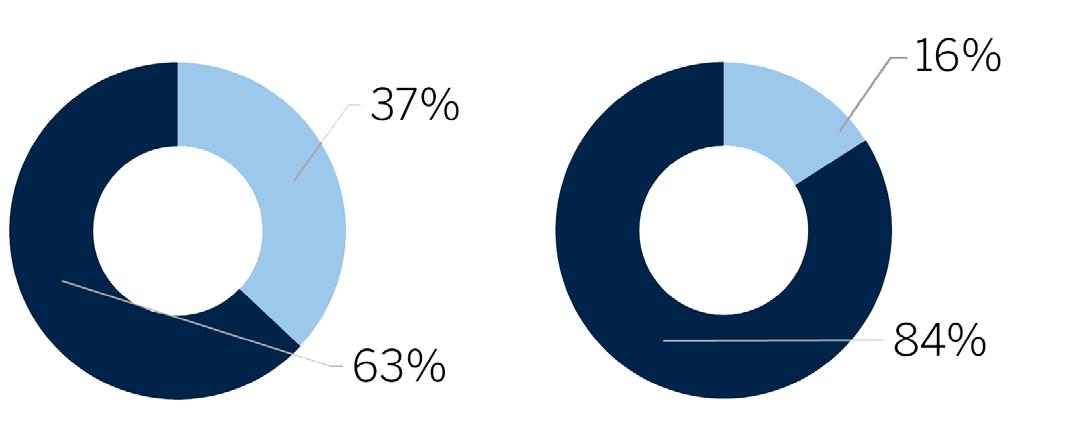
The single-family home segment outperformed, with sales increasing by 5% last month compared to a decline of 4% for condo sales. Homes priced less than $500,000 sold at a 37% lower clip than one year ago. Sales within the mid-priced tiers, generally between $1 million and $3 million, were on par with last year. Among homes priced more than $4 million, sales declined by roughly 14%.
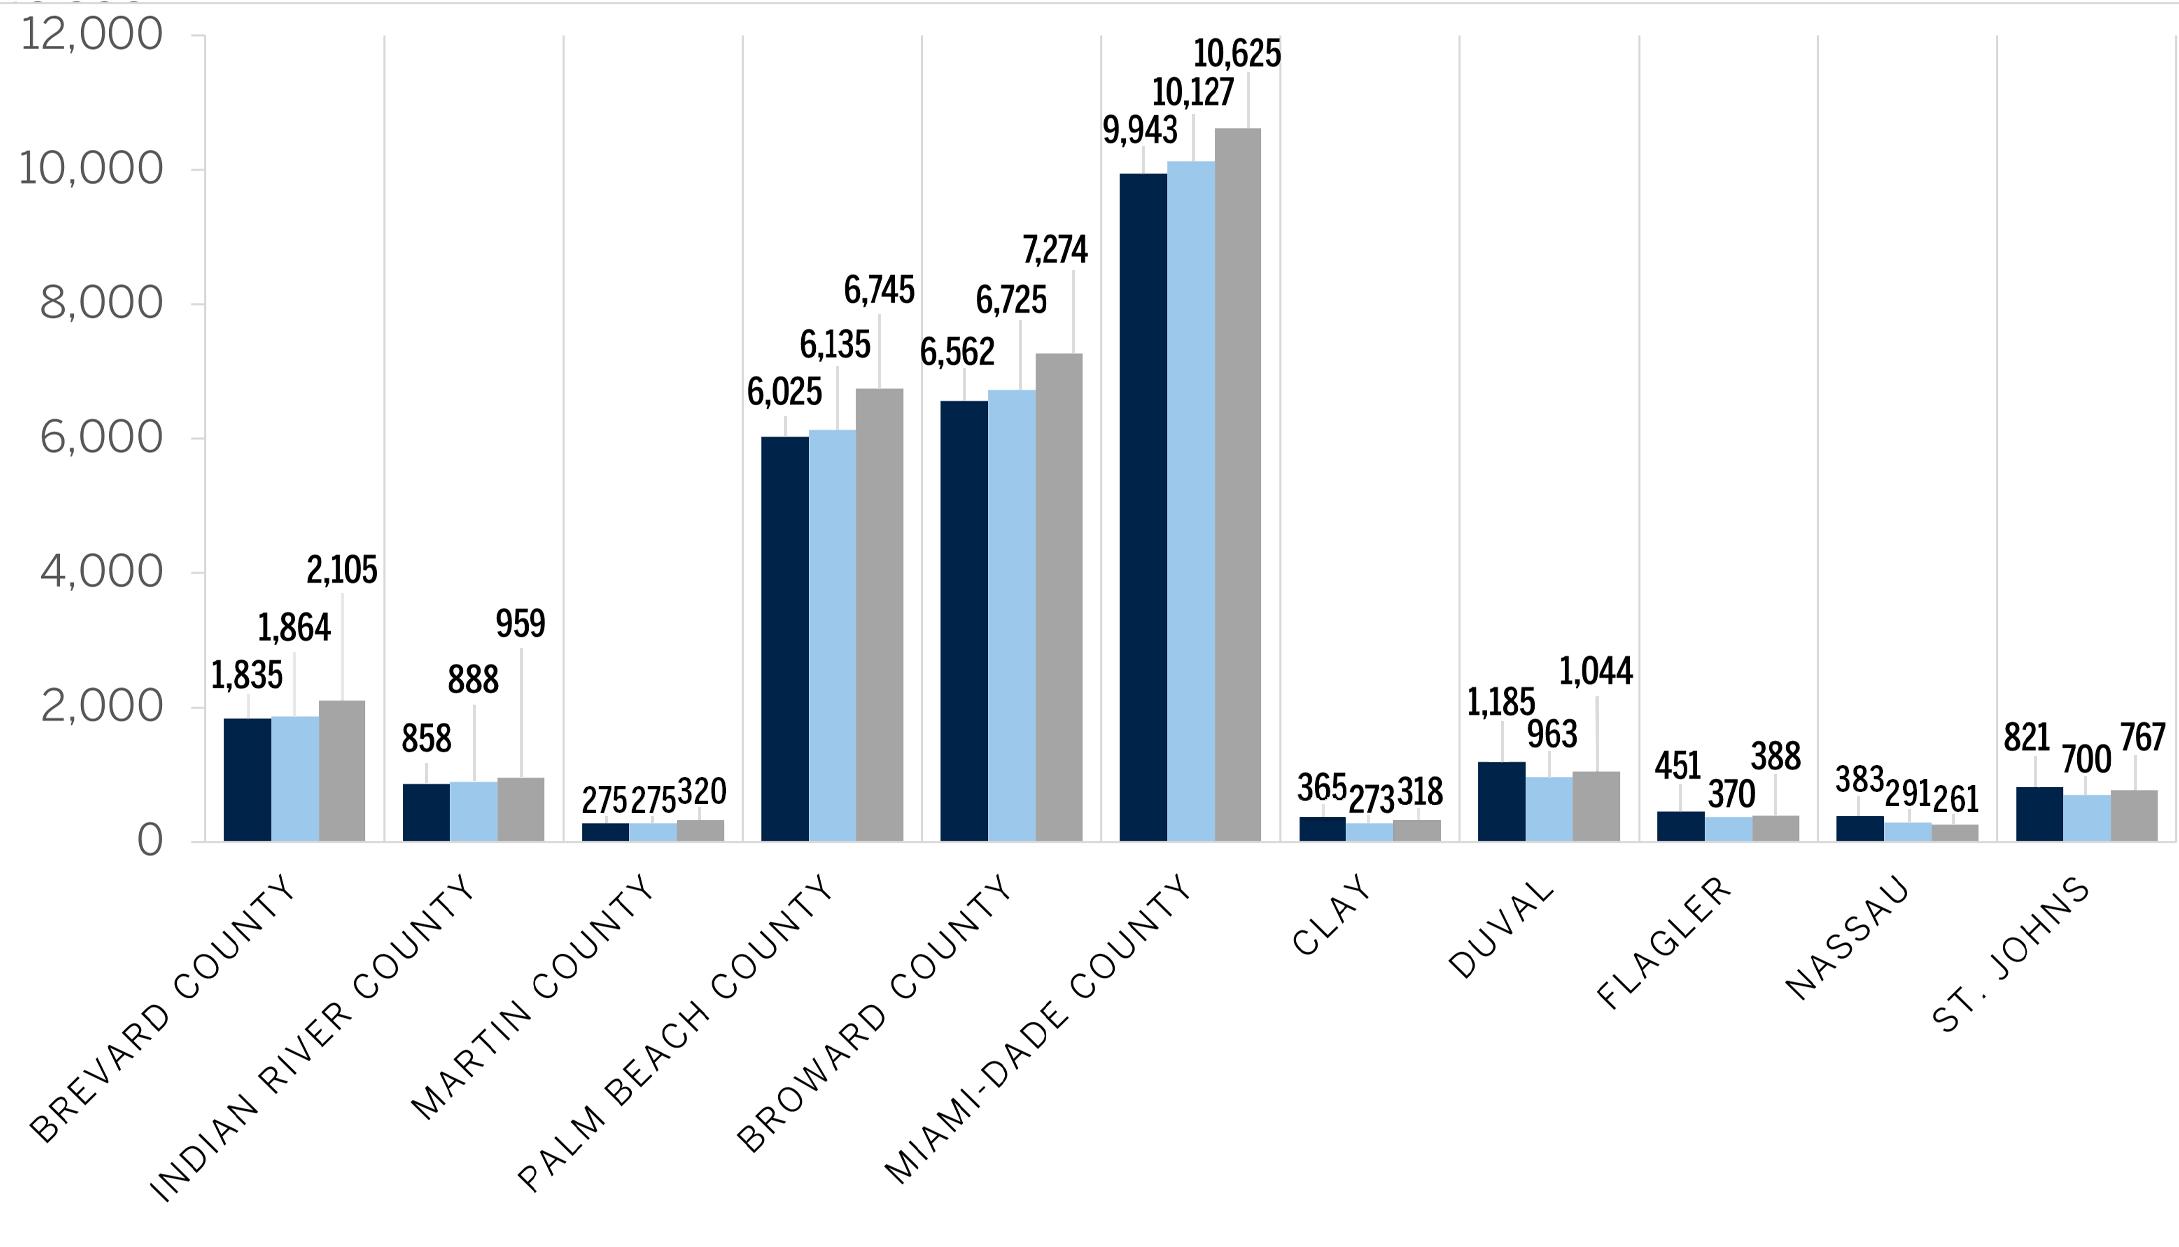
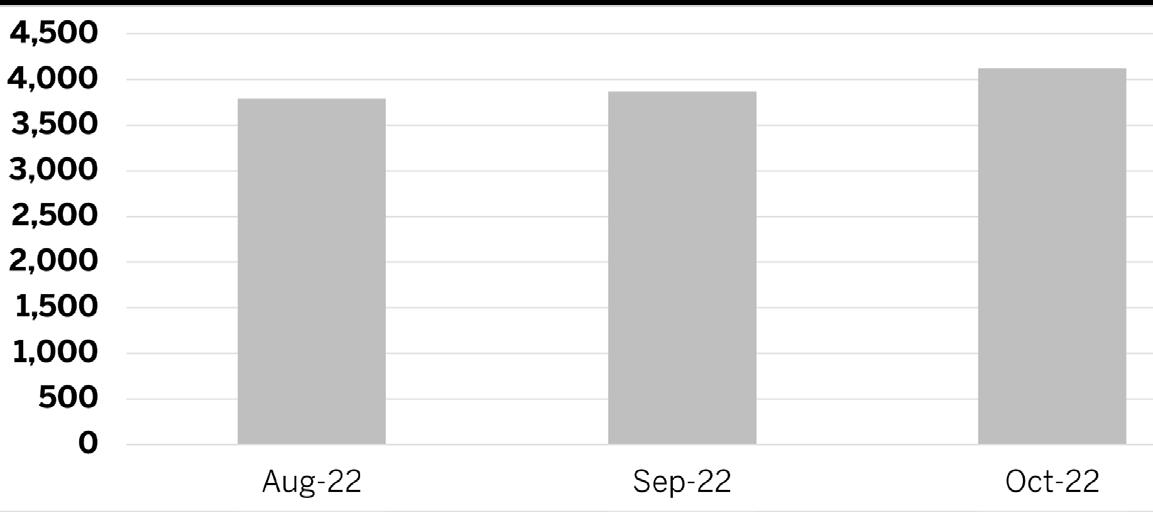
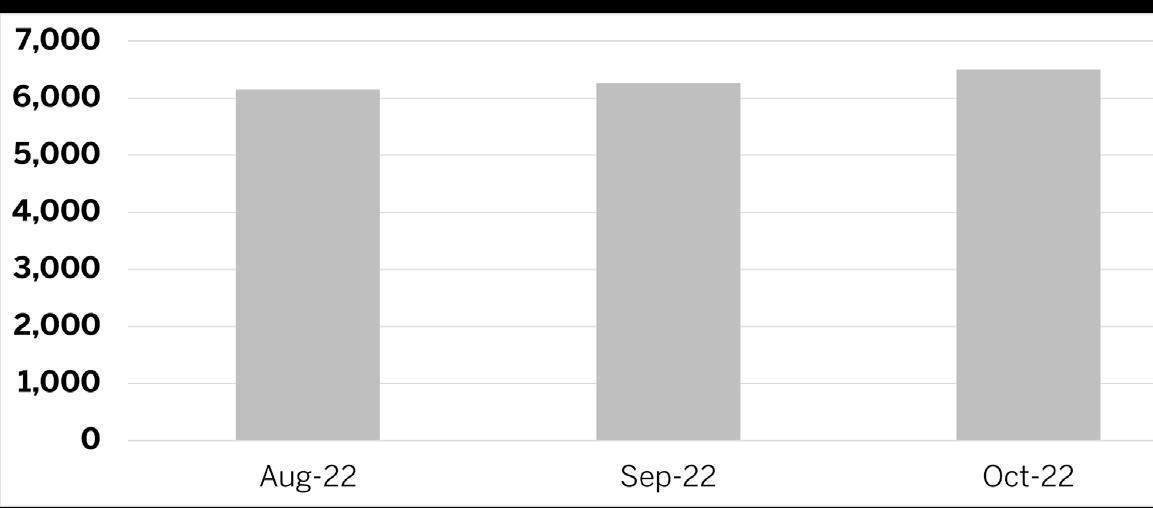
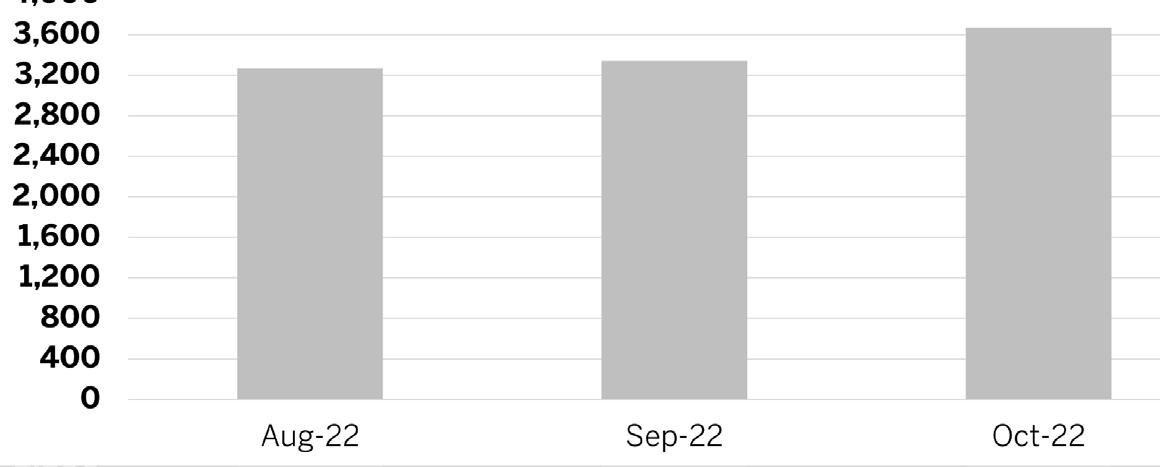
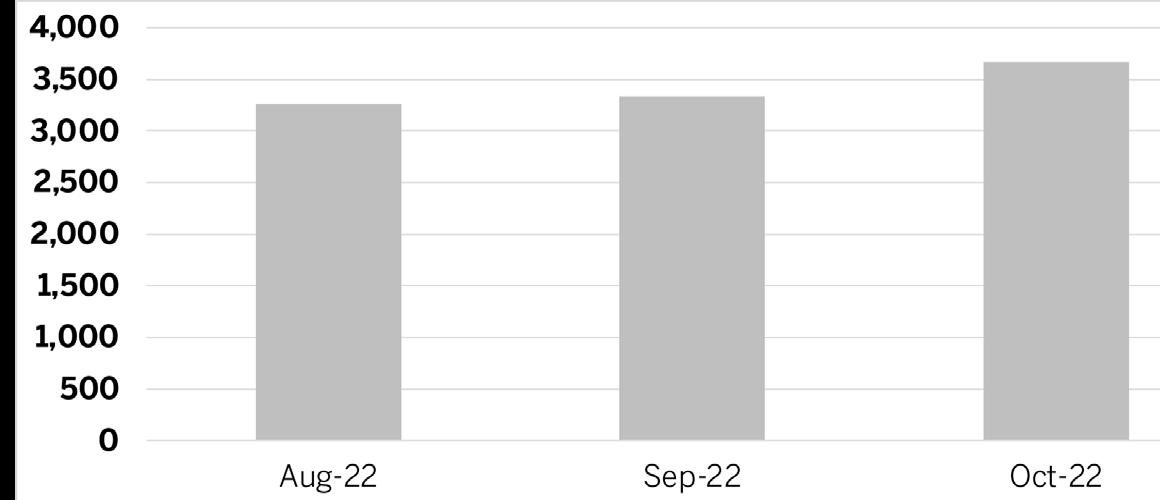
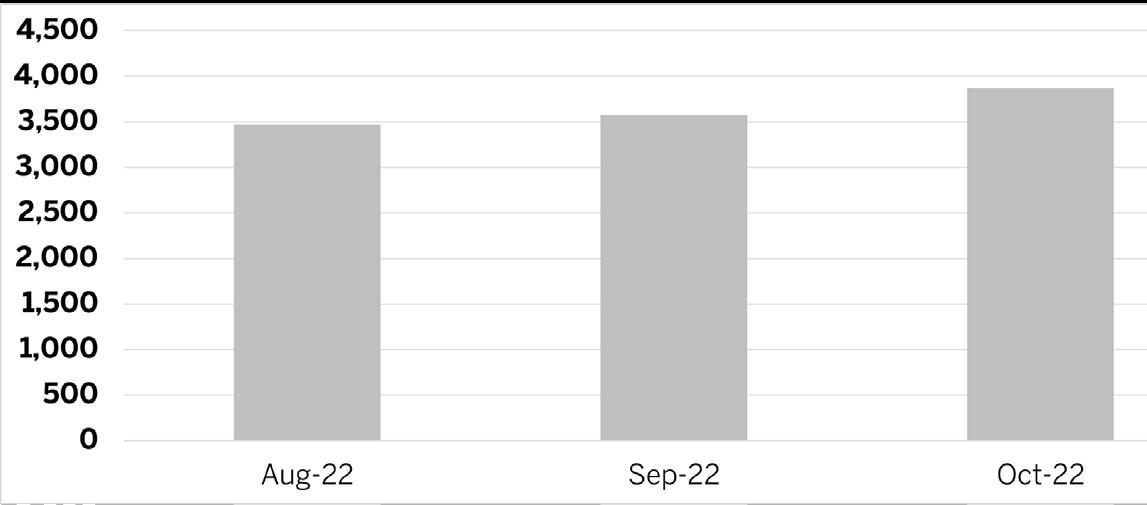
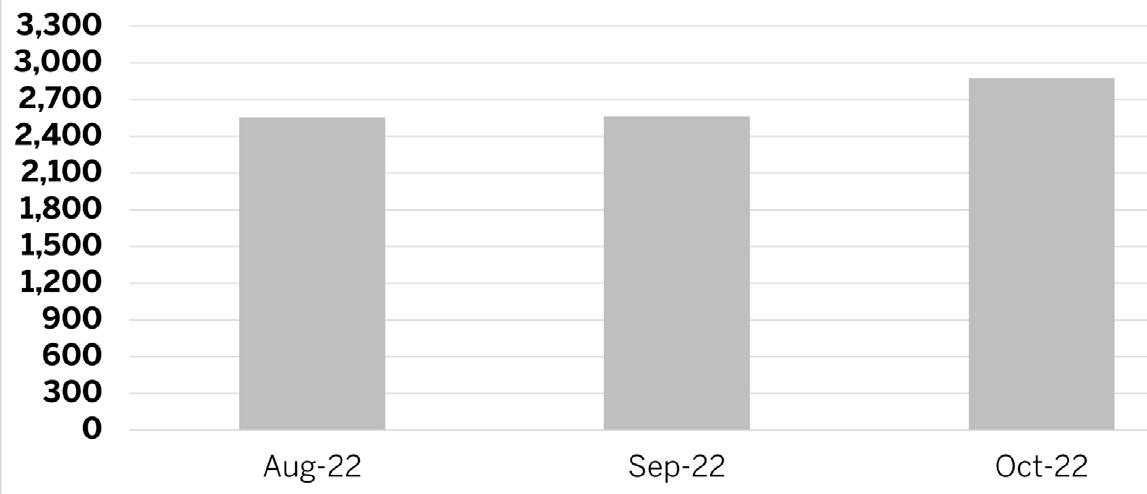
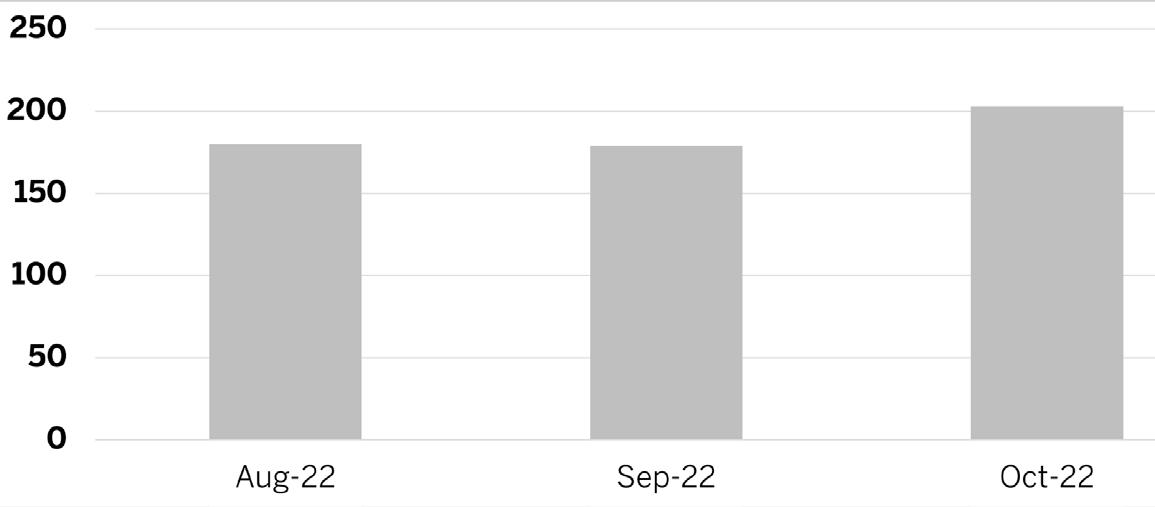
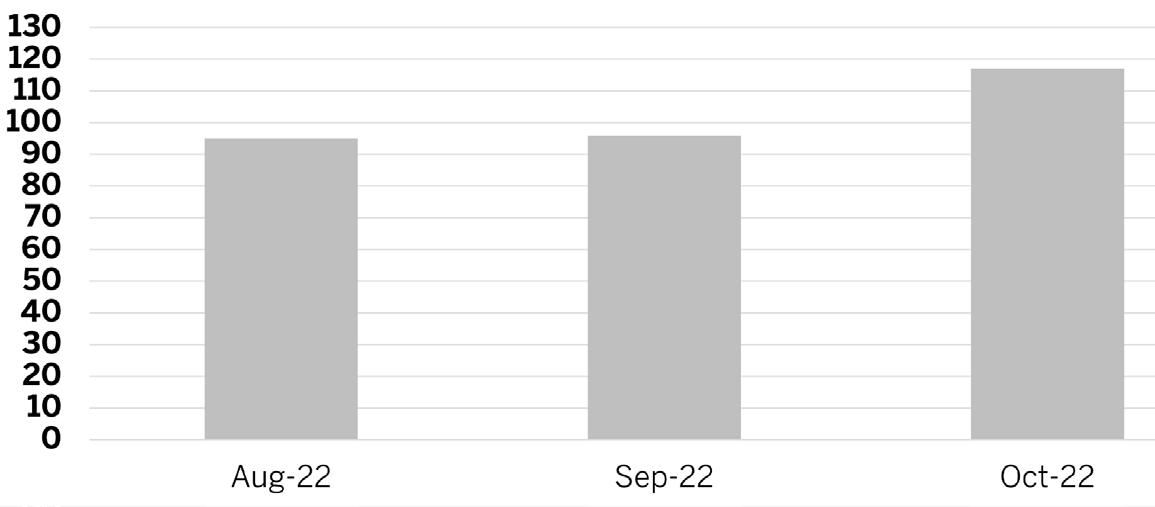
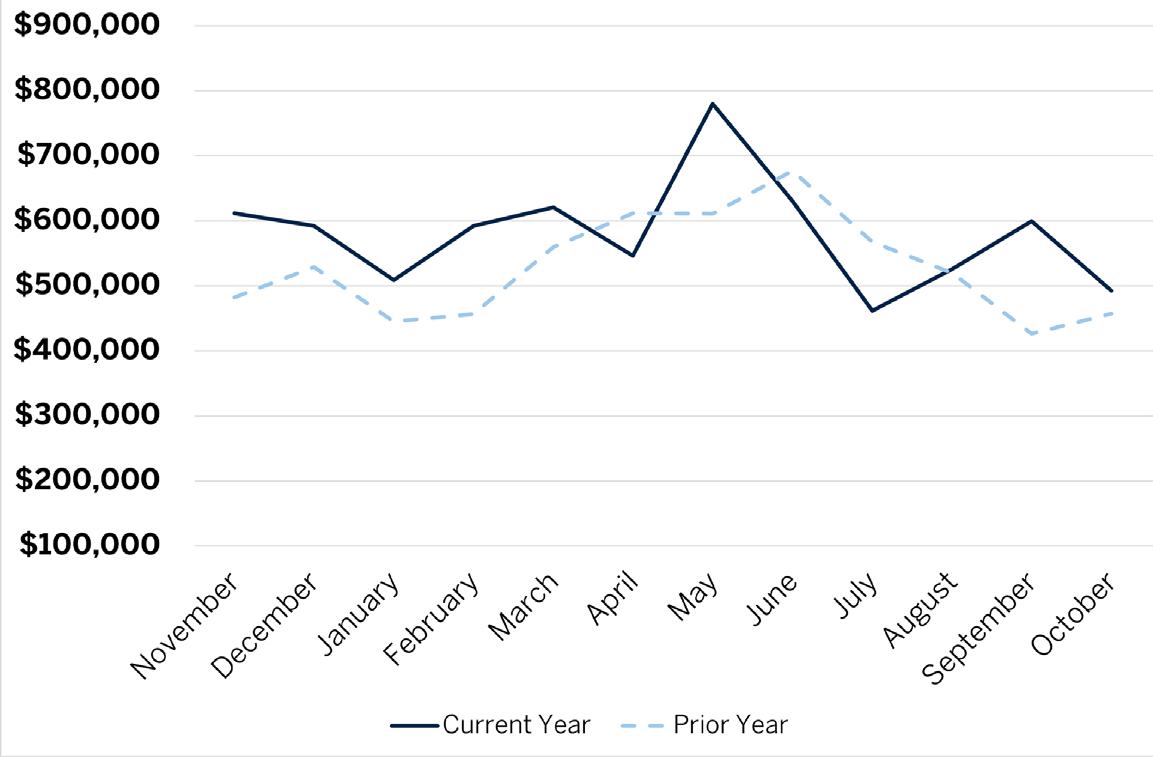
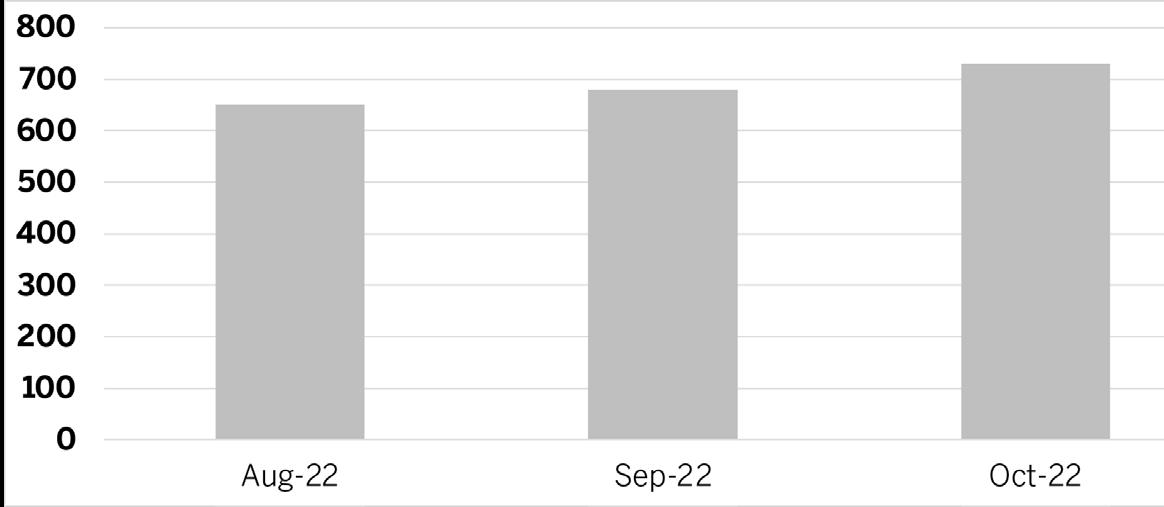
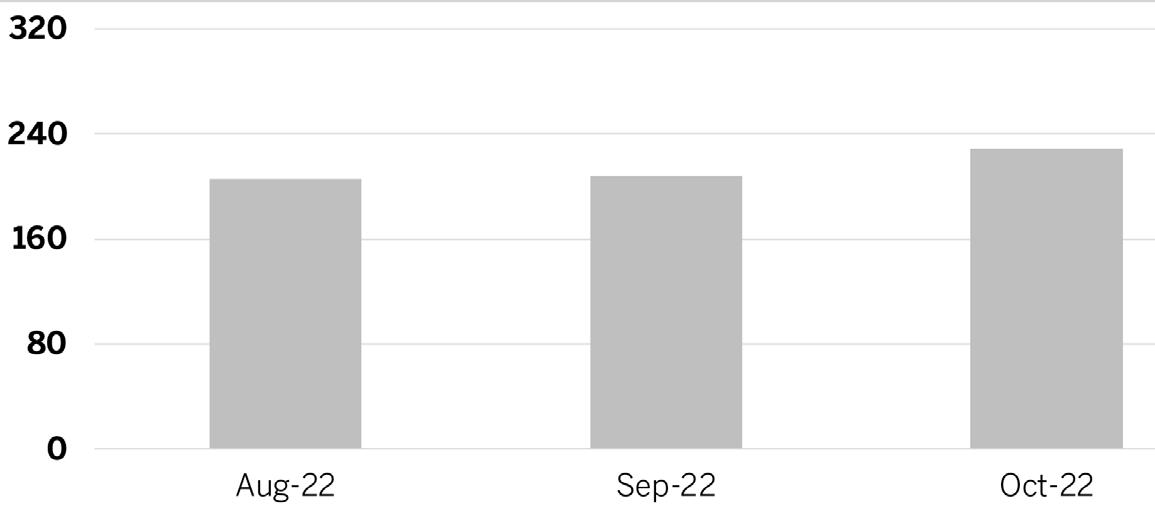
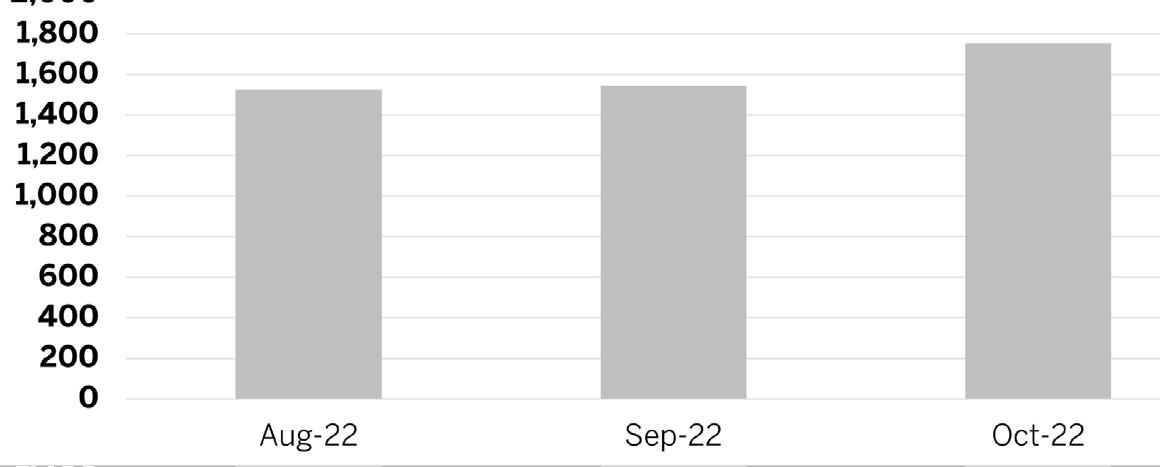
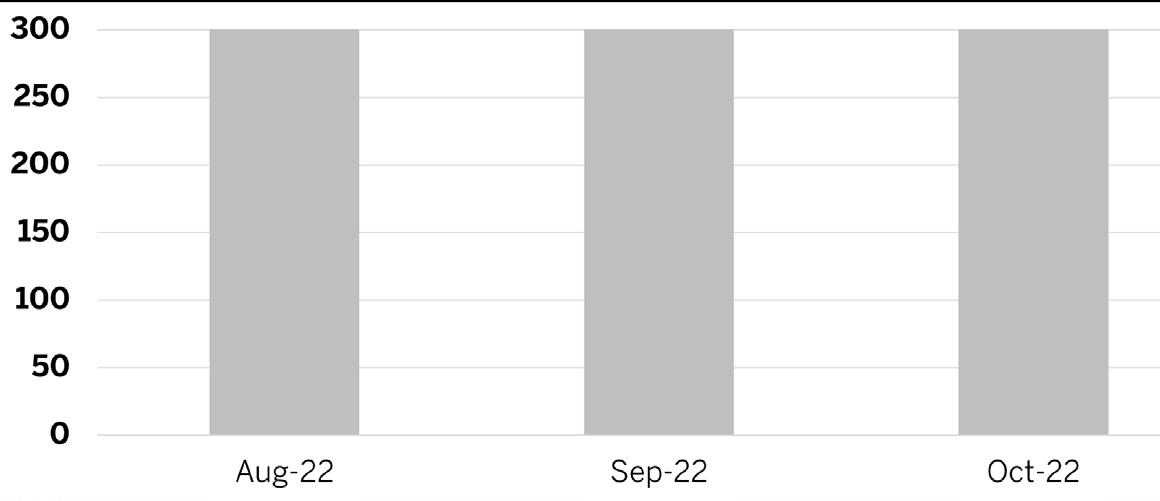
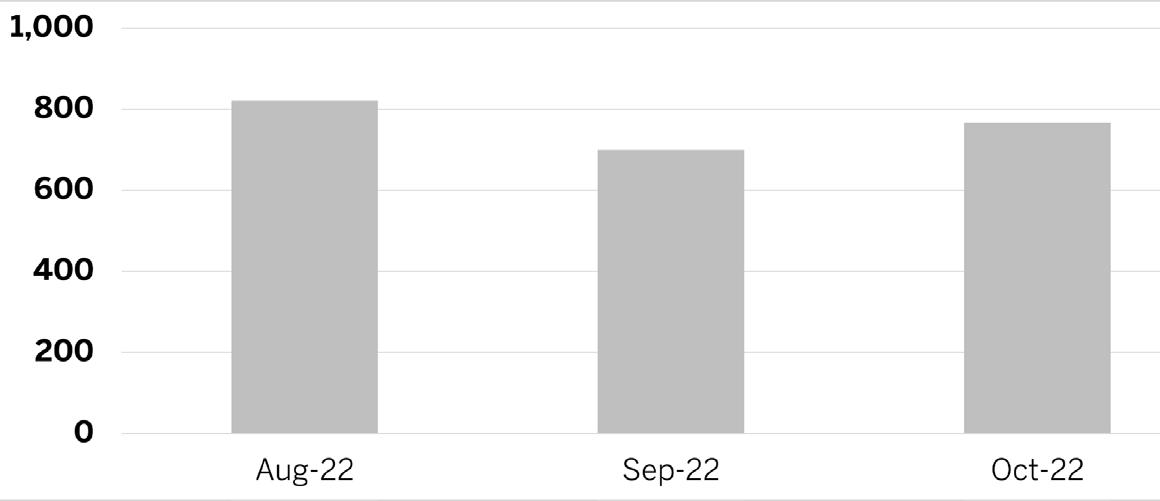
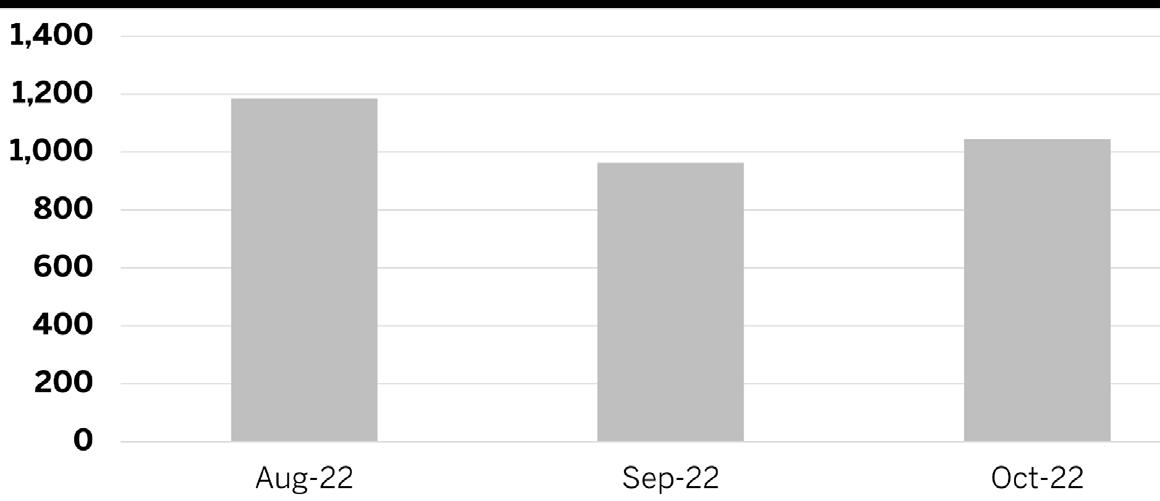
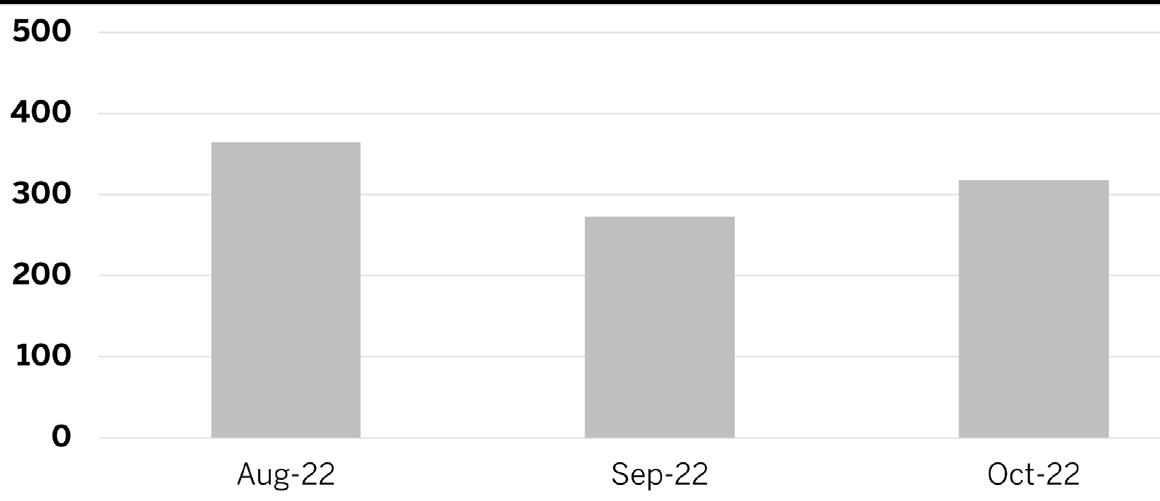
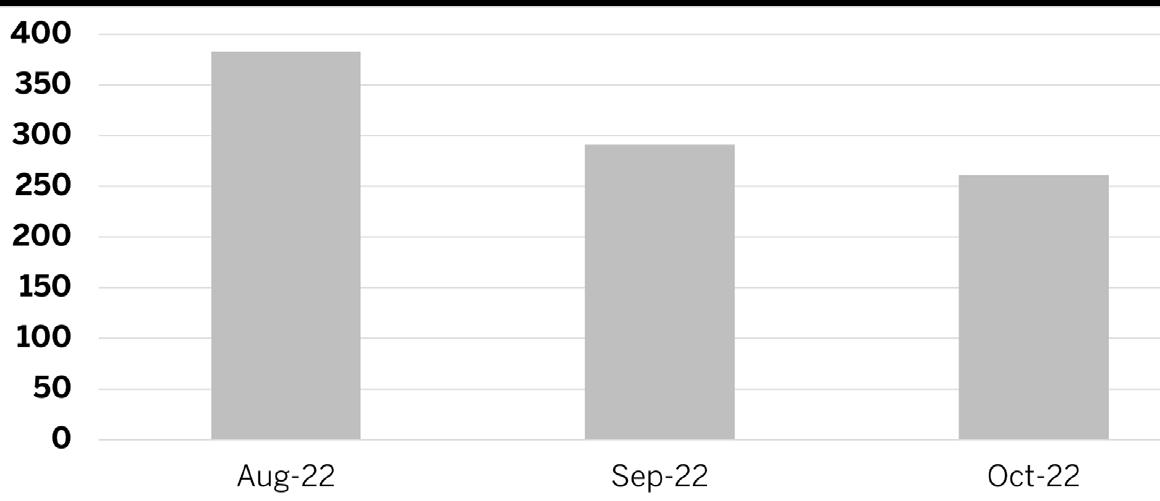
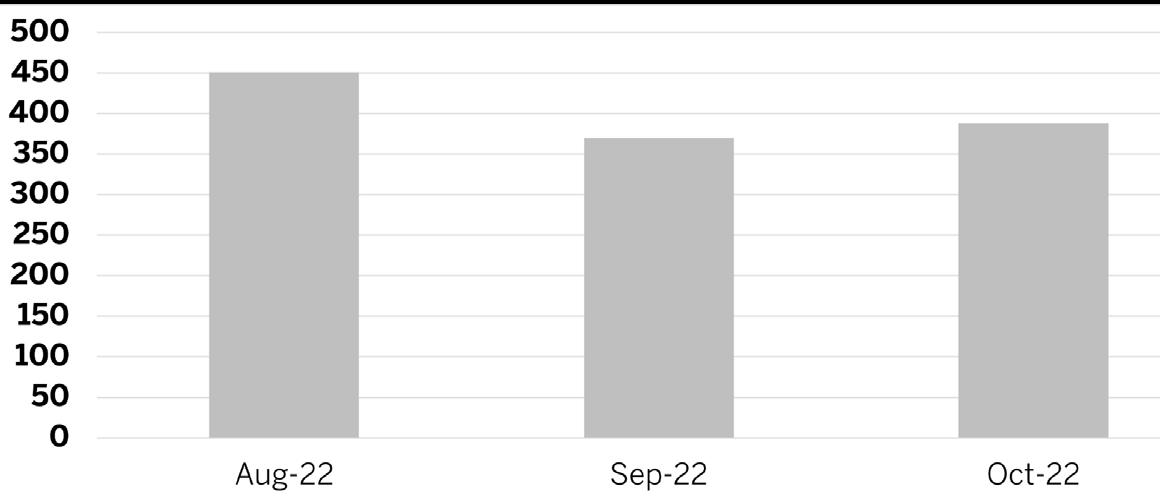
The number of homes and condos available for sale increased for the seventh-consecutive month in October, reaching nearly 31,000 homes. Since the beginning of the year, active listings have increased by more than 40%. Despite this rapid increase, fewer homes are available today than at any point in 2015 through 2020, underscoring that high inventory is not an issue for the Florida East Coast housing market.
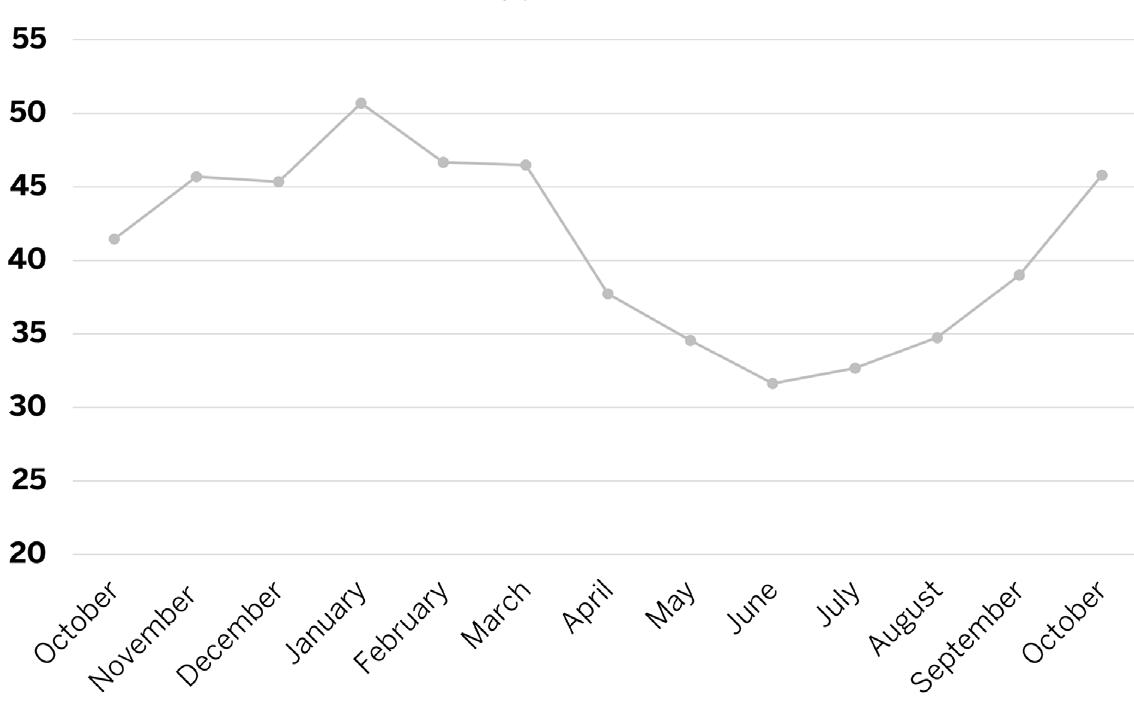
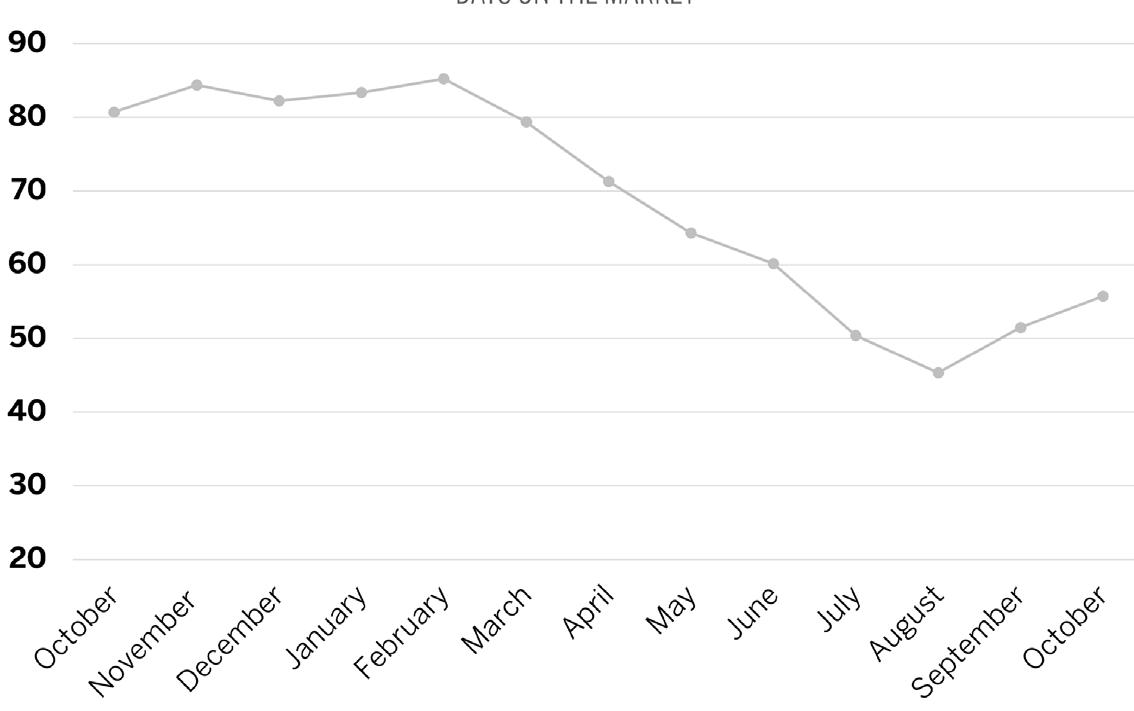
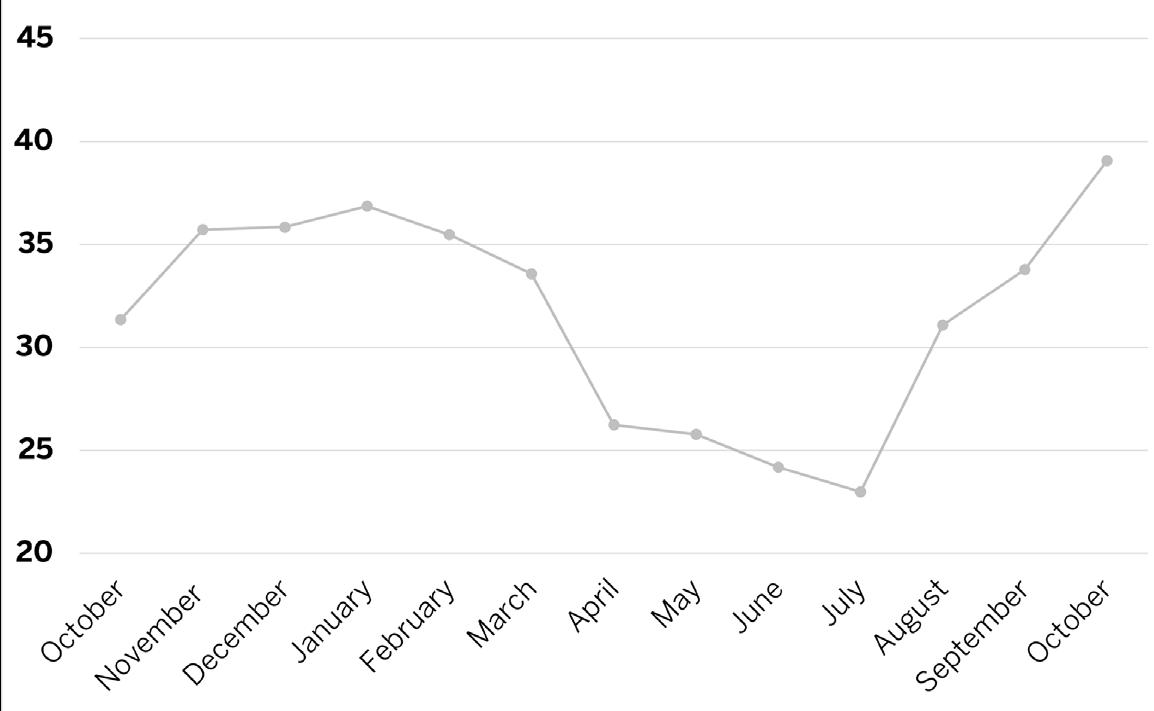
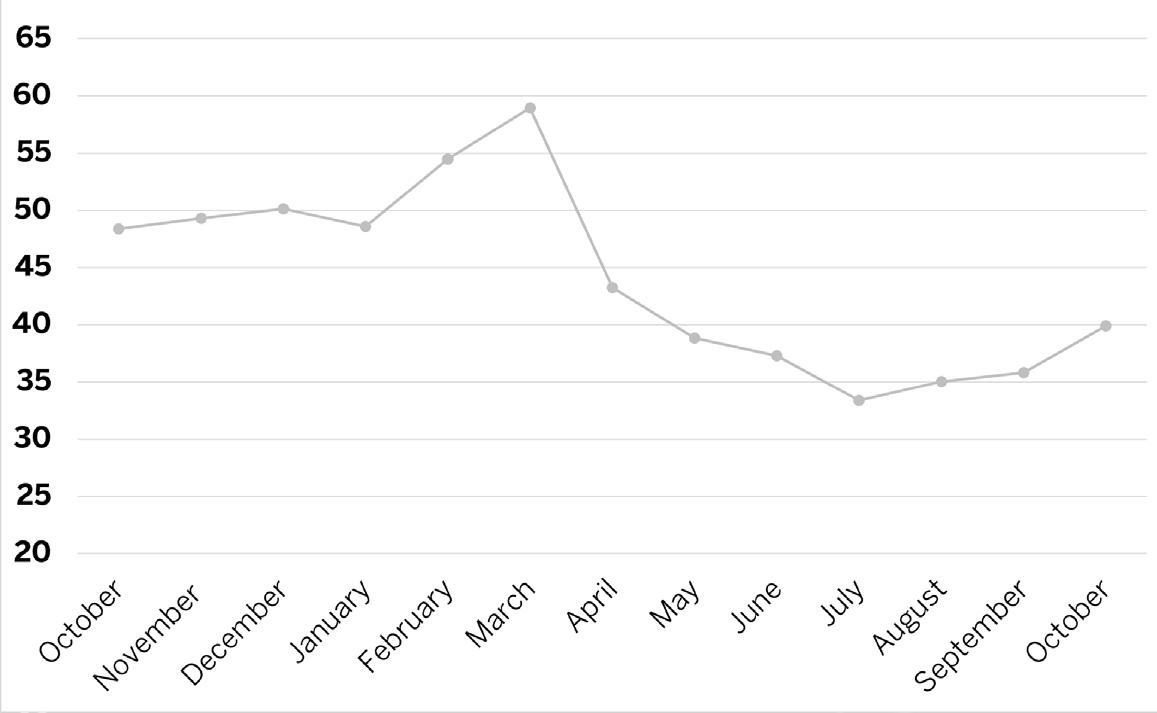
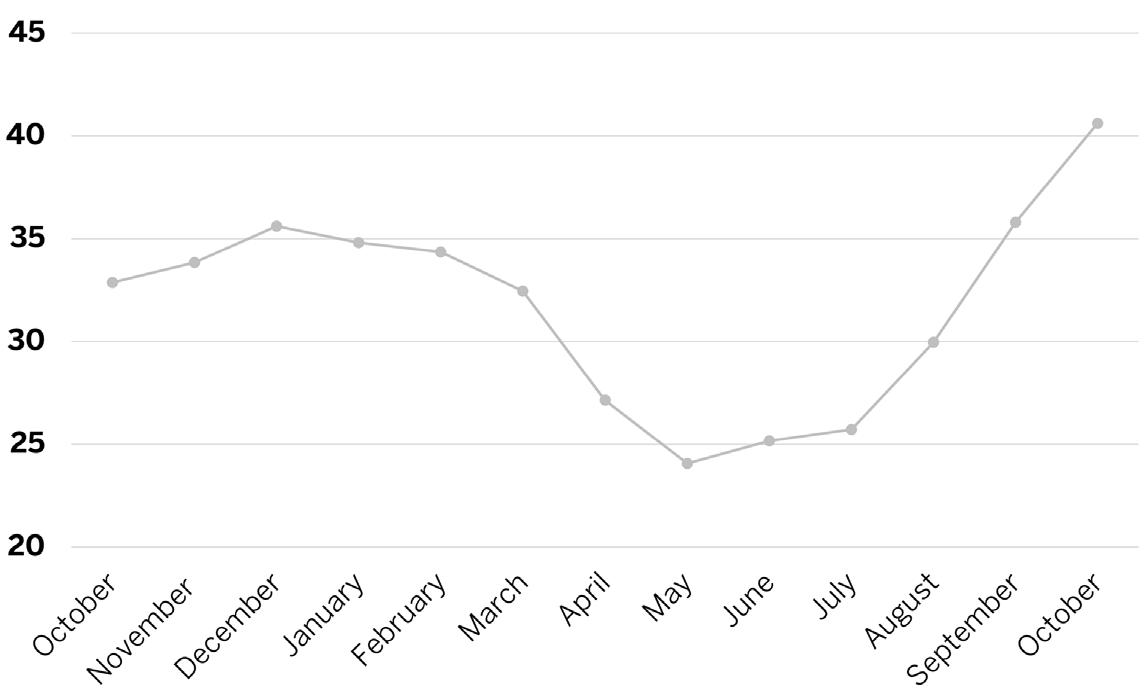
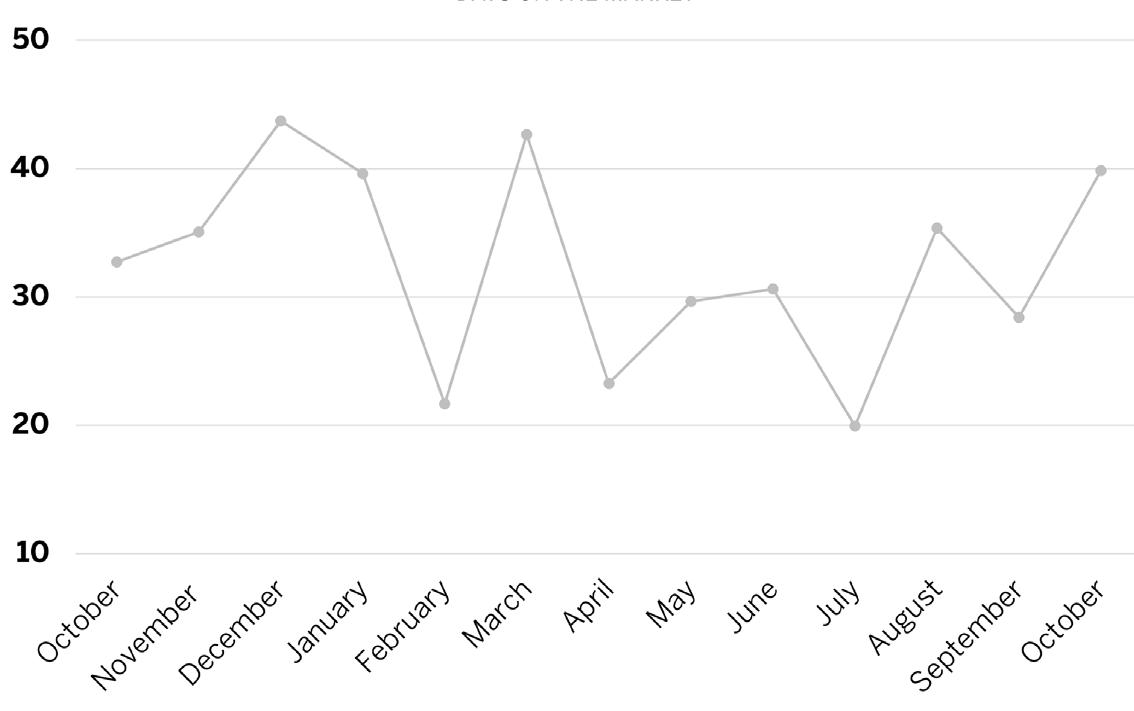
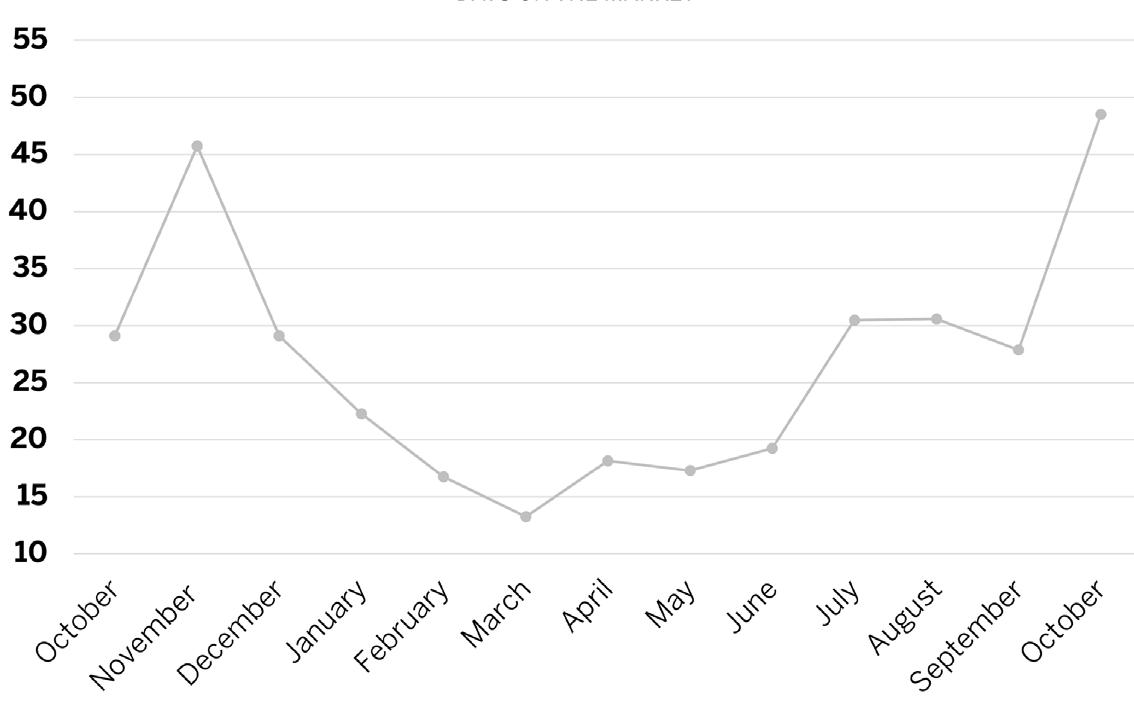
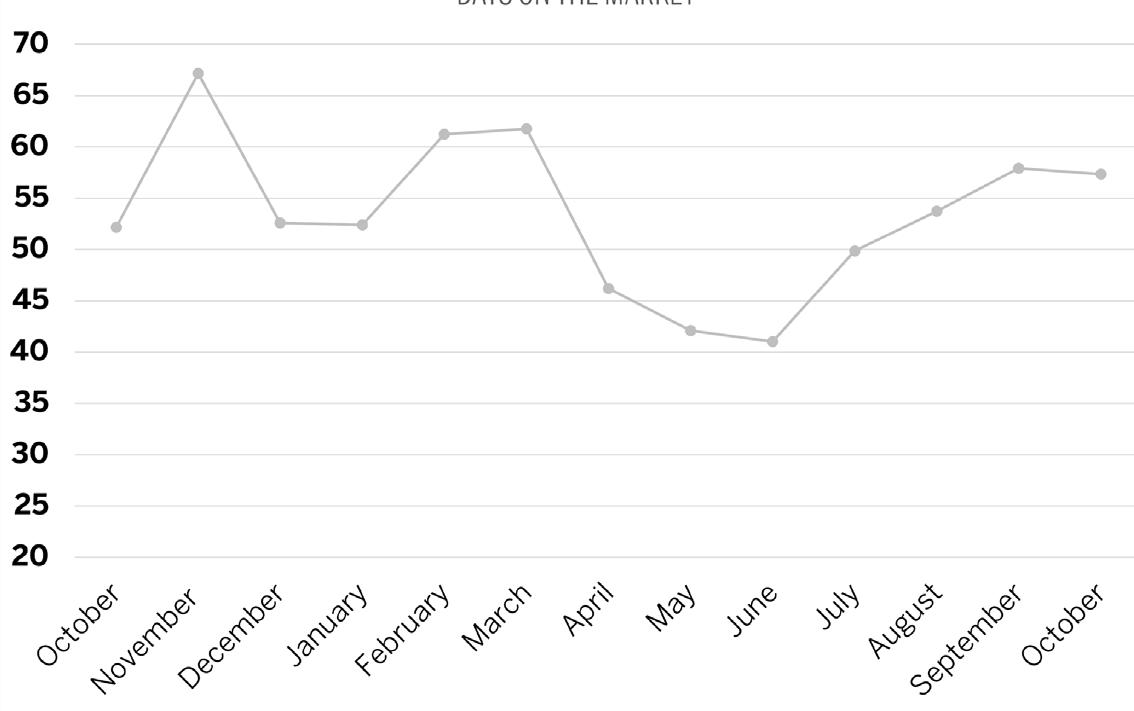
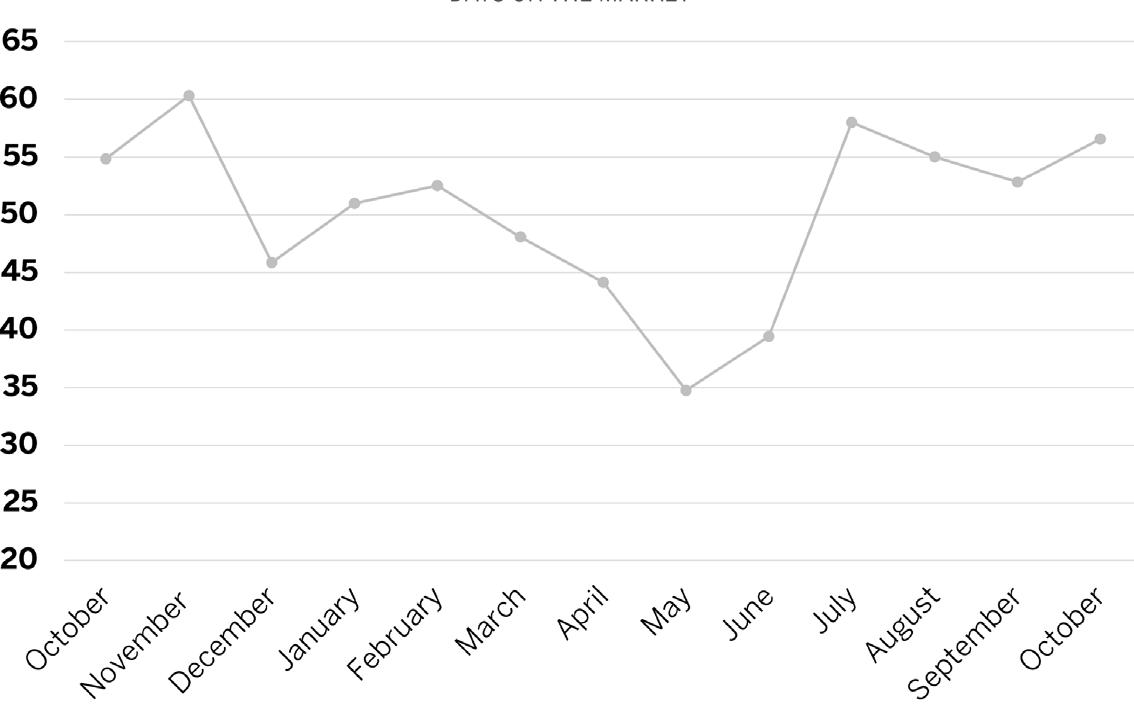
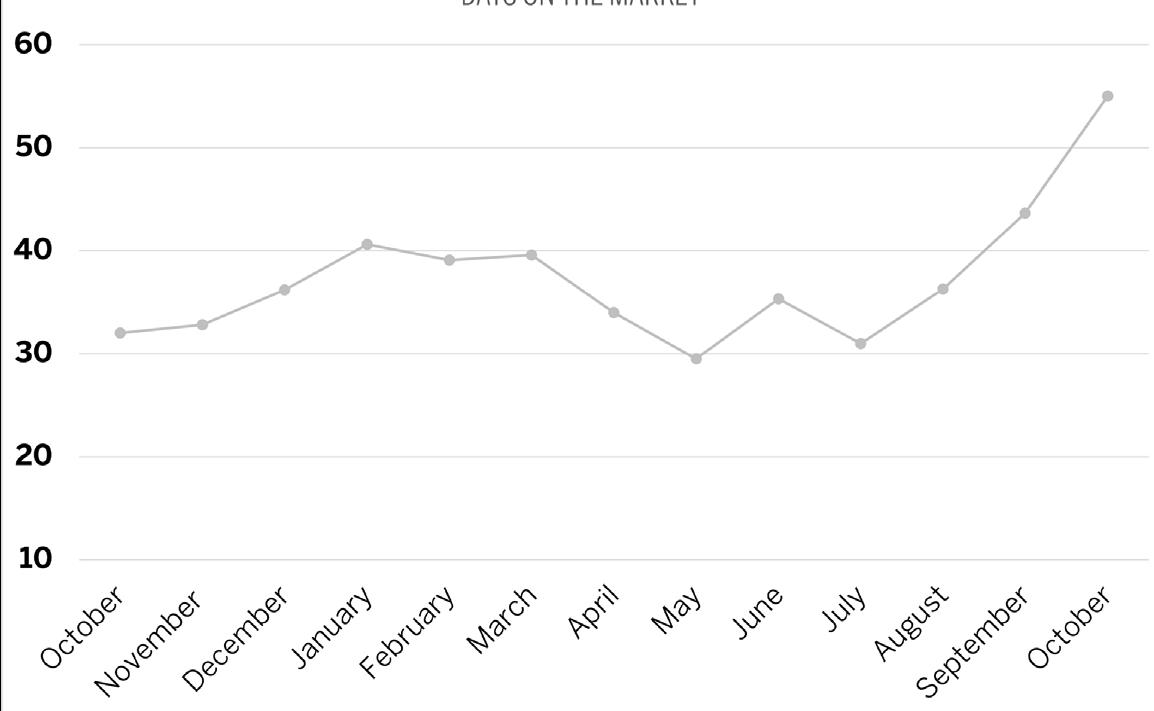
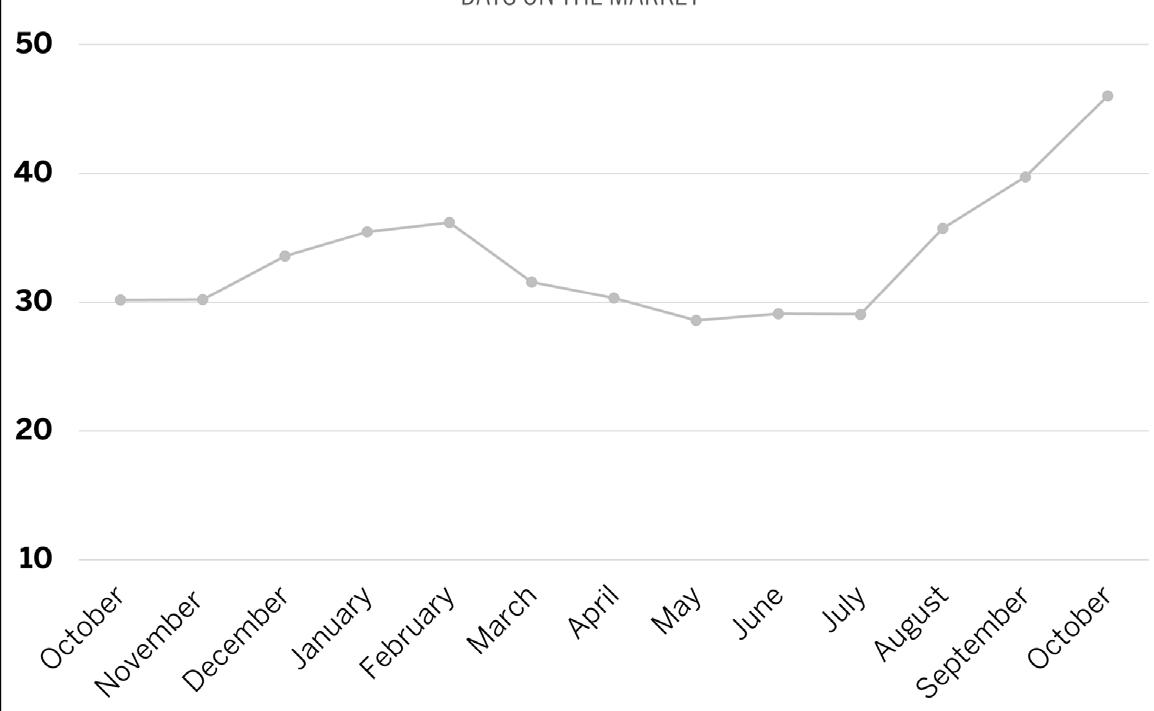
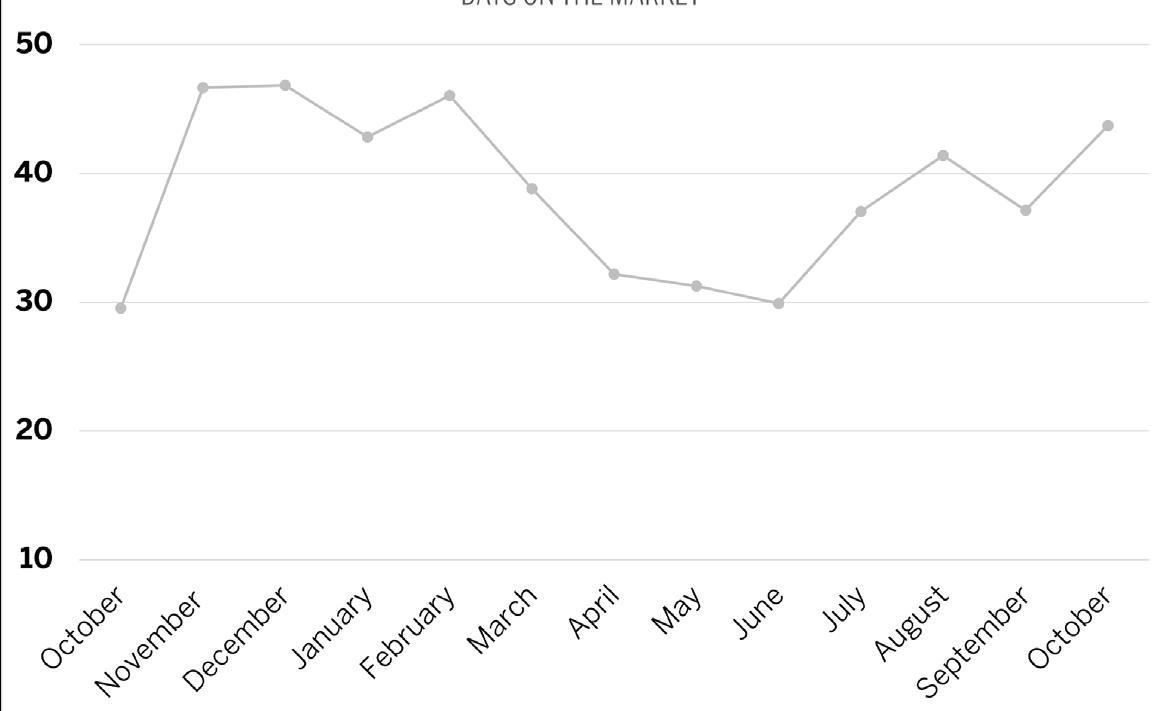
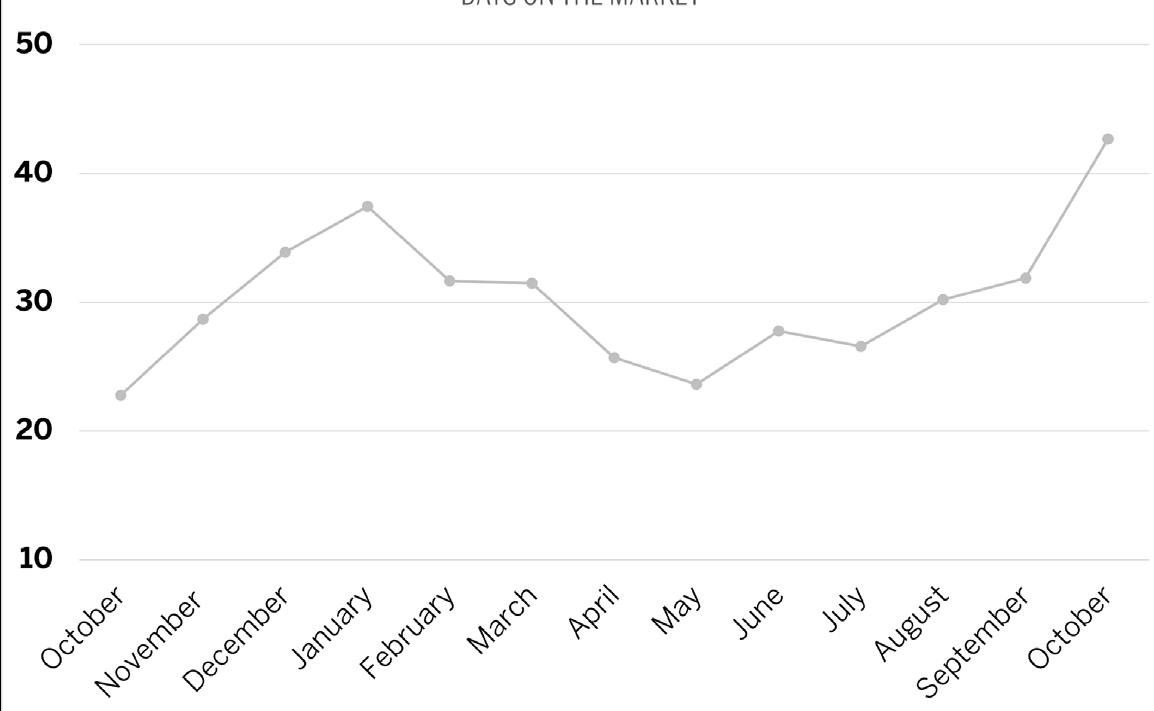
Based on October transactions, the average sold condominium unit was on the market for nearly seven weeks


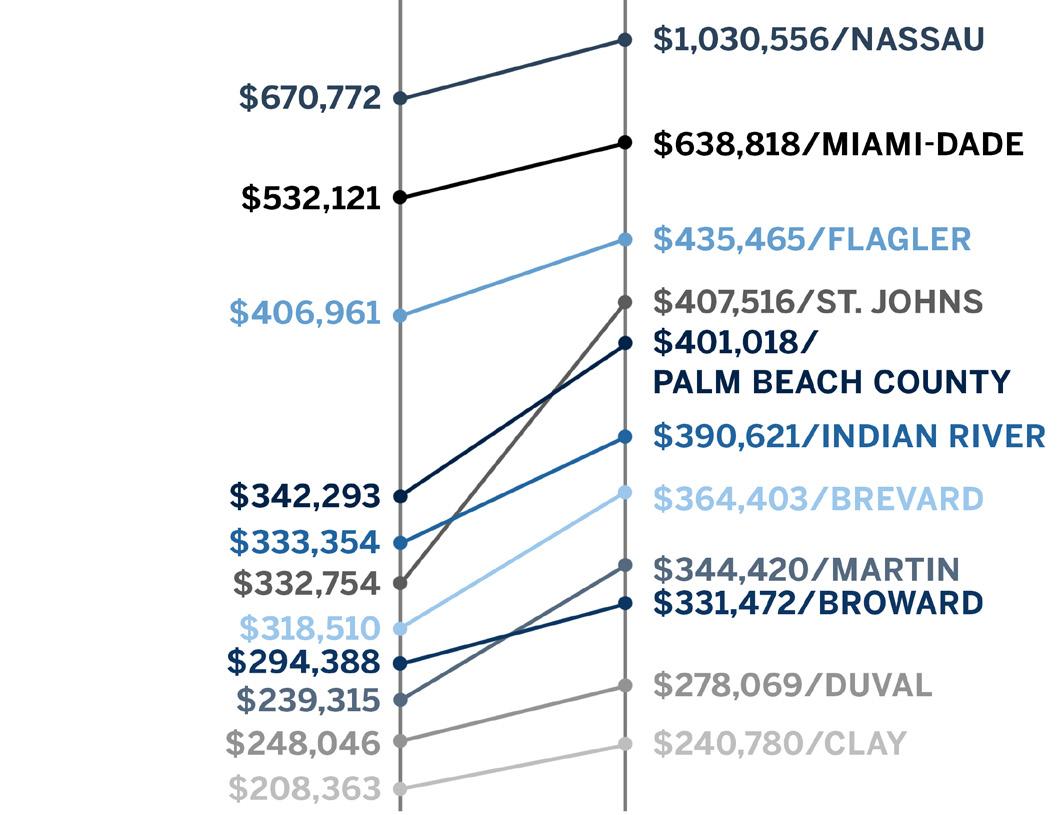
AVERAGE SALES PRICE BY COUNTY
FLORIDA’S EAST COAST
SINGLE FAMILY HOMES CONDOMINIUMS OCT 2021 OCT 2022 OCT 2021 OCT
2022
NOV 2022
while the average single-family home spent six weeks available for sale. An average time on the market of fewer than two months generally indicates a seller’s market and, condominiums and single-family homes are still selling more quickly than in 2021.
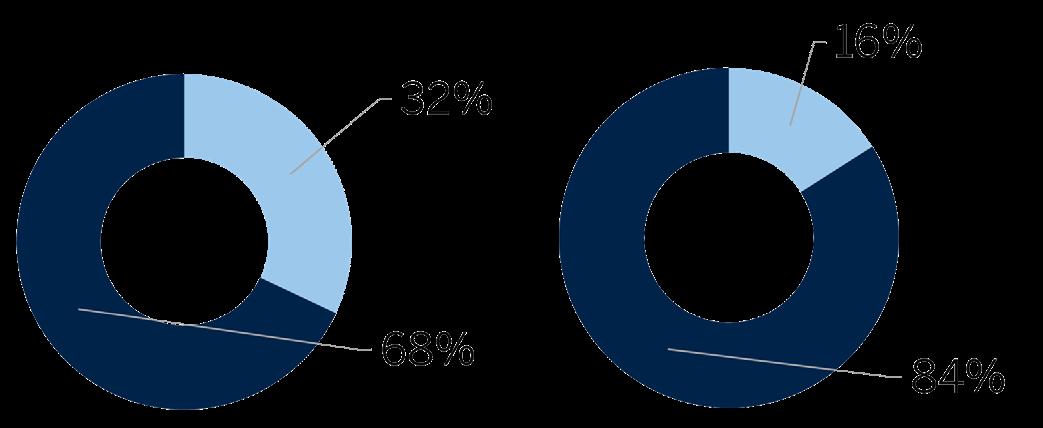
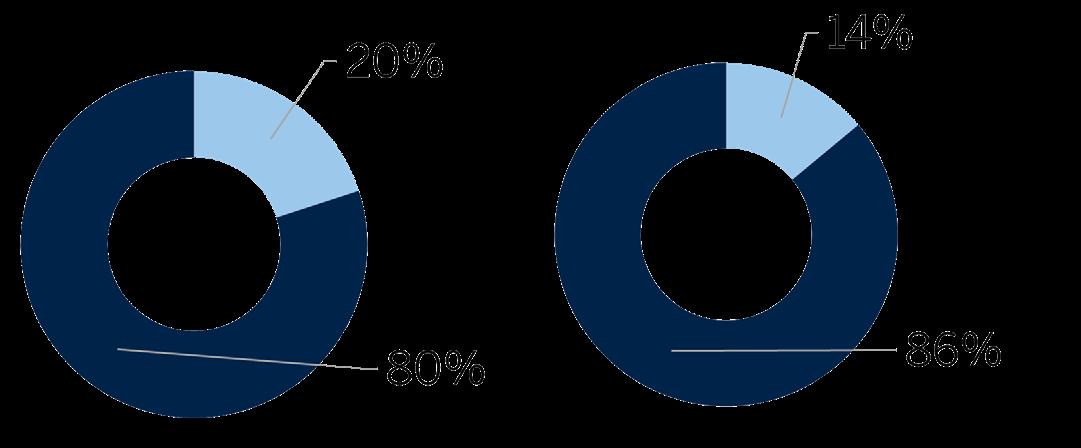
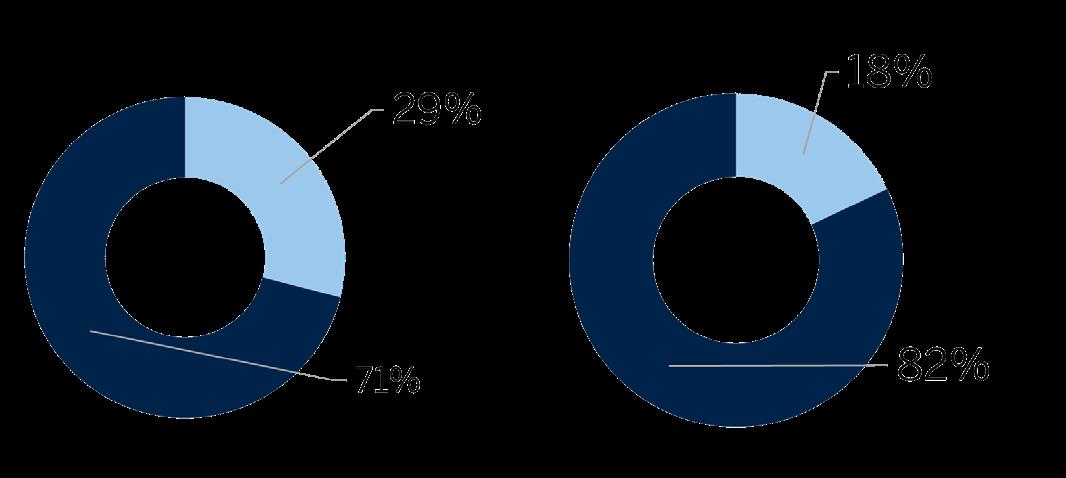
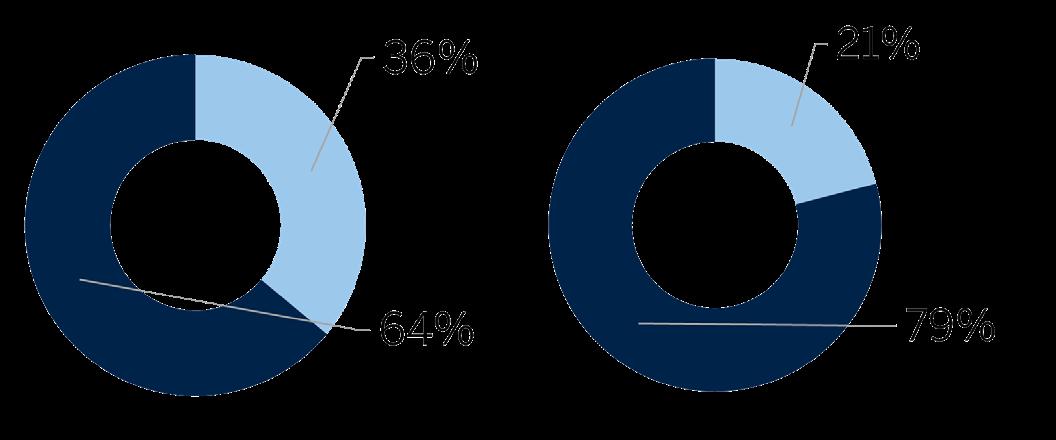
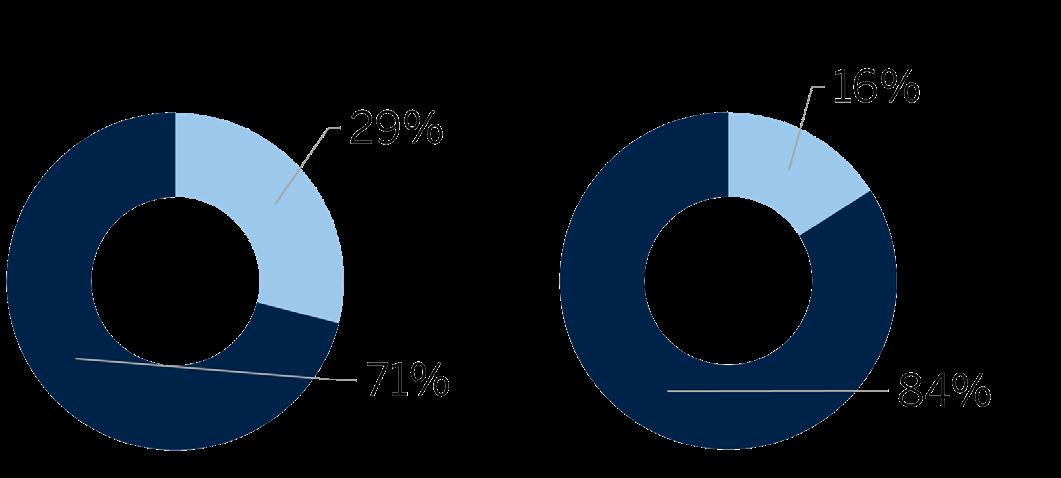
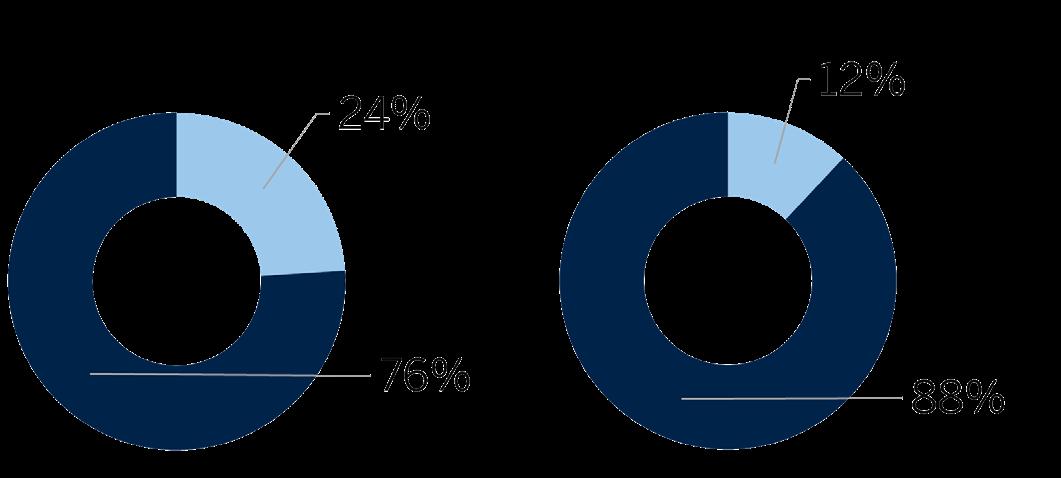
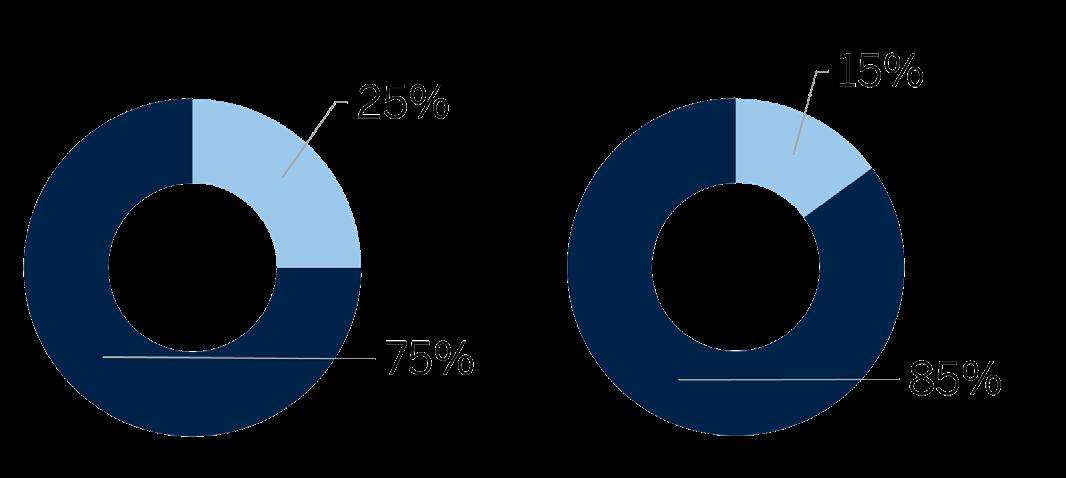
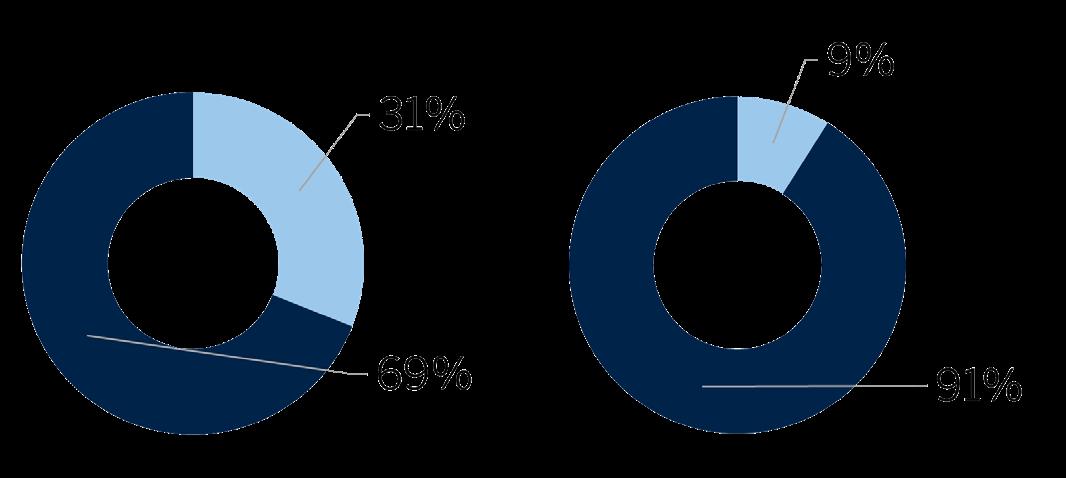
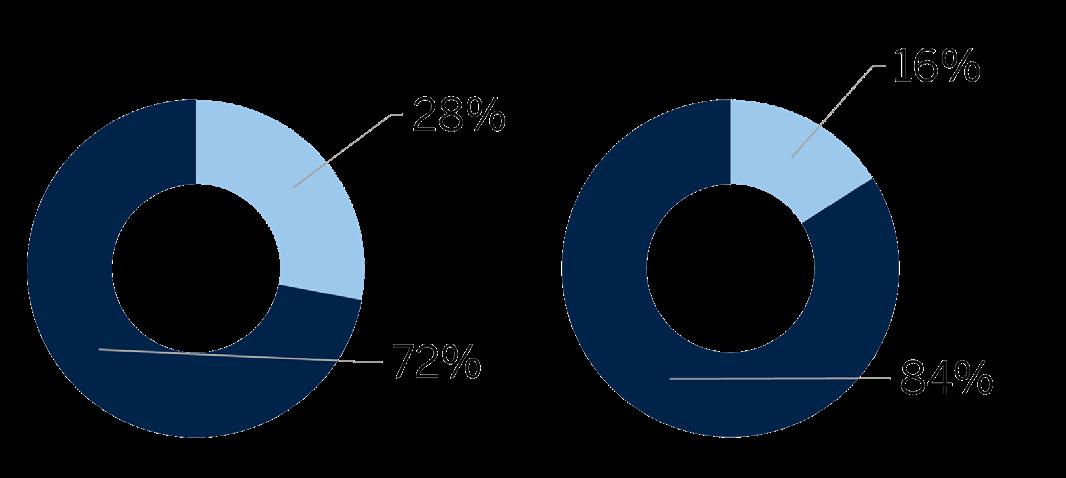
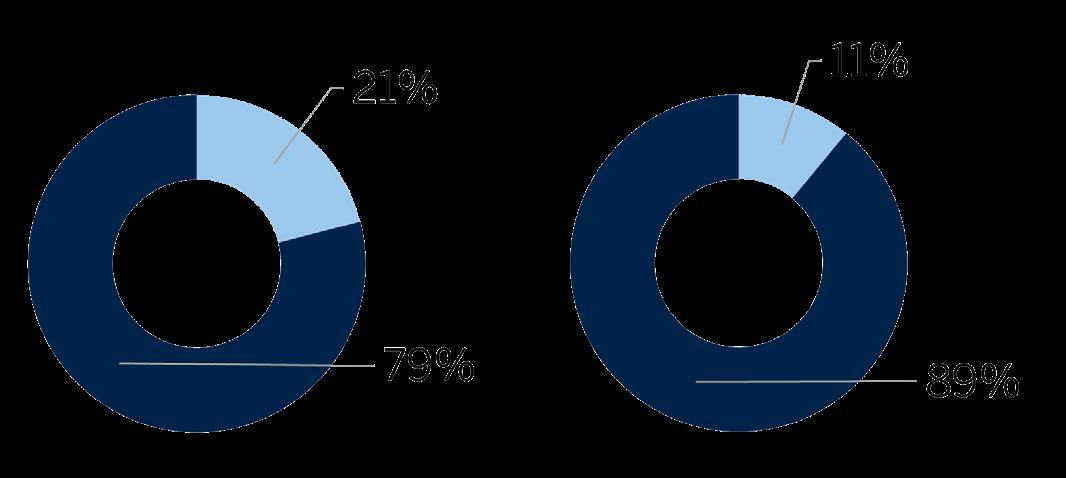
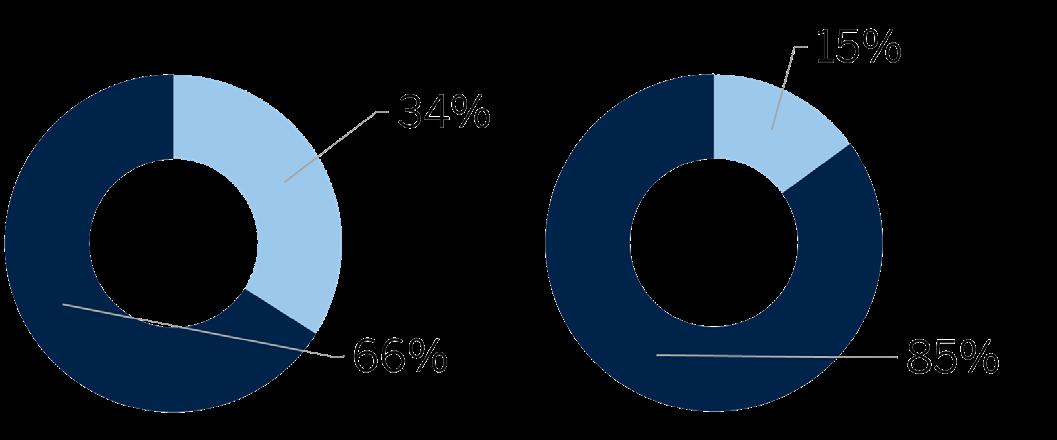
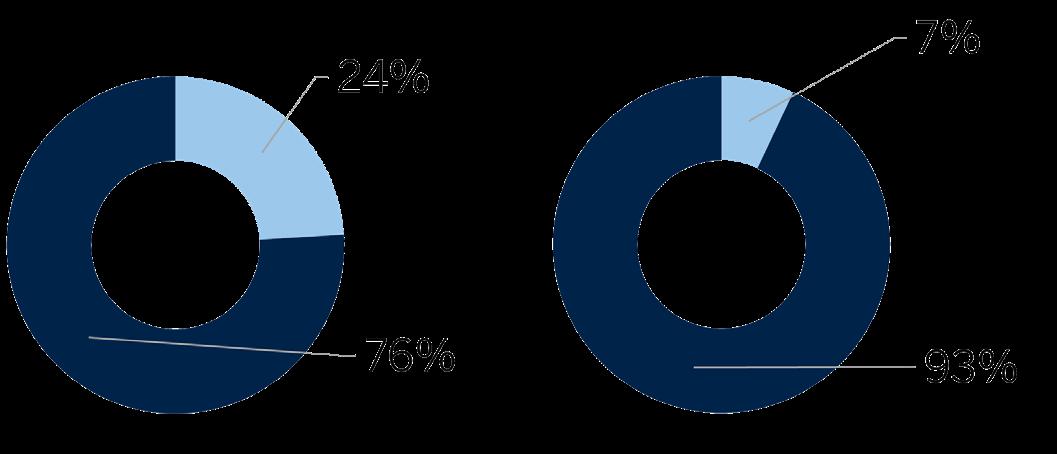
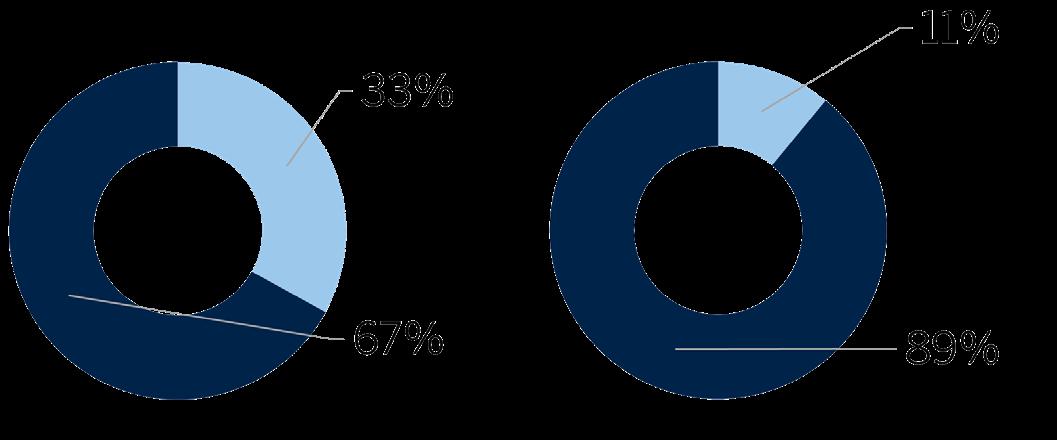
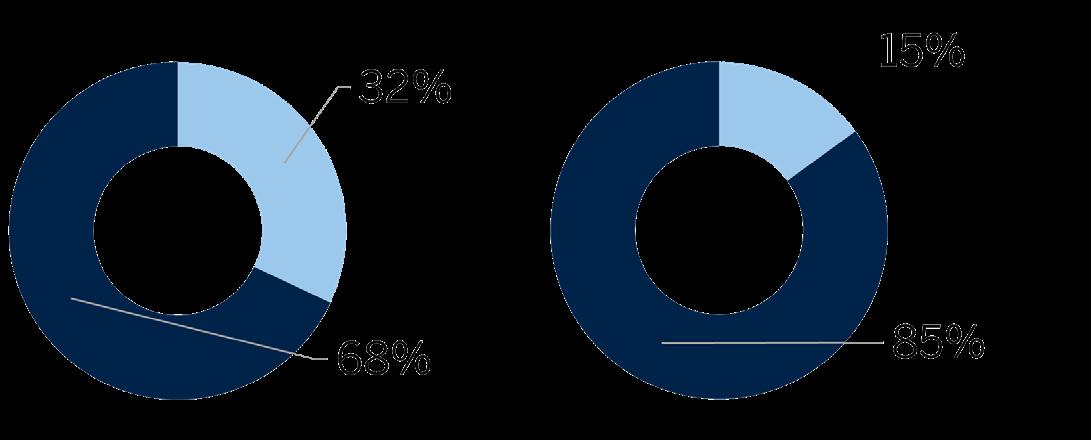
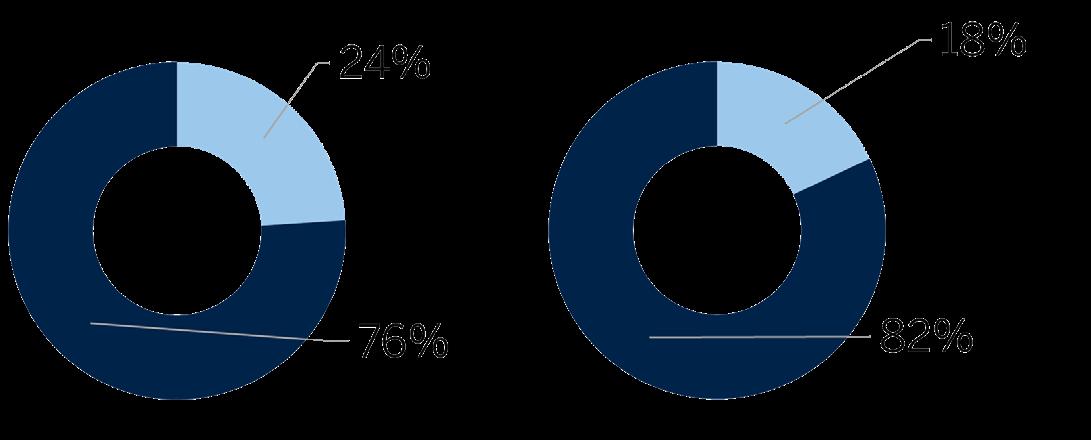
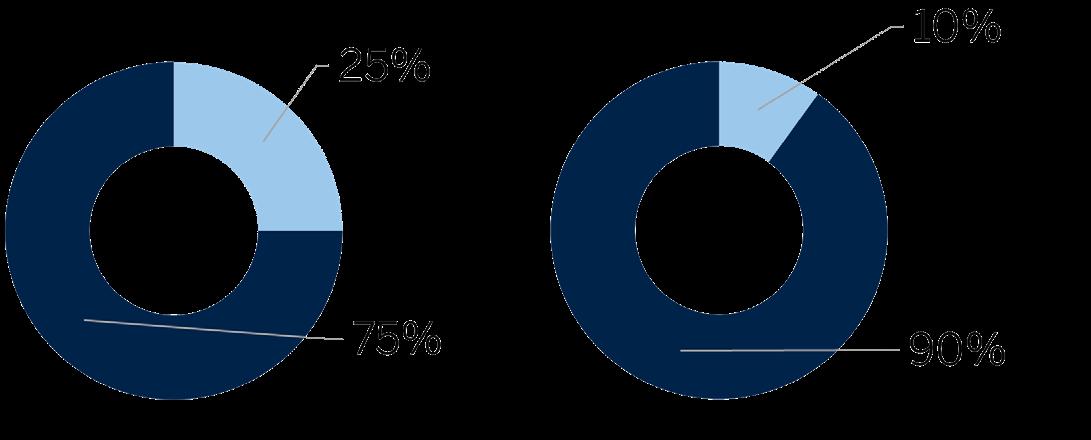
By October, 15% of homes closed during the month did so above the list price. By property type, slightly more single-family homes than condominiums closed above the list price, but the margin shrunk to just two percentage points in October.
Higher mortgage rates will likely continue to constrain affordability for entry-level buyers and lock in some existing homeowners into their current mortgages. In the near term, excess supply is not expected to be an issue and pricing should be resilient, particularly compared with high-growth cities throughout the Sun Belt.
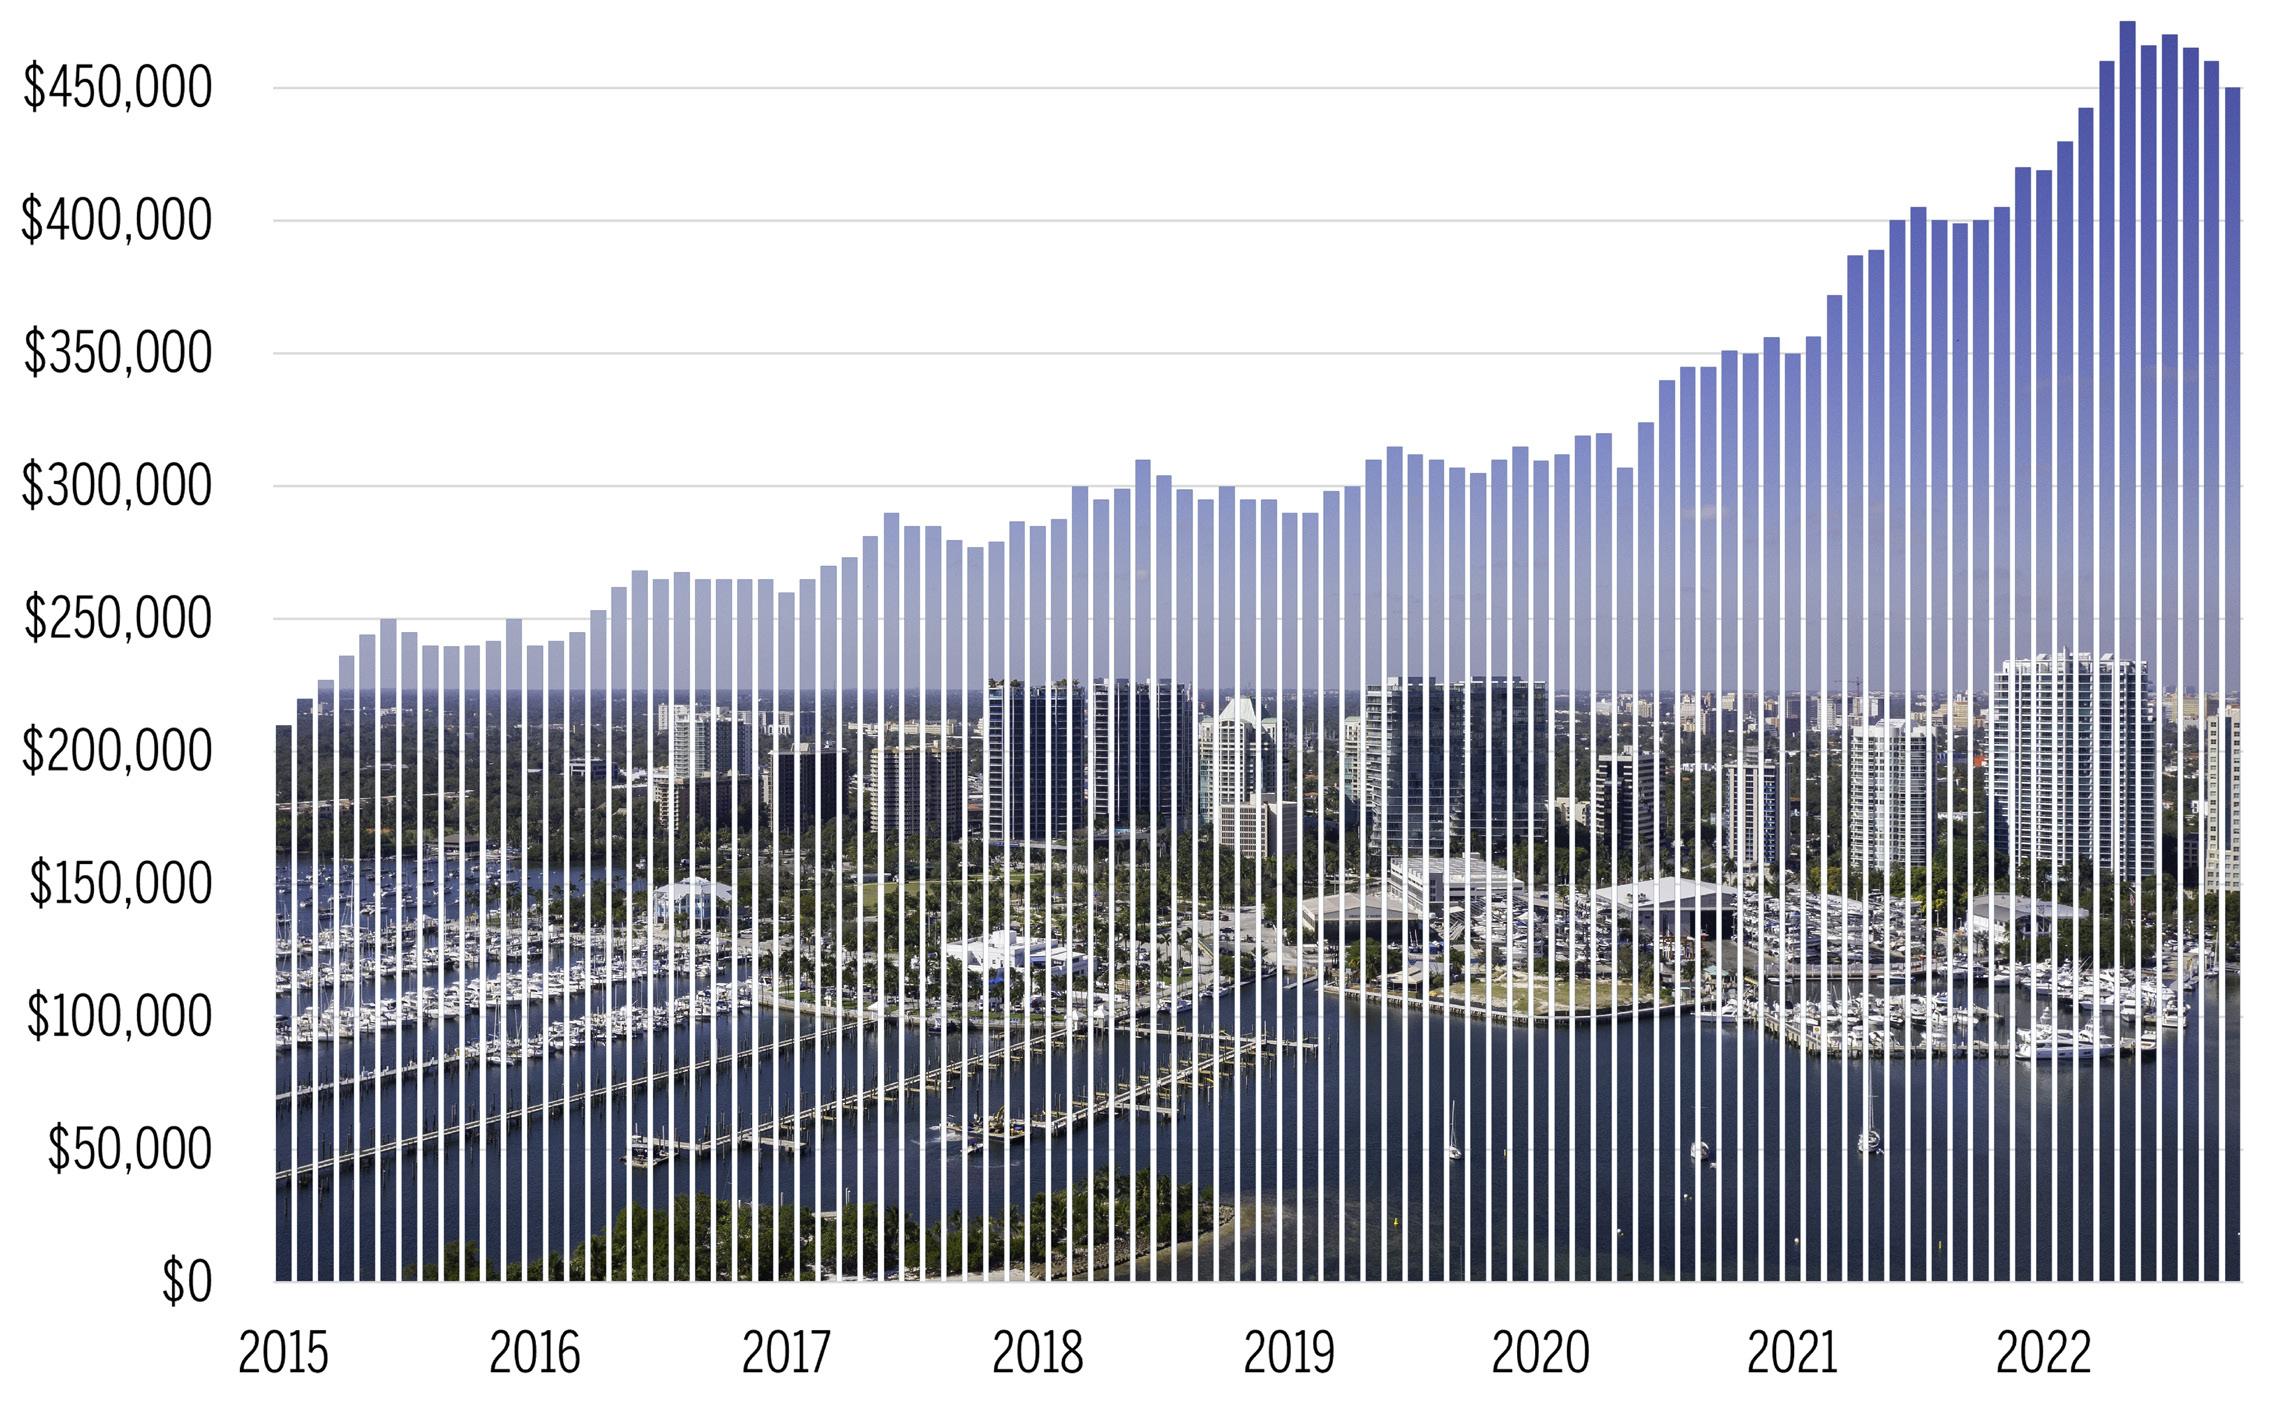
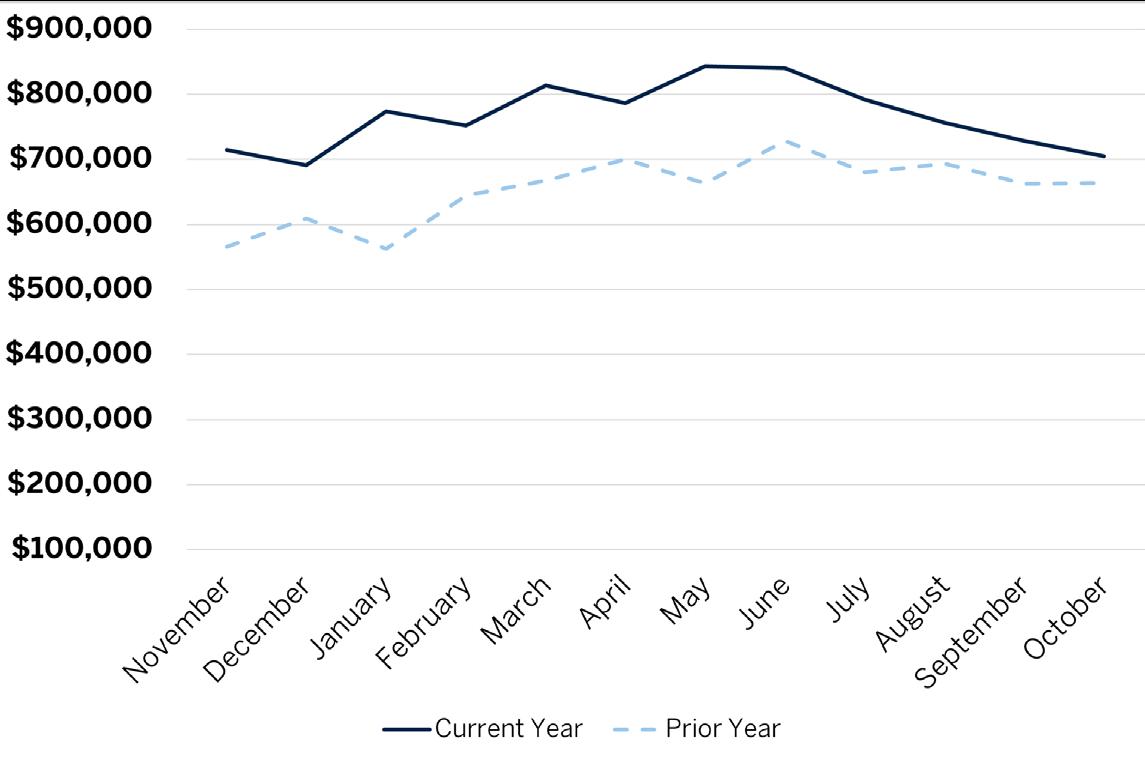
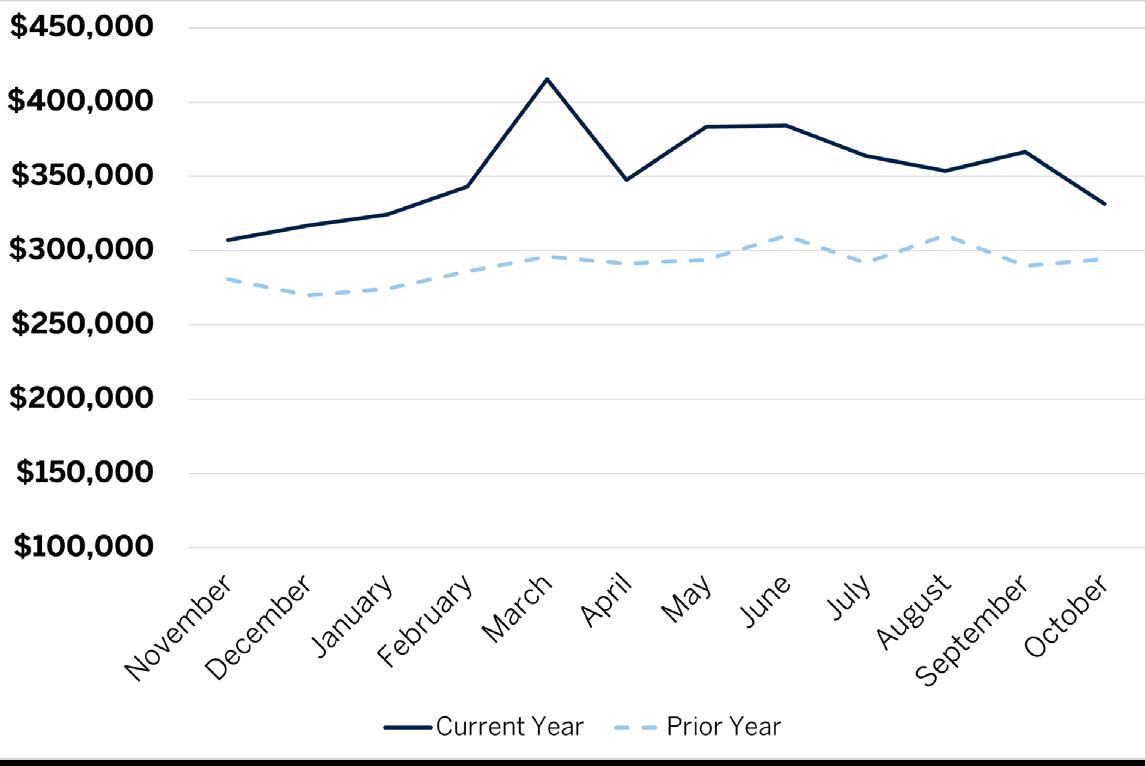
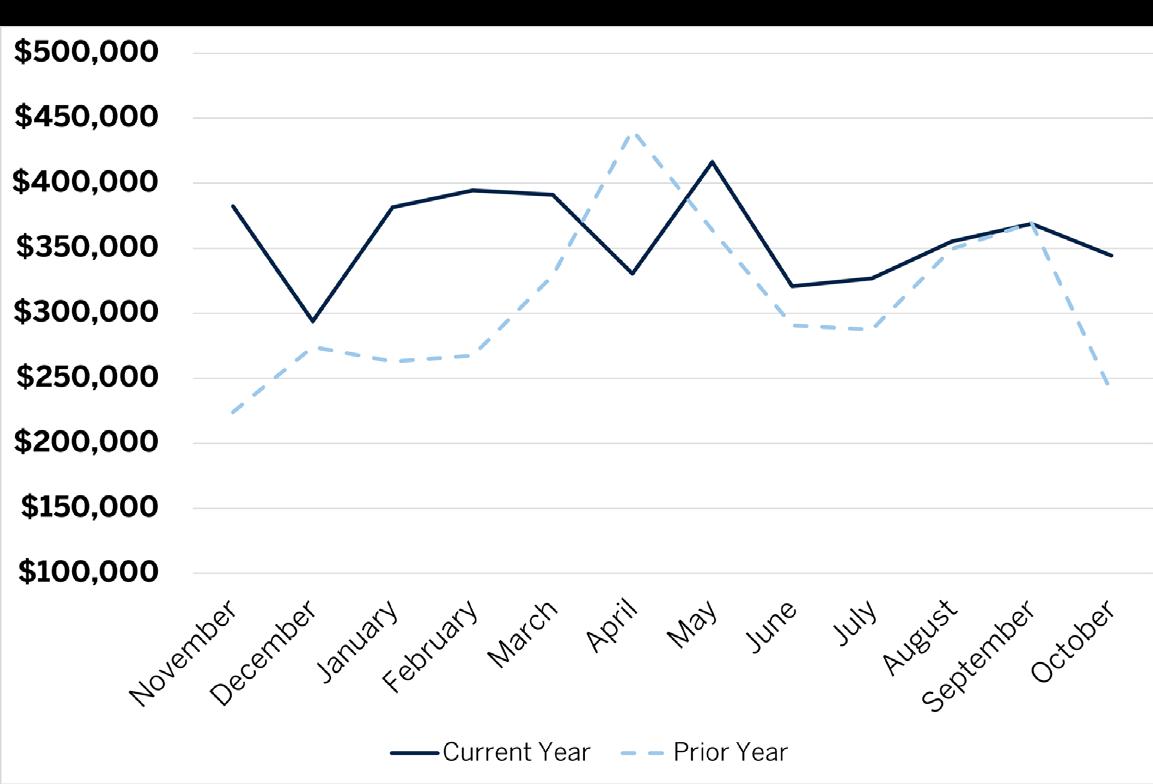
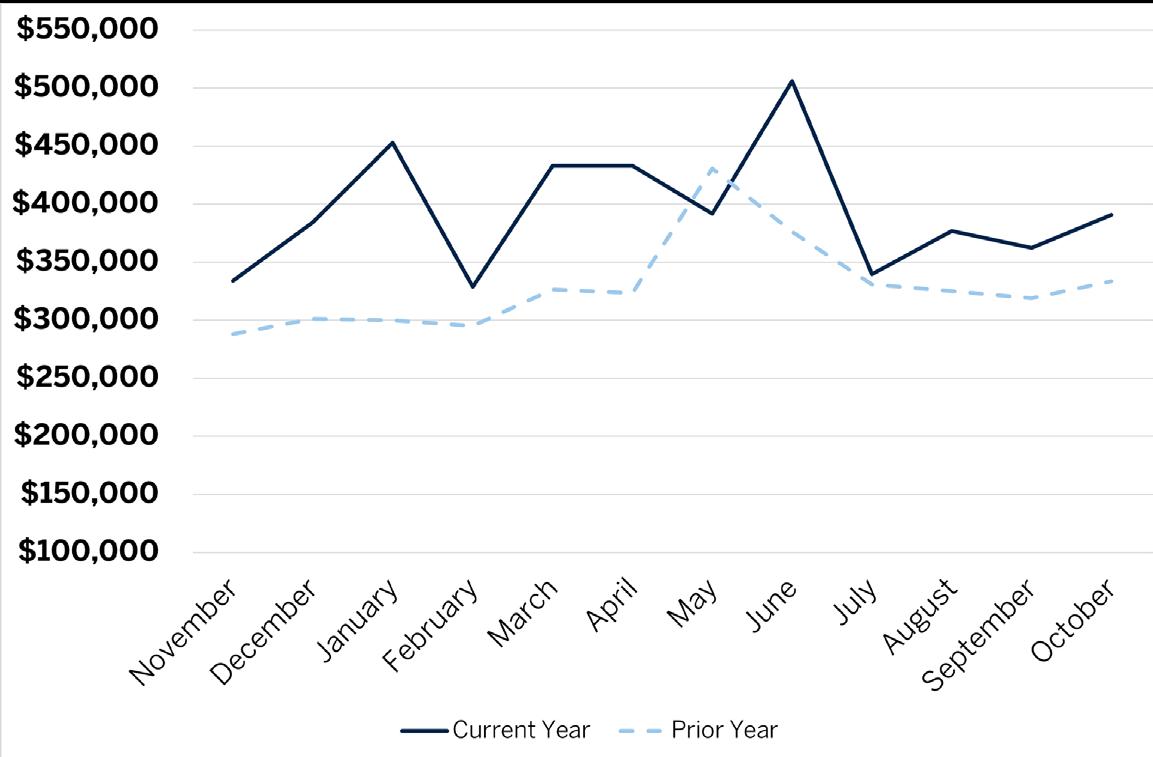
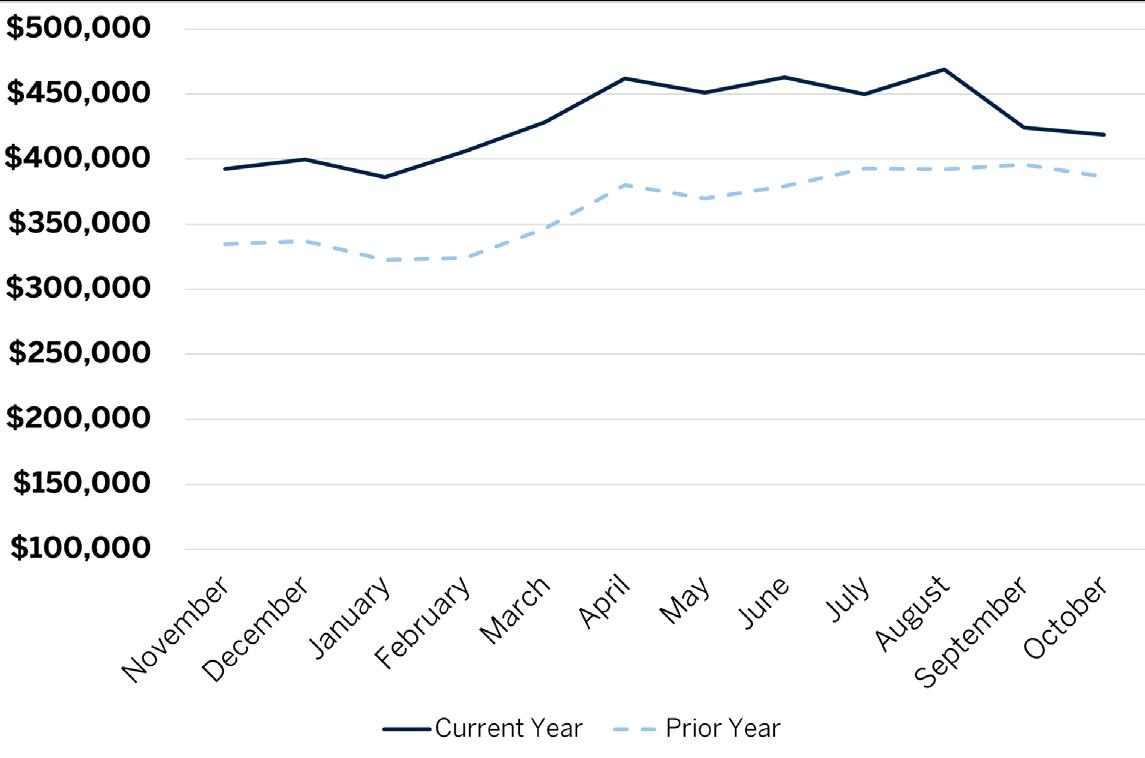
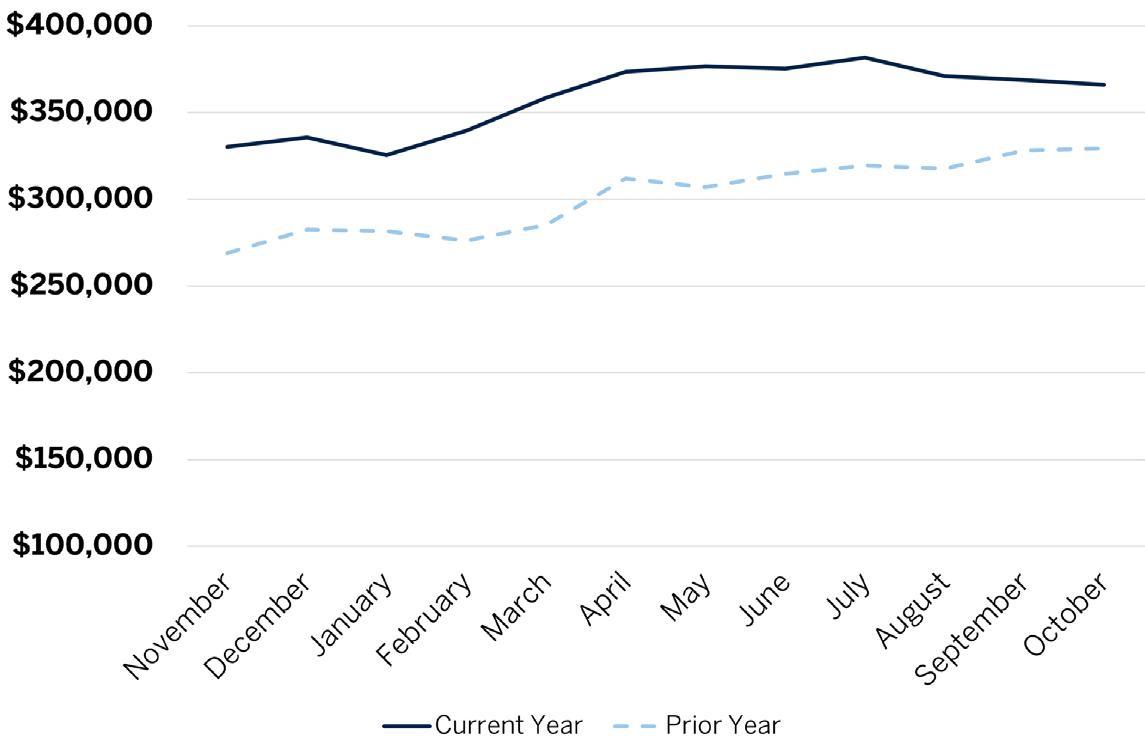
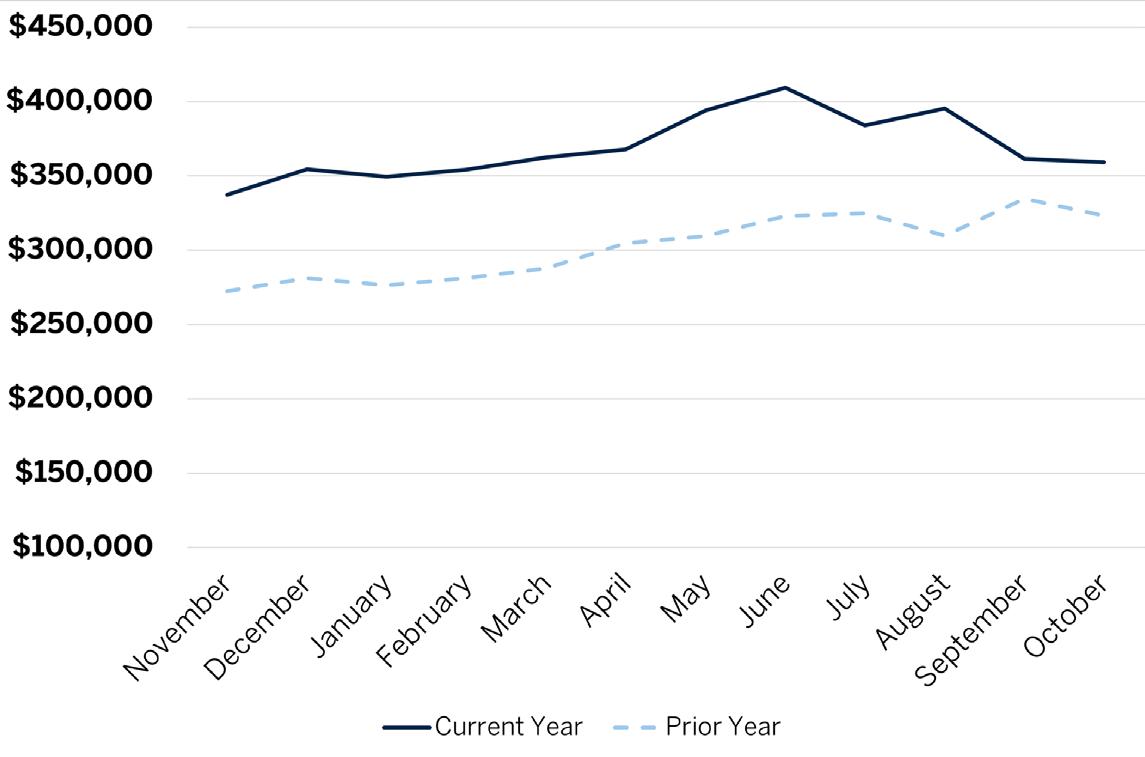
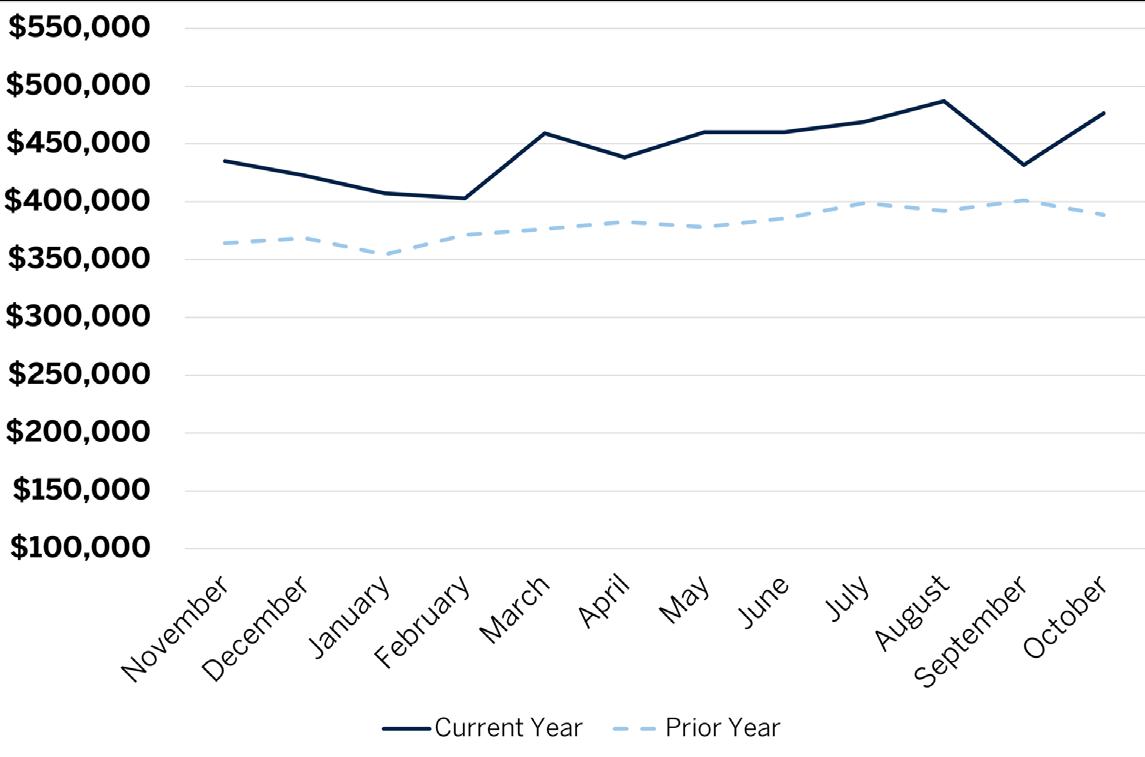
MEDIAN SALES PRICE
FLORIDA’S EAST COAST $450,000 2%
THE REAL ESTATE MARKET ALONG FLORIDA’S
EAST COAST
MIAMI-DADE COUNTY
SINGLE FAMILY HOMES 4,125 7% $580,000 16% $995,479 14% $424 15% 857 -23% $26,000,000 CONDOS 6,500 4% $387,259 18% $638,818 20% $468 21% 1,144 -33% $16,660,000
BREVARD COUNTY
SINGLE FAMILY HOMES 1,755 14% $362,918 10% $418,610 8% $222 11% 790 -21% $3,395,000 CONDOS 350 10% $325,000 30% $364,403 14% $262 11% 135 -27% $1,220,000
BROWARD COUNTY
SINGLE FAMILY HOMES 3,670 10% $545,000 11% $704,519 6% $340 13% 972 -26% $17,000,000 CONDOS 3,604 7% $257,000 14% $331,472 13% $266 20% 1,139 -22% $4,100,000
INDIAN RIVER COUNTY
SINGLE FAMILY HOMES 730 7% $375,000 11% $492,482 8% $249 9% 176 -12% $3,093,139 CONDOS 229 10% $260,000 6% $390,621 17% $264 25% 73 -26% $1,800,000
MARTIN COUNTY
SINGLE FAMILY HOMES 203 13% $654,500 10% $960,196 31% $340 16% 54 -25% $9,000,000 CONDOS 117 22% $300,000 50% $344,420 44% $264 29% 47 -10% $975,000
PALM BEACH COUNTY
SINGLE FAMILY HOMES 3,869 8% $617,000 18% $995,650 16% $370 19% 904 -30% $25,750,000 CONDOS 2,876 12% $300,000 23% $401,018 17% $236 21% 842 -33% $8,250,000
CLAY COUNTY
RESIDENTIAL 318 16% $345,000 9% $359,295 11% $190 13% 298 -344% $735,000
DUVAL COUNTY
NASSAU COUNTY
RESIDENTIAL 261 -10% $428,990 14% $701,191 55% $283 26% 305 -18% $13,350,000
ST. JOHNS COUNTY
RESIDENTIAL 767 10% $485,240 13% $623,584 24% $289 19% 790 -22% $8,600,000
NOV 2022
OCT 22 CHANGE FROM PRIOR MONTH OCT 22 YOY% CHANGE OCT 22 YOY% CHANGE OCT 22 YOY% CHANGE OCT 22 YOY% CHANGE OCT 22
RESIDENTIAL 1,232 7% $309,000 9% $365,955 11% $202 12% 1,243 -37% $4,186,250
FLAGLER COUNTY RESIDENTIAL 388 5% $363,990 10% $476,669 23% $239 17% 364 -15% $3,299,000
FOR SALE MEDIAN SALES PRICE AVG SALES PRICE PRICE PER SF CLOSED TRANSACTIONS HIGHEST SALES
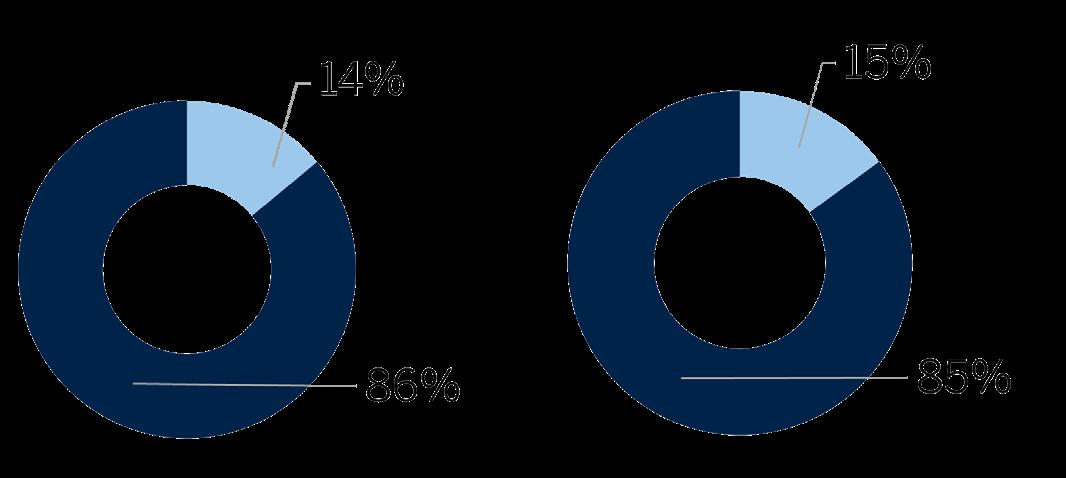
↑1 3% ↑ 8% ↑ 16% ↑ 10% ↑ 16% ↑ 8% ↑ 5% ↑ 10% ↓ 10% ↑ 8% ↑ 5% OCT 2021 OCT 2022 SINGLE FAMILY HOMES CONDOMINIUMS SOLD ABOVE LISTED PRICE FLORIDA’S EAST COAST ABOVE LISTING PRICE AT LISTING PRICE OR LOWER OCT 2021 OCT 2022 AVAILABLE INVENTORY FLORIDA’S EAST COAST SINGLE FAMILY HOMES AND CONDOMINIUMS Aug 2022 Sep 2022 Oct 2022
The official real estate partner of the
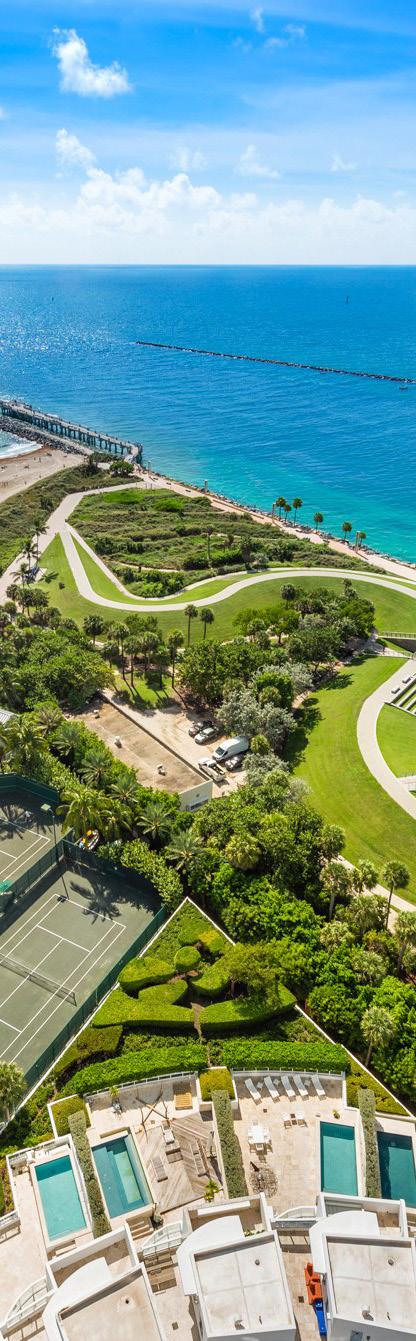
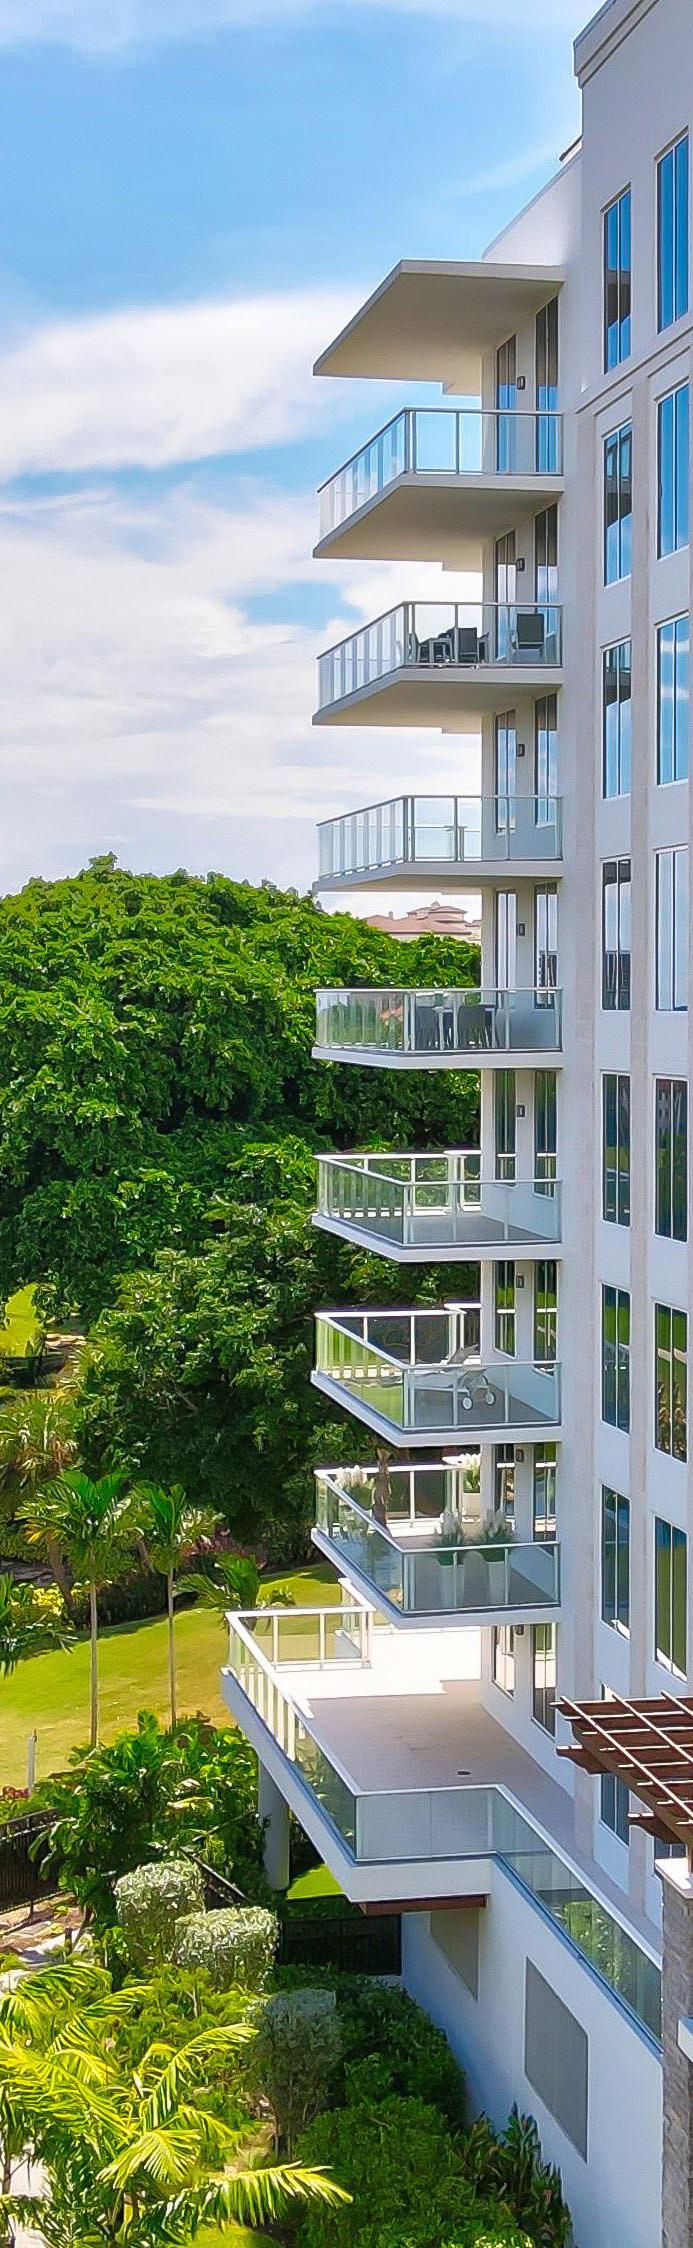
GROUNDED BY NATURE. UPLIFTED BY LIGHT. Designed by award-winning firm Rene Gonzalez Architects, Surf Row Residences features a collection of eight private beach homes offering light-filled interiors, the utmost privacy, and seamless indoor-outdoor living moments away from the Atlantic Ocean.
©2022 ONE Sotheby’s International Realty. All rights reserved. Sotheby’s International Realty® and the Sotheby’s International Realty Logo are service marks licensed to Sotheby’s International Realty A liates LLC and used with permission. ONE Sotheby’s International Realty fully supports the principles of the Fair Housing Act and the Equal Opportunity Act. Each franchise is independently owned and operated. Any services or products provided by independently owned and operated franchisees are not provided by, a liated with or related to Sotheby’s International Realty A liates LLC or any of its a liated companies. e information contained herein is deemed accu rate but not guaranteed. Oral representations cannot be relied upon as correctly stating the representations of the developer. For correct representations, reference should be made to the documents required by section 718.503, Florida Statutes, to be furnished by a developer to a buyer or lessee. Pricing subject to change without notice.

PRICED FROM $5.9M SCHEDULE A PRIVATE PREVIEW surfrow@onesothebysrealty.com 786.288.0874
Miami-Dade County
MODERATE BUYER COMPETITION
The share of homes sold above the asking price was 18% this month, a 39% decrease from the same time last year and a 24% decrease from last month.

AVERAGE SALES PRICE
DAYS ON MARKET
SINGLE-FAMILY HOMES
MIAMI-DADE COUNTY $995,479 $871,743 14% $424 15% 857 -23% 46
AVENTURA $4,293,750 $1,770,557 143% $933 69% 4 -43% 90
BAL HARBOUR N/A NA N/A N/A N/A - N/A N/A
BAY HARBOR ISLANDS $2,825,000 $5,500,000 -49% $1,977 116% 1 0% -
COCONUT GROVE $2,997,000 $3,058,000 -2% $1,084 42% 15 0% 65
CORAL GABLES $5,256,664 $2,153,457 144% $1,087 59% 14 -70% 43
FISHER ISLAND N/A N/A N/A N/A N/A - N/A N/A
GOLDEN BEACH N/A N/A N/A N/A N/A - N/A N/A
INDIAN CREEK N/A N/A N/A N/A N/A - N/A N/A
KEY BISCAYNE $4,120,625 $5,019,286 -18% $1,166 -19% 4 -43% 138
MIAMI $796,061 $646,490 23% $396 22% 434 -15% 46
MIAMI BEACH $7,554,231 $3,829,015 97% $1,415 55% 12 -63% 74
MIAMI SHORES $1,145,000 $993,001 15% $604 23% 11 -35% 46
NORTH BAY VILLAGE
N/A $2,555,000 N/A N/A N/A - N/A N/A
PINECREST $2,925,531 $2,354,091 24% $738 42% 16 -27% 57
SOUTH MIAMI $985,682 $1,480,783 -33% $558 8% 11 -27% 69
SUNNY ISLES BEACH
N/A N/A N/A N/A N/A - N/A N/A
SURFSIDE $3,902,500 $862,690 352% $1,424 161% 4 -20% 41
<$500,000 $409,612 $392,567 4% $307 11% 314 -45% 37 $500,000-$999,999 $668,049 $685,538 -3% $361 6% 387 9% 47 $1MM-$4.99MM $1,887,006 $2,000,319 -6% $664 5% 137 -15% 62 >$5MM $10,918,553 $8,701,250 25% $1,794 19% 19 -5% 57
OCT 22 OCT 21 YOY% CHANGE OCT 22 YOY% CHANGE OCT 22 YOY% CHANGE OCT 22
22
21 YOY% CHANGE OCT 22 YOY% CHANGE OCT 22 YOY% CHANGE OCT 22
OCT
OCT
County SALES BY NEIGHBORHOOD AVG SALES PRICE DAYS ON MARKET AVAILABLE LISTINGS SOLD ABOVE LISTED PRICE PRICE RANGE AVG SALES PRICE PRICE PER SF PRICE PER SF DAYS ON MARKET ABOVE LISTING PRICE AT LISTING PRICE OR LOWER CLOSED TRANSACTIONS CLOSED TRANSACTIONS 7% OCT 2021 OCT 2022 ↓ SINGLE-FAMILY HOMES
Miami-Dade
Miami-Dade County
INVENTORY SHRINKS
Miami-Dade County bucked the trend with inventory decreasing in October compared with last year.

AVERAGE SALES PRICE
DAYS ON MARKET
CONDOMINIUMS
Miami-Dade County
MIAMI-DADE COUNTY $638,818 $532,121 20% $468 21% 1,144 -33% 56
AVENTURA $636,008 $464,778 37% $385 27% 66 -48% 73
BAL HARBOUR $2,778,500 $1,803,333 54% $1,237 30% 7 -53% 175
BAY HARBOR ISLANDS $569,727 $586,706 -3% $463 11% 11 -39% 68
BRICKELL/DOWNTOWN MIAMI/EDGEWATER $818,638 $580,603 41% $637 30% 124 -45% 72
COCONUT GROVE $1,843,000 $2,303,000 -20% $826 -2% 8 -43% 69
CORAL GABLES $634,208 $603,617 5% $587 26% 12 -59% 63
FISHER ISLAND $11,000,000 N/A N/A $3,039 N/A 1 N/A 27
GOLDEN BEACH N/A N/A N/A N/A N/A - N/A N/A
INDIAN CREEK N/A N/A N/A N/A N/A - N/A N/A
KEY BISCAYNE $1,595,528 $1,096,786 45% $841 27% 18 -28% 82
MIAMI $473,302 $388,290 22% $379 19% 380 -29% 43
MIAMI BEACH $874,563 $906,849 -4% $680 12% 172 -27% 66
MIAMI SHORES $350,000 $185,000 89% $319 77% 3 200% 9
NORTH BAY VILLAGE $504,086 $359,543 40% $408 44% 14 -39% 181
PINECREST $641,667 $271,857 136% $410 39% 3 -57% 46
SOUTH MIAMI $417,500 $435,667 -4% $311 2% 4 33% 29
SUNNY ISLES BEACH $1,268,227 $924,871 37% $667 35% 63 -30% 78
SURFSIDE $695,714 $1,406,250 -51% $571 -39% 7 -13% 62
<$500,000 $313,194 $280,919 11% $327 16% 770 -39% 49 $500,000-$999,999 $692,045 $702,333 -1% $577 7% 243 -18% 60 $1MM-$4.99MM $1,812,277 $1,889,769 -4% $939 4% 119 -18% 87 >$5MM $8,818,333 $9,463,500 -7% $2,347 12% 12 50% 92
OCT 22 OCT 21 YOY% CHANGE OCT 22 YOY% CHANGE OCT 22 YOY% CHANGE OCT 22
YOY% CHANGE OCT 22 YOY% CHANGE OCT 22 YOY% CHANGE OCT 22
OCT 22 OCT 21
SALES BY NEIGHBORHOOD AVG SALES PRICE DAYS ON MARKET AVAILABLE LISTINGS SOLD ABOVE LISTED PRICE PRICE RANGE AVG SALES PRICE PRICE PER SF PRICE PER SF DAYS ON MARKET ABOVE LISTING PRICE AT LISTING PRICE OR LOWER CLOSED TRANSACTIONS CLOSED TRANSACTIONS 4% OCT 2021 OCT 2022 ↓ CONDOMINIUMS
Broward County
ACTIVE LISTINGS SLOWER TO ADJUST
The average price of a home listed for sale in Broward County was more than $1.4 million. In comparison, the average listing price went down by an average of 9% in the southeast Florida region.
AVERAGE SALES PRICE
DAYS ON MARKET
SINGLE-FAMILY HOMES
BROWARD COUNTY
$704,519 $663,478 6% $340 13% 972 -26% 39
COOPER CITY $652,909 $603,367 8% $347 18% 22 -19% 25
CORAL SPRINGS $674,031 $583,783 15% $289 14% 73 -23% 36
DAVIE $773,347 $859,695 -10% $343 16% 34 -44% 44
DEERFIELD BEACH $485,124 $442,937 10% $305 15% 28 -35% 41
FORT LAUDERDALE $1,054,336 $1,219,895 -14% $456 5% 125 -25% 55
HALLANDALE $398,754 $508,879 -22% $332 -2% 7 -50% 19
HILLSBORO BEACH N/A N/A N/A N/A N/A - N/A N/A
HOLLYWOOD $545,409 $552,343 -1% $349 8% 96 -20% 36
LAUDERDALE-BY-THE-SEA N/A N/A N/A N/A N/A - N/A N/A
LIGHTHOUSE POINT $1,559,857 $1,359,000 15% $578 3% 14 40% 53
MIRAMAR $600,175 $502,870 19% $293 20% 61 -34% 33
PARKLAND $1,030,714 $1,106,871 -7% $333 9% 30 -39% 40
PEMBROKE PINES $644,378 $519,223 24% $320 21% 82 -15% 30
PLANTATION $808,487 $641,781 26% $313 14% 54 -22% 33
POMPANO BEACH $549,165 $538,656 2% $376 15% 55 -13% 49
SOUTHWEST RANCHES
$1,314,000 $1,832,423 -28% $455 4% 13 18% 57
SUNRISE $481,824 $406,588 19% $280 6% 40 -23% 38
WESTON $1,321,718 $771,695 71% $370 20% 37 -40% 47
WILTON MANORS $957,300 $673,906 42% $520 29% 10 -41% 41
SINGLE-FAMILY HOMES
NEIGHBORHOOD AVAILABLE LISTINGS SOLD ABOVE LISTED PRICE ABOVE LISTING PRICE AT LISTING PRICE OR LOWER AVG SALES PRICE PRICE PER SF DAYS ON MARKET CLOSED TRANSACTIONS 10% OCT 2021 ↓ OCT 2022
OCT 22 OCT 21 YOY% CHANGE OCT 22 YOY% CHANGE OCT 22 YOY% CHANGE OCT 22
SALES BY
Broward County
OCT 22 OCT 21 YOY% CHANGE OCT 22 YOY% CHANGE OCT 22 YOY% CHANGE OCT 22 <$500,000 $392,921 $371,505 6% $294 14% 413 -40% 36 $500,000-$999,999 $673,955 $670,113 1% $337 13% 442 -11% 35 $1MM-$2.99MM $1,501,222 $1,535,198 -2% $492 7% 107 -5% 57 >$3MM $6,399,750 $6,893,479 -7% $823 -28% 10 -38% 141 AVG SALES PRICE DAYS ON MARKET PRICE RANGE PRICE PER SF CLOSED TRANSACTIONS
Broward County
BUYERS STILL COMPETITIVE
Buyer competition was on par with last year as approximately 19% of homes units sold above the asking price. In comparison, the share of condos sold for more than the list price decreased in the surrounding counties.
AVERAGE SALES PRICE
DAYS ON MARKET
CONDOMINIUMS
BROWARD COUNTY $331,472 $294,388 13% $266 20% 1,139 -22% 40

COOPER CITY $396,667 $349,450 14% $264 3% 6 -40% 48
CORAL SPRINGS $237,560 $195,958 21% $212 21% 50 0% 34
DAVIE $266,718 $289,741 -8% $221 9% 34 -15% 37
DEERFIELD BEACH $235,233 $203,164 16% $200 18% 85 20% 37
FORT LAUDERDALE $516,516 $551,045 -6% $397 15% 142 -31% 46
HALLANDALE $425,478 $295,351 44% $328 28% 91 -20% 63
HILLSBORO BEACH $624,750 $376,000 66% $517 46% 4 -20% 86
HOLLYWOOD $472,292 $413,361 14% $419 36% 79 -32% 55
LAUDERDALE-BY-THE-SEA $938,176 $661,367 42% $456 5% 17 13% 52
LIGHTHOUSE POINT $258,543 $217,875 19% $195 26% 9 -25% 24
MIRAMAR $334,142 $268,295 25% $273 27% 24 -41% 18
PARKLAND $490,250 $404,143 21% $332 31% 4 -43% 34
PEMBROKE PINES $292,304 $223,013 31% $237 29% 90 -10% 33
PLANTATION $264,697 $236,813 12% $217 25% 37 -20% 37
POMPANO BEACH $348,946 $338,443 3% $278 14% 93 -24% 27
SOUTHWEST RANCHES N/A N/A N/A N/A N/A - N/A N/A
SUNRISE $216,914 $194,117 12% $197 14% 76 -14% 35
WESTON $392,900 $304,021 29% $292 25% 21 -13% 27
WILTON MANORS $447,708 $349,050 28% $318 13% 12 -25% 22
AVAILABLE LISTINGS SOLD ABOVE LISTED PRICE ABOVE LISTING PRICE AT LISTING PRICE OR LOWER
↑7% OCT 2021 OCT 2022 CONDOMINIUMS
DAYS ON MARKET CLOSED TRANSACTIONS
SALES BY NEIGHBORHOOD
Broward County AVG SALES PRICE PRICE PER SF
OCT 22 OCT 21 YOY% CHANGE OCT 22 YOY% CHANGE OCT 22 YOY% CHANGE OCT 22
OCT 22 OCT 21 YOY% CHANGE OCT 22 YOY% CHANGE OCT 22 YOY% CHANGE OCT 22 <$500,000 $249,787 $224,930 11% $229 16% 999 -24% 36 $500,000-$999,999 $655,230 $699,543 -6% $467 12% 110 17% 66 $1MM-$2.99MM $1,674,407 $1,600,790 5% $684 11% 27 -21% 71 >$3MM $3,575,000 $3,378,333 6% $1,404 21% 3 0% 74 AVG SALES PRICE DAYS ON MARKET PRICE RANGE PRICE PER SF CLOSED TRANSACTIONS
Palm Beach County
PRICE GROWTH
Homes sold above asking declined to 15% in October. At the same time, the median price increased by 18% from last year, one of the highest rates in the region.

AVERAGE SALES PRICE
DAYS ON MARKET
SINGLE-FAMILY HOMES
PALM BEACH COUNTY $995,650 $859,126 16% $370 19% 904 -30% 41
BOCA RATON $1,214,609 $1,108,369 10% $416 19% 152 -33% 43
BOYNTON BEACH $603,682 $519,803 16% $281 15% 126 91% 36
DELRAY BEACH $1,304,211 $1,447,709 -10% $456 31% 78 -5% 42
HIGHLAND BEACH N/A N/A N/A N/A N/A - N/A N/A
JUNO BEACH N/A $365,000 N/A N/A N/A - N/A N/A
JUPITER $1,348,201 $894,749 51% $525 39% 58 -16% 33
JUPITER INLET COLONY $15,000,000 N/A N/A $2,359 N/A 1 N/A 127
LAKE PARK $310,000 $319,667 -3% $233 15% 1 -67% 7
LAKE WORTH $561,714 $487,936 15% $276 23% 90 -41% 34
LANTANA $1,207,600 $734,660 64% $402 33% 5 -50% 40
NORTH PALM BEACH $970,000 $1,251,619 -23% $457 -4% 7 -56% 37
MANALAPAN N/A N/A N/A N/A N/A - N/A N/A
PALM BEACH $6,700,000 $4,386,400 53% $2,339 49% 1 -75% 11
PALM BEACH GARDENS $1,615,634 $985,859 64% $485 43% 66 -25% 41
SINGER ISLAND N/A $2,965,000 N/A N/A N/A - N/A N/A
TEQUESTA $5,344,200 $1,304,364 310% $914 59% 5 -55% 99
WELLINGTON $1,212,624 $1,645,889 -26% $385 -9% 46 -50% 59
WEST PALM BEACH $808,526 $567,110 43% $335 21% 120 -34% 44
AVAILABLE LISTINGS SOLD ABOVE LISTED PRICE ABOVE LISTING PRICE AT LISTING PRICE OR LOWER 8% OCT 2021 OCT 2022 ↓
SALES
PRICE PER SF DAYS ON MARKET CLOSED TRANSACTIONS
22
21
22 YOY%
OCT 22 YOY%
OCT 22
SALES BY NEIGHBORHOOD Palm Beach County AVG
PRICE
OCT
OCT
YOY% CHANGE OCT
CHANGE
CHANGE
OCT 22 OCT 21 YOY% CHANGE OCT 22 YOY% CHANGE OCT 22 YOY% CHANGE OCT 22 <$500,000 $389,439 $380,763 2% $243 6% 293 -51% 35 $500,000-$999,999 $688,421 $679,476 1% $324 15% 418 -16% 42 $1MM-$4.99MM $1,877,548 $1,942,191 -3% $566 4% 177 3% 43 >$5MM $10,367,272 $10,916,646 -5% $1,687 11% 16 -16% 70 AVG SALES PRICE DAYS ON MARKET PRICE RANGE PRICE PER SF CLOSED TRANSACTIONS SINGLE-FAMILY HOMES
Palm Beach County
MEDIAN PRICE STILL HIGHER THAN A YEAR AGO
Active listings surged while sales decreased. Despite this, the median price remained more than 20% greater than one year ago.
AVERAGE SALES PRICE
DAYS ON MARKET
CONDOMINIUMS
PALM BEACH COUNTY $401,018 $342,293 17% $236 21% 842 -33% 41
BOCA RATON $486,384 $376,121 29% $280 31% 153 -29% 39
BOYNTON BEACH $283,846 $234,164 21% $175 20% 85 -37% 37
DELRAY BEACH $310,133 $256,030 21% $195 30% 115 -42% 31
HIGHLAND BEACH $1,814,063 $938,346 93% $727 53% 8 -38% 52
JUNO BEACH $880,771 $810,400 9% $566 39% 7 40% 38
JUPITER $723,932 $427,673 69% $422 59% 42 -33% 35
JUPITER INLET COLONY N/A N/A N/A N/A N/A - N/A N/A
LAKE PARK $171,220 $176,500 -3% $61 -47% 10 400% 17
LAKE WORTH $245,457 $192,658 27% $152 29% 51 -20% 48
LANTANA $322,557 $217,636 48% $222 62% 7 -50% 56
NORTH PALM BEACH $406,294 $654,911 -38% $223 -30% 17 -51% 53
MANALAPAN N/A N/A N/A N/A N/A - N/A N/A
PALM BEACH $2,031,857 $1,591,326 28% $1,191 57% 7 -61% 94
PALM BEACH GARDENS $493,885 $437,061 13% $281 11% 48 -38% 40
SINGER ISLAND $1,140,143 $875,400 30% $471 4% 7 -65% 131
TEQUESTA $329,333 $446,611 -26% $153 -40% 3 -67% 22
WELLINGTON $395,864 $425,471 -7% $307 19% 11 -48% 35
WEST PALM BEACH $280,084 $255,955 9% $169 10% 165 -27% 48
AVAILABLE LISTINGS SOLD ABOVE LISTED PRICE ABOVE LISTING PRICE AT LISTING PRICE OR LOWER 12% OCT 2021 OCT 2022 ↓
SALES PRICE
PER SF DAYS ON MARKET CLOSED TRANSACTIONS
22
21
22 YOY%
OCT 22
OCT 22
SALES BY NEIGHBORHOOD Palm Beach County AVG
PRICE
OCT
OCT
YOY% CHANGE OCT
CHANGE
YOY% CHANGE
OCT 22 OCT 21 YOY% CHANGE OCT 22 YOY% CHANGE OCT 22 YOY% CHANGE OCT 22 <$500,000 $262,643 $228,620 15% $172 17% 695 -36% 39 $500,000-$999,999 $682,209 $679,349 0% $390 2% 107 -12% 43 $1MM-$4.99MM $1,894,200 $1,840,802 3% $943 22% 39 -19% 60 >$5MM $8,250,000 $10,515,175 -22% $1,518 -50% 1 0% 135 AVG SALES PRICE DAYS ON MARKET PRICE RANGE PRICE PER SF CLOSED TRANSACTIONS CONDOMINIUMS
Martin County
SELLERS PRICING HOMES HIGHER

The average list price increased by 6% from last year while the average price fell in most neighboring counties.
AVERAGE SALES PRICE
DAYS ON MARKET
SINGLE-FAMILY HOMES
MARTIN COUNTY
OCT 22 OCT 21 YOY% CHANGE OCT 22 YOY% CHANGE OCT 22 YOY% CHANGE OCT 22
$960,196 $734,206 31% $340 16% 54 -25% 40
HOBE SOUND $490,000 $391,357 25% $243 6% 1 0% 30
HUTCHINSON ISLAND $9,000,000 N/A N/A $1,270 N/A 1 N/A 78
JENSEN BEACH $587,388 $488,618 20% $325 23% 8 -27% 31
JUPITER ISLAND $29,000,000 $14,000,000 107% $3,402 40% 1 0% 0
PALM CITY $754,632 $746,924 1% $297 8% 26 -52% 28
SEWALL'S POINT $2,587,500 $1,338,000 93% $620 48% 2 -60% 60
STUART $776,205 $717,675 8% $321 7% 22 10% 48
<$500,000 $403,818 $373,355 8% $269 16% 11 -62% 46 $500,000-$999,999 $686,675 $708,552 -3% $303 8% 32 10% 26 $1MM-$2.99MM $1,351,111 $1,375,962 -2% $402 -2% 9 -31% 69 >$3MM $6,637,500 $3,600,000 84% $1,030 22% 2 100% 98
OCT 22 OCT 21 YOY% CHANGE OCT 22 YOY% CHANGE OCT 22 YOY% CHANGE OCT 22
Martin County SALES BY NEIGHBORHOOD AVG SALES PRICE DAYS ON MARKET AVAILABLE LISTINGS SOLD ABOVE LISTED PRICE PRICE RANGE AVG SALES PRICE PRICE PER SF PRICE PER SF DAYS ON MARKET ABOVE LISTING PRICE AT LISTING PRICE OR LOWER CLOSED TRANSACTIONS CLOSED TRANSACTIONS 13% OCT 2021 OCT 2022 ↓ SINGLE-FAMILY HOMES
Martin County
HIGHEST PRICE GROWTH FROM LAST YEAR
Condominium pricing increased by the largest amount compared with the surrounding region. At the same time, active listings increased by 255% from last year.
AVERAGE SALES PRICE
DAYS ON MARKET
CONDOMINIUMS
22
21 YOY% CHANGE OCT 22 YOY% CHANGE OCT 22 YOY% CHANGE OCT 22
OCT
OCT
22
21 YOY% CHANGE OCT 22 YOY% CHANGE OCT 22 YOY% CHANGE OCT 22
<$500,000 $286,269 $217,487 32% $235 19% 40 -20% 46 $500,000-$999,999 $676,714 $530,000 28% $429 21% 7 600% 64 $1MM-$2.99MM N/A $1,040,000 N/A N/A N/A - N/A N/A >$3MM N/A N/A N/A N/A N/A - N/A N/A OCT
OCT
Martin County SALES BY NEIGHBORHOOD AVG SALES PRICE DAYS ON MARKET AVAILABLE LISTINGS SOLD ABOVE LISTED PRICE PRICE RANGE AVG SALES PRICE PRICE PER SF PRICE PER SF DAYS ON MARKET ABOVE LISTING PRICE AT LISTING PRICE OR LOWER CLOSED TRANSACTIONS CLOSED TRANSACTIONS 22% OCT 2021 OCT 2022 ↓ CONDOMINIUMS
MARTIN COUNTY $344,420 $239,315 44% $264 29% 47 -10% 49 HOBE SOUND $310,000 $233,000 33% $241 36% 2 -33% 47 HUTCHINSON ISLAND $613,986 $397,400 55% $417 7% 8 60% 82 JENSEN BEACH $426,904 $431,375 -1% $258 -2% 9 125% 31 PALM CITY $255,600 $183,400 39% $174 43% 5 0% 52 STUART $231,118 $195,496 18% $228 28% 23 -36% 46
Indian River County
PRICING UP
The median price remained strong at $375,000, up by 12% from last year. Sales were down 13% from last year and days on market were up 9%.
AVERAGE SALES PRICE
DAYS ON MARKET
SINGLE-FAMILY HOMES
OCT 22 OCT 21 YOY% CHANGE OCT 22 YOY% CHANGE OCT 22 YOY% CHANGE OCT 22 <$300,000 $237,038 $233,915 1% $201 9% 48 -35% 60 $300,000-$999,999 $471,159 $464,314 1% $235 6% 118 4% 53 $1MM-$2.99MM $1,845,458 $1,459,923 26% $604 30% 9 -31% 106 >$3MM $3,093,139 $3,200,000 -3% $880 19% 1 0% 1 OCT 22 OCT 21 YOY% CHANGE OCT 22 YOY% CHANGE OCT 22 YOY% CHANGE OCT 22 INDIAN RIVER COUNTY $492,482 $457,494 8% $249 9% 176 -12% 57 BARRIER ISLAND $1,669,241 $1,177,683 42% $576 40% 13 -46% 61 MAINLAND VERO BEACH $425,234 $359,731 18% $221 10% 81 -21% 68 SEBASTIAN/FELLSMERE $335,859 $312,263 8% $216 16% 38 41% 63 Indian River County SALES BY NEIGHBORHOOD AVG SALES PRICE DAYS ON MARKET AVAILABLE LISTINGS SOLD ABOVE LISTED PRICE PRICE RANGE AVG SALES PRICE PRICE PER SF PRICE PER SF DAYS ON MARKET ABOVE LISTING PRICE AT LISTING PRICE OR LOWER CLOSED TRANSACTIONS CLOSED TRANSACTIONS 7% OCT 2021 OCT 2022 ↓ SINGLE-FAMILY HOMES
Indian River County
SALES DECREASE
Sales volume was down 26% compared to last year while active listings more than doubled.
AVERAGE SALES PRICE
DAYS ON MARKET
CONDOMINIUMS
OCT 22 OCT 21 YOY% CHANGE OCT 22 YOY% CHANGE OCT 22 YOY% CHANGE OCT 22 INDIAN RIVER COUNTY $390,621 $333,354 17% $264 25% 73 -26% 57 BARRIER ISLAND $1,015,091 $717,400 41% $555 45% 11 -48% 66 MAINLAND VERO BEACH $256,025 $221,769 15% $201 27% 53 -24% 55 SEBASTIAN/FELLSMERE $348,400 $425,500 -18% $265 80% 5 67% 71 OCT 22 OCT 21 YOY% CHANGE OCT 22 YOY% CHANGE OCT 22 YOY% CHANGE OCT 22 INDIAN RIVER COUNTY $390,621 $333,354 17% $264 25% 73 -26% 57 BARRIER ISLAND $1,015,091 $717,400 41% $555 45% 11 -48% 66 MAINLAND VERO BEACH $256,025 $221,769 15% $201 27% 53 -24% 55 SEBASTIAN/FELLSMERE $348,400 $425,500 -18% $265 80% 5 67% 71 Indian River County SALES BY NEIGHBORHOOD AVG SALES PRICE DAYS ON MARKET AVAILABLE LISTINGS SOLD ABOVE LISTED PRICE PRICE RANGE AVG SALES PRICE PRICE PER SF PRICE PER SF DAYS ON MARKET ABOVE LISTING PRICE AT LISTING PRICE OR LOWER CLOSED TRANSACTIONS CLOSED TRANSACTIONS 10% OCT 2021 OCT 2022 ↓ CONDOMINIUMS
Brevard County
ACTIVE LISTINGS SOARED

The total number of homes listed for sale more than doubled in Brevard County. Highlighting that high supply is not an issue, the median price remained up 10% from last year.
AVERAGE SALES PRICE
DAYS ON MARKET
SINGLE-FAMILY HOMES
BREVARD COUNTY
$418,610 $386,252 8% $222 11% 790 -21% 27
COCOA $322,197 $278,074 16% $206 23% 90 8% 27
COCOA BEACH $1,001,667 $629,364 59% $469 48% 3 -73% 80
GRANT $418,955 $500,764 -16% $209 -15% 26 136% 25
INDIALANTIC $881,556 $624,863 41% $349 32% 4 -79% 21
MALABAR $520,075 $640,263 -19% $251 18% 5 -17% 17
MELBOURNE $456,546 $429,549 6% $229 9% 175 -32% 26
MELBOURNE BEACH $1,096,886 $809,125 36% $450 23% 7 -42% 46
MERRITT ISLAND $658,334 $473,518 39% $272 17% 52 -43% 35
MIMS $404,957 $266,809 52% $199 20% 25 127% 18
PALM BAY $338,051 $291,678 16% $197 17% 249 1% 28
ROCKLEDGE $398,919 $408,768 -2% $226 12% 39 -46% 25
SATELLITE BEACH & INDIAN HARBOUR BEACH $637,000 $522,776 22% $326 17% 29 -28% 36
TITUSVILLE $342,798 $286,970 19% $196 20% 69 -29% 27
WEST MELBOURNE $470,350 $396,330 19% $219 17% 10 -62% 16
SINGLE-FAMILY HOMES SALES BY NEIGHBORHOOD AVAILABLE LISTINGS SOLD ABOVE LISTED PRICE ABOVE LISTING PRICE AT LISTING PRICE OR LOWER AVG SALES PRICE PRICE PER SF DAYS ON MARKET CLOSED TRANSACTIONS 14% OCT 2021 ↓ OCT 2022
County OCT 22 OCT 21 YOY% CHANGE OCT 22 YOY% CHANGE OCT 22 YOY% CHANGE OCT 22
Brevard
OCT 22 OCT 21 YOY% CHANGE OCT 22 YOY% CHANGE OCT 22 YOY% CHANGE OCT 22 <$300,000 $241,941 $236,018 3% $195 16% 203 -48% 28 $300,000-$999,999 $446,461 $453,780 -2% $224 4% 572 -2% 27 >$1MM $1,747,470 $1,471,667 19% $477 14% 15 -17% 48 >$3MM $6,693,125 $5,821,409 15% $1,059 6% 16 -41% 165 AVG SALES PRICE DAYS ON MARKET PRICE RANGE PRICE PER SF CLOSED TRANSACTIONS
Brevard County
STRONG MEDIAN PRICE GROWTH


The median price for condos increased by 30% from last year even as the number of active listings grew. The average number of days on market increased to 94 days, the highest in the entire region.
AVERAGE SALES PRICE
DAYS ON MARKET
CONDOMINIUMS
BREVARD COUNTY
$364,403 $318,510 14% $262 11% 135 -27% 94
COCOA $120,200 $404,000 -70% $122 -46% 7 40% 20
COCOA BEACH $488,782 $381,397 28% $334 10% 21 -38% 37
GRANT N/A N/A N/A N/A N/A - N/A N/A
INDIALANTIC $465,625 $498,741 -7% $366 4% 4 -64% 8
MALABAR N/A N/A N/A N/A N/A - N/A N/A
MELBOURNE $285,171 $287,816 -1% $222 18% 17 -32% 34
MELBOURNE BEACH $855,000 $642,000 33% $378 17% 2 0% 7
MERRITT ISLAND $263,613 $232,746 13% $195 15% 8 -33% 42
MIMS N/A N/A N/A N/A N/A - N/A N/A
PALM BAY $150,000 $212,571 -29% $140 -4% 1 -86% 14
ROCKLEDGE $244,650 $215,490 14% $220 46% 6 -40% 38
SATELLITE BEACH & INDIAN HARBOUR BEACH $561,045 $451,523 24% $368 17% 11 -42% 42
TITUSVILLE $339,328 $187,382 81% $239 56% 41 141% 228
WEST MELBOURNE $238,250 $196,920 21% $162 9% 2 -60% 23
SALES BY NEIGHBORHOOD AVAILABLE LISTINGS SOLD ABOVE LISTED PRICE ABOVE LISTING PRICE AT LISTING PRICE OR LOWER
SALES PRICE
PER SF DAYS ON MARKET CLOSED TRANSACTIONS 10% OCT 2021 ↓ OCT 2022
County
22 OCT 21 YOY% CHANGE OCT 22 YOY% CHANGE OCT 22 YOY%
OCT 22
AVG
PRICE
Brevard
OCT
CHANGE
OCT 22 OCT 21 YOY% CHANGE OCT 22 YOY% CHANGE OCT 22 YOY% CHANGE OCT 22 <$300,000 $204,610 $186,534 10% $205 11% 59 -48% 42 $300,000-$999,999 $462,362 $500,399 -8% $298 -5% 73 6% 139 >$1MM $1,123,333 $1,500,000 -25% $496 8% 3 50% 6 >$3MM $6,693,125 $5,821,409 15% $1,059 6% 16 -41% 165 AVG SALES PRICE DAYS ON MARKET PRICE RANGE PRICE PER SF CLOSED TRANSACTIONS CONDOMINIUMS
St. Johns County LONGEST DAYS ON MARKET
The average days on market increased to 55 days in St. Johns County in October, the longest period in the region and the highest increase since last year.
AVERAGE SALES PRICE
DAYS ON MARKET
RESIDENTIAL
ST. JOHNS COUNTY $592,494 $499,873 19% $286 21% 875 -18% 36
JULINGTON CREEK AREA $605,841 $510,851 19% $239 18% 89 -15% 48
NOCATEE $838,265 $629,258 33% $310 17% 60 -21% 44
PONTE VEDRA BEACH $1,358,234 $1,087,701 25% $491 34% 53 -9% 48
SOUTHEAST ST JOHNS COUNTY $510,206 $478,937 7% $341 9% 26 -61% 58
ST. AUGUSTINE BEACHES/ANASTASIA ISLAND $397,286 $332,428 20% $245 22% 34 -37% 61
ST. JOHNS $600,236 $484,801 24% $259 25% 82 -11% 61
SOUTHWEST ST JOHNS COUNTY $424,417 $340,709 25% $233 16% 16 -65% 83
ST. AUGUSTINE/VILANO BEACH $854,550 $495,189 73% $350 46% 34 -37% 48
WORLD GOLF VILLAGE AREA/PALENCIA $498,520 $458,532
SALES BY NEIGHBORHOOD AVAILABLE LISTINGS SOLD ABOVE LISTED PRICE ABOVE LISTING PRICE AT LISTING PRICE OR LOWER AVG SALES PRICE PRICE PER SF DAYS ON MARKET CLOSED TRANSACTIONS 10% OCT 2021 ↓ OCT 2022 St. Johns County OCT 22 OCT 21 YOY% CHANGE OCT 22 YOY% CHANGE OCT 22 YOY% CHANGE OCT 22
OCT 22 OCT 21 YOY% CHANGE OCT 22 YOY% CHANGE OCT 22 YOY% CHANGE OCT 22
$371,767 $357,565 4% $244 14% 415 -41% 58
$670,526 $651,489 3% $288 6% 307 13% 50
$1,565,812 $1,538,123 2% $486 8% 61
51
16% $1,183 51%
AVG SALES PRICE DAYS ON MARKET PRICE RANGE PRICE PER SF CLOSED TRANSACTIONS RESIDENTIAL
9% $241 17% 99 -23% 68
<$500,000
$500,000-$999,999
$1MM-$3MM
53%
>$3MM $5,283,129 $4,569,600
7 40% 127
Duval County
FASTER SALES OF HIGHER PRICED HOMES
The average days on market for all homes in Duval County increased by 53%, however for homes priced above $1 million, the days on market went down from 101 to 62 days from last year.
AVERAGE SALES PRICE
DAYS ON MARKET
RESIDENTIAL
DUVAL COUNTY
$370,982 $317,661 17% $210 20% 1,333 -31% 36
ARLINGTON/FORT CAROLINE $303,424 $275,202 10% $188 20% 129 -19% 44
AVONDALE/RIVERSIDE/ORTEGA $563,324 $447,954 26% $274 18% 36 -33% 37
BARTRAM $342,828 $338,422 1% $205 14% 33 -41% 42
BEACHES $761,970 $642,675 19% $388 12% 64 -38% 47
BEAUCLERC/MANDARIN $387,530 $366,221 6% $211 15% 91 -42% 45
DOWNTOWN JACKSONVILLE $156,491 $142,204 10% $122 11% 118 -13% 49
INTRACOASTAL $594,142 $507,907 17% $257 19% 120 -33% 46
NOCATEE (DUVAL)
$485,672 $367,285 32% $249 25% 19 73% 80
NORTH JACKSONVILLE $344,501 $315,074 9% $183 15% 141 -14% 55
SAN MARCO/SAN JOSE $553,351 $435,456 27% $235 15% 37 -53% 44
SOUTHSIDE $293,994 $266,184 10% $186 10% 133 -49% 45
WEST JACKSONVILLE $279,369 $241,290 16% $172 12% 273 -27% 42
SALES BY NEIGHBORHOOD
LISTINGS SOLD ABOVE LISTED PRICE ABOVE LISTING PRICE AT LISTING PRICE OR LOWER
SALES PRICE PRICE PER SF DAYS ON MARKET CLOSED TRANSACTIONS 8% OCT 2021 ↓ OCT 2022 Duval County OCT 22 OCT 21 YOY% CHANGE OCT 22 YOY% CHANGE OCT 22 YOY% CHANGE OCT 22
AVAILABLE
AVG
OCT 22 OCT 21 YOY% CHANGE OCT 22 YOY% CHANGE OCT 22 YOY% CHANGE OCT 22
AVG SALES PRICE DAYS ON MARKET PRICE RANGE PRICE PER SF CLOSED TRANSACTIONS RESIDENTIAL
<$500,000 $287,572 $270,291 6% $184 9% 1,077 -39% 45 $500,000-$999,999 $685,520 $642,907 7% $282 12% 135 -16% 50 $1MM-$3MM $1,460,186 $1,594,071 -8% $468 13% 28 -10% 65 >$3MM $3,912,083 $5,266,667 -26% $756 -14% 3 0% 35
Clay
County SHORTEST DAYS ON MARKET IN REGION
The average number of days a home remained on the market in October was 41 days, the lowest in the region.

AVERAGE SALES PRICE
DAYS ON MARKET
RESIDENTIAL
SALES BY NEIGHBORHOOD AVAILABLE LISTINGS SOLD ABOVE LISTED PRICE ABOVE LISTING PRICE AT LISTING PRICE OR LOWER AVG SALES PRICE PRICE PER SF DAYS ON MARKET CLOSED TRANSACTIONS 17% OCT 2021 ↓ OCT 2022 Clay County OCT 22 OCT 21 YOY% CHANGE OCT 22 YOY% CHANGE OCT 22 YOY% CHANGE OCT 22 CLAY COUNTY $395,180 $309,714 28% $193 22% 342 -26% 35 FLEMING ISLAND $463,869
20% $203 13% 28 -52% 30 GREEN COVE SPRINGS $366,720
21% $194 20% 37 -8% 38 MIDDLEBURG/KEYSTONE $356,741 $314,045 14% $194 15% 79 -27% 40 ORANGE PARK $316,805
14% $180 11% 49 -40% 44 OAKLEAF PLANTATION $353,084 $315,173 12% $188 16% 55 -26% 53 OCT 22 OCT 21 YOY% CHANGE OCT 22 YOY% CHANGE OCT 22 YOY% CHANGE OCT 22 <$500,000 $329,633 $306,237 8% $188 14% 265 -39% 41 $500,000-$999,999 $597,496 $596,771 0% $203 -2% 33 65% 39 $1MM-$3MM N/A N/A N/A N/A N/A - N/A N/A >$3MM N/A N/A N/A N/A N/A - N/A N/A AVG SALES PRICE DAYS ON MARKET PRICE RANGE PRICE PER SF CLOSED TRANSACTIONS RESIDENTIAL
$387,184
$304,153
$278,526
Nassau County
HIGHEST MEDIAN PRICE APPRECIATION

The median price increased by roughly 55%, the highest rate in the region. Additionally, sales of high-priced homes accelerated in October.
AVERAGE SALES PRICE
DAYS ON MARKET
RESIDENTIAL
SALES BY NEIGHBORHOOD AVAILABLE LISTINGS SOLD ABOVE LISTED PRICE ABOVE LISTING PRICE AT LISTING PRICE OR LOWER AVG SALES PRICE PRICE PER SF DAYS ON MARKET CLOSED TRANSACTIONS 10% OCT 2021 ↓ OCT 2022 Nassau County OCT 22 OCT 21 YOY% CHANGE OCT 22 YOY% CHANGE OCT 22 YOY% CHANGE OCT 22 NASSAU COUNTY $569,728 $521,490 9% $275 12% 307 -16% 41 AMELIA ISLAND/FERNANDINA BEACH $1,094,713 $579,564 89% $401 41% 91 -32% 48 YULEE/WILDLIGHT $392,534 $335,188 17% $189 3% 44 -23% 30 OCT 22 OCT 21 YOY% CHANGE OCT 22 YOY% CHANGE OCT 22 YOY% CHANGE OCT 22
4% $199 3% 189 -33% 38
8%
21% 94 22% 60
21%
6% 14
21
N/A
N/A 8
28 AVG SALES PRICE DAYS ON MARKET PRICE RANGE PRICE PER SF CLOSED TRANSACTIONS RESIDENTIAL
<$500,000 $355,919 $341,427
$500,000-$999,999 $710,315 $659,074
$327
$1MM-$3MM $1,998,204 $1,653,000
$668
8%
>$3MM $6,481,250 N/A
$1,180
N/A
Flagler County
PRICING REMAINS HIGHER, LUXURY HOMES ACTIVE
Several homes sold for more than $3 million in October, a rare occurrence for the county. The average price of all homes was up by 23% from last year.
AVERAGE SALES PRICE
DAYS ON MARKET
RESIDENTIAL
SALES BY NEIGHBORHOOD AVAILABLE LISTINGS SOLD ABOVE LISTED PRICE ABOVE LISTING PRICE AT LISTING PRICE OR LOWER AVG SALES PRICE PRICE PER SF DAYS ON MARKET CLOSED TRANSACTIONS 5 % OCT 2021 ↓ OCT 2022 Flagler County OCT 22 OCT 21 YOY% CHANGE OCT 22 YOY% CHANGE OCT 22 YOY% CHANGE OCT 22 FLAGLER COUNTY $487,153
24% $250 24% 416 1% 30
13% $186 9% 26 18% 25
90% $401 35% 12
39 PALM COAST
22% $229 17% 189 -21% 47 OCT 22 OCT 21 YOY% CHANGE OCT 22 YOY% CHANGE OCT 22 YOY% CHANGE OCT 22
$346,985
10% $205 9% 284 -20% 40
2%
22% 63
53
15%
14
51
N/A
3
25 AVG SALES PRICE DAYS ON MARKET
RANGE PRICE PER SF CLOSED TRANSACTIONS RESIDENTIAL
$392,101
BUNNELL $314,414 $278,760
FLAGLER BEACH $744,279 $392,176
-29%
$466,514 $381,708
<$500,000
$316,765
$500,000-$999,999 $685,256 $673,921
$330
-5%
$1MM-$3MM $1,586,250 $1,377,143
$446 -4%
100%
>$3MM $3,195,000 N/A
$634 N/A
N/A
PRICE
For unmatched real estate expertise
© 2022 ONE Sotheby’s International Realty. All rights reserved. Sotheby’s International Realty® and the Sotheby’s International Realty Logo are service marks licensed to Sotheby’s International Realty Affiliates LLC and used with permission. ONE Sotheby’s International Realty fully supports the principles of the Fair Housing Act and the Equal Opportunity Act. Each franchise is independently owned and operated. Any services or products provided by independently owned and operated franchisees are not provided by, affiliated with or related to Sotheby’s International Realty Affiliates LLC nor any of its affiliated companies. The information contained herein is deemed accurate but not guaranteed.