TRENDS

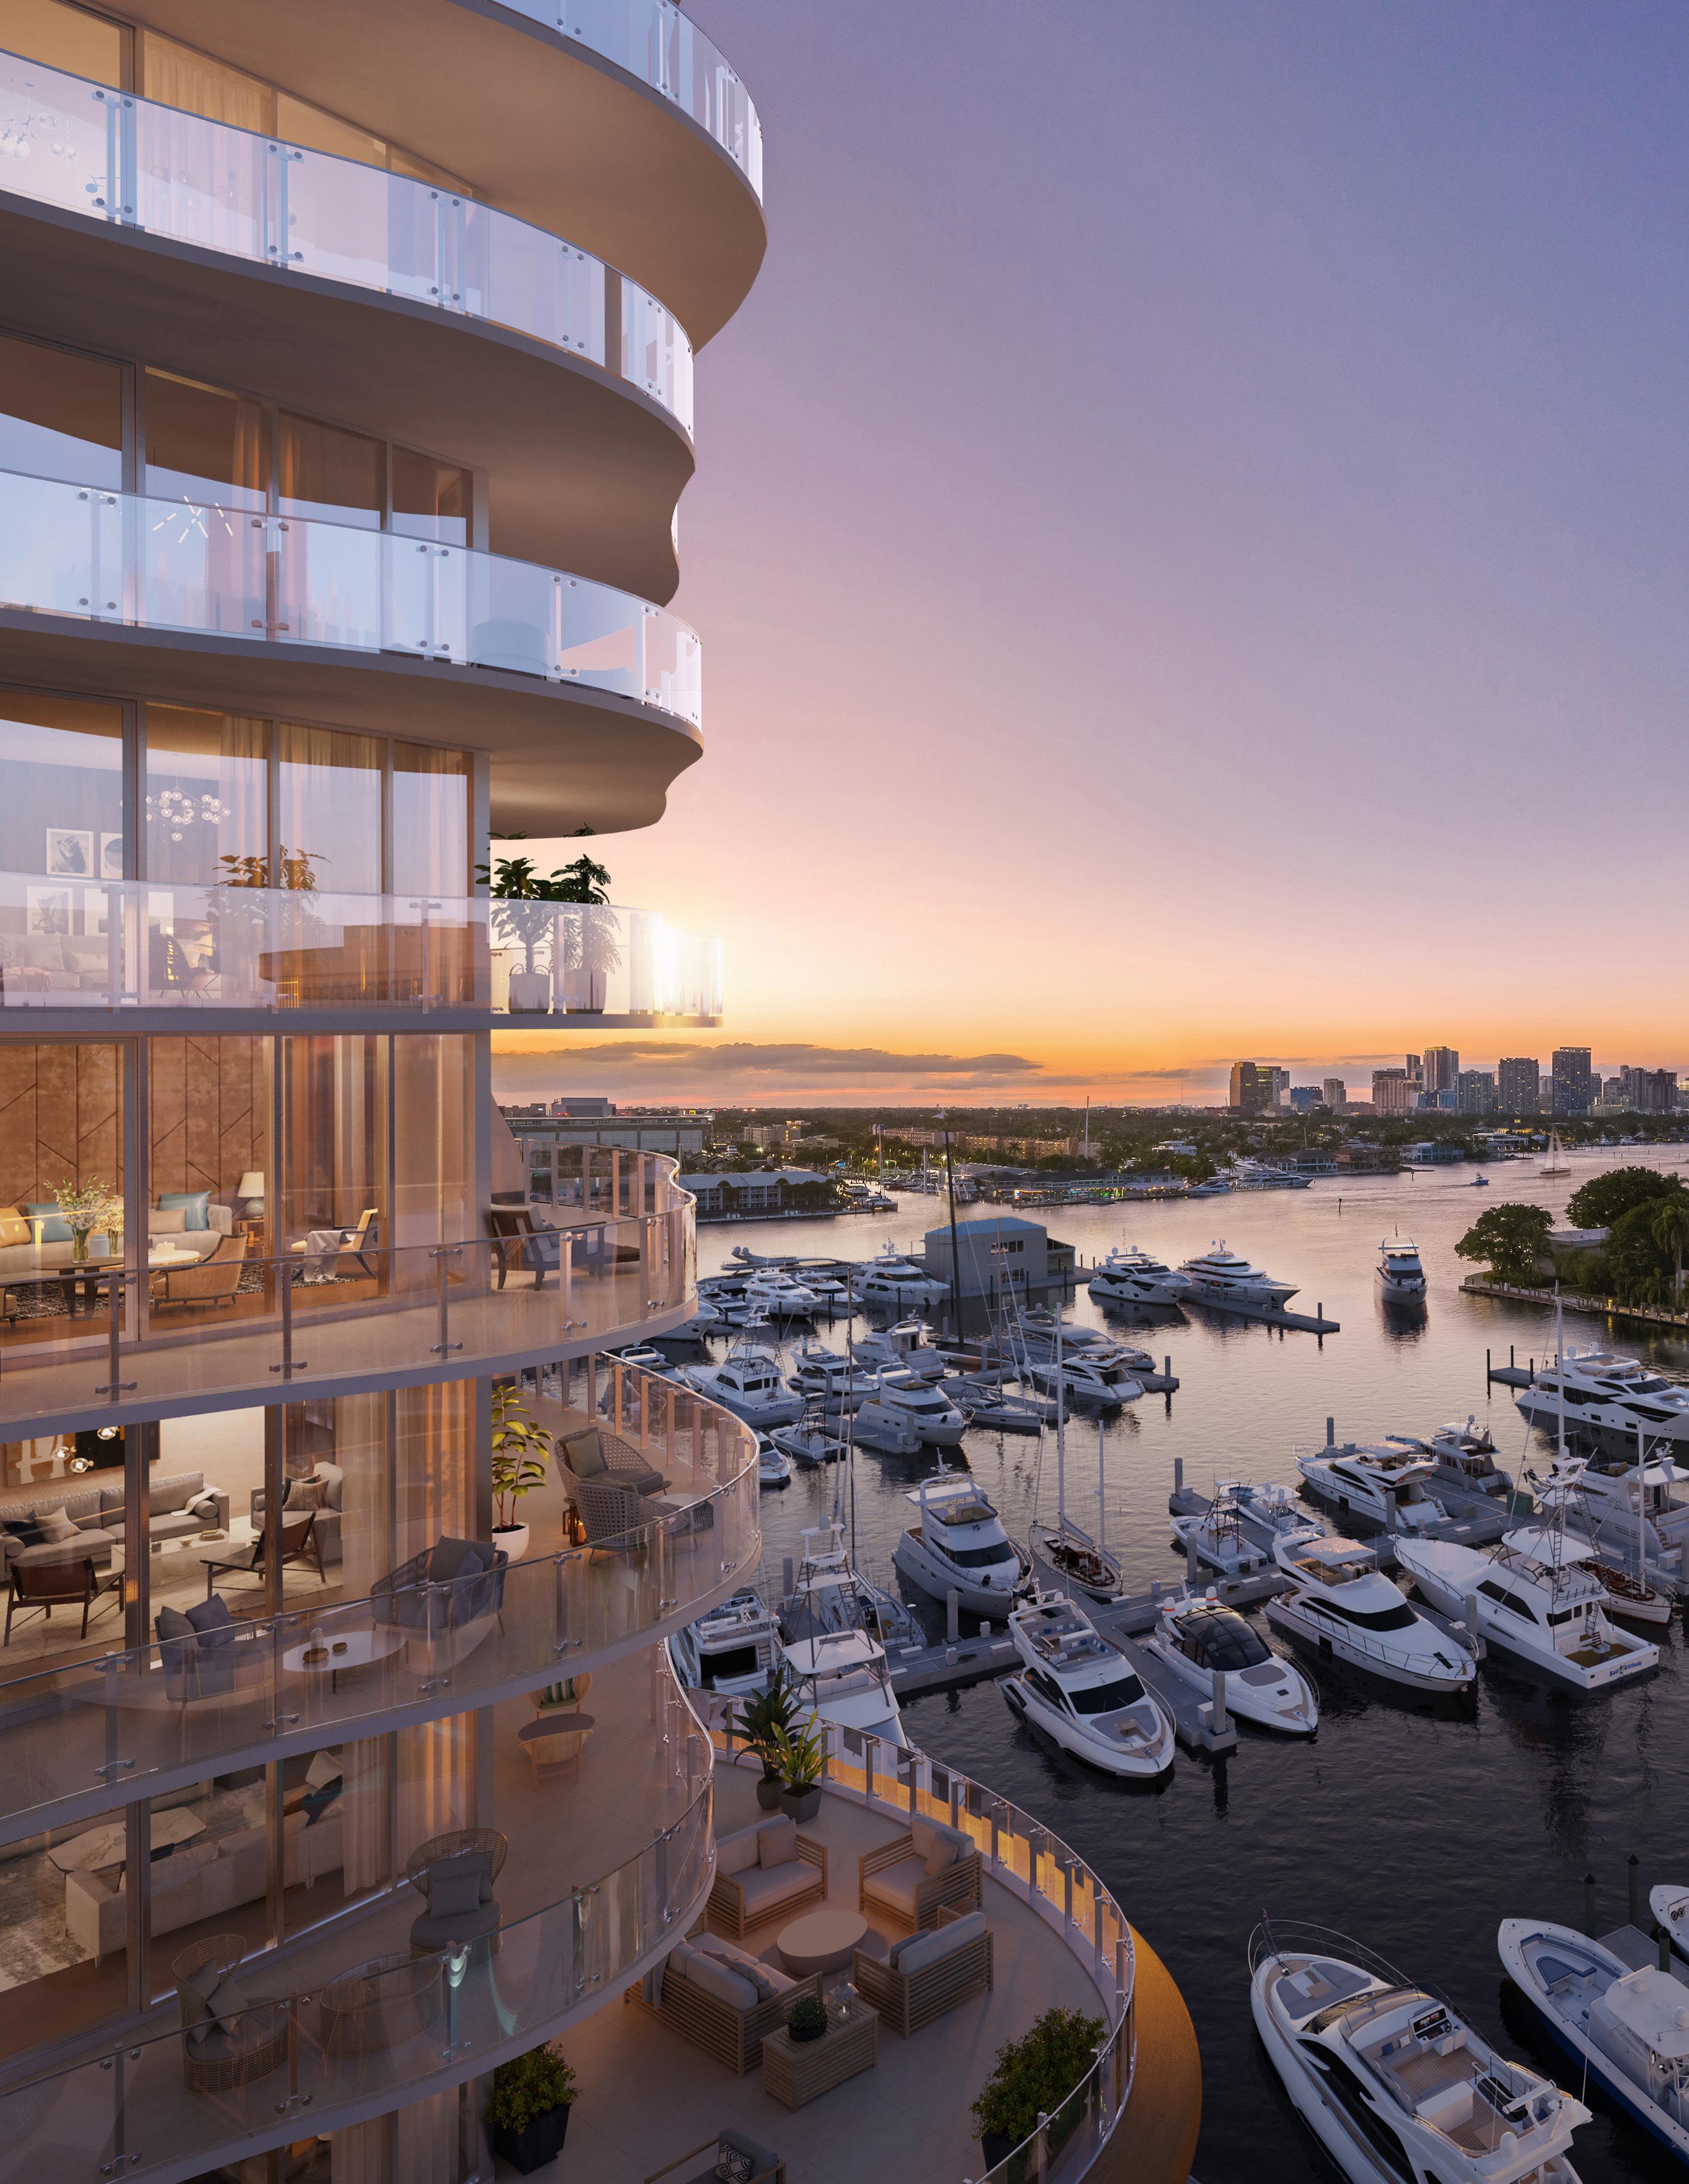
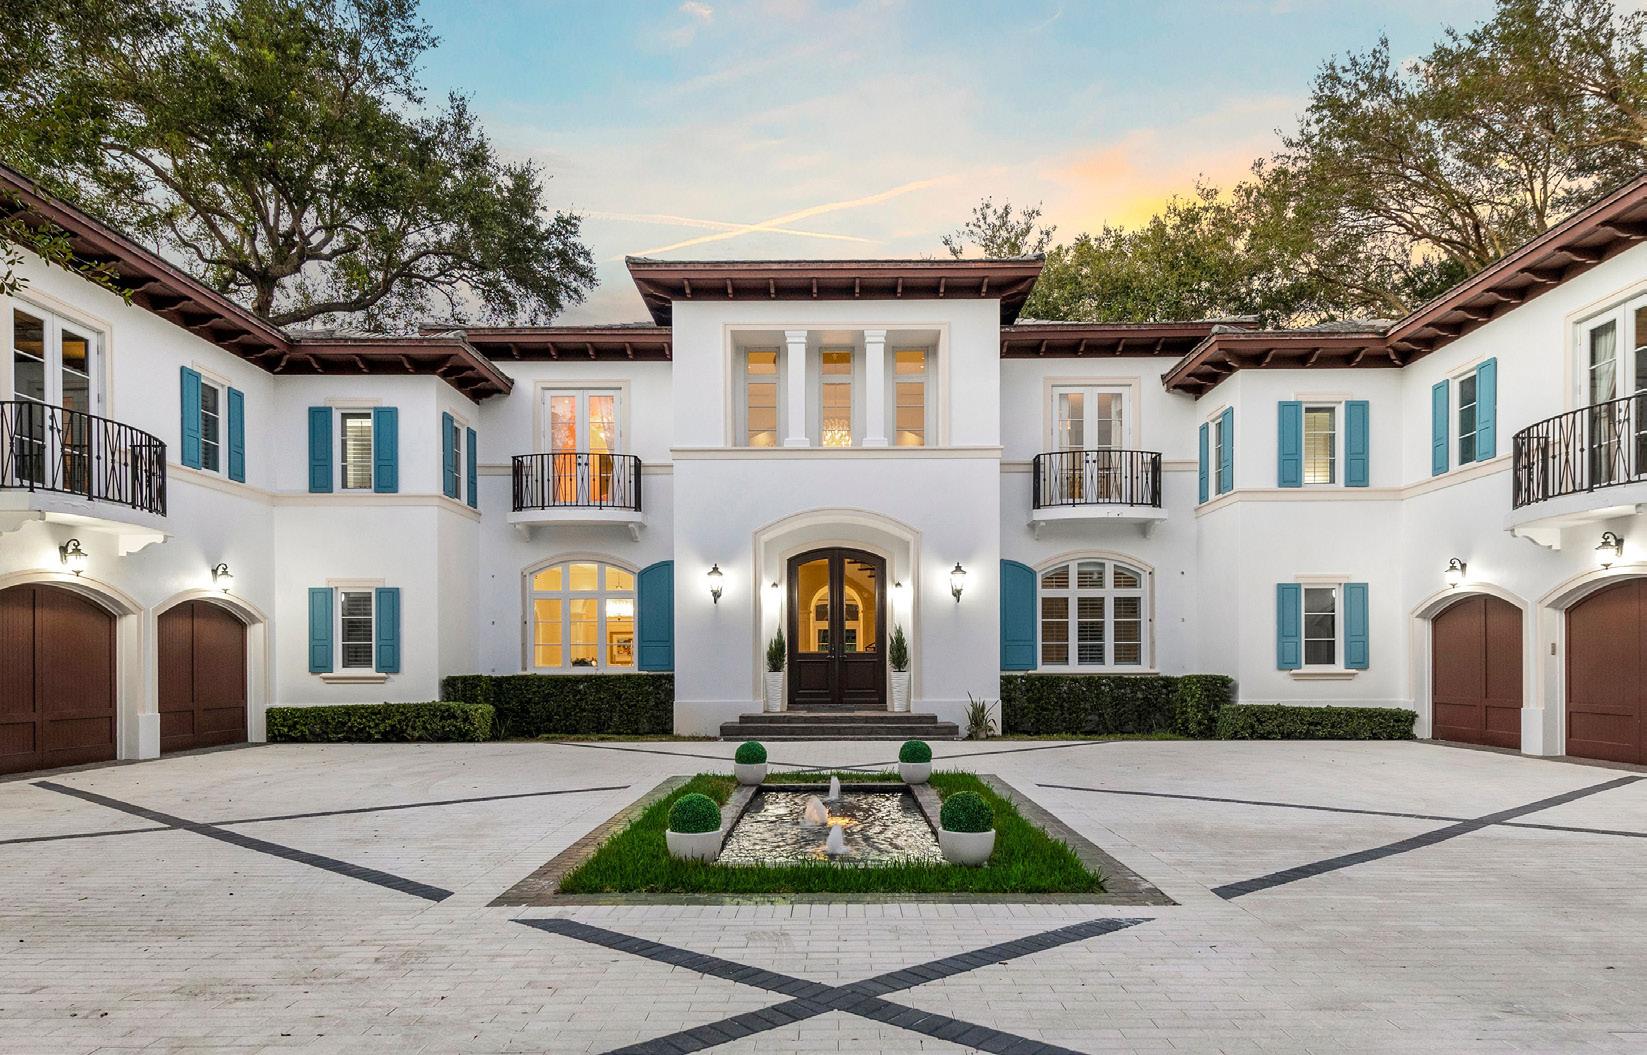
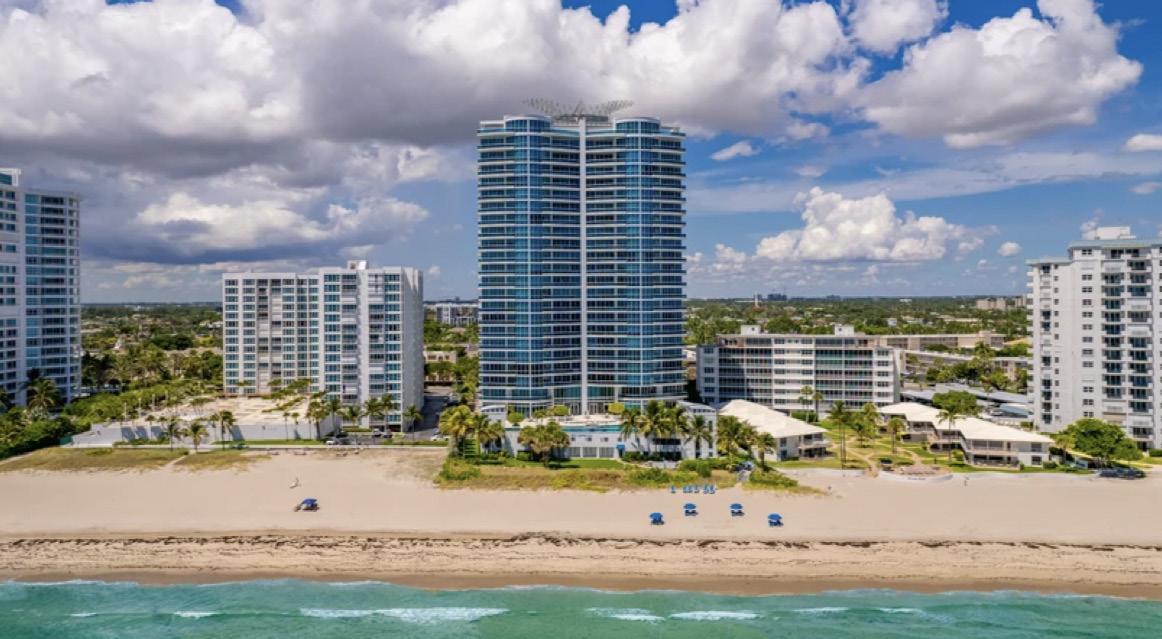
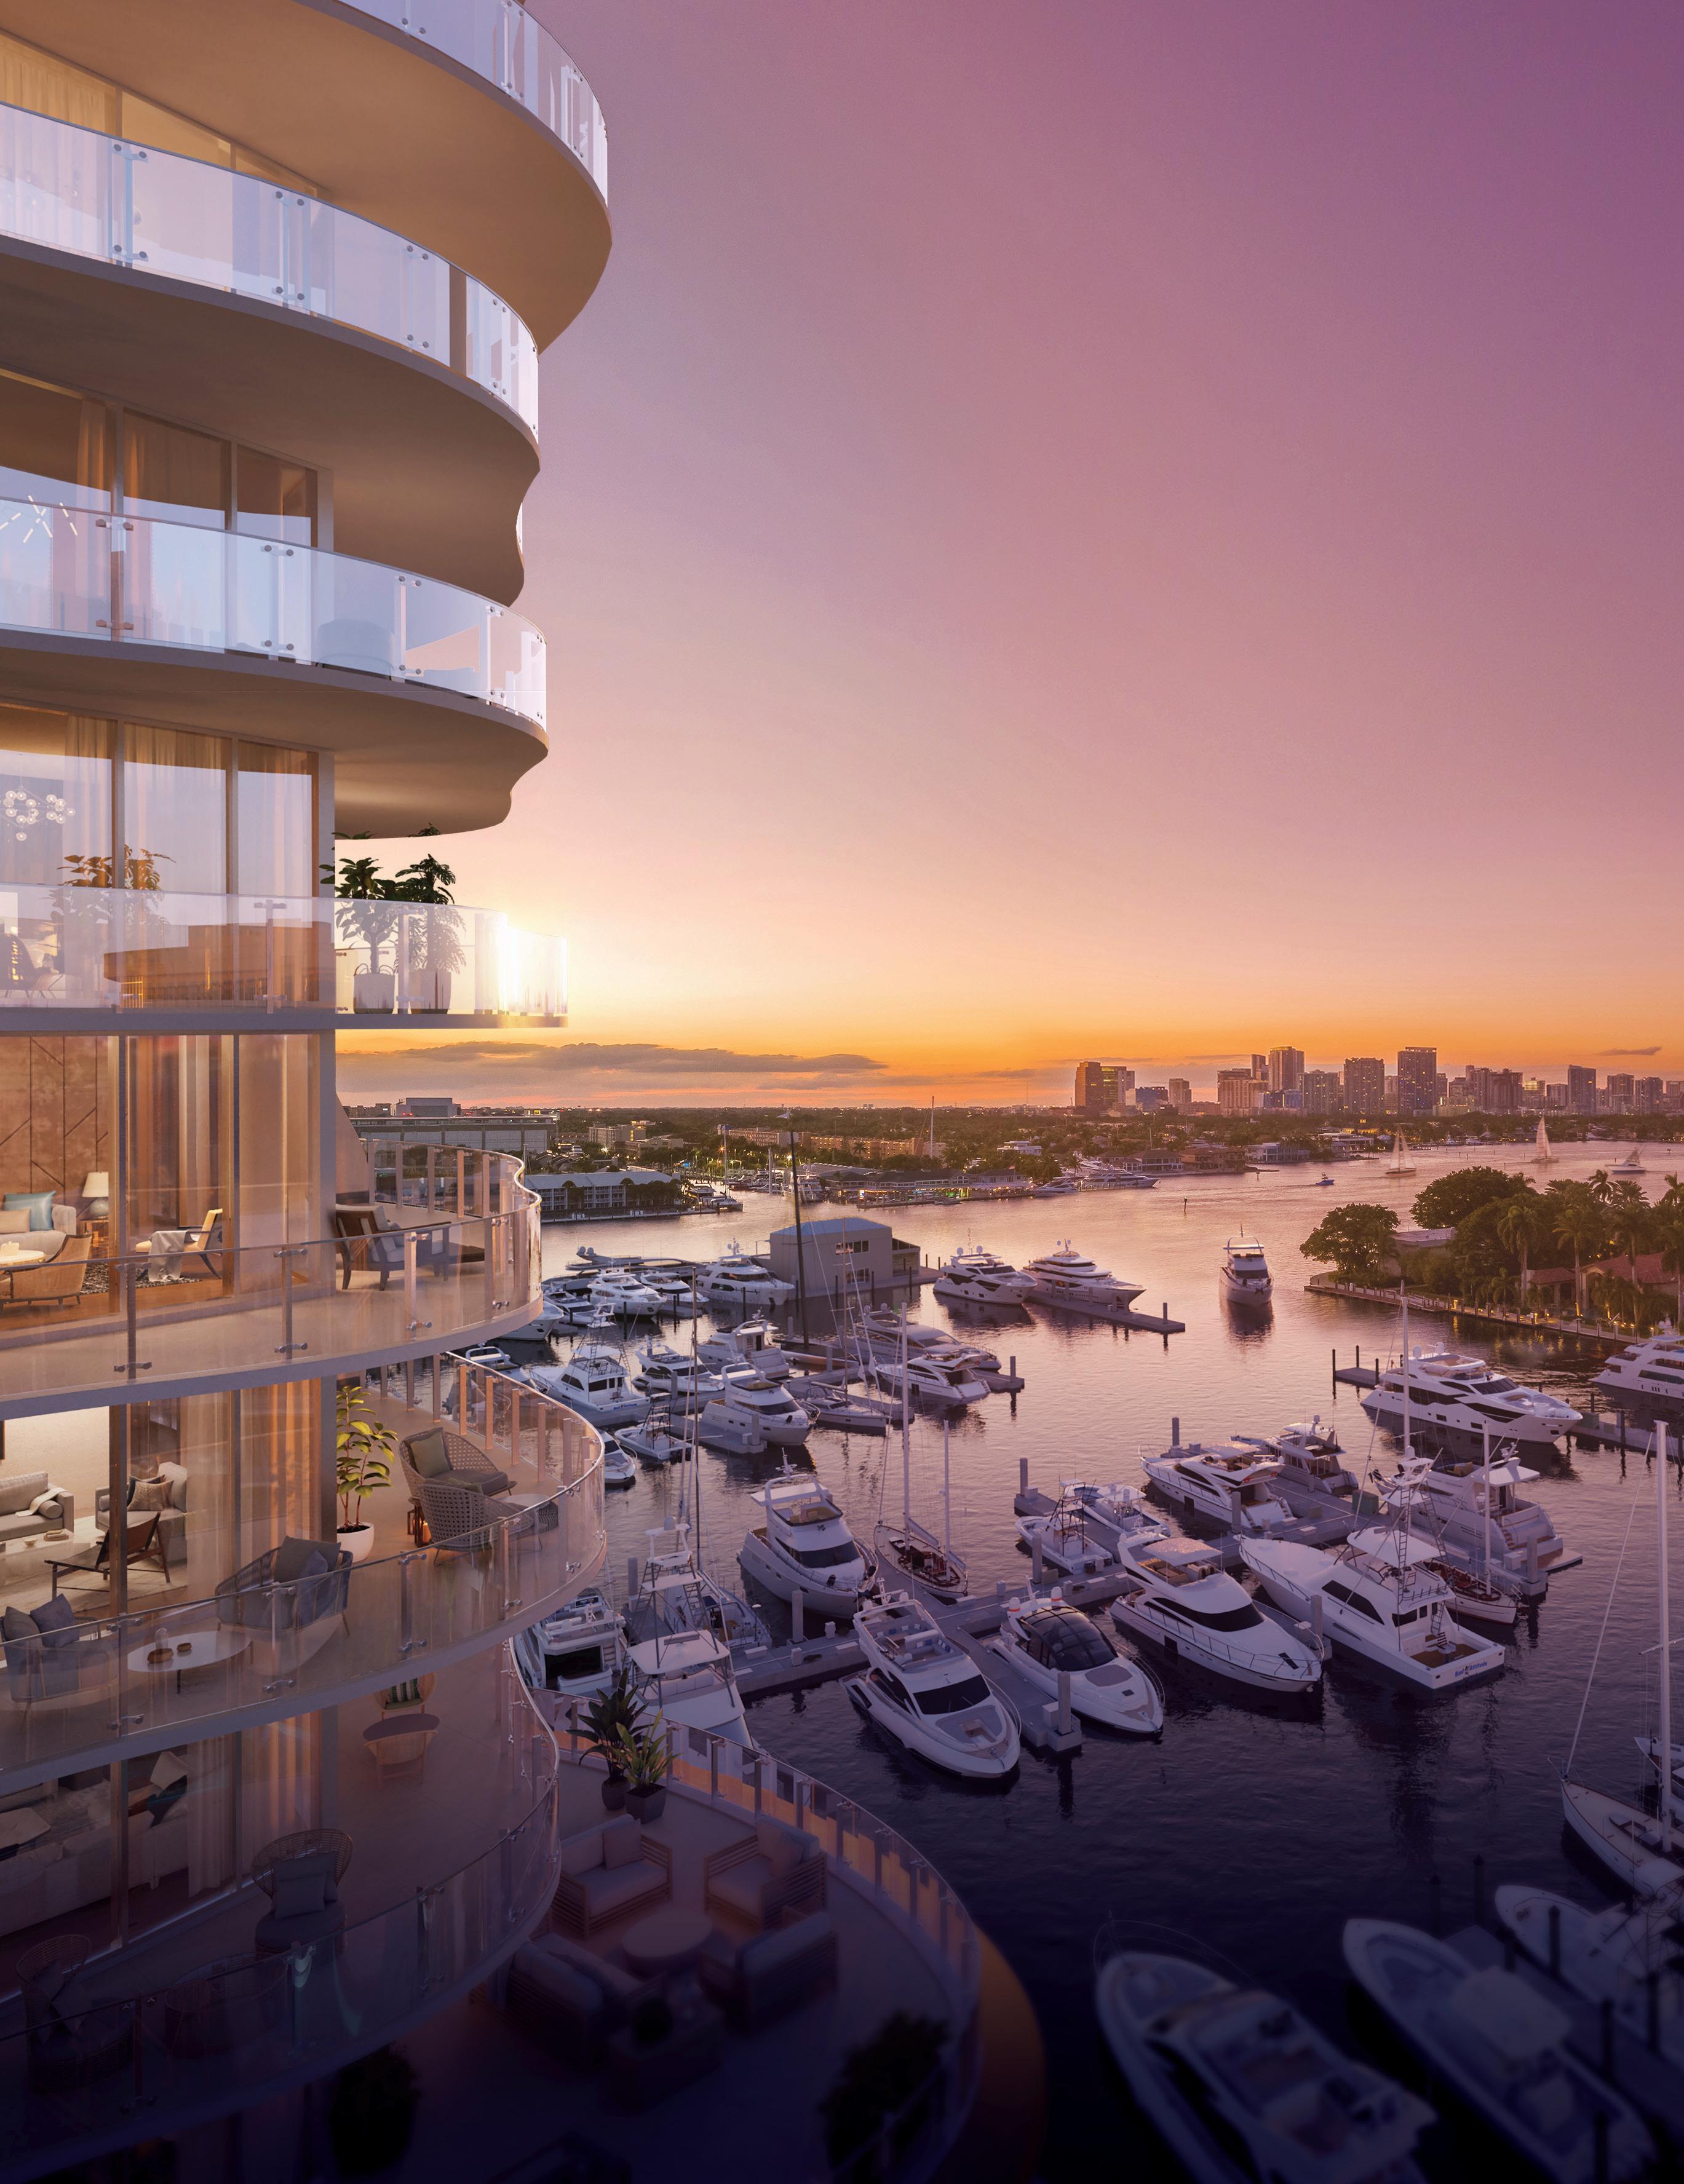
FEATURED DEVELOPMENT: PIER SIXTY-SIX, FORT LAUDERDALE
2023 QUARTER 1 MARKET REPORT
LOCAL EXPERTISE WITH A GLOBAL PERSPECTIVE
Florida’s East Coast real estate market remains competitive, fueled by rising demand for housing, an influx of affluent buyers, and relocations from high-tax states. Our TRENDS market report provides detailed insights into the regional housing market to make informed and confident real estate decisions.
During Q1 2023, most counties in the area saw an increase in the average sales price of homes compared to the same period last year. Florida continues to outperform the national housing trend, indicating that the region offers promising opportunities for sellers and homebuyers alike.
ONE Sotheby’s International Realty recognized its top-performing real estate professionals along Florida’s East Coast in Q1. We are proud of our distinguished associates who continue to exceed industry standards and provide exceptional service to our clients. Our network recently welcomed Podium Group, a team of skilled associates that bring invaluable international relationships to our Brickell footprint.
From Miami to Amelia Island, Florida’s East Coast offers a wealth of opportunities for those looking to relocate, make lifestyle changes or make long-term investments. We will continue to raise industry standards with innovation, cutting-edge tools and technology, and the highest caliber of expertise of our real estate associates.
Daniel de la Vega President ONE Sotheby’s International Realty

ABOUT TRENDS:

ONE Sotheby’s International Realty presents the only market report focused on Florida’s East Coast. From Miami to Amelia Island, data is presented from a macro perspective down to city level.
Data is sourced from local Multiple Listing Service (MLS) organizations. Written analysis created in partnership with the Rosen Consulting Group, a nationally recognized consulting firm and trusted advisor to top public and private real estate operators and capital providers.
CONTENTS 04 10 14 06 11 15 08 12 16 17 18 Miami-Dade County Martin County St. Johns County Broward County Indian River County Duval County Palm Beach County Brevard County Clay County Nassau County Flagler County

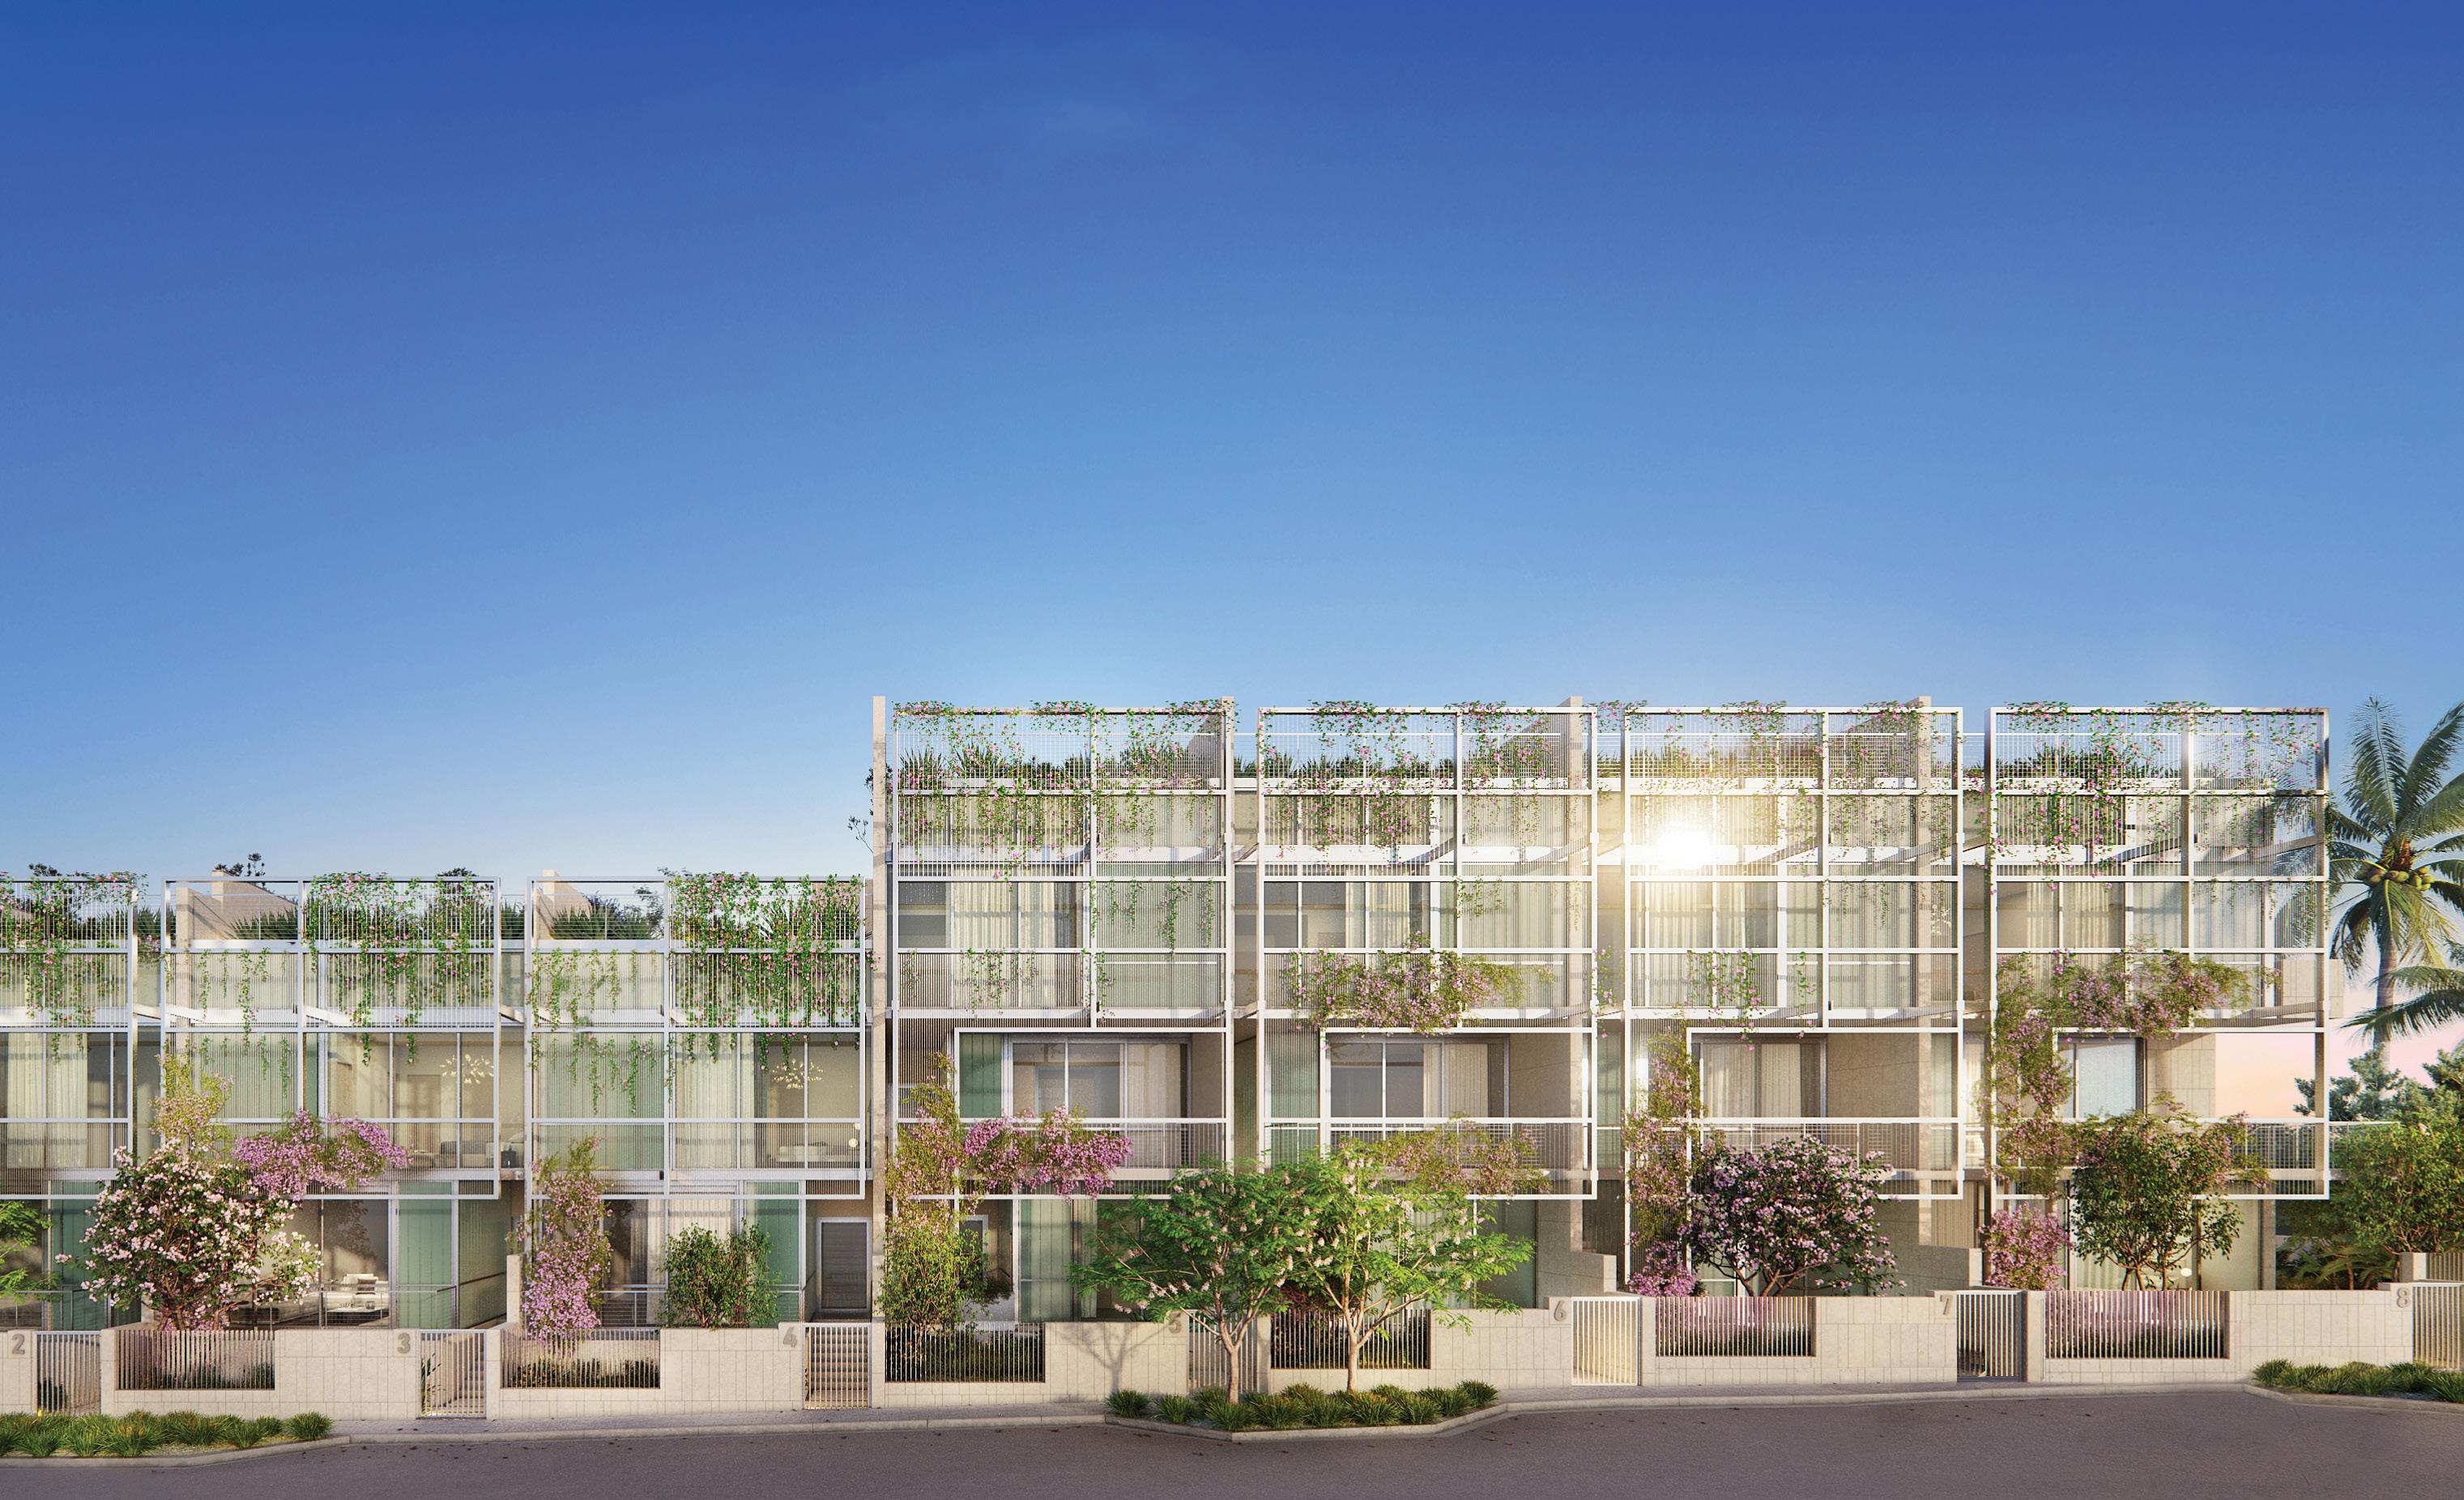


This collection of eight unique homes embraces the charming residential character of Surfside while recognizing the essentials of modern living. No two homes are identical, and a choice of three-, four- or five-bedrooms – plus a variety of bespoke options – cater to discerning tastes and the cultivated lifestyles of those who will call it home. A COLLECTION OF PRIVATE BEACH HOMES DESIGNED BY RENE GONZALEZ ARCHITECTS A NEW STANDARD OF URBAN BEACH LIVING NOW ACCEPTING CONTRACTS Residences Priced From $5.7M SCHEDULE A PRIVATE PREVIEW surfrowresidences.com | surfrow@onesothebysrealty.com | (786)-288-0874 @SURFROWRESIDENCES FOLLOW US This offering is made only by the prospectus for the condominium and no statement should be relied upon if not made in the prospectus. Prices, plans and specifications are subject to change without notice. ORAL REPRESENTATIONS CANNOT BE RELIED UPON AS CORRECTLY STATING THE REPRESENTATIONS OF THE DEVELOPER. FOR CORRECT REPRESENTATIONS, MAKE REFERENCE TO THIS BROCHURE AND TO THE DOCUMENTS REQUIRED BY SECTION 718.503, FLORIDA STATUTES, TO BE FURNISHED BY A DEVELOPER TO A BUYER OR LESSEE.’
FLORIDA’S EAST COAST SNAPSHOT
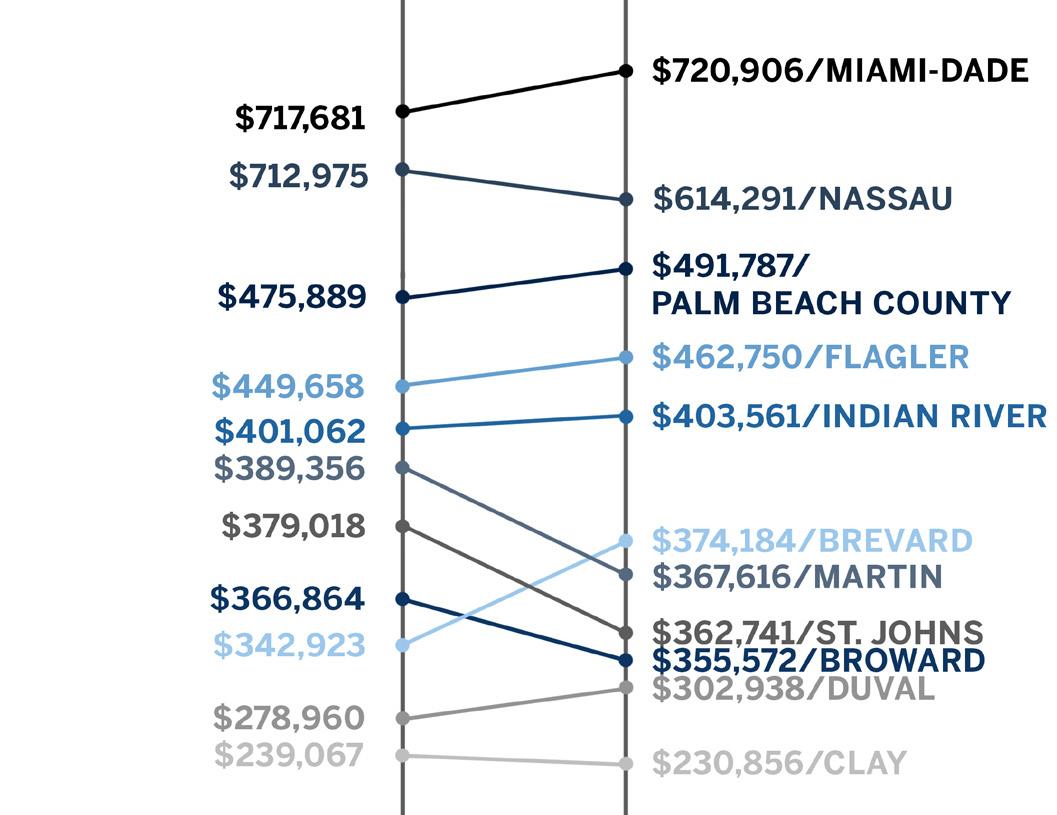
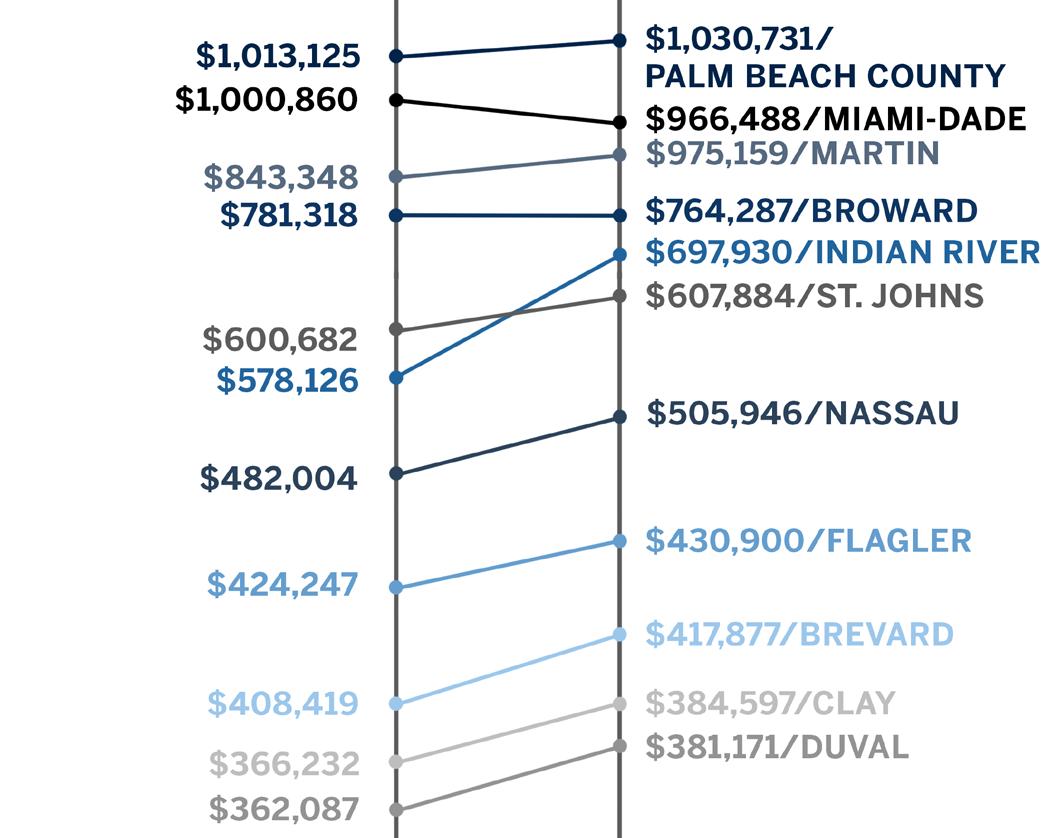
SINGLE- FAMILY HOMES AVERAGE SALES PRICE BY COUNTY CONDOMINIUMS Q1 2022 Q1 2O23 Q1 2022 Q1 2023 MAR 23 CHANGE FROM PRIOR MONTH Q1 2023 YOY% CHANGE Q1 2023 YOY% CHANGE Q1 2023 YOY% CHANGE Q1 2023 YOY% CHANGE Q1 2023 MIAMI-DADE COUNTY SINGLE-FAMILY HOMES 3,317 -8% $565,000 5% $966,488 -3% $342 8% 2,305 -27% $38,500,000 CONDOS 6,446 -2% $400,000 4% $720,906 0% $379 2% 3,004 -44% $21,000,000 BREVARD COUNTY SINGLE-FAMILY HOMES 1,420 -4% $350,000 3% $417,877 2% $202 1% 2,156 -9% $6,000,000 CONDOS 438 -5% $280,500 8% $374,184 9% $244 5% 404 -15% $1,950,000 BROWARD COUNTY SINGLE-FAMILY HOMES 2,769 -6% $560,000 6% $764,287 -2% $319 7% 2,634 -23% $29,672,500 CONDOS 4,218 -4% $266,050 12% $355,572 -3% $239 12% 3,210 -30% $5,350,000 INDIAN RIVER COUNTY SINGLE-FAMILY HOMES 792 2% $390,000 4% $697,930 21% $233 7% 542 -18% $20,500,000 CONDOS 380 8% $300,000 15% $403,561 1% $220 20% 228 -14% $1,800,000 MARTIN COUNTY SINGLE-FAMILY HOMES 184 -6% $625,000 4% $975,159 16% $298 4% 193 5% $12,000,000 CONDOS 140 -16% $296,000 8% $367,616 -6% $231 2% 142 13% $2,600,000 PALM BEACH COUNTY SINGLE-FAMILY HOMES 3,354 -5% $600,000 4% $1,030,731 2% $308 7% 2,769 -16% $62,988,000 CONDOS 3,675 -2% $305,000 10% $491,787 3% $222 10% 2,682 -27% $21,000,000 CLAY COUNTY RESIDENTIAL 258 22% $338,450 1% $355,908 0% $181 3% 418 -61% $1,150,000 DUVAL COUNTY RESIDENTIAL 1,004 12% $295,000 2% $363,230 6% $189 4% 1,814 -61% $7,000,000 FLAGLER COUNTY RESIDENTIAL 475 16% $365,000 4% $434,965 2% $203 2% 525 -57% $2,400,000 NASSAU COUNTY RESIDENTIAL 297 38% $380,000 -9% $521,064 2% $248 -4% 559 -40% $6,450,000 ST. JOHNS COUNTY RESIDENTIAL 892 27% $433,893 -6% $529,500 -6% $235 2% 1,276 -51% $6,050,000 FOR SALE MEDIAN SALES PRICE AVG SALES PRICE PRICE PER SF CLOSED TRANSACTIONS HIGHEST SALES
MIAMI-DADE COUNTY
SINGLE-FAMILY HOMES | AVERAGE PRICE IMPROVES
While the median price increased by 6% from the fourth quarter of 2022, the average price remained 3% lower than it was in the same quarter of last year. The average price stabilized in the first quarter, a notable sign after decreasing for much of 2022.
Neighborhood Snapshots
*ALL PERCENTAGES REFLECT YEAR OVER YEAR CHANGE. 565K 61 3,317 2,305 342 MEDIAN SALES PRICE AVERAGE DAYS ON MARKET ACTIVE LISTINGS SOLD LISTINGS MEDIAN PPSF ↑ 5% ↑ 27% ↑ 8% ↓ 27% ↑ 66%
MEDIAN SALES PRICE MEDIAN PRICE PER SF CLOSED SALES AVERAGE DAYS ON MARKET Q1 2023 Q1 2022 YOY% CHANGE Q1 2023 YOY% CHANGE Q1 2023 YOY% CHANGE Q1 2023 AVENTURA $1,237,500 $990,000 25% $533 29% 2 -85% 263 BAL HARBOUR $6,242,500 N/A N/A $1,635 N/A 1 N/A 118 BAY HARBOR ISLANDS N/A $3,217,000 N/A N/A N/A - N/A N/A COCONUT GROVE $1,862,500 $1,600,000 16% $782 -1% 32 -46% 79 CORAL GABLES $1,625,000 $1,810,000 -10% $748 6% 98 -30% 79 GOLDEN BEACH $5,570,000 $3,675,000 52% $1,323 -6% 2 -50% 211 KEY BISCAYNE $3,350,000 $3,400,000 -1% $1,162 6% 3 -82% 160 MIAMI $575,000 $539,000 7% $345 9% 1,104 -26% 58 MIAMI BEACH $2,700,000 $2,612,500 3% $1,049 9% 51 -38% 115 MIAMI SHORES $1,180,000 $928,000 27% $591 18% 30 -23% 58 NORTH BAY VILLAGE $1,000,000 $1,022,500 -2% $729 35% 3 -70% 112 PINECREST $2,208,500 $1,925,000 15% $686 12% 34 -23% 75 SOUTH MIAMI $1,253,000 $840,000 49% $537 -3% 16 -24% 52 SUNNY ISLES BEACH $1,500,000 $2,500,000 -40% $852 41% 3 -40% 163 SURFSIDE $2,225,000 $1,050,000 112% $992 47% 6 -40% 90
$
$
MIAMI-DADE COUNTY
CONDOMINIUMS | MEDIAN PRICE APPRECIATES
The median price of a condominium in Miami-Dade County was 4% higher than last quarter and 4% higher than the same period last year. The median price in Miami-Dade County remained the highest in the region.
Neighborhood Snapshots
*ALL PERCENTAGES REFLECT YEAR OVER YEAR CHANGE. 400K 69 6,446 3,004 379 MEDIAN SALES PRICE AVERAGE DAYS ON MARKET ACTIVE LISTINGS SOLD LISTINGS MEDIAN PPSF ↑ 4% ↓ 16% ↑ 2 % ↓ 44% ↑ 44%
MEDIAN SALES PRICE MEDIAN PRICE PER SF CLOSED SALES AVERAGE DAYS ON MARKET Q1 2023 Q1 2022 YOY% CHANGE Q1 2023 YOY% CHANGE Q1 2023 YOY% CHANGE Q1 2023 AVENTURA $445,000 $414,500 7% $364 16% 223 -51% 74 BAL HARBOUR $1,611,000 $1,302,500 24% $838 7% 21 -70% 77 BAY HARBOR ISLANDS $582,500 $475,000 23% $436 24% 30 -52% 77 BRICKELL/DOWNTOWN MIAMI/EDGEWATER $600,000 $550,000 9% $614 13% 301 -60% 88 COCONUT GROVE $1,000,000 $849,000 18% $712 32% 54 -47% 64 CORAL GABLES $581,000 $507,500 14% $554 23% 55 -53% 81 KEY BISCAYNE $1,292,500 $1,487,500 -13% $825 -4% 40 -43% 82 MIAMI $365,000 $335,000 9% $305 9% 935 -37% 59 MIAMI BEACH $455,000 $445,000 2% $540 3% 482 -47% 82 MIAMI SHORES $399,000 $317,000 26% $365 57% 3 -50% 36 NORTH BAY VILLAGE $465,000 $355,000 31% $414 32% 42 -36% 56 PINECREST $355,000 $302,700 17% $385 30% 7 -50% 40 SOUTH MIAMI $245,000 $229,000 7% $398 26% 5 -17% 44 SUNNY ISLES BEACH $875,000 $745,000 17% $584 10% 167 -51% 112 SURFSIDE $735,000 $564,000 30% $641 23% 20 -43% 86
$ $
BROWARD COUNTY
SINGLE-FAMILY HOMES | COMPETITION REMAINS
While transaction volume decreased by 23% during the first quarter, 16% of all sales were above the asking price. Broward County had the highest share of homes sold above the asking price in the region.
Neighborhood Snapshots
*ALL PERCENTAGES REFLECT YEAR OVER YEAR CHANGE. 560K 56 2,769
319 MEDIAN SALES PRICE AVERAGE DAYS ON MARKET ACTIVE LISTINGS SOLD LISTINGS MEDIAN PPSF ↑ 6% ↑ 60% ↑ 7% ↓ 23% ↑ 110%
2,634
MEDIAN SALES PRICE MEDIAN PRICE PER SF CLOSED SALES AVERAGE DAYS ON MARKET Q1 2023 Q1 2022 YOY% CHANGE Q1 2023 YOY% CHANGE Q1 2023 YOY% CHANGE Q1 2023 COOPER CITY $650,000 $627,500 4% $336 3% 47 -22% 45 CORAL SPRINGS $635,000 $605,000 5% $288 5% 191 -26% 55 DAVIE $680,500 $660,000 3% $343 6% 129 -12% 58 DEERFIELD BEACH $486,000 $425,000 14% $274 -3% 94 -24% 48 FORT LAUDERDALE $585,000 $660,000 -11% $418 4% 368 -25% 65 HALLANDALE $530,750 $420,000 26% $341 -4% 20 0% 66 HILLSBORO BEACH $19,241,500 N/A N/A $1,490 N/A 1 N/A 649 HOLLYWOOD $498,000 $480,000 4% $364 12% 223 -33% 55 LAUDERDALE-BY-THE-SEA $1,110,000 $1,257,500 -12% $717 6% 6 -57% 83 LIGHTHOUSE POINT $1,900,000 $1,612,500 18% $647 12% 33 -39% 63 MIRAMAR $580,000 $536,750 8% $290 9% 159 -24% 53 PARKLAND $1,055,000 $1,025,000 3% $331 1% 92 -23% 60 PEMBROKE PINES $585,000 $550,000 6% $306 9% 183 -28% 55 PLANTATION $584,750 $590,000 -1% $298 6% 116 -28% 63 POMPANO BEACH $468,500 $397,500 18% $348 12% 142 -24% 54 SOUTHWEST RANCHES $1,650,000 $1,412,500 17% $459 6% 25 -26% 51 SUNRISE $465,000 $437,500 6% $305 11% 101 -16% 45 WESTON $830,000 $850,000 -2% $347 1% 98 -33% 52 WILTON MANORS $825,000 $700,000 18% $499 4% 44 5% 48
$ $
BROWARD COUNTY
CONDOMINIUMS | HIGHEST SHARE OF CONDOS SOLD ABOVE LIST
Approximately 13% of all condominium sales in the first quarter closed above the asking price in Broward County, which was higher than the neighboring counties. The median price increased by 12% year-over-year.
Neighborhood Snapshots
*ALL PERCENTAGES REFLECT YEAR OVER YEAR CHANGE. 266K 50 4,218 3,210 239 MEDIAN SALES PRICE AVERAGE DAYS ON MARKET ACTIVE LISTINGS SOLD LISTINGS MEDIAN PPSF ↑ 12% ↓ 9 % ↑ 12% ↓ 30% ↑ 95%
MEDIAN SALES PRICE MEDIAN PRICE PER SF CLOSED SALES AVERAGE DAYS ON MARKET Q1 2023 Q1 2022 YOY% CHANGE Q1 2023 YOY% CHANGE Q1 2023 YOY% CHANGE Q1 2023 COOPER CITY $420,000 $382,500 10% $300 5% 17 0% 32 CORAL SPRINGS $216,000 $204,000 6% $219 12% 119 -15% 45 DAVIE $287,500 $237,000 21% $235 19% 97 -27% 31 DEERFIELD BEACH $185,000 $160,000 16% $207 23% 255 -19% 47 FORT LAUDERDALE $430,000 $449,900 -4% $393 8% 445 -38% 65 HALLANDALE $307,500 $290,000 6% $286 12% 216 -37% 66 HILLSBORO BEACH $535,000 $548,000 -2% $452 -2% 21 -30% 65 HOLLYWOOD $290,000 $320,000 -9% $278 -6% 243 -42% 61 LAUDERDALE-BY-THE-SEA $485,000 $633,500 -23% $399 -28% 43 -28% 71 LIGHTHOUSE POINT $197,500 $195,250 1% $207 -31% 20 -31% 32 MIRAMAR $371,000 $320,000 16% $262 10% 70 -35% 39 PARKLAND $546,500 $500,000 9% $320 12% 10 -33% 37 PEMBROKE PINES $240,000 $220,000 9% $211 12% 236 -22% 41 PLANTATION $295,000 $232,500 27% $244 27% 104 -11% 36 POMPANO BEACH $288,000 $255,000 13% $244 9% 294 -28% 50 SUNRISE $190,000 $152,500 25% $196 34% 191 -21% 51 WESTON $378,750 $286,500 32% $296 25% 48 -25% 50 WILTON MANORS $468,634 $224,000 109% $313 13% 35 -5% 27
$
$
PALM BEACH COUNTY
SINGLE-FAMILY HOMES | TRENDS IMPROVE FROM LAST QUARTER
The average price for a home in Palm Beach County increased by 10% from the previous quarter and 2% from one year ago. Sales increased by 8% compared with the fourth quarter, though remained 16% lower than one year prior. Palm Beach County was the only area with an average price in excess of $1 million.
Neighborhood Snapshots
*ALL PERCENTAGES REFLECT YEAR OVER YEAR CHANGE. 600K 59 3,354 2,769 308 MEDIAN SALES PRICE AVERAGE DAYS ON MARKET ACTIVE LISTINGS SOLD LISTINGS MEDIAN PPSF ↑ 4% ↑ 74% ↑ 7% ↓ 16% ↑ 127%
MEDIAN SALES PRICE MEDIAN PRICE PER SF CLOSED SALES AVERAGE DAYS ON MARKET Q1 2023 Q1 2022 YOY% CHANGE Q1 2023 YOY% CHANGE Q1 2023 YOY% CHANGE Q1 2023 BOCA RATON $817,500 $775,000 5% $371 8% 424 -18% 66 BOYNTON BEACH $515,000 $490,000 5% $267 4% 410 18% 50 DELRAY BEACH $720,000 $630,000 14% $346 9% 261 -15% 58 HIGHLAND BEACH $2,750,000 $13,500,000 -80% $789 -44% 1 -80% 13 JUNO BEACH $1,987,000 $2,074,500 -4% $979 9% 2 -67% 54 JUPITER $840,000 $800,000 5% $407 7% 189 -1% 55 JUPITER INLET COLONY $4,500,000 $8,960,000 -50% $1,503 -13% 5 150% 107 LAKE PARK $401,000 $419,000 -4% $292 15% 10 -38% 23 LAKE WORTH $522,500 $475,000 10% $268 6% 274 -12% 57 LANTANA $420,000 $332,500 26% $308 24% 15 -38% 72 NORTH PALM BEACH $779,625 $975,000 -20% $399 -17% 30 -19% 45 MANALAPAN $6,625,000 $1,150,000 179% $1,494 88% 5 150% $156 PALM BEACH $8,300,000 $9,981,500 -17% $2,777 1% 7 -67% 193 PALM BEACH GARDENS $799,000 $813,000 -2% $378 4% 175 -4% 53 SINGER ISLAND $2,850,000 $2,200,000 30% $1,048 13% 5 25% 65 TEQUESTA $1,090,000 $918,000 19% $499 6% 16 0% 56 WELLINGTON $688,200 $693,000 -1% $281 0% 134 -22% 67 WEST PALM BEACH $475,000 $465,000 2% $286 10% 387 -12% 57
$ $
PALM BEACH COUNTY
CONDOMINIUMS | PRICING REMAINS STRONG
In the first quarter of 2023, there were 27% fewer sales than in the same period last year and the average time for a unit to sell increased by 61%. Pricing remained strong, up by 10% compared with one year ago.
Neighborhood Snapshots
*ALL PERCENTAGES REFLECT YEAR OVER YEAR CHANGE. 305K 55
2,682 222 MEDIAN SALES PRICE AVERAGE DAYS ON MARKET ACTIVE LISTINGS SOLD LISTINGS MEDIAN PPSF ↑ 10% ↑ 62% ↑ 10% ↓ 27% ↑ 195%
3,675
MEDIAN SALES PRICE MEDIAN PRICE PER SF CLOSED SALES AVERAGE DAYS ON MARKET Q1 2023 Q1 2022 YOY% CHANGE Q1 2023 YOY% CHANGE Q1 2023 YOY% CHANGE Q1 2023 BOCA RATON $330,000 $325,000 2% $245 4% 493 -27% 54 BOYNTON BEACH $291,250 $255,000 14% $203 13% 280 -24% 53 DELRAY BEACH $239,000 $210,000 14% $191 17% 411 -27% 55 HIGHLAND BEACH $1,022,500 $725,000 41% $637 27% 28 -53% 55 JUNO BEACH $757,500 $665,000 14% $512 9% 24 0% 72 JUPITER $550,000 $484,500 14% $351 12% 151 -10% 48 LAKE PARK $338,500 $310,000 9% $249 4% 10 -23% 62 LAKE WORTH $199,000 $169,000 18% $154 13% 144 -31% 66 LANTANA $272,500 $239,950 14% $229 8% 20 -41% 46 NORTH PALM BEACH $278,500 $410,000 -32% $247 -21% 56 -25% 61 PALM BEACH $1,305,000 $930,000 40% $741 41% 62 -45% 90 PALM BEACH GARDENS $387,500 $382,500 1% $270 2% 151 -10% 50 SINGER ISLAND $835,000 $812,000 3% $507 3% 29 -46% 110 TEQUESTA $375,000 $625,000 -40% $253 -23% 15 -52% 53 WELLINGTON $365,000 $355,000 3% $263 13% 34 -21% 41 WEST PALM BEACH $230,000 $199,950 15% $181 14% 453 -28% 51
$ $
MARTIN COUNTY
SINGLE-FAMILY HOMES | MEDIAN PRICE HIGHEST IN THE REGION, SALES RECOVER
The median price reached $625,000 in the first quarter of 2023, the highest in the region. Sales activity increased by 33% from last quarter, a strong rebound from continuous sales decline in the last two quarters, yet volume remained 14% lower than one year ago.
Neighborhood Snapshots
*ALL PERCENTAGES REFLECT YEAR OVER YEAR CHANGE. 625K 65 184 193 298 MEDIAN SALES PRICE AVERAGE DAYS ON MARKET ACTIVE LISTINGS SOLD LISTINGS MEDIAN PPSF ↑ 4% ↑ 86% ↑ 4% ↑ 3 % ↑ 2 02%
MEDIAN SALES PRICE MEDIAN PRICE PER SF CLOSED SALES AVERAGE DAYS ON MARKET Q1 2023 Q1 2022 YOY% CHANGE Q1 2023 YOY% CHANGE Q1 2023 YOY% CHANGE Q1 2023 HOBE SOUND $558,600 $479,740 16% $283 11% 24 358% 46 HUTCHINSON ISLAND $3,337,500 $4,975,000 -33% $867 12% 9 200% 69 JENSEN BEACH $525,000 $472,500 11% $281 4% 28 17% 53 JUPITER ISLAND $9,825,000 $13,525,000 -27% $2,453 12% 2 -67% 4 PALM CITY $725,000 $739,000 -2% $283 -3% 115 -18% 70 SEWALL'S POINT $3,900,000 $2,000,000 95% $723 2% 5 -58% 62 STUART $622,500 $535,000 16% $300 3% 68 33% 65
$ $
MARTIN COUNTY
CONDOMINIUMS | CONDO SALES BEGIN TO RECOVER
After slow sales activity in 2022, the first quarter of 2023 produced strong signs of a rebound. Sales were up by 27% from last quarter and 13% from the first quarter of 2022.
Neighborhood Snapshots
*ALL PERCENTAGES REFLECT YEAR OVER YEAR CHANGE. 296K 70 140 142 231 MEDIAN SALES PRICE AVERAGE DAYS ON MARKET ACTIVE LISTINGS SOLD LISTINGS MEDIAN PPSF ↑ 8 % ↑ 289% ↑ 2 % ↑ 13 % ↑ 268%
MEDIAN SALES PRICE MEDIAN PRICE PER SF CLOSED SALES AVERAGE DAYS ON MARKET Q1 2023 Q1 2022 YOY% CHANGE Q1 2023 YOY% CHANGE Q1 2023 YOY% CHANGE Q1 2023 HOBE SOUND $275,000 $225,000 22% $209 25% 15 114% 50 HUTCHINSON ISLAND $577,450 $564,900 2% $452 2% 28 4% 81 JENSEN BEACH $322,500 $182,000 77% $238 22% 12 33% 64 PALM CITY $304,350 $207,500 47% $216 48% 12 0% 61 STUART $236,500 $255,000 -7% $203 -9% 76 6% 72
$ $
INDIAN RIVER COUNTY
SINGLE-FAMILY HOMES | AVERAGE PRICE SURGES
The average quarterly price increased by 40% from one quarter ago, highlighting the shift towards higher-priced homes selling near the top range during the first quarter. Though sales remained lower than one year ago, volume increased by nearly 10% from the end of 2022.
Neighborhood Snapshots
*ALL PERCENTAGES REFLECT YEAR OVER YEAR CHANGE. 390K 77 792 542 233 MEDIAN SALES PRICE AVERAGE DAYS ON MARKET ACTIVE LISTINGS SOLD LISTINGS MEDIAN PPSF ↑ 4 % ↑ 31% ↑ 7% ↓ 18% ↑ 206%
MEDIAN SALES PRICE MEDIAN PRICE PER SF CLOSED SALES AVERAGE DAYS ON MARKET Q1 2023 Q1 2022 YOY% CHANGE Q1 2023 YOY% CHANGE Q1 2023 YOY% CHANGE Q1 2023 BARRIER ISLAND $1,250,000 $1,175,000 6% $513 12% 67 -20% 108 MAINLAND VERO BEACH $385,000 $365,000 5% $228 7% 249 -27% 83 SEBASTIAN/FELLSMERE $345,000 $329,900 5% $211 3% 77 -32% 83
$ $
INDIAN RIVER COUNTY
CONDOMINIUMS | PRICE AND SALES INCREASE
The median price increased by 15% year-over-year and by 10% from last quarter. Simultaneously, sales rebounded from a significant drop at the end of the year. Indian River County condo sales were 38% higher than last quarter, though remained lower than one year ago.
Neighborhood Snapshots
*ALL PERCENTAGES REFLECT YEAR OVER YEAR CHANGE. 300K 73 380 228 220 MEDIAN SALES PRICE AVERAGE DAYS ON MARKET ACTIVE LISTINGS SOLD LISTINGS MEDIAN PPSF ↑ 15% ↑ 43% ↑ 20% ↓ 14% ↑ 375%
MEDIAN SALES PRICE MEDIAN PRICE PER SF CLOSED SALES AVERAGE DAYS ON MARKET Q1 2023 Q1 2022 YOY% CHANGE Q1 2023 YOY% CHANGE Q1 2023 YOY% CHANGE Q1 2023 BARRIER ISLAND $605,000 $612,500 -1% $416 10% 55 -14% 69 MAINLAND VERO BEACH $258,250 $211,500 22% $192 15% 134 -22% 73 SEBASTIAN/FELLSMERE $287,500 $300,000 -4% $207 -10% 14 100% 107
$ $
BREVARD COUNTY
SINGLE-FAMILY HOMES | TIME ON MARKET LOWEST IN THE REGION
Brevard County homes spent the least amount of time on the market, on average, compared to the region. The county remained the most affordable in Southeast Florida.
Neighborhood Snapshots
*ALL PERCENTAGES REFLECT YEAR OVER YEAR CHANGE. 350K 45
202 MEDIAN
AVERAGE DAYS
MARKET ACTIVE
SOLD
MEDIAN PPSF ↑ 3% ↑ 137% ↑ 1% ↓ 9% ↑ 235%
1,420 2,156
SALES PRICE
ON
LISTINGS
LISTINGS
MEDIAN SALES PRICE MEDIAN PRICE PER SF CLOSED SALES AVERAGE DAYS ON MARKET Q1 2023 Q1 2022 YOY% CHANGE Q1 2023 YOY% CHANGE Q1 2023 YOY% CHANGE Q1 2023 COCOA $315,000 $308,000 2% $192 0% 232 4% 49 COCOA BEACH $625,000 $755,000 -17% $385 9% 17 -45% 59 GRANT $424,910 $630,000 -33% $208 -26% 15 -25% 59 INDIALANTIC $690,000 $582,500 18% $305 6% 40 33% 40 MALABAR $550,000 $530,000 4% $248 -1% 17 0% 46 MELBOURNE $385,000 $379,000 2% $223 4% 463 -13% 41 MELBOURNE BEACH $679,000 $772,500 -12% $368 2% 27 -34% 59 MERRITT ISLAND $470,000 $508,000 -7% $248 2% 147 -18% 51 MIMS $333,675 $303,310 10% $186 2% 74 118% 32 PALM BAY $332,500 $305,000 9% $185 4% 715 -3% 45 ROCKLEDGE $387,000 $395,000 -2% $211 -3% 146 5% 40 SATELLITE BEACH & INDIAN HARBOUR BEACH $550,000 $562,500 -2% $318 2% 60 -24% 42 TITUSVILLE $310,450 $300,000 3% $184 3% 148 -39% 51 WEST MELBOURNE $460,000 $445,000 3% $204 -4% 27 -18% 40
$ $
BREVARD COUNTY
INDIAN RIVER COUNTY TRENDS
CONDOMINIUMS
CONDOMINIUMS | PRICING TRENDS HIGHER
Lorem ipsum dolor sit amet, consectetur adipiscing elit. Maecenas sed commodo arcu. Mauris efficitur justo in quam faucibus pellentesque. In hac habitasse platea dictumst.
The median condo price increased by 8% from one year ago. On a per-square-foot basis, Brevard County had one of the highest median prices in the region, second only to Miami-Dade County.
Neighborhood Snapshots
*ALL PERCENTAGES REFLECT YEAR OVER YEAR CHANGE. 281K 51 438 404 244 MEDIAN SALES PRICE AVERAGE DAYS ON MARKET ACTIVE LISTINGS SOLD LISTINGS MEDIAN PPSF ↑ 8% ↑ 96% ↑ 5% ↓ 15% ↑ 172%
MEDIAN SALES PRICE MEDIAN PRICE PER SF CLOSED SALES AVERAGE DAYS ON MARKET Q1 2023 Q1 2022 YOY% CHANGE Q1 2023 YOY% CHANGE Q1 2023 YOY% CHANGE Q1 2023 COCOA $251,950 $245,200 3% $241 8% 14 -50% 33 COCOA BEACH $350,000 $378,000 -7% $298 -4% 63 -38% 56 INDIALANTIC $552,500 $515,000 7% $393 14% 40 111% 100 MELBOURNE $200,000 $172,500 16% $186 14% 62 2% 43 MELBOURNE BEACH $662,500 $555,000 19% $412 38% 9 -68% 91 MERRITT ISLAND $178,000 $184,999 -4% $173 -13% 19 -30% 36 PALM BAY $180,250 $137,000 32% $194 43% 18 6% 43 ROCKLEDGE $270,000 $215,000 26% $194 7% 31 0% 38 SATELLITE BEACH & INDIAN HARBOUR BEACH $447,500 $430,000 4% $311 -11% 32 -43% 52 TITUSVILLE $205,000 $146,750 40% $203 31% 35 3% 53 WEST MELBOURNE $227,500 $210,000 8% $163 -8% 10 67% 41
$ $
ST. JOHNS COUNTY
RESIDENTIAL | HIGHEST MEDIAN PRICE IN THE REGION
The median price decreased by 6% compared with a year ago, yet St. Johns County remained the highest-priced home market in the region.
Neighborhood Snapshots
*ALL PERCENTAGES REFLECT YEAR OVER YEAR CHANGE. 433K 80 892
235 MEDIAN SALES PRICE AVERAGE DAYS ON MARKET ACTIVE LISTINGS SOLD LISTINGS MEDIAN PPSF ↓ 6% ↑ 100% ↑ 2% ↓ 51% ↑ 56 %
1,276
MEDIAN SALES PRICE MEDIAN PRICE PER SF CLOSED SALES AVERAGE DAYS ON MARKET Q1 2023 Q1 2022 YOY% CHANGE Q1 2023 YOY% CHANGE Q1 2023 YOY% CHANGE Q1 2023 JULINGTON CREEK AREA $539,200 $538,000 0% $226 5% 116 -53% 79 NOCATEE $671,495 $648,190 4% $304 13% 66 -66% 73 PONTE VEDRA BEACH $691,500 $720,000 -4% $337 3% 72 -55% 72 SOUTHEAST ST JOHNS COUNTY $544,950 $480,000 14% $319 3% 82 -63% 77 ST AUGUSTINE BEACHES/ANASTASIA ISLAND $342,995 $373,635 -8% $212 3% 118 -53% 84 ST JOHNS $448,400 $504,950 -11% $228 0% 142 -38% 85 SOUTHWEST ST JOHNS COUNTY $389,900 $370,000 5% $227 2% 33 -52% 50 ST AUGUSTINE/VILANO BEACH $471,500 $534,450 -12% $258 1% 52 -58% 80 WORLD GOLF VILLAGE AREA/PALENCIA $425,990 $443,745 -4% $225 4% 169 -48% 88
$ $
DUVAL COUNTY
RESIDENTIAL | SALES DROP, SUPPLY STILL LIMITED
Sales volume dropped compared with last year, and homes remained on the market for a longer period of time prior to selling. For-sale inventory increased by less than 20%, the smallest increase in the region, underscoring that fewer sales are not causing the market to become oversaturated with listings.
Neighborhood Snapshots
*ALL PERCENTAGES REFLECT YEAR OVER YEAR CHANGE. 295K 67
189 MEDIAN
ACTIVE
SOLD
MEDIAN PPSF ↑ 2% ↑ 97% ↑ 4% ↓ 61% ↑ 18 %
1,004 1,814
SALES PRICE AVERAGE DAYS ON MARKET
LISTINGS
LISTINGS
MEDIAN SALES PRICE MEDIAN PRICE PER SF CLOSED SALES AVERAGE DAYS ON MARKET Q1 2023 Q1 2022 YOY% CHANGE Q1 2023 YOY% CHANGE Q1 2023 YOY% CHANGE Q1 2023 ARLINGTON/FORT CAROLINE $255,000 $270,000 -6% $179 1% 159 -64% 63 AVONDALE/RIVERSIDE/ORTEGA $350,500 $399,900 -12% $252 3% 52 -65% 67 BARTRAM $357,500 $333,000 7% $200 4% 44 -61% 57 BEACHES $576,750 $580,000 -1% $368 12% 102 -60% 66 BEAUCLERC/MANDARIN $355,000 $370,000 -4% $203 1% 141 -55% 59 DOWNTOWN JACKSONVILLE $151,500 $130,400 16% $137 21% 172 -64% 61 INTRACOASTAL $498,980 $452,500 10% $251 9% 167 -61% 60 NOCATEE (DUVAL) $424,000 $400,179 6% $246 17% 22 -39% 90 NORTH JACKSONVILLE $310,000 $325,000 -5% $172 3% 182 -55% 80 SAN MARCO/SAN JOSE $313,700 $338,500 -7% $214 5% 79 -50% 60 SOUTHSIDE $260,000 $250,000 4% $196 4% 223 -62% 68 WEST JACKSONVILLE $261,000 $262,090 0% $168 2% 364 -64% 75
$ $
CLAY COUNTY
RESIDENTIAL | PRICING STABILIZES
Sales volume decreased by more than 60% in Clay County year-over-year, one of the largest decreases in the region. The median price was slightly higher than last year.
Neighborhood Snapshots
*ALL PERCENTAGES REFLECT YEAR OVER YEAR CHANGE. 338K 84 258 418 181 MEDIAN SALES PRICE AVERAGE DAYS ON MARKET ACTIVE LISTINGS SOLD LISTINGS MEDIAN PPSF ↑ 1% ↑ 155% ↑ 3 % ↓ 61% ↑ 28%
MEDIAN SALES PRICE MEDIAN PRICE PER SF CLOSED SALES AVERAGE DAYS ON MARKET Q1 2023 Q1 2022 YOY% CHANGE Q1 2023 YOY% CHANGE Q1 2023 YOY% CHANGE Q1 2023 FLEMING ISLAND $410,000 $413,000 -1% $196 3% 45 -66% 59 GREEN COVE SPRINGS $341,995 $319,990 7% $178 -1% 46 -58% 94 MIDDLEBURG/KEYSTONE $330,000 $326,000 1% $192 6% 103 -61% 69 ORANGE PARK $299,000 $295,000 1% $175 3% 59 -68% 77 OAKLEAF PLANTATION $290,000 $351,495 -17% $179 7% 105 -47% 117
$ $
NASSAU COUNTY
RESIDENTIAL | PRICES DECLINE
Sales declined by the smallest amount in Nassau County compared with the surrounding region. The median price also declined in the last year, one of the few areas where prices fell.
Neighborhood Snapshots
*ALL PERCENTAGES REFLECT YEAR OVER YEAR CHANGE. 380K 83 297 559 201 MEDIAN SALES PRICE AVERAGE DAYS ON MARKET ACTIVE LISTINGS SOLD LISTINGS MEDIAN PPSF ↓ 9% ↑ 98% ↓ 4% ↓ 40% ↑ 61%
MEDIAN SALES PRICE MEDIAN PRICE PER SF CLOSED SALES AVERAGE DAYS ON MARKET Q1 2023 Q1 2022 YOY% CHANGE Q1 2023 YOY% CHANGE Q1 2023 YOY% CHANGE Q1 2023 AMELIA ISLAND/FERNANDINA BEACH $612,500 $535,000 14% $311 10% 148 -55% 72 YULEE/WILDLIGHT $347,995 $350,990 -1% $181 -2% 106 -15% 73
$ $
FLAGLER COUNTY
RESIDENTIAL | MEDIAN PRICE INCREASES
The median price increased by 4% compared with the first quarter of last year, though sales decreased by more than half. The average time on market more than doubled from last year.
Neighborhood Snapshots
*ALL PERCENTAGES REFLECT YEAR OVER YEAR CHANGE. 365K 71 475 525 203 MEDIAN SALES PRICE AVERAGE DAYS ON MARKET ACTIVE LISTINGS SOLD LISTINGS MEDIAN PPSF ↑ 4% ↑ 115% ↑ 3% ↓ 57% ↑ 75 %
MEDIAN SALES PRICE MEDIAN PRICE PER SF CLOSED SALES AVERAGE DAYS ON MARKET Q1 2023 Q1 2022 YOY% CHANGE Q1 2023 YOY% CHANGE Q1 2023 YOY% CHANGE Q1 2023 BUNNELL $312,990 $283,995 10% $181 -3% 24 9% 74 FLAGLER BEACH $682,500 $463,750 47% $341 10% 16 -74% 52 PALM COAST $369,000 $349,000 6% $198 2% 273 -61% 76
$ $
Sales Gallery Now Open | Priced from $3.85M 2406 SE 17th Street, Fort Lauderdale, FL 33316 (754) 231-3066 Residences@PierSixtySix.com PierSixtySixResidences.com Own the Waterfront Now Accepting Contracts A curated collection of 92 residences overlooking Fort Lauderdale’s legendary marina and Intracoastal waterways Obtain the Property Report required by Federal Law and read it before signing anything. No Federal or State agency has endorsed or judged the merits of value, if any, of this property. This is not an offer to sell or solicitation to buy real estate in any jurisdiction where prohibited by law. Products and availability are subject to change without notice. Improvements, facilities and programs may be in formative stages and cannot be guaranteed. Artist renderings are for illustrative purposes only and may differ from completed products.


Explore Your Mortgage Options > Bank on Better Finance your next home with 75 years of trusted Florida-based mortgage expertise at your side. Extensive local real estate experience and market knowledge. Flexible home loans with competitive rates. 1 Personalized service from application to close. Primary Residences & Second Homes Vacation Homes & Investment Properties New Construction & Land Acquisition Member FDIC NMLS#412469 © 2022 City National Bank of Florida 4218351587 / r03/23 1 Loans and lines of credit are subject to credit approval and program requirements. Fees and restrictions apply Terms and conditions subject to change.
ONE Sotheby’s International Realty prides itself in being at the forefront of innovation, service, and marketing that push the boundaries within our industry. Our commitment to providing the highest caliber of expertise and dedication sets us apart as we continue to raise the standard of excellence. As real estate’s most trusted brand, our name alone opens the most prestigious doors and creates opportunities to connect sellers and buyers worldwide. That is our mission: to give extraordinary lives a home to thrive.
#1
#1
#1
Our brand, your advantage Nothing
BEST BROKERAGE WEBSITE IN 2022 by South Florida Agent Magazine
compares.
© 2023 ONE Sotheby’s International Realty. All rights reserved. Sotheby’s International Realty® and the Sotheby’s International Realty Logo are service marks licensed to Sotheby’s International Realty Affiliates LLC and used with permission.
VOTED
VOTED
Luxury Lifestyle Magazine
BEST LUXURY BROKERAGE IN FLORIDA IN 2022 by
MOST
LUXURY
ESTATE
Source:
PROFILED
REAL
BRAND IN THE PRESS
Meltwater Jan 2022-Dec 2022 8x AWARD -WINNING MARKETING POWERHOUSE
For unmatched real estate expertise © 2023 ONE Sotheby’s International Realty. All rights reserved. Sotheby’s International Realty® and the Sotheby’s International Realty Logo are service marks licensed to Sotheby’s International Realty Affiliates LLC and used with permission. ONE Sotheby’s International Realty fully supports the principles of the Fair Housing Act and the Equal Opportunity Act. Each franchise is independently owned and operated. Any services or products provided by independently owned and operated franchisees are not provided by, affiliated with or related to Sotheby’s International Realty Affiliates LLC nor any of its affiliated companies. The information contained herein is deemed accurate but not guaranteed.
