TRENDS

TODAY’S REAL ESTATE ALONG FLORIDA’S EAST COAST
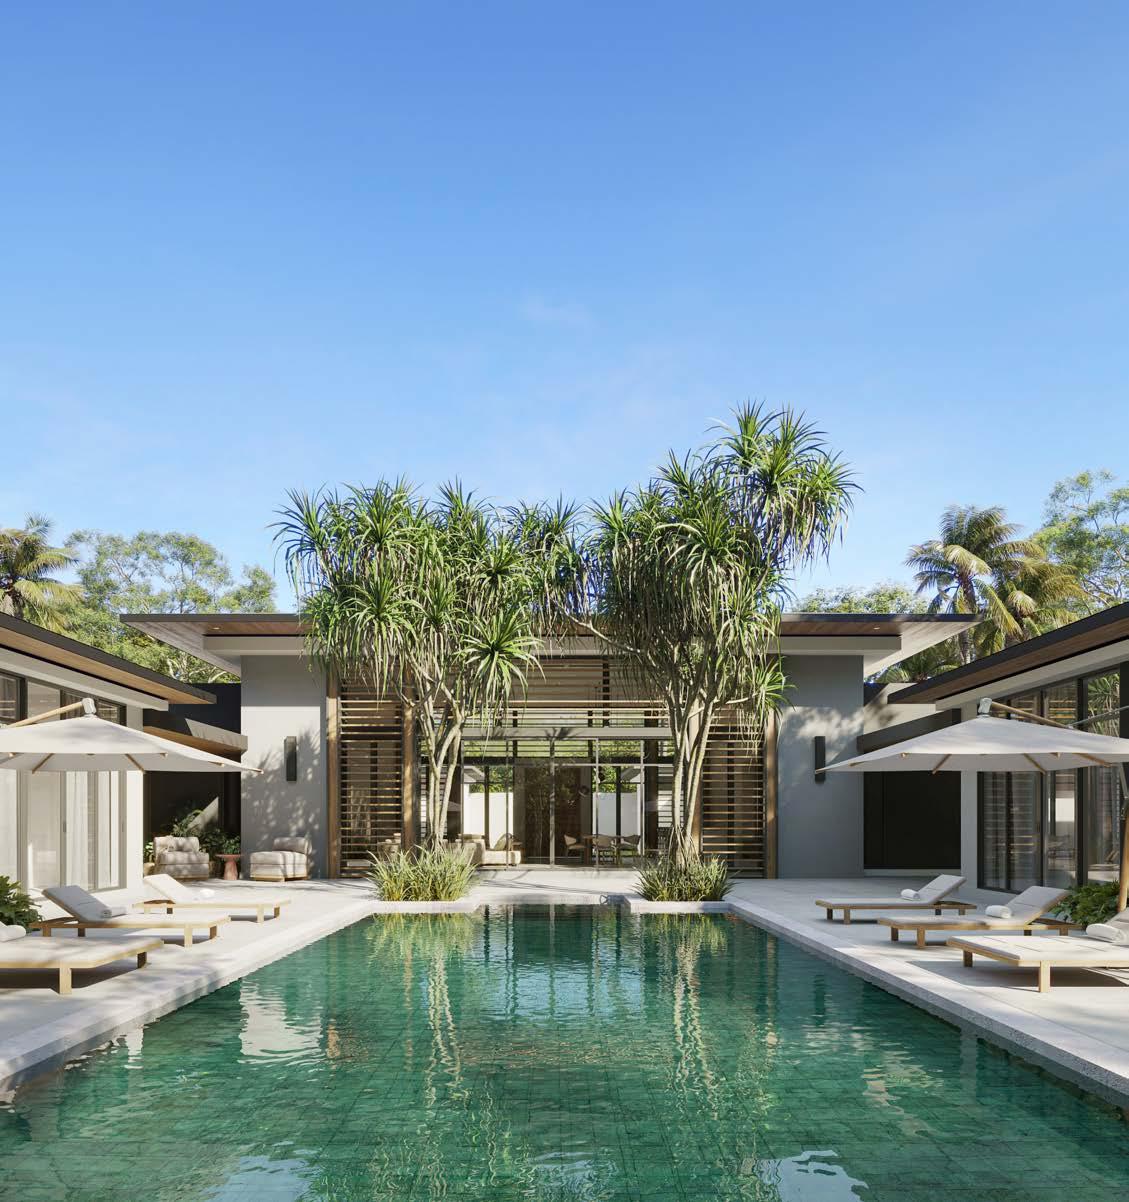
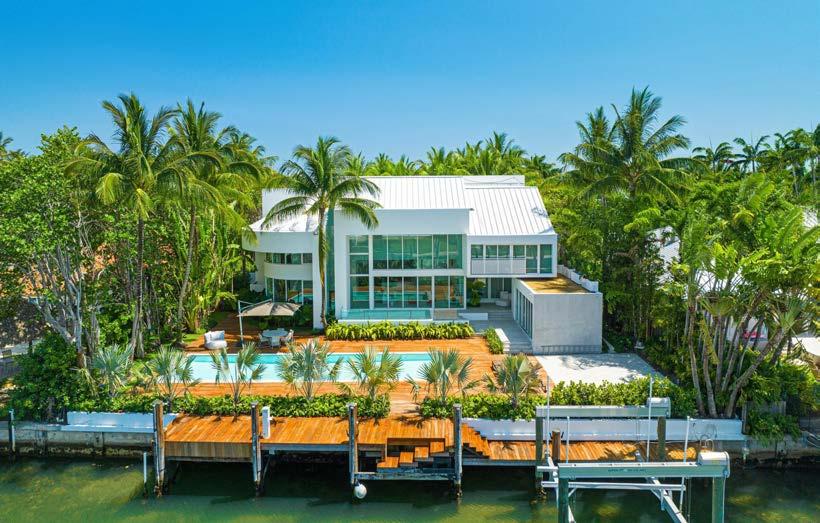
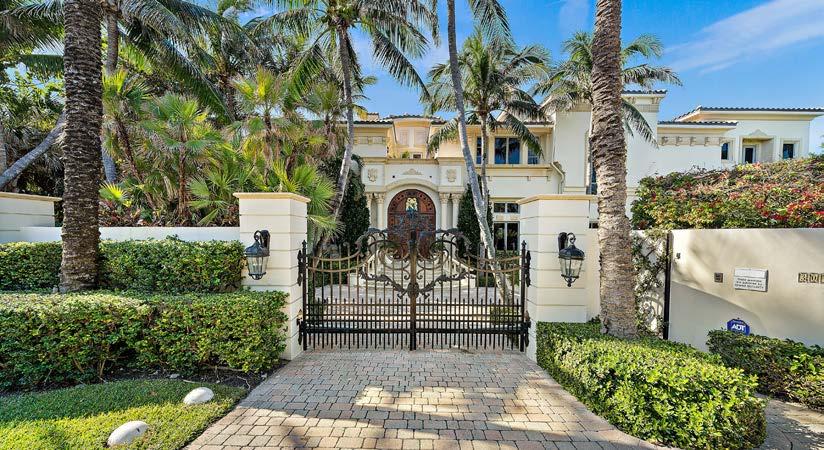
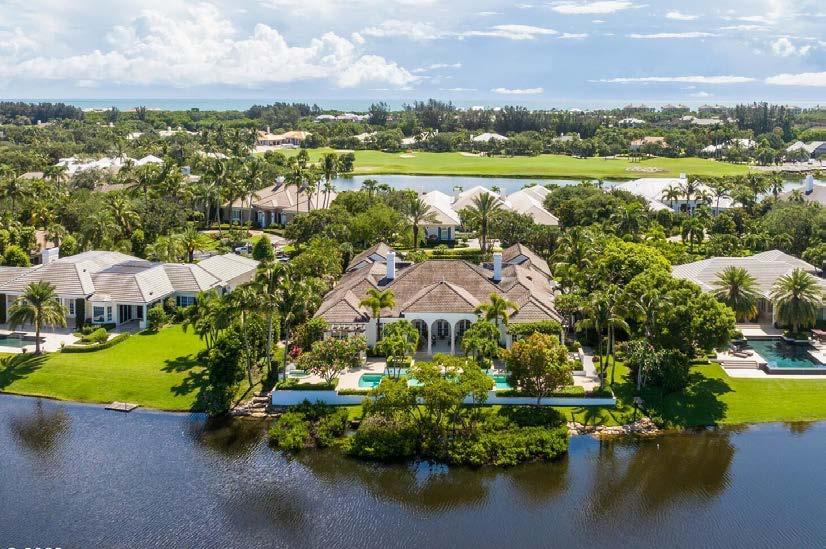
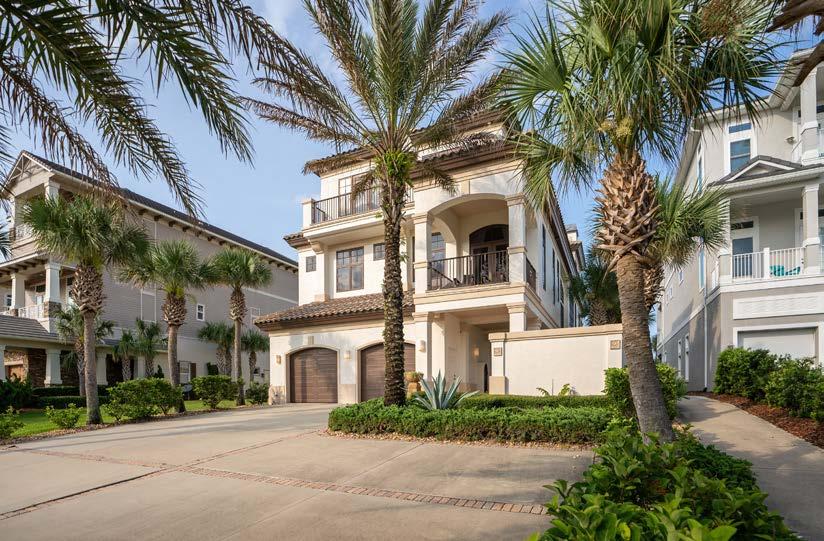
MARKET REPORT AUGUST 2023 FEATURED PROPERTY: 6371 SW 107 TH ST, PINECREST

CONTENTS 04 10 16 06 12 17 08 14 18 19 20 Miami-Dade County Martin County St. Johns County Broward County Indian River County Duval County Palm Beach County Brevard County Clay County Nassau County Flagler County


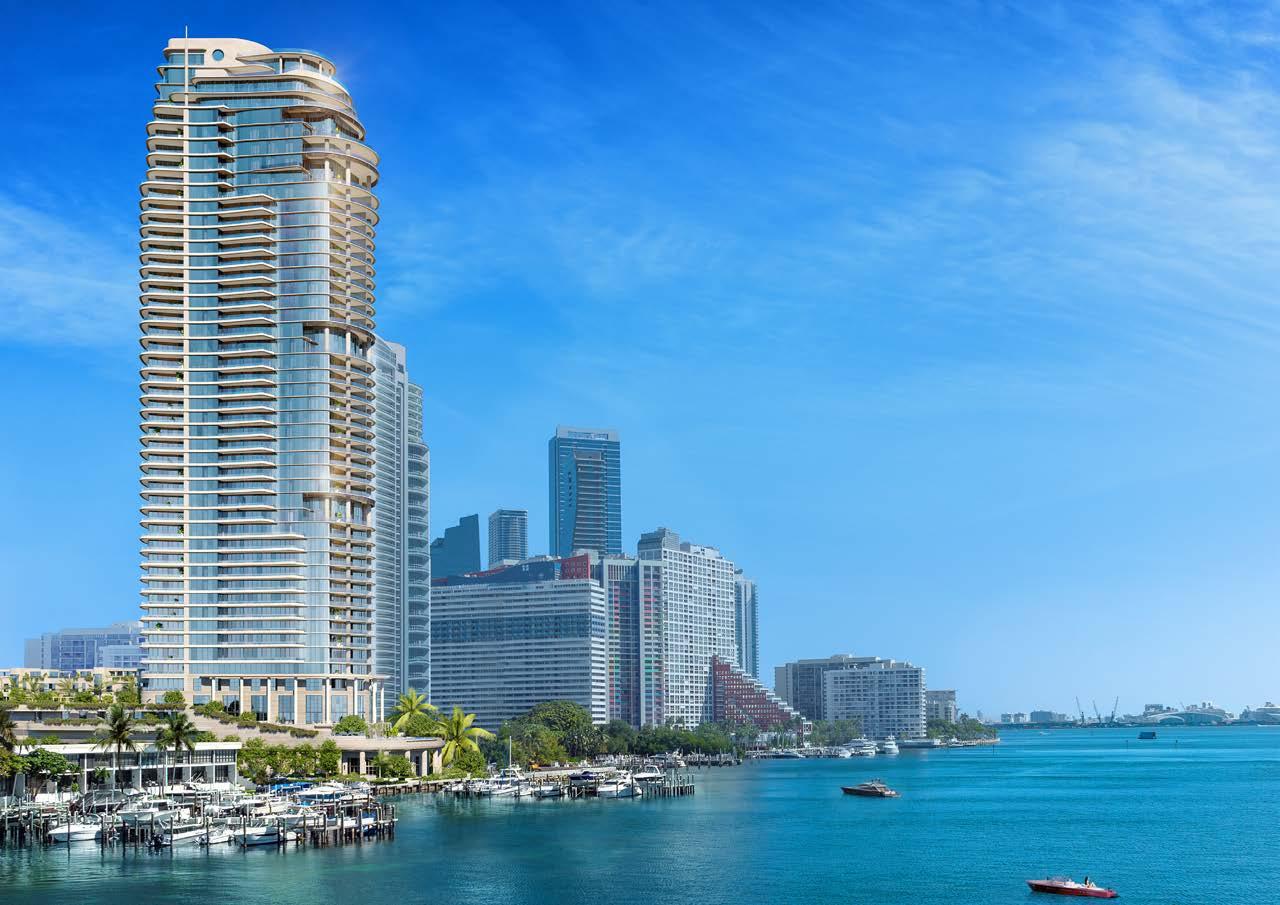

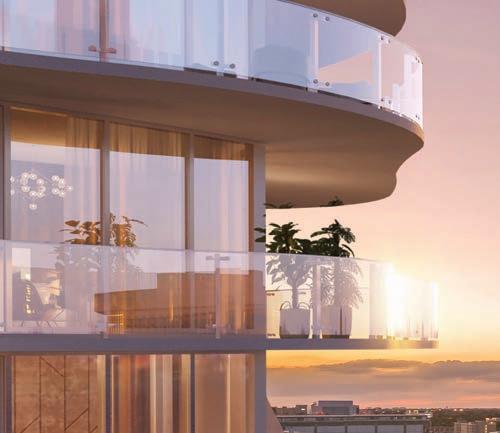
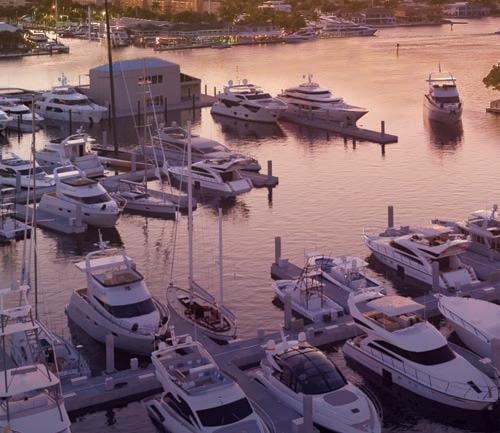
©2023 ONE Sotheby’s International Realty. All rights reserved. Sotheby’s International Realty® and the Sotheby’s International Realty Logo are service marks licensed to Sotheby’s International Realty Affiliates LLC and used with permission. ONE Sotheby’s International Realty fully supports the principles of the Fair Housing Act and the Equal Opportunity Act. Each franchise is independently owned and operated. Any services or products provided by independently owned and operated franchisees are not provided by, affiliated with or related to Sotheby’s International Realty Affiliates LLC or any of its affiliated companies. The information contained herein is deemed accurate but not guaranteed. Oral representations cannot be relied upon as correctly stating the representations of the developer. For correct representations, reference should be made to the documents required by section 718.503, Florida Statutes, to be furnished by a developer to a buyer or lessee. Pricing subject to change without notice. Situated along the beautiful coastline of South Brickell, with exquisite bayfront views, an on-property private marina, and an exclusive fine dining restaurant by Michelin-starred chef Fabio Trabocchi. The St. Regis Residences, Miami offer a lifetime of legendary moments - a place where the history and heritage of a timeless brand enables a signature way of life, propelled by impeccable service, world-class design and unparalleled connoisseurship. PRICED FROM $ 3.5M The St. Regis Residences, Miami SCHEDULE A PRIVATE PREVIEW 1809 Brickell Avenue, Miami, Florida 33129 Sales@MiamiSRR.com | +1 786 712 3495 | MiamiSRR.com Sales Gallery Now Open | By Appointment Only


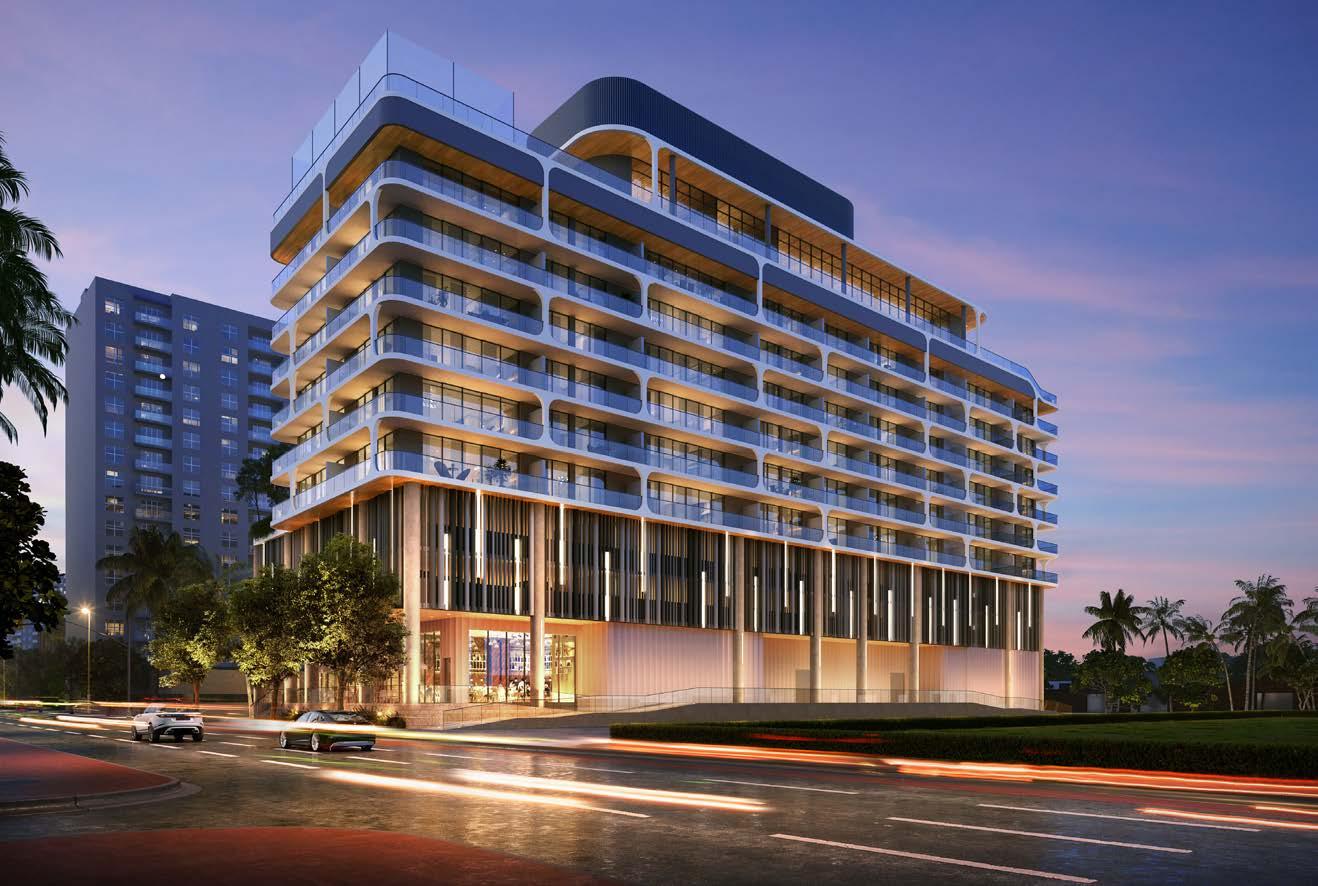
Sales Gallery Now Open | Priced from $3.85M 2406 SE 17th Street, Fort Lauderdale, FL 33316 (954) 393-0537 Residences@PierSixtySix.com PierSixtySixResidences.com Own the Waterfront Discover a curated collection of 91 condominium residences overlooking Fort Lauderdale’s legendary marina and Intracoastal waterways. Obtain the Property Report required by Federal Law and read it before signing anything. No Federal or State agency has endorsed or judged the merits of value, if any, of this property. This is not an offer to sell or solicitation to buy real estate in any jurisdiction where prohibited by law. Products and availability are subject to change without notice. Improvements, facilities and programs may be in formative stages and cannot be guaranteed. Artist renderings are for illustrative purposes only and may differ from completed products.
MIAMI-DADE COUNTY
SINGLE-FAMILY HOMES | COMPETITION REMAINS STRONG
The share of homes sold above the list price increased to 13%. Though pricing was lower than a year ago, the total number of homes sold increased by 2%.
Neighborhood Snapshots
MARKET DATA FOR SINGLE-FAMILY HOMES, $1,000,000+ *ALL PERCENTAGES REFLECT YEAR OVER YEAR CHANGE. 1.6M 72 1,512 205 627 MEDIAN SALES PRICE AVERAGE DAYS ON MARKET ACTIVE LISTINGS SOLD LISTINGS MEDIAN PPSF ↓ 14 % ↑ 64% ↓ 10 % ↑ 2 % ↑ 1%
MEDIAN SALES PRICE MEDIAN PRICE PER SF CLOSED SALES AVERAGE DAYS ON MARKET JUL 23 JUL 22 YOY% CHANGE JUL 23 YOY% CHANGE JUL 23 YOY% CHANGE JUL 23 AVENTURA $1,200,000 N/A N/A $513 N/A 1 -67% 11 BAL HARBOUR $6,800,000 N/A N/A $2,586 N/A 1 N/A 146 BAY HARBOR ISLANDS N/A N/A N/A N/A N/A - N/A N/A COCONUT GROVE $2,196,000 $2,100,000 5% $1,189 -5% 3 50% 5 CORAL GABLES $1,550,000 $2,240,000 -31% $843 -1% 20 -39% 40 GOLDEN BEACH N/A $19,000,000 N/A N/A N/A - N/A N/A INDIAN CREEK N/A N/A N/A N/A N/A - N/A N/A KEY BISCAYNE $4,500,000 $4,700,000 -4% $1,080 -14% 3 -50% 226 MIAMI $1,450,000 $1,575,000 -8% $556 -5% 63 43% 75 MIAMI BEACH $3,700,000 $4,000,000 -8% $1,115 -3% 15 15% 92 MIAMI SHORES $1,400,000 $1,222,500 15% $716 21% 9 50% 24 NORTH BAY VILLAGE $2,650,000 $2,425,000 9% $775 -37% 2 -33% 44 PINECREST $2,150,000 $2,175,000 -1% $683 2% 19 -21% 68 SOUTH MIAMI $1,126,000 $3,750,000 -70% $683 -13% 3 -40% 15 SUNNY ISLES BEACH N/A $2,350,000 N/A N/A N/A - N/A N/A SURFSIDE $2,700,000 $1,100,000 145% $913 15% 2 -60% 18
$ $
MIAMI-DADE COUNTY
CONDOMINIUMS | SALES INCREASE
The number of sales increased by 2% from last year while the average time on market increased by nearly 42%.
Neighborhood Snapshots
129 1,849 129 893 MEDIAN SALES PRICE AVERAGE DAYS ON MARKET ACTIVE LISTINGS SOLD LISTINGS MEDIAN PPSF ↓ 9 % ↑ 42 % 0 % ↑ 2% ↑ 1%
1.5M
MEDIAN SALES PRICE MEDIAN PRICE PER SF CLOSED SALES AVERAGE DAYS ON MARKET JUL 23 JUL 22 YOY% CHANGE JUL 23 YOY% CHANGE JUL 23 YOY% CHANGE JUL 23 AVENTURA $1,300,000 $1,875,000 -31% $525 -16% 9 -44% 175 BAL HARBOUR N/A $7,400,000 N/A N/A N/A - N/A N/A BAY HARBOR ISLANDS $2,200,000 $1,205,000 83% $655 -13% 1 -75% 152 BRICKELL/DOWNTOWN MIAMI/EDGEWATER $1,500,000 $1,825,000 -18% $807 -14% 23 5% 126 COCONUT GROVE $1,600,000 $1,350,000 19% $1,039 67% 3 -50% 39 CORAL GABLES $1,870,000 $2,226,540 -16% $754 -5% 2 -50% 43 FISHER ISLAND N/A N/A N/A N/A N/A - N/A N/A KEY BISCAYNE $1,625,000 $2,000,000 -19% $893 -16% 15 150% 122 MIAMI $1,250,000 $1,300,000 -4% $932 9% 15 -6% 96 MIAMI BEACH $1,662,500 $1,537,500 8% $1,275 18% 24 9% 198 MIAMI SHORES N/A N/A N/A N/A N/A - N/A N/A NORTH BAY VILLAGE N/A N/A N/A N/A N/A - N/A N/A PINECREST $1,500,000 N/A N/A $450 N/A 1 N/A 10 SUNNY ISLES BEACH $1,575,000 $2,050,000 -23% $878 -14% 20 -23% 108 SURFSIDE $3,462,500 $3,362,500 3% $1,826 4% 4 33% 86
$ $ *ALL PERCENTAGES REFLECT YEAR OVER YEAR CHANGE.
MARKET DATA FOR CONDOMINIUMS, $1,000,000+
BROWARD COUNTY
SINGLE-FAMILY HOMES | AVERAGE ASKING PRICE ON THE RISE
The average asking price increased by nearly 8% compared with one year ago, while the median sales price also increased by 3%, highlighting that continued price gains may be on the horizon.
Neighborhood Snapshots
1.5M 67 1,060 164 465 MEDIAN SALES PRICE AVERAGE DAYS ON MARKET ACTIVE LISTINGS SOLD LISTINGS MEDIAN PPSF ↑ 3% ↑ 128% ↑ 2 % ↓ 12% ↑ 6%
MEDIAN SALES PRICE MEDIAN PRICE PER SF CLOSED SALES AVERAGE DAYS ON MARKET JUL 23 JUL 22 YOY% CHANGE JUL 23 YOY% CHANGE JUL 23 YOY% CHANGE JUL 23 COOPER CITY $1,450,000 $1,250,000 16% $426 11% 4 100% 37 CORAL SPRINGS $1,100,000 $1,250,000 -12% $318 -5% 1 -75% 31 DAVIE $1,497,500 $1,500,000 0% $366 -8% 18 20% 103 DEERFIELD BEACH $1,250,000 $1,015,000 23% $613 83% 1 -67% 66 FORT LAUDERDALE $1,925,000 $2,217,500 -13% $694 -8% 42 -9% 86 HALLANDALE $4,050,000 N/A N/A $767 N/A 1 -50% 59 HILLSBORO BEACH N/A N/A N/A N/A N/A - N/A N/A HOLLYWOOD $1,340,000 $1,300,000 3% $520 7% 11 0% 50 LAUDERDALE-BY-THE-SEA $2,000,000 $1,774,500 13% $957 -3% 2 -33% 127 LIGHTHOUSE POINT $1,975,000 $2,712,500 -27% $688 -10% 8 33% 96 MIRAMAR $1,200,000 $1,390,000 -14% $305 -22% 5 67% 35 PARKLAND $1,375,000 $1,325,000 4% $395 -10% 31 24% 45 PEMBROKE PINES $1,050,000 $1,310,000 -20% $328 -21% 3 -70% 30 PLANTATION $1,537,500 $1,400,000 10% $463 10% 3 -73% 42 POMPANO BEACH $1,474,500 $1,655,000 -11% $741 -6% 8 0% 57 SOUTHWEST RANCHES $1,380,000 $1,859,000 -26% $443 -16% 7 40% 45 SUNRISE N/A N/A N/A N/A N/A - N/A N/A WESTON $1,460,000 $1,225,000 19% $422 6% 14 -58% 70 WILTON MANORS $1,060,000 $1,280,000 -17% $539 -7% 3 50% 44
$ $ MARKET
*ALL PERCENTAGES REFLECT YEAR OVER YEAR CHANGE.
DATA FOR SINGLE-FAMILY HOMES, $1,000,000+
BROWARD COUNTY
CONDOMINIUMS | HOMES SELLING FASTER
Compared with last year, condo sales in Broward County decreased by nearly 44%. At the same time, the average time spent on the market fell by 40%.
Neighborhood Snapshots
MEDIAN SALES PRICE MEDIAN PRICE PER SF CLOSED SALES AVERAGE DAYS ON MARKET JUL 23 JUL 22 YOY% CHANGE JUL 23 YOY% CHANGE JUL 23 YOY% CHANGE JUL 23 DEERFIELD BEACH N/A $2,250,000 N/A N/A N/A - N/A N/A FORT LAUDERDALE $1,550,000 $1,500,000 3% $744 11% 17 -37% 60 HALLANDALE N/A $2,273,750 N/A N/A N/A - N/A N/A HILLSBORO BEACH $1,162,500 $1,295,000 -10% $542 -10% 2 -50% 30 HOLLYWOOD $2,500,000 $1,650,000 52% $1,130 19% 2 -71% 120 LAUDERDALE-BY-THE-SEA $1,890,000 $1,700,000 11% $836 68% 3 200% 41 LIGHTHOUSE POINT N/A N/A N/A N/A N/A - N/A N/A WILTON MANORS N/A $1,150,000 N/A N/A N/A - N/A N/A WILTON MANORS N/A N/A N/A N/A N/A - N/A N/A
MARKET DATA FOR CONDOMINIUMS,
*ALL PERCENTAGES REFLECT YEAR OVER YEAR CHANGE.
MEDIAN SALES PRICE AVERAGE DAYS ON MARKET ACTIVE LISTINGS SOLD LISTINGS MEDIAN PPSF ↓ 3% ↓ 40% ↓ 11% ↓ 44% ↑ 33%
$1,000,000+
1.5M 61 415 27 691
$ $
PALM BEACH COUNTY
SINGLE-FAMILY HOMES | MARKET REMAINS STABLE
Market conditions remained the same compared to this time last year with sales up by 1% and steady pricing.
Neighborhood Snapshots
80 1,482 239 527 MEDIAN SALES PRICE AVERAGE DAYS ON MARKET ACTIVE LISTINGS SOLD LISTINGS MEDIAN PPSF 0 % ↑ 115% ↓ 2 % ↑ 1% ↑ 9%
1.7M
MEDIAN SALES PRICE MEDIAN PRICE PER SF CLOSED SALES AVERAGE DAYS ON MARKET JUL 23 JUL 22 YOY% CHANGE JUL 23 YOY% CHANGE JUL 23 YOY% CHANGE JUL 23 BOCA RATON $1,900,000 $1,600,000 19% $527 12% 69 -10% 82 BOYNTON BEACH $1,235,000 $1,375,000 -10% $366 -42% 14 56% 49 DELRAY BEACH $1,925,000 $1,699,000 13% $532 -10% 33 6% 65 HIGHLAND BEACH $4,650,000 N/A N/A $948 N/A 1 -83% 34 JUNO BEACH $2,180,000 N/A N/A $1,097 N/A 1 -50% 2 JUPITER $1,600,000 $1,900,000 -16% $558 -6% 33 32% 83 JUPITER INLET COLONY N/A N/A N/A N/A N/A - N/A N/A LAKE PARK N/A N/A N/A N/A N/A - N/A N/A LAKE WORTH $1,083,294 $1,350,000 -20% $347 -5% 5 67% 30 LANTANA $4,135,490 $3,200,000 29% $939 -39% 1 -67% 29 NORTH PALM BEACH $2,750,000 $2,800,000 -2% $935 -31% 3 200% 85 MANALAPAN $16,500,000 $26,775,000 -38% $6,864 11% 1 0% 137 PALM BEACH $33,450,000 $6,750,000 396% $5,248 68% 2 -89% 255 PALM BEACH GARDENS $1,495,357 $1,750,000 -15% $489 -10% 25 -32% 101 SINGER ISLAND N/A $6,250,000 N/A N/A N/A - N/A N/A TEQUESTA $3,797,500 N/A N/A $984 N/A 2 -33% 69 WELLINGTON $2,142,500 $1,495,000 43% $554 31% 14 8% 99 WEST PALM BEACH $1,582,000 $1,800,000 -12% $520 -38% 15 -25% 78
$ $ MARKET DATA FOR SINGLE-FAMILY HOMES, $1,000,000+ *ALL PERCENTAGES REFLECT YEAR OVER YEAR CHANGE.
PALM BEACH COUNTY
CONDOMINIUMS | HIGHER-PRICED UNITS SELLING
Sales were higher than one year ago, but compared with June, monthly sales decreased. More higher-priced units sold in July, driving the median price to $2.4 million.
Neighborhood Snapshots
2.4M 119 472 61 1,063 MEDIAN SALES PRICE AVERAGE DAYS ON MARKET ACTIVE LISTINGS SOLD LISTINGS MEDIAN PPSF ↑ 41% ↑ 239% ↑ 28% ↑ 24% ↑ 30%
MEDIAN SALES PRICE MEDIAN PRICE PER SF CLOSED SALES AVERAGE DAYS ON MARKET JUL 23 JUL 22 YOY% CHANGE JUL 23 YOY% CHANGE JUL 23 YOY% CHANGE JUL 23 BOCA RATON $1,712,500 $2,169,375 -21% $818 4% 12 20% 58 BOYNTON BEACH N/A N/A N/A N/A N/A - N/A N/A DELRAY BEACH $1,527,500 $1,750,000 -13% $881 -6% 6 -14% 75 HIGHLAND BEACH $2,020,000 $1,870,000 8% $771 -8% 4 -33% 42 JUNO BEACH $2,397,050 N/A N/A $921 N/A 2 0% 126 JUPITER $2,362,500 $1,350,000 75% $985 27% 2 -71% 51 JUPITER INLET COLONY N/A N/A N/A N/A N/A - N/A N/A LAKE PARK N/A N/A N/A N/A N/A - N/A N/A LAKE WORTH N/A N/A N/A N/A N/A - N/A N/A LANTANA N/A N/A N/A N/A N/A - N/A N/A NORTH PALM BEACH $1,900,000 $2,410,000 -21% $792 -1% 2 100% 191 MANALAPAN N/A N/A N/A N/A N/A - N/A N/A PALM BEACH $2,550,000 $2,637,500 -3% $1,816 2% 4 -33% 55 PALM BEACH GARDENS N/A $1,125,000 N/A N/A N/A - N/A N/A SINGER ISLAND $1,200,000 $1,312,500 -9% $731 -13% 3 0% 111 TEQUESTA $2,400,000 N/A N/A $873 N/A 1 0% 181 WELLINGTON N/A $1,700,000 N/A N/A N/A - N/A N/A WEST PALM BEACH $3,101,854 $1,375,000 126% $1,312 50% 24 700% 180
$ $ MARKET DATA FOR
*ALL PERCENTAGES REFLECT YEAR OVER YEAR CHANGE.
CONDOMINIUMS, $1,000,000+
MARTIN COUNTY
SINGLE-FAMILY HOMES | MEDIAN PRICE INCREASES
The median sales price increased by 9% from July of last year and was up by 18% from last month. The number of homes sold increased by nearly 11% compared with last year.
Neighborhood Snapshots
825K 45 155
MEDIAN SALES PRICE AVERAGE DAYS ON MARKET ACTIVE LISTINGS SOLD LISTINGS MEDIAN PPSF ↑ 9% ↑ 112% 0% ↑ 11% ↑ 3%
51 334
MEDIAN SALES PRICE MEDIAN PRICE PER SF CLOSED SALES AVERAGE DAYS ON MARKET JUL 23 JUL 22 YOY% CHANGE JUL 23 YOY% CHANGE JUL 23 YOY% CHANGE JUL 23 HOBE SOUND $630,000 $700,000 -10% $364 3% 3 -25% 24 HUTCHINSON ISLAND $4,000,000 $805,000 397% $772 19% 3 200% 39 JENSEN BEACH $752,500 $600,000 25% $318 10% 4 0% 11 JUPITER ISLAND $16,500,000 $3,675,000 349% $3,122 149% 3 0% 149 PALM CITY $845,000 $810,000 4% $318 -1% 45 61% 43 SEWALL'S POINT $1,840,000 $1,088,000 69% $716 87% 1 -83% 181 STUART $750,000 $630,000 19% $318 5% 16 14% 53
$ $ *ALL PERCENTAGES REFLECT YEAR OVER YEAR CHANGE. MARKET DATA FOR SINGLE-FAMILY HOMES, $500,000+
MARTIN COUNTY
MARKET
DATA FOR CONDOMINIUMS, $500,000+
CONDOMINIUMS | FEWER UNITS FOR SALE
Neighborhood Snapshots
631K 57 22 4
AVERAGE DAYS ON MARKET
443
ACTIVE LISTINGS SOLD LISTINGS
MEDIAN SALES PRICE
MEDIAN PPSF
0 % ↑ 124% ↓ 4 % 0 %
$ $ *ALL PERCENTAGES REFLECT YEAR OVER YEAR CHANGE.
↓ 19 %
Active listings decreased by 19% compared with last year. With fewer available units, sales and pricing leveled off. MEDIAN SALES PRICE MEDIAN PRICE PER SF CLOSED SALES AVERAGE DAYS ON MARKET JUL 23 JUL 22 YOY% CHANGE JUL 23 YOY% CHANGE JUL 23 YOY% CHANGE JUL 23 HOBE SOUND N/A N/A N/A N/A N/A - N/A N/A HUTCHINSON ISLAND $611,750 $540,000 13% $460 -3% 3 50% 58 JENSEN BEACH N/A N/A N/A N/A N/A - N/A N/A JUPITER ISLAND N/A N/A N/A N/A N/A - N/A N/A PALM CITY N/A N/A N/A N/A N/A - N/A N/A SEWAL’S POINT N/A N/A N/A N/A N/A - N/A N/A STUART $650,000 $792,500 -18% $416 -2% 1 -67% 51
INDIAN RIVER COUNTY
SINGLE-FAMILY HOMES | STRONG PRICE APPRECIATION
The median price of homes sold for more than $500,000 increased by 31% compared with one year ago. The number of sales also increased by 18% compared with last July.
Neighborhood Snapshots
813K 93 386 71 314 MEDIAN SALES PRICE AVERAGE DAYS ON MARKET ACTIVE LISTINGS SOLD LISTINGS MEDIAN PPSF ↑ 31% ↑ 86% ↑ 15 % ↑ 18 % ↑ 47%
MEDIAN SALES PRICE MEDIAN PRICE PER SF CLOSED SALES AVERAGE DAYS ON MARKET JUL 23 JUL 22 YOY% CHANGE JUL 23 YOY% CHANGE JUL 23 YOY% CHANGE JUL 23 BARRIER ISLAND $1,650,000 $1,303,750 27% $577 18% 19 58% 79 MAINLAND VERO BEACH $700,000 $592,500 18% $282 16% 40 18% 106 SEBASTIAN/FELLSMERE $650,001 $570,000 14% $189 -17% 3 -40% 89
$ $ MARKET DATA FOR SINGLE-FAMILY HOMES, $500,000+ *ALL PERCENTAGES REFLECT YEAR OVER YEAR CHANGE.
INDIAN RIVER COUNTY
CONDOMINIUMS | SALES REMAIN HIGH
Condo sales remained elevated in July, with a 73% increase in closed sales compared with last year. The median sales price was also up by 18%.
Neighborhood Snapshots
825K 164 88 19 418 MEDIAN SALES PRICE AVERAGE DAYS ON MARKET ACTIVE LISTINGS SOLD LISTINGS MEDIAN PPSF ↑ 18 % ↑ 77% 0 % ↑ 73% ↑ 38%
MEDIAN SALES PRICE MEDIAN PRICE PER SF CLOSED SALES AVERAGE DAYS ON MARKET JUL 23 JUL 22 YOY% CHANGE JUL 23 YOY% CHANGE JUL 23 YOY% CHANGE JUL 23 BARRIER ISLAND $785,000 $999,000 -21% $381 -11% 15 200% 179 MAINLAND VERO BEACH $1,170,000 $592,450 97% $593 125% 3 -25% 130 SEBASTIAN/FELLSMERE N/A N/A N/A N/A N/A - N/A N/A
$ $ *ALL PERCENTAGES REFLECT YEAR OVER YEAR CHANGE. MARKET DATA FOR CONDOMINIUMS, $500,000+
BREVARD COUNTY
SINGLE-FAMILY HOMES | HOMES SELLING FAST
Homes in Brevard County spent an average of 30 days on the market in July, the lowest level in the region. Roughly 13% of homes sold at a premium to the list price, the second-highest share in East Central Florida.
Neighborhood Snapshots
655K 30 514 195 290 MEDIAN SALES PRICE AVERAGE DAYS ON MARKET ACTIVE LISTINGS SOLD LISTINGS MEDIAN PPSF ↓ 1% ↑ 97 % ↑ 6 % ↓ 5% ↑ 7%
MEDIAN SALES PRICE MEDIAN PRICE PER SF CLOSED SALES AVERAGE DAYS ON MARKET JUL 23 JUL 22 YOY% CHANGE JUL 23 YOY% CHANGE JUL 23 YOY% CHANGE JUL 23 COCOA $662,500 $625,000 6% $299 29% 6 -33% 33 COCOA BEACH $939,101 $820,000 15% $467 16% 13 117% 24 GRANT $780,000 $795,000 -2% $241 -31% 3 200% 40 INDIALANTIC $691,000 $860,000 -20% $337 5% 16 60% 19 MALABAR $665,000 $774,900 -14% $269 9% 3 0% 65 MELBOURNE $635,000 $641,000 -1% $275 3% 65 -3% 23 MELBOURNE BEACH $835,750 $805,500 4% $361 -15% 12 20% 71 MERRITT ISLAND $600,000 $674,900 -11% $302 -6% 21 -43% 39 MIMS $600,000 $600,000 0% $251 -5% 3 50% 17 PALM BAY $530,000 $527,500 0% $203 -5% 7 -42% 12 ROCKLEDGE $663,050 $607,500 9% $274 0% 14 -13% 19 SATELLITE BEACH & INDIAN HARBOUR BEACH $627,500 $660,000 -5% $349 9% 16 -6% 25 TITUSVILLE $532,000 $585,000 -9% $232 13% 9 -25% 49 WEST MELBOURNE $592,500 $570,000 4% $213 -12% 6 20% 48
$ $ MARKET DATA FOR SINGLE-FAMILY
YEAR
YEAR CHANGE.
HOMES, $500,000+ *ALL PERCENTAGES REFLECT
OVER
BREVARD COUNTY
CONDOMINIUMS | CONDO PRICING ON PAR WITH LAST YEAR
The median price of condominiums was roughly on par with one year ago. July saw an increase of 24% in active listings compared to 2022.
Neighborhood Snapshots
MEDIAN SALES PRICE MEDIAN PRICE PER SF CLOSED SALES AVERAGE DAYS ON MARKET JUL 23 JUL 22 YOY% CHANGE JUL 23 YOY% CHANGE JUL 23 YOY% CHANGE JUL 23 COCOA $575,000 $695,000 -17% $356 14% 1 0% 5 COCOA BEACH $610,000 $602,500 1% $453 6% 9 13% 69 INDIALANTIC $714,500 $875,000 -18% $373 -40% 4 -20% 131 MELBOURNE $520,000 $682,450 -24% $195 -36% 1 -80% 69 MELBOURNE BEACH N/A $644,000 N/A N/A N/A - N/A N/A MERRITT ISLAND $511,250 $658,700 -22% $222 -30% 2 0% 45 PALM BAY N/A N/A N/A N/A N/A - N/A N/A ROCKLEDGE $891,500 N/A N/A $313 N/A 1 N/A 36 SATELLITE BEACH & INDIAN HARBOUR BEACH $757,500 $723,500 5% $397 -9% 6 50% 36 TITUSVILLE $660,000 $548,139 20% $244 -4% 1 0% 89 WEST MELBOURNE N/A N/A N/A N/A N/A - N/A N/A
615K 57 169 29 393 MEDIAN SALES PRICE AVERAGE DAYS ON MARKET ACTIVE LISTINGS SOLD LISTINGS MEDIAN PPSF ↓ 1% ↑ 31% ↑ 20 % ↓ 12% ↑ 24% $ $
*ALL PERCENTAGES REFLECT YEAR OVER YEAR CHANGE.
MARKET DATA FOR CONDOMINIUMS, $500,000+
ST. JOHNS COUNTY
ALL RESIDENTIAL | ACTIVITY ACCELERATES
Sales were up by 2% compared with last year while for-sale inventory fell by 12%.
700K 64
283
480 432
MEDIAN SALES PRICE
PPSF ↑ 1% ↑ 110%
MEDIAN ↓ 12 %
MEDIAN SALES PRICE MEDIAN PRICE PER SF CLOSED SALES AVERAGE DAYS ON MARKET JUL 23 JUL 22 YOY% CHANGE JUL 23 YOY% CHANGE JUL 23 YOY% CHANGE JUL 23 JULINGTON CREEK AREA $677,500 $640,000 6% $236 -1% 59 -5% 59 NOCATEE $749,000 $773,059 -3% $305 -1% 62 5% 68 PONTE VEDRA BEACH $1,250,000 $1,275,000 -2% $430 0% 53 51% 60 SOUTHEAST ST JOHNS COUNTY $705,000 $693,200 2% $404 10% 35 -5% 73 ST AUGUSTINE BEACHES/ANASTASIA ISLAND $835,500 $620,000 35% $367 44% 8 -27% 66 ST JOHNS $635,000 $629,850 1% $250 -1% 59 28% 84 SOUTHWEST ST JOHNS COUNTY $703,888 $554,900 27% $282 18% 4 33% 89 ST AUGUSTINE/VILANO BEACH $875,000 $772,500 13% $397 37% 17 -43% 57 WORLD GOLF VILLAGE AREA/PALENCIA $593,900 $602,720 -1% $225 -7% 56 4% 59
AVERAGE DAYS ON MARKET ACTIVE LISTINGS SOLD LISTINGS ↑ 1% ↑ 2 %
Neighborhood Snapshots
$ $ MARKET DATA FOR RESIDENTIAL PROPERTIES, $500,000+ *ALL PERCENTAGES REFLECT YEAR OVER YEAR CHANGE.
DUVAL COUNTY
ALL RESIDENTIAL | INVENTORY TRENDS LOWER
Active listings are down by 30% compared with July of last year. During the same period, sales increased by 1%.
Neighborhood Snapshots
685K
205
MEDIAN SALES PRICE AVERAGE DAYS ON MARKET ACTIVE LISTINGS SOLD LISTINGS MEDIAN PPSF ↑ 1% ↑ 39% ↓ 1% ↑ 1% ↓ 30 %
40
203 290
MEDIAN SALES PRICE MEDIAN PRICE PER SF CLOSED SALES AVERAGE DAYS ON MARKET JUL 23 JUL 22 YOY% CHANGE JUL 23 YOY% CHANGE JUL 23 YOY% CHANGE JUL 23 ARLINGTON/FORT CAROLINE $620,000 $600,000 3% $249 15% 6 0% 28 AVONDALE/RIVERSIDE/ORTEGA $645,000 $654,950 -2% $295 -11% 17 42% 44 BARTRAM $614,200 $550,000 12% $215 2% 4 0% 42 BEACHES $749,000 $945,000 -21% $427 -8% 49 17% 31 BEAUCLERC/MANDARIN $675,000 $620,000 9% $244 8% 15 -48% 39 DOWNTOWN JACKSONVILLE $531,000 N/A N/A $266 N/A 4 33% 41 INTRACOASTAL $765,000 $659,140 16% $286 -3% 65 8% 48 NOCATEE (DUVAL) $524,900 $513,556 2% $204 -2% 1 0% 52 NORTH JACKSONVILLE $718,500 $947,715 -24% $224 -9% 5 25% 30 SAN MARCO/SAN JOSE $760,000 $775,000 -2% $296 -12% 13 -13% 47 SOUTHSIDE $595,250 $575,000 4% $225 -8% 14 8% 32 WEST JACKSONVILLE $525,000 $582,500 -10% $210 -19% 1 -50% 98
$ $ MARKET DATA FOR RESIDENTIAL PROPERTIES, $500,000+ *ALL PERCENTAGES REFLECT YEAR OVER YEAR CHANGE.
CLAY COUNTY
ALL RESIDENTIAL | LIST PRICES RISING
The list price of available homes increased by more than 5% compared with one year ago, while the median sales price remained unchanged.
Neighborhood Snapshots
596K
207 MEDIAN SALES PRICE AVERAGE DAYS ON MARKET ACTIVE LISTINGS SOLD LISTINGS MEDIAN PPSF 0 % ↑ 113% ↓ 4 % ↓ 12% ↓ 33 %
55 45 43
MEDIAN SALES PRICE MEDIAN PRICE PER SF CLOSED SALES AVERAGE DAYS ON MARKET JUL 23 JUL 22 YOY% CHANGE JUL 23 YOY% CHANGE JUL 23 YOY% CHANGE JUL 23 FLEMING ISLAND $602,000 $592,500 2% $219 1% 14 -36% 46 GREEN COVE SPRINGS $606,500 $595,000 2% $218 0% 8 167% 52 MIDDLEBURG/KEYSTONE $567,500 $624,750 -9% $205 -7% 8 -20% 84 ORANGE PARK $690,000 $511,000 35% $283 56% 3 0% 87 OAKLEAF PLANTATION $599,438 $540,000 11% $175 3% 8 14% 38
$ $ MARKET DATA FOR RESIDENTIAL PROPERTIES, $500,000+ *ALL PERCENTAGES REFLECT YEAR OVER YEAR CHANGE.
NASSAU COUNTY
ALL RESIDENTIAL | SALES INCREASE
The volume of closed sales increased by more than 7% from last year, bucking the trend produced in nearby counties.
Neighborhood Snapshots
650K 72 157 118 296 MEDIAN SALES PRICE AVERAGE DAYS ON MARKET ACTIVE LISTINGS SOLD LISTINGS MEDIAN PPSF ↓ 6 % ↑ 131% ↓ 7 % ↑ 7 % ↑ 8 %
MEDIAN SALES PRICE MEDIAN PRICE PER SF CLOSED SALES AVERAGE DAYS ON MARKET JUL 23 JUL 22 YOY% CHANGE JUL 23 YOY% CHANGE JUL 23 YOY% CHANGE JUL 23 AMELIA ISLAND/FERNANDINA BEACH $675,000 $760,000 -11% $345 -6% 59 4% 76 YULEE/WILDLIGHT $590,000 $606,495 -3% $180 -31% 2 -67% 40
$ $ MARKET DATA FOR RESIDENTIAL PROPERTIES, $500,000+ *ALL PERCENTAGES REFLECT YEAR OVER YEAR CHANGE.
FLAGLER COUNTY
ALL RESIDENTIAL | HIGHEST PRICE INCREASE
The median price increased by nearly 10% from last year, the largest increase in the northeast Florida region.
Neighborhood Snapshots
712K 73 134 95 330 MEDIAN SALES PRICE AVERAGE DAYS ON MARKET ACTIVE LISTINGS SOLD LISTINGS MEDIAN PPSF ↑ 10 % ↑ 148 % ↑ 7 % ↓ 15% ↑ 16 %
MEDIAN SALES PRICE MEDIAN PRICE PER SF CLOSED SALES AVERAGE DAYS ON MARKET JUL 23 JUL 22 YOY% CHANGE JUL 23 YOY% CHANGE JUL 23 YOY% CHANGE JUL 23 BUNNELL $697,000 $642,500 8% $210 -2% 2 100% 66 FLAGLER BEACH $759,000 $640,000 19% $393 -3% 13 63% 80 PALM COAST $662,000 $638,750 4% $311 6% 44 -27% 63
$ $ MARKET DATA FOR RESIDENTIAL PROPERTIES, $500,000+ *ALL PERCENTAGES REFLECT YEAR OVER YEAR CHANGE.

©2023 ONE Sotheby’s International Realty. All rights reserved. Sotheby’s International Realty® and the Sotheby’s International Realty Logo are service marks licensed to Sotheby’s International Realty Affiliates LLC and used with permission. ONE Sotheby’s International Realty fully supports the principles of the Fair Housing Act and the Equal Opportunity Act. Each franchise is independently owned and operated. Any services or products provided by independently owned and operated franchisees are not provided by, affiliated with or related to Sotheby’s International Realty Affiliates LLC or any of its affiliated companies. The information contained herein is deemed accurate but not guaranteed. Oral representations cannot be relied upon as correctly stating the representations of the developer. For correct representations, reference should be made to the documents required by section 718.503, Florida Statutes, to be furnished by a developer to a buyer or lessee. Pricing subject to change without notice. Located walking distance from the sands of Miami Beach and the waters of Biscayne Bay, the residences at Ella Miami Beach feature unique floor plans ranging from studios to two-bedrooms. NOW ACCEPTING RESERVATIONS | PRICED FROM $590,000 VISIT OUR SALES GALLERY T. 786.919.6940 | Hello@EllaMiamiBeach.com | EllaMiamiBeach.com A DISTINCTIVE COLLECTION OF ONLY 95 RESIDENCES SOUL-INSPIRED BY MIAMI BEACH’S GLAMOROUS HEYDAY INTRODUCING ELLA MIAMI BEACH


Situated within a luxurious residential enclave, The Village at Coral Gables features forty-eight distinctive homes which include Sophisticated Condominium Residences, Glamorous Townhomes, Expansive Lofts, and Private Villas. Developed by MG Developer, The Village at Coral Gables is a once-in-a-generation offering of residences in Miami’s most coveted neighborhood. IN THE HEART OF CORAL GABLES A BESPOKE COLLECTION OF NEW CONSTRUCTION RESIDENCES Residences Priced From $2M SCHEDULE A PRIVATE PREVIEW thevillageatcoralgables.com | sales@thevillageatcoralgables.com | 786.833.6398 2990 Ponce de Leon Blvd Suite 101, Coral Gables, Florida 33134 @THEVILLAGEATCORALGABLES Follow Us ORAL REPRESENTATIONS CANNOT BE RELIED UPON AS CORRECTLY STATING THE REPRESENTATIONS OF THE DEVELOPER. FOR CORRECT REPRESENTATIONS, MAKE REFERENCE TO THE DOCUMENTS REQUIRED BY SECTION 718.503, FLORIDA STATUTES, TO BE FURNISHED BY A DEVELOPER TO A BUYER OR LESSEE. This is not intended to be an offer to sell, or solicitation of an offer to buy, condominium units to residents of CT, ID, NY, NJ and OR, unless registered or exemptions are available, or in any other jurisdiction where prohibited by law, and your eligibility for purchase will depend upon your state of residency. This offering is made only by the prospectus for the condominium and no statement should be relied upon if not made in the prospectus. The Developer (as is defined herein below) reserves the right to revise or modify, in its sole and absolute discretion, any or all improvements, designs and construction specifications depicted and all terms, conditions and statements made. All of the drawings, rendering, and photographs provided by Developer are conceptual only and are for the convenience of illustrating proposed development; said drawings, renderings and photographs should not be relied upon as representations, express or implied, of the final detail of the residences. All depictions of appliances, fixtures, counters, soffits, wall coverings, floor coverings, furnishings, closets, and other matters of detail, including, without limitation, items of finish and decoration, are conceptual only and are not necessarily the final finishes and details included with the purchase of a Unit. Consult your Purchase Agreement and the Prospectus for information on what is included with Unit purchases. The photographs contained in these materials and other brochures may be stock photography, or may have been taken off-site and are used to depict the spirit of the lifestyles to be achieved rather than any that may exist or that may be proposed, and the photographs are merely intended as illustrations of the activities and concepts depicted therein. No statements or representations have been made by Developer, or any of its agents, employees or representatives with respect to any potential for future profit, any future appreciation in value, investment opportunity potential, any rental income potential, the ability or willingness of Developer, or its affiliates, to assist any buyer in financing, renting (other than the existence of a voluntary rental program) or selling the Unit (except only in response to a direct inquiry from buyer), the economic or tax benefits to be derived from the managerial efforts of a third party as a result of renting the Unit or other units, or the economic or tax benefits to be derived from ownership of the Unit. The Developer, its agents, employees, and representatives are neither investment advisors nor tax advisors and any statement that may have been made should not be relied upon in your decision to purchase. Certain nearby attractions referenced or identified in these materials are off-site and not controlled by the Developer. The references to nearby attractions are based upon public information sources and are believed to be accurate as of the date of these materials or publication; however, there is no guarantee that such attractions will continue to exist, or that there would not be changes and/or substitutions of any of the same. The managing entities, operators, amenities and other features that may be referred to are accurate as of the date of these materials or publication; however, there is no guarantee that the managing entities, operators, amenities and other features that may be referred to will be involved at, or following, the completion of the Condominium. The Developer reserves the right to change any and all such managing entities, operators, amenities and other features that may be referred to as the Developer deems best for the Condominium in the Developer’s sole and absolute discretion. Dimensions and square footage of the Units are approximate and may vary with actual construction. The Condominium is being developed by Gables Village Propco LLC, a Delaware limited liability company (“Developer”). You will look solely to Developer with respect to any and all matters relating to the sales, marketing, and development of the Condominium or your purchase of a Unit in the Condominium. No real estate broker is authorized to make any representations or other statements regarding the project, and no agreements with, deposits paid to or other arrangements made with any real estate broker are or shall be binding on the Developer. All prices are subject to change at any time and without notice, and do not include optional features or premiums for upgraded units. From time to time, price changes may have occurred that are not yet reflected on these materials or other brochures. Please check with the Developer for the most current pricing. Concierge services that may be described are available to Unit owners who pay additional fees. Consult the Prospectus for the site plan and the location of the Unit you desire. Unless otherwise noted, this content is owned by Developer and the unauthorized reproduction, display or other dissemination of these or other materials is strictly prohibited and constitutes copyright infringement. Unless otherwise defined, capitalized terms used herein shall have the meanings ascribed to them in the Prospectus.

For unmatched real estate expertise © 2023 ONE Sotheby’s International Realty. All rights reserved. Sotheby’s International Realty® and the Sotheby’s International Realty Logo are service marks licensed to Sotheby’s International Realty Affiliates LLC and used with permission. ONE Sotheby’s International Realty fully supports the principles of the Fair Housing Act and the Equal Opportunity Act. Each franchise is independently owned and operated. Any services or products provided by independently owned and operated franchisees are not provided by, affiliated with or related to Sotheby’s International Realty Affiliates LLC nor any of its affiliated companies. The information contained herein is deemed accurate but not guaranteed.
