TRENDS
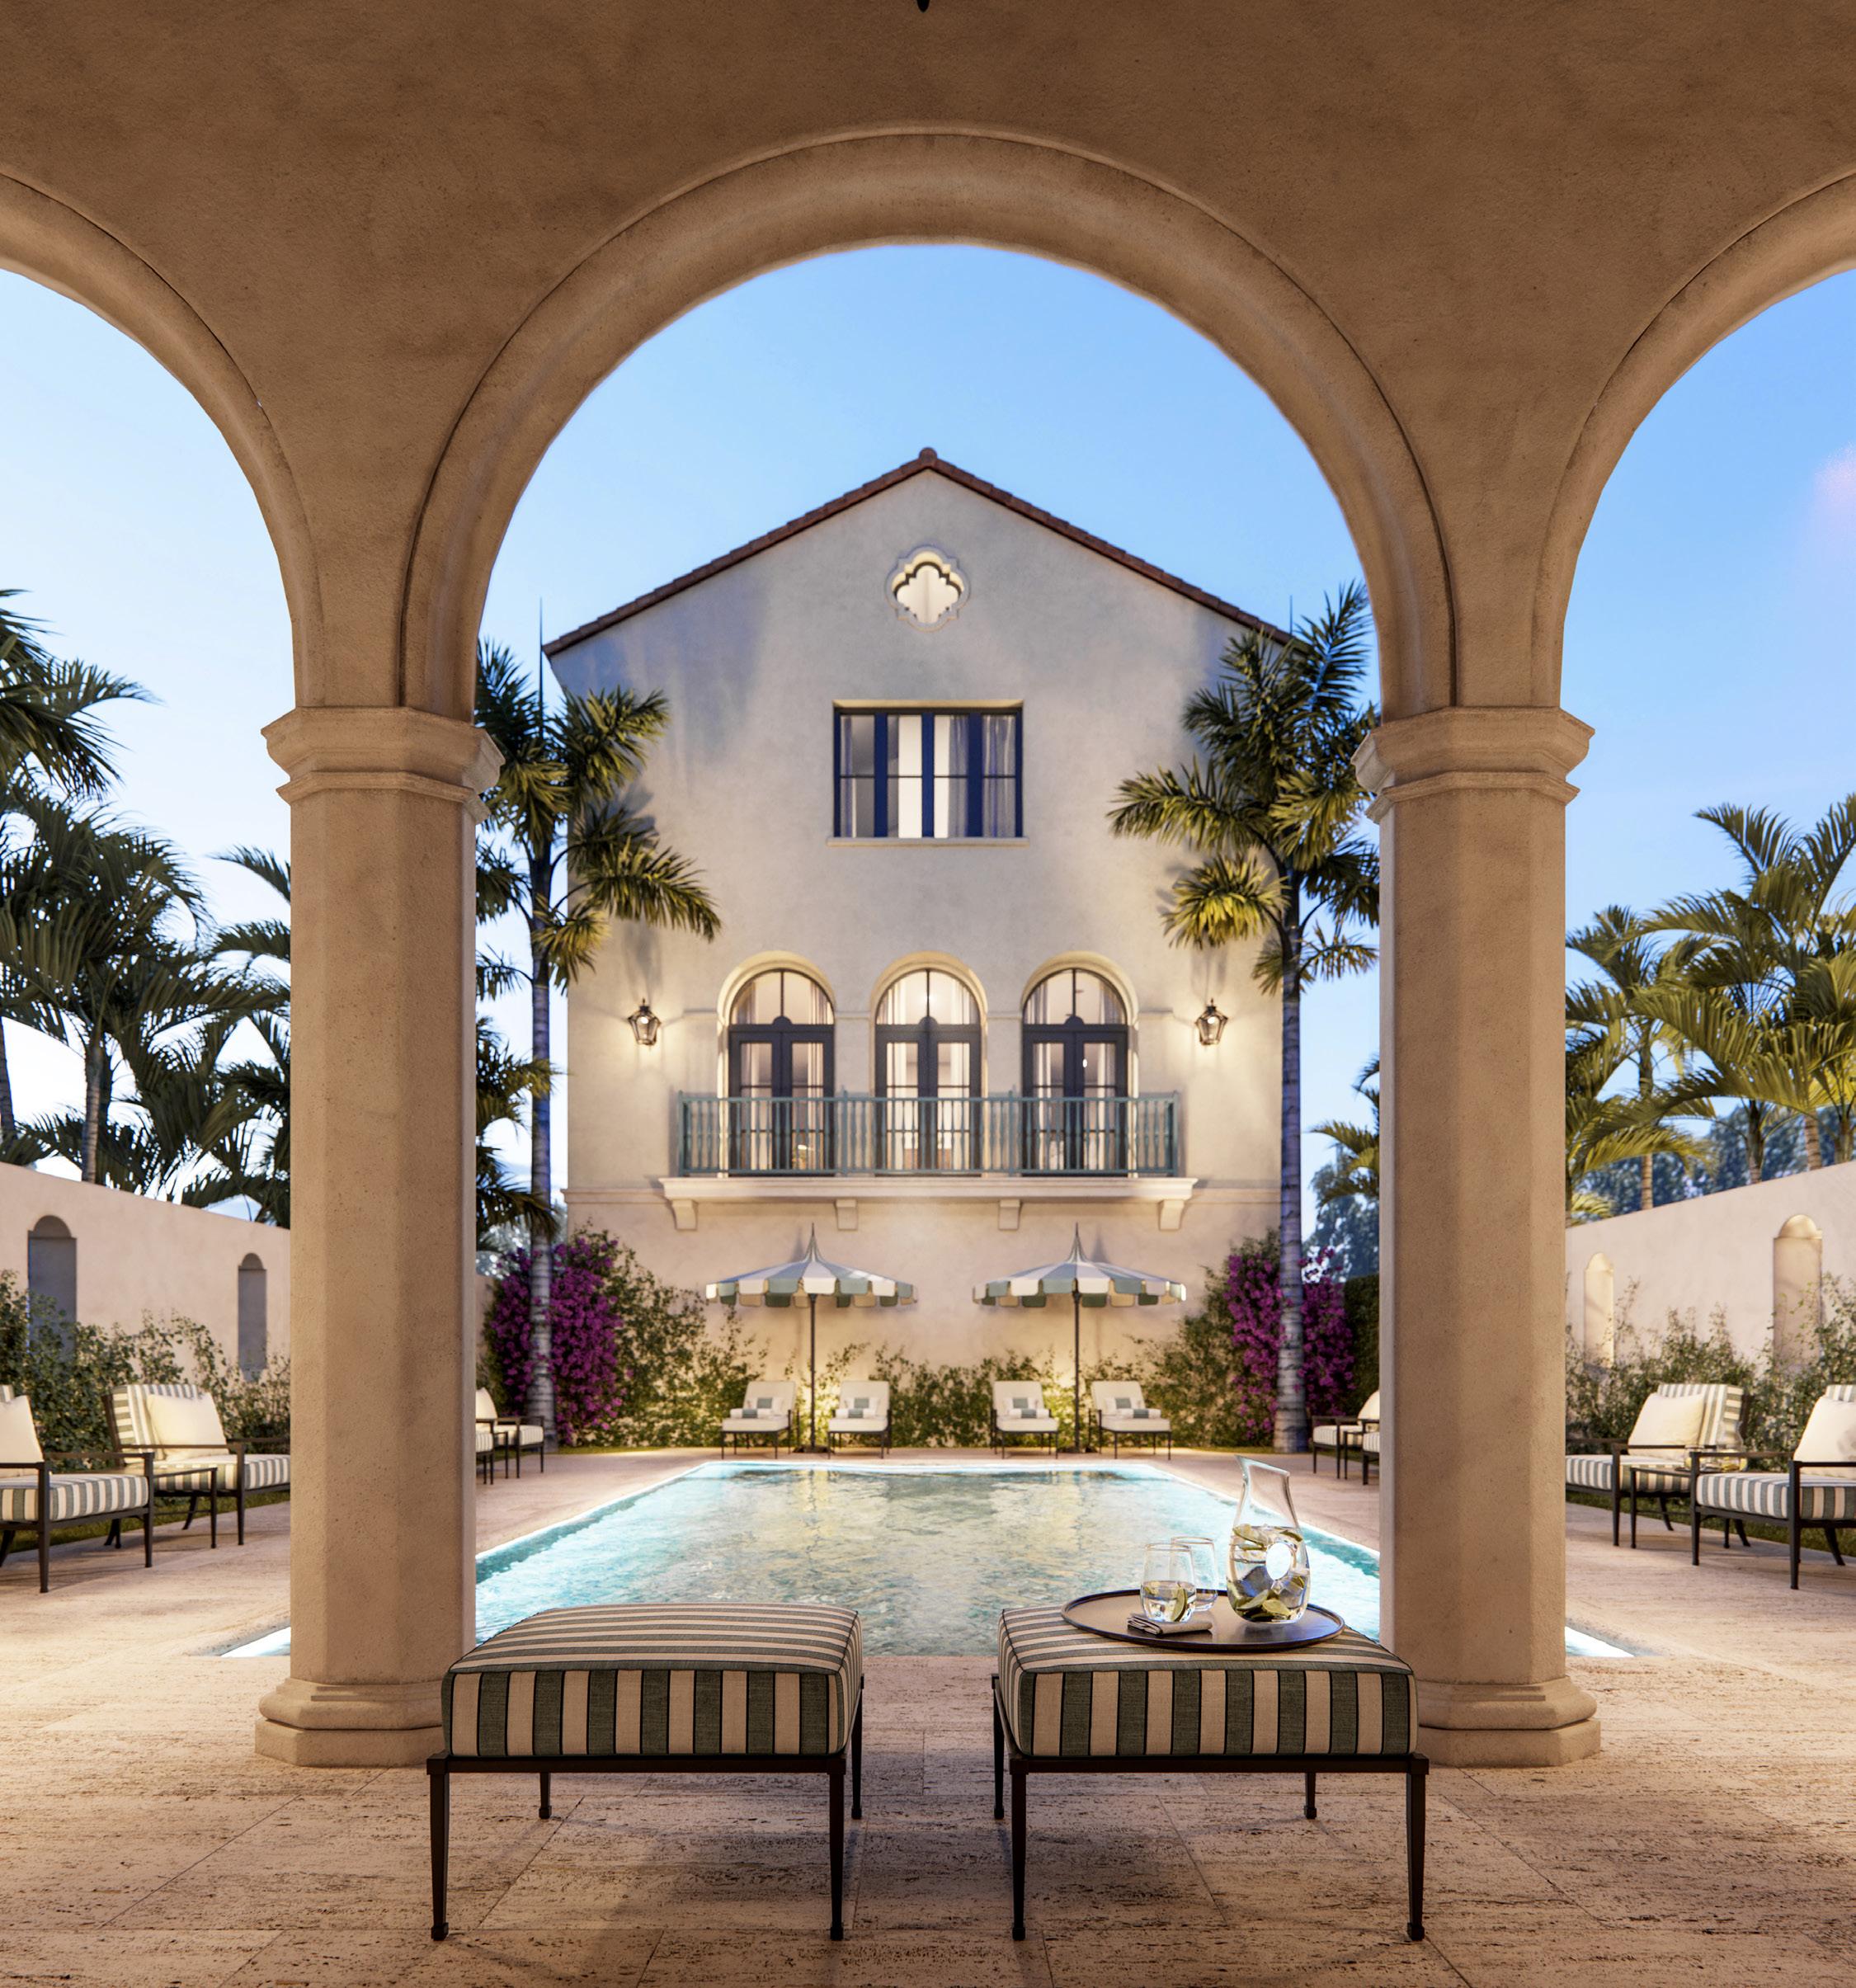
FEATURED DEVELOPMENT: THE VILLAGE AT CORAL GABLES
TODAY’S REAL ESTATE ALONG FLORIDA’S EAST COAST

MARKET REPORT JUNE 2023

CONTENTS 04 10 14 06 11 15 08 12 16 17 18 Miami-Dade County Martin County St. Johns County Broward County Indian River County Duval County Palm Beach County Brevard County Clay County Nassau County Flagler County


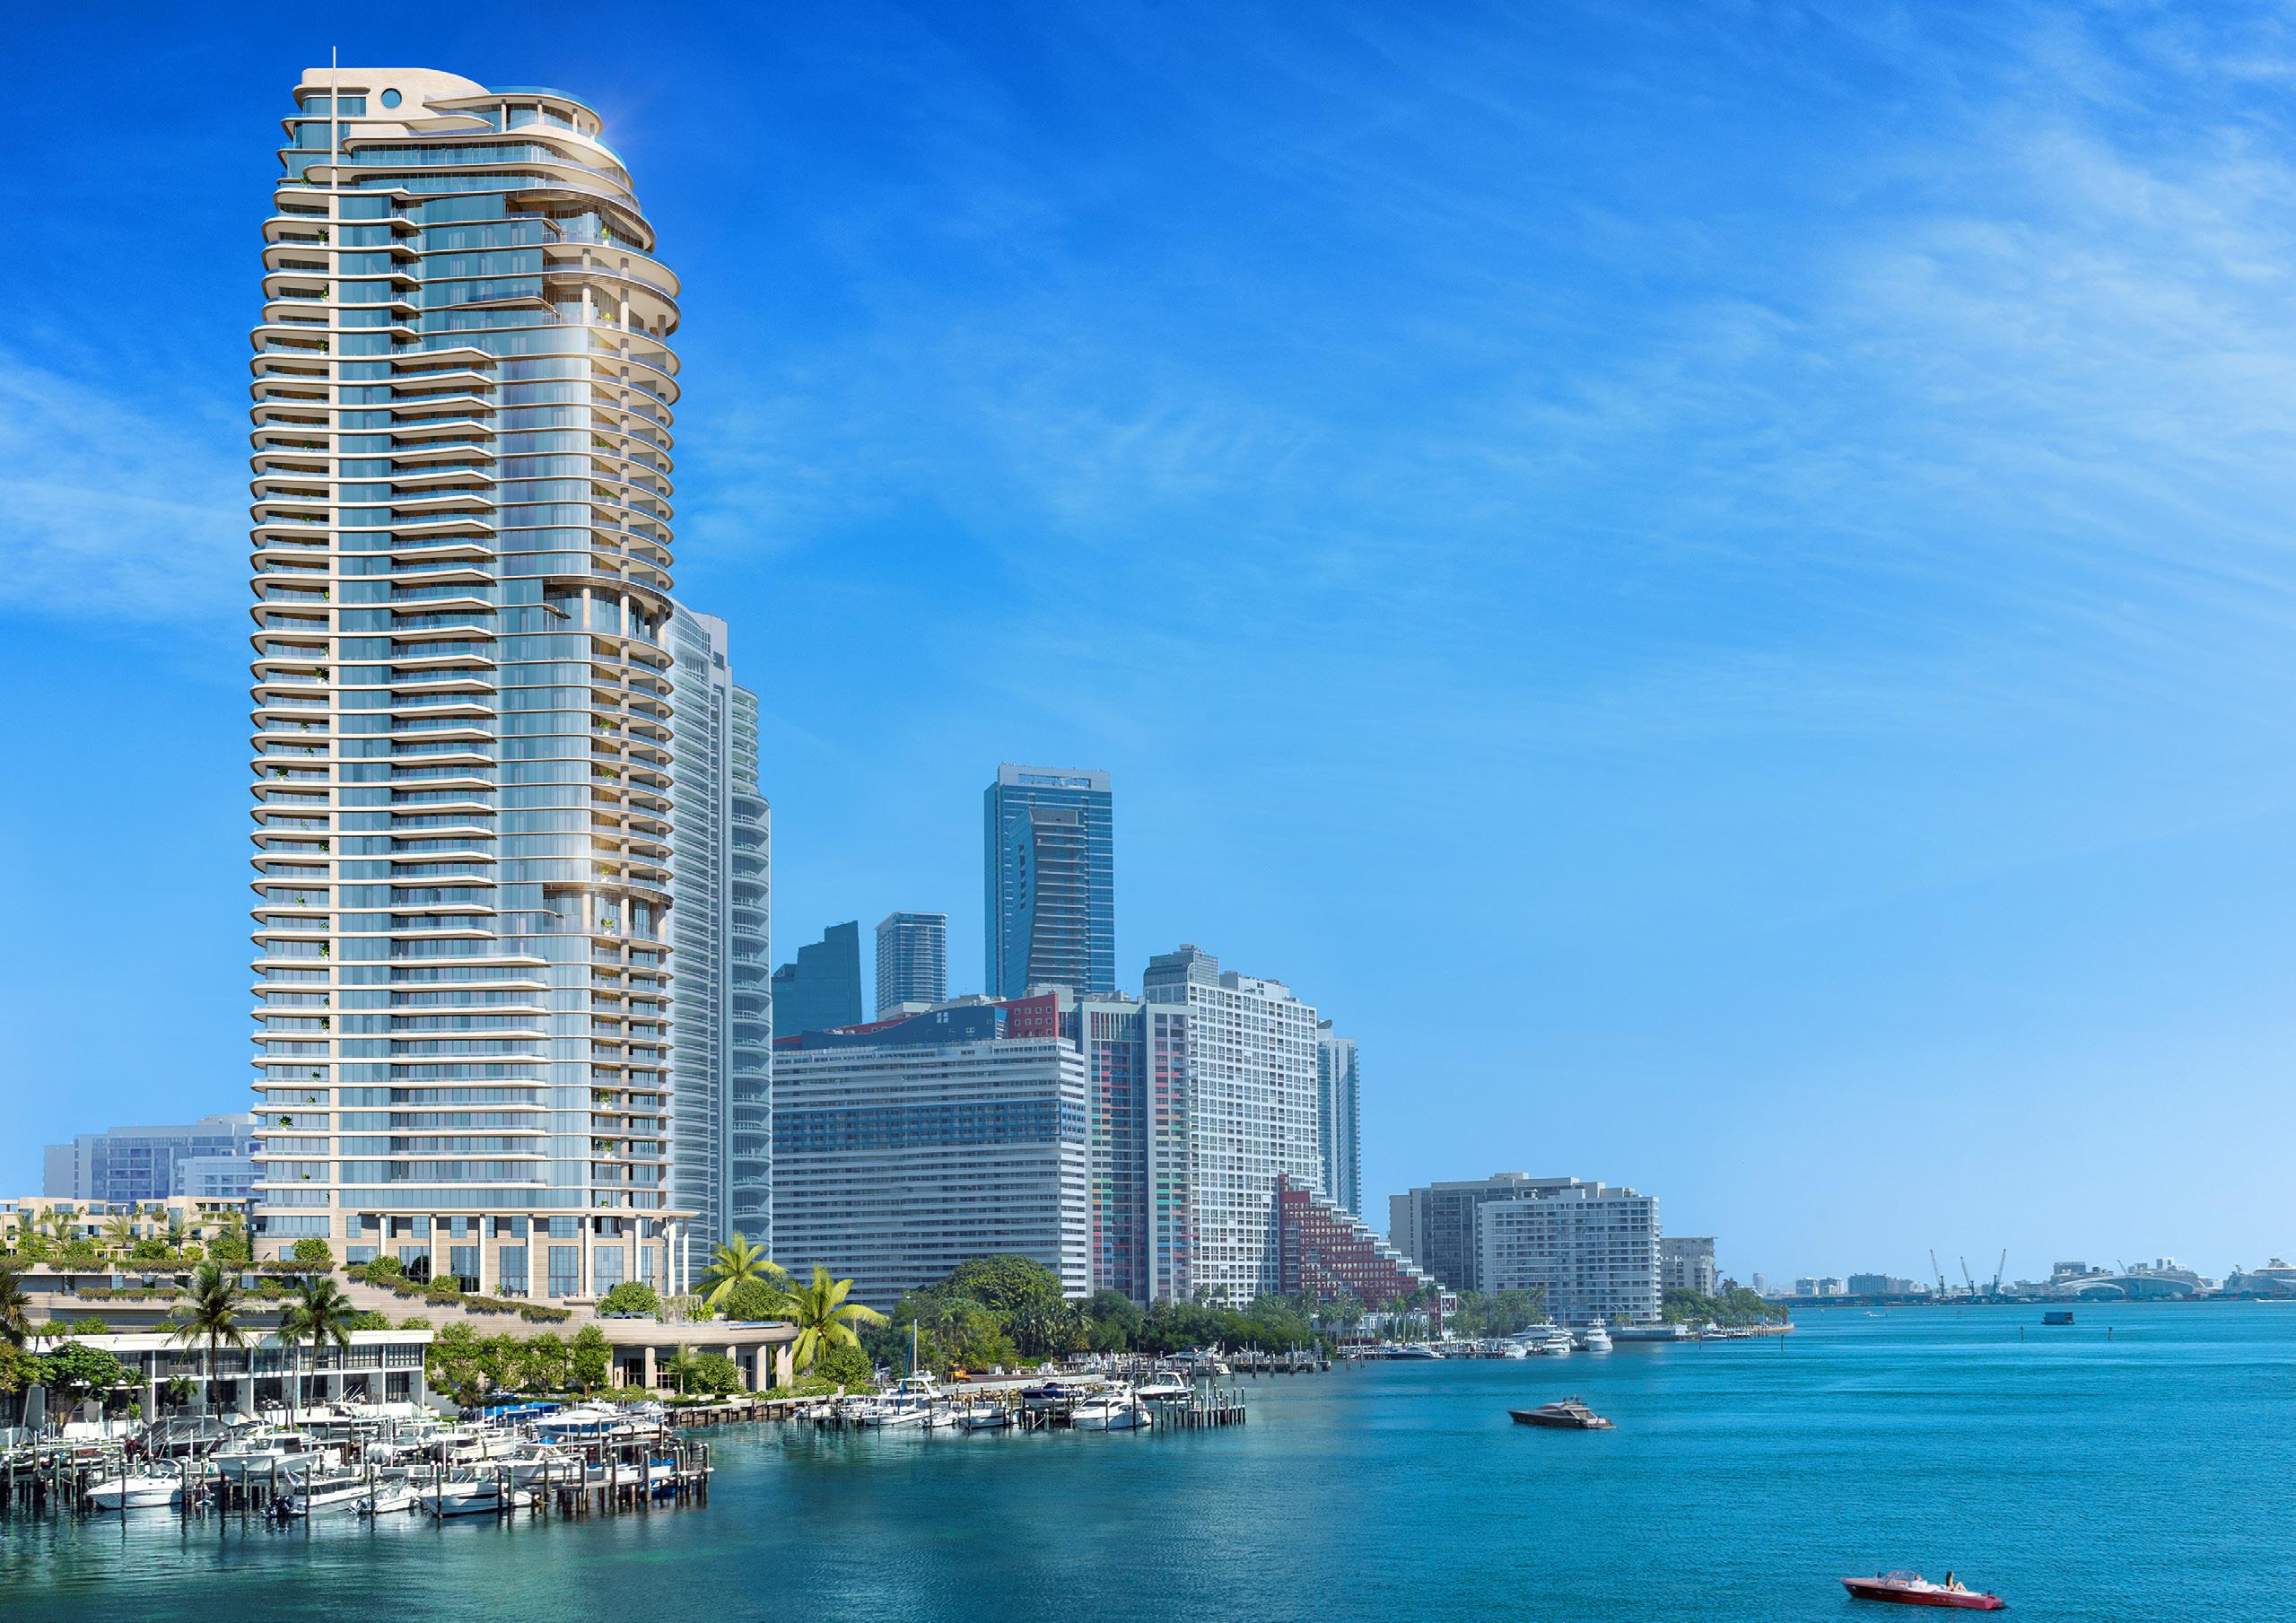


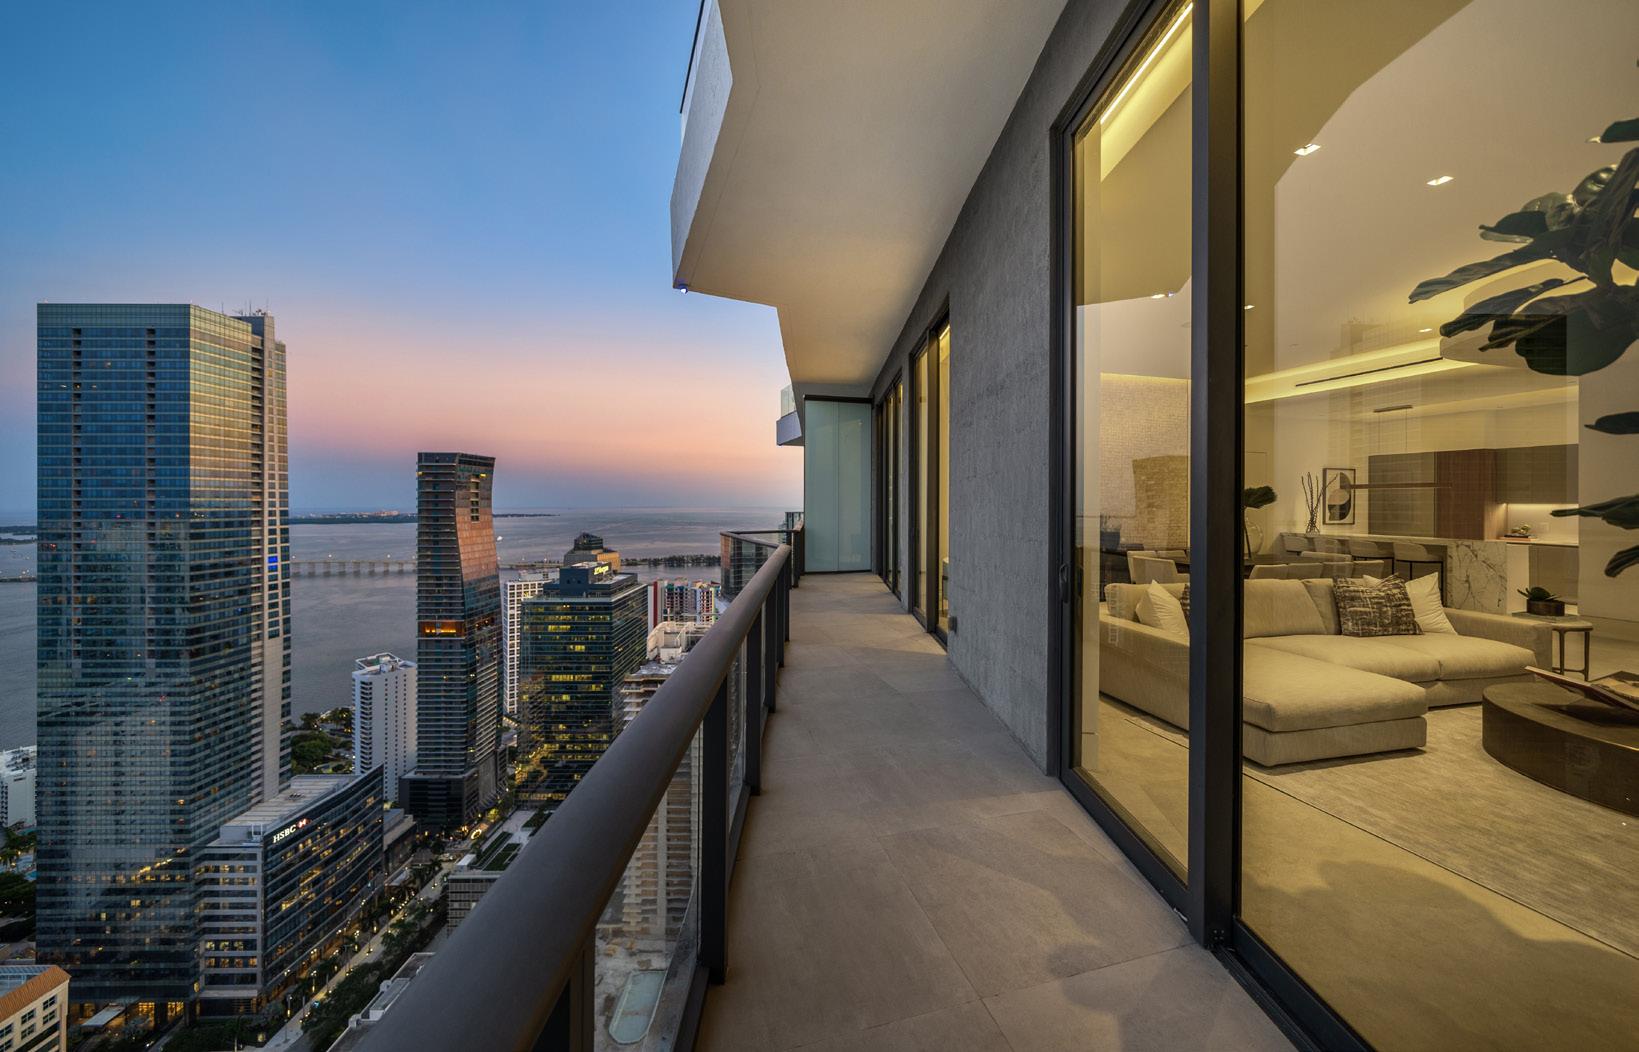
©2023 ONE Sotheby’s International Realty. All rights reserved. Sotheby’s International Realty® and the Sotheby’s International Realty Logo are service marks licensed to Sotheby’s International Realty Affiliates LLC and used with permission. ONE Sotheby’s International Realty fully supports the principles of the Fair Housing Act and the Equal Opportunity Act. Each franchise is independently owned and operated. Any services or products provided by independently owned and operated franchisees are not provided by, affiliated with or related to Sotheby’s International Realty Affiliates LLC or any of its affiliated companies. The information contained herein is deemed accurate but not guaranteed. Oral representations cannot be relied upon as correctly stating the representations of the developer. For correct representations, reference should be made to the documents required by section 718.503, Florida Statutes, to be furnished by a developer to a buyer or lessee. Pricing subject to change without notice. Situated along the beautiful coastline of South Brickell, with exquisite bayfront views, an on-property private marina, and an exclusive fine dining restaurant by Michelin-starred chef Fabio Trabocchi. The St. Regis Residences, Miami offer a lifetime of legendary moments - a place where the history and heritage of a timeless brand enables a signature way of life, propelled by impeccable service, world-class design and unparalleled connoisseurship. PRICED FROM $ 3 . 5 M The St. Regis Residences, Miami SCHEDULE A PRIVATE PREVIEW 1809 Brickell Avenue, Miami, Florida 33129 Sales@MiamiSRR.com | +1 786 712 3495 | MiamiSRR.com Sales Gallery Now Open | By Appointment Only
INTRODUCING ELLA MIAMI BEACH

Located A DISTINCTIVE COLLECTION OF ONLY 95 RESIDENCES SOUL-INSPIRED BY MIAMI BEACH’S GLAMOROUS HEYDAY
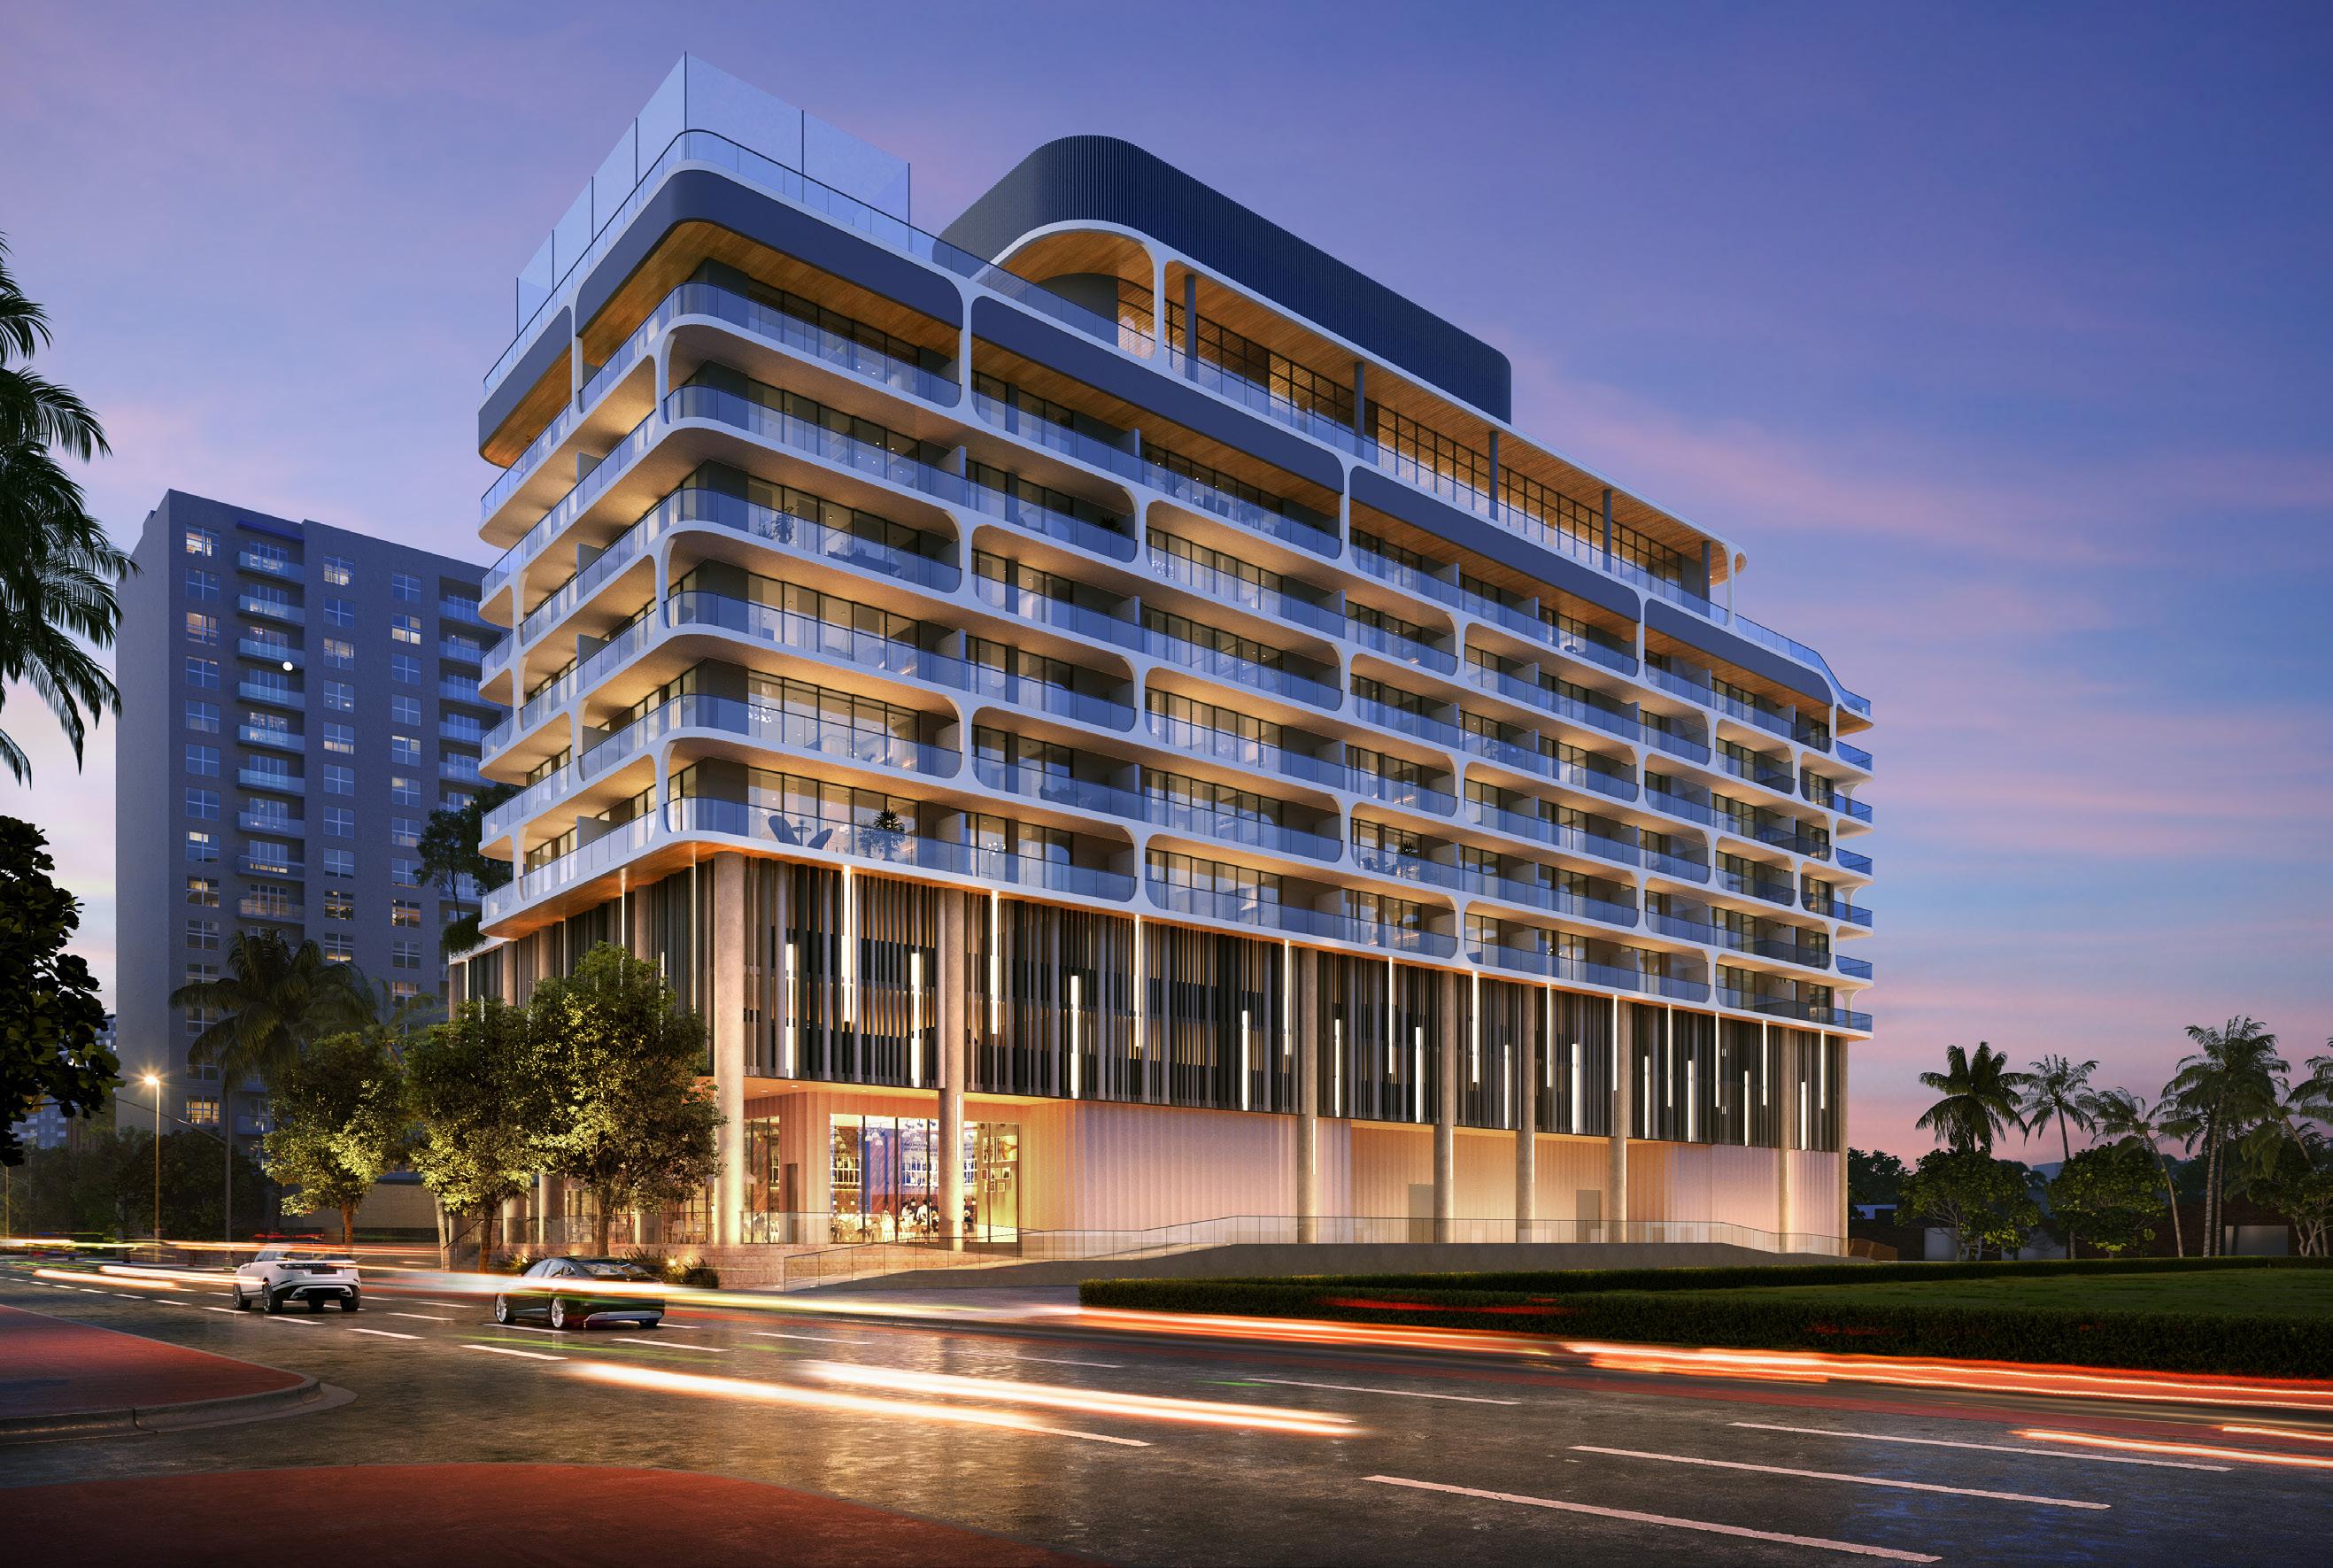
©2023 ONE Sotheby’s International Realty. All rights reserved. Sotheby’s International Realty® and the Sotheby’s International Realty Logo are service marks licensed to Sotheby’s International Realty Affiliates LLC and used with permission. ONE Sotheby’s International Realty fully supports the principles of the Fair Housing Act and the Equal Opportunity Act. Each franchise is independently owned and operated. Any services or products provided by independently owned and operated franchisees are not provided by, affiliated with or related to Sotheby’s International Realty Affiliates LLC or any of its affiliated companies. The information contained herein is deemed accurate but not guaranteed. Oral representations cannot be relied upon as correctly stating the representations of the developer. For correct representations, reference should be made to the documents required by section 718.503, Florida Statutes, to be furnished by a developer to a buyer or lessee. Pricing subject to change without notice. walking distance from the sands of Miami Beach and the waters of Biscayne Bay, the residences at Ella Miami Beach feature unique floor plans ranging from studios to two-bedrooms. NOW ACCEPTING RESERVATIONS | PRICED FROM $590,000 VISIT OUR SALES GALLERY T. 786.919.6940 | Hello@EllaMiamiBeach.com | EllaMiamiBeach.com
MIAMI-DADE COUNTY
MARKET DATA FOR SINGLE- FAMILY HOMES, $1,000,000+
SINGLE-FAMILY HOMES | PRICING IS RECOVERING
Compared to last year, the median price of higher-priced homes was nearly 11% lower, but increased relative to April of this year. Approximately 12% of homes sold in May transacted at a premium to the asking price.
1.6M 81
710
MEDIAN SALES PRICE AVERAGE DAYS ON MARKET ACTIVE LISTINGS SOLD LISTINGS
1,593 230
11%
Neighborhood Snapshots
*ALL PERCENTAGES REFLECT YEAR OVER YEAR CHANGE.
MEDIAN PPSF ↓
↑
↑ 4% ↓ 8% ↑ 37%
36%
MEDIAN SALES PRICE MEDIAN PRICE PER SF CLOSED SALES AVERAGE DAYS ON MARKET MAY 23 MAY 22 YOY% CHANGE MAY 23 YOY% CHANGE MAY 23 YOY% CHANGE MAY23 AVENTURA $3,746,588 $1,020,000 267% $583 68% 3 200% 80 BAL HARBOUR N/A N/A N/A N/A N/A - N/A N/A BAY HARBOR ISLANDS N/A $4,100,000 N/A N/A N/A - N/A N/A COCONUT GROVE $2,850,000 $3,029,000 -6% $606 -6% 17 55% 103 CORAL GABLES $1,637,500 $2,150,000 -24% $826 8% 36 0% 80 GOLDEN BEACH N/A N/A N/A N/A N/A - N/A N/A INDIAN CREEK N/A N/A N/A N/A N/A - N/A N/A KEY BISCAYNE $6,512,500 $4,100,000 59% $1,490 7% 4 -33% 53 MIAMI $1,550,000 $1,400,000 11% $649 25% 46 -33% 64 MIAMI BEACH $3,326,000 $4,700,000 -29% $1,171 -19% 24 -17% 127 MIAMI SHORES $1,293,000 $2,350,000 -45% $611 -27% 13 44% 67 NORTH BAY VILLAGE N/A $3,850,000 N/A N/A N/A - N/A N/A PINECREST $2,200,000 $2,500,000 -12% $832 8% 21 -34% 68 SOUTH MIAMI $1,277,500 $1,202,500 6% $580 2% 6 50% 32 SUNNY ISLES BEACH $1,275,000 $2,400,000 -47% $775 0% 2 100% 115 SURFSIDE $1,320,000 $1,500,000 -12% $778 -4% 3 0% 81
$ $
MIAMI-DADE COUNTY
MARKET DATA FOR CONDOMINIUMS, $1,000,000+
CONDOMINIUMS | PRICING AND SALES DROP
The number of sold units priced above $1 million fell by 41% in May compared with one year ago. Additionally, the median price decreased by 3% from last year.
Neighborhood Snapshots
*ALL PERCENTAGES REFLECT YEAR OVER YEAR CHANGE.
↓ 3 %
1.5M 101 1,935 185 914 MEDIAN SALES PRICE AVERAGE DAYS ON MARKET ACTIVE LISTINGS SOLD LISTINGS MEDIAN PPSF
↑ 8 % ↑ 4 % ↓ 41% ↑ 23%
MEDIAN SALES PRICE MEDIAN PRICE PER SF CLOSED SALES AVERAGE DAYS ON MARKET MAY 23 MAY 22 YOY% CHANGE MAY 23 YOY% CHANGE MAY 23 YOY% CHANGE MAY23 AVENTURA $1,350,000 $1,700,000 -21% $558 -14% 11 -52% 92 BAL HARBOUR $6,325,000 $2,350,000 169% $2,388 130% 10 -23% 58 BAY HARBOR ISLANDS $1,162,500 $1,312,500 -11% $664 3% 2 -50% 53 BRICKELL/DOWNTOWN MIAMI/EDGEWATER $1,300,000 $1,350,000 -4% $792 0% 37 -16% 122 COCONUT GROVE $1,700,000 $1,550,000 10% $1,416 45% 16 -27% 78 CORAL GABLES $2,200,000 $1,500,000 47% $831 25% 4 -56% 104 FISHER ISLAND $3,600,000 $9,400,000 -62% $1,312 -49% 1 0% 275 KEY BISCAYNE $2,472,500 $1,900,000 30% $1,008 11% 12 -43% 90 MIAMI $1,435,000 $1,254,500 14% $918 3% 15 -64% 81 MIAMI BEACH $1,600,000 $1,677,500 -5% $1,163 -2% 46 -36% 116 MIAMI SHORES N/A N/A N/A N/A N/A - N/A N/A NORTH BAY VILLAGE $1,000,000 $1,425,000 -30% $525 -22% 1 -50% 80 SUNNY ISLES BEACH $1,525,000 $1,725,000 -12% $888 -1% 30 -38% 99 SURFSIDE N/A $1,100,000 N/A N/A N/A - N/A N/A
$ $
BROWARD COUNTY
MARKET DATA FOR SINGLE- FAMILY HOMES, $1,000,000+
SINGLE-FAMILY HOMES | PRICING AND SALES DECLINE
Sales of higher-priced homes fell by roughly one-fourth over the last year, the largest drop in the region. The median price declined by 11% since last year.
Neighborhood Snapshots
*ALL PERCENTAGES REFLECT YEAR OVER YEAR CHANGE.
81 1,046 184 474 MEDIAN SALES PRICE AVERAGE DAYS ON MARKET ACTIVE LISTINGS SOLD LISTINGS MEDIAN PPSF ↓ 11% ↑ 112% ↓ 4% ↓ 24% ↑ 51%
1.4M
MEDIAN SALES PRICE MEDIAN PRICE PER SF CLOSED SALES AVERAGE DAYS ON MARKET MAY 23 MAY 22 YOY% CHANGE MAY 23 YOY% CHANGE MAY 23 YOY% CHANGE MAY23 COOPER CITY $1,275,000 $1,150,000 11% $354 1% 2 0% 24 CORAL SPRINGS $1,225,000 $1,217,500 1% $320 -19% 3 -25% 59 DAVIE $1,425,000 $1,700,000 -16% $366 -13% 19 -5% 115 DEERFIELD BEACH $1,550,000 $1,100,000 41% $711 33% 5 400% 53 FORT LAUDERDALE $2,120,000 $2,350,000 -10% $654 -13% 49 -27% 100 HALLANDALE $8,850,000 $3,750,000 136% $1,003 5% 1 -50% 71 HILLSBORO BEACH N/A N/A N/A N/A N/A - N/A N/A HOLLYWOOD $1,640,000 $1,368,000 20% $601 1% 9 -18% 44 LAUDERDALE-BY-THE-SEA N/A $2,050,000 N/A N/A N/A - N/A N/A LIGHTHOUSE POINT $1,833,063 $2,300,000 -20% $747 18% 12 71% 51 MIRAMAR $1,100,000 $1,180,000 -7% $311 -1% 5 -17% 42 PARKLAND $1,300,000 $1,372,500 -5% $364 -2% 32 -16% 66 PEMBROKE PINES $1,100,000 $1,051,000 5% $299 -11% 3 -70% 62 PLANTATION $1,337,500 $1,450,000 -8% $337 -14% 4 -56% 63 POMPANO BEACH $1,637,500 $1,515,000 8% $583 -29% 8 -43% 133 SOUTHWEST RANCHES $1,320,000 $2,175,000 -39% $544 16% 5 -50% 134 SUNRISE N/A N/A N/A N/A N/A - N/A N/A WESTON $1,185,000 $1,325,000 -11% $378 1% 17 -39% 59 WILTON MANORS $1,275,000 $1,289,000 -1% $647 10% 6 0% 59
$ $
BROWARD COUNTY
CONDOMINIUMS | SALES AND TIME ON MARKET FALL
Condo sales fell by 26% compared with last year though units that did close did so at a quicker pace. The average time on market was nearly half that of May 2022.
$
Neighborhood Snapshots
DAYS ON $
1.4M 77 404 61 MEDIAN PPSF
PRICE ↑ 51%
689 ↓ 22% ↓ 45% ↓ 11% ↓ 26%
MEDIAN SALES PRICE MEDIAN PRICE PER SF CLOSED SALES AVERAGE DAYS ON MARKET MAY 23 MAY 22 YOY% CHANGE MAY 23 YOY% CHANGE MAY 23 YOY% CHANGE MAY23 DEERFIELD BEACH N/A $1,300,000 N/A N/A N/A - N/A N/A FORT LAUDERDALE $1,360,000 $2,300,000 -41% $672 -18% 37 -18% 76 HALLANDALE $1,275,000 $1,630,000 -22% $759 -3% 10 233% 97 HILLSBORO BEACH $1,245,000 $1,950,000 -36% $591 -10% 1 -67% 66 HOLLYWOOD $1,642,500 $1,665,200 -1% $709 -10% 4 -75% 63 LAUDERDALE-BY-THE-SEA $1,450,000 $1,595,000 -9% $579 7% 5 -29% 34 LIGHTHOUSE POINT N/A N/A N/A N/A N/A - N/A N/A POMPANO BEACH $1,734,500 $1,730,000 0% $828 -5% 4 0% 114 WILTON MANORS N/A N/A N/A N/A N/A - N/A N/A
MARKET DATA FOR CONDOMINIUMS, $1,000,000+
MEDIAN SALES
AVERAGE
*ALL PERCENTAGES REFLECT YEAR OVER YEAR CHANGE. MARKET ACTIVE LISTINGS SOLD LISTINGS
PALM BEACH COUNTY
MARKET DATA FOR SINGLE- FAMILY HOMES, $1,000,000+
SINGLE-FAMILY HOMES | MEDIAN PRICE MOVES HIGHER
The median price increased by nearly 3% from last year while sales volume was flat. Sales of homes priced more than $5 million increased by 84% compared with last year.
Neighborhood Snapshots
*ALL PERCENTAGES REFLECT YEAR OVER YEAR CHANGE.
1.7M 72 1,565 328 547 MEDIAN SALES PRICE AVERAGE DAYS ON MARKET ACTIVE LISTINGS SOLD LISTINGS MEDIAN PPSF ↑ 3 % ↑ 101% ↓ 2 % ↓ 1% ↑ 57%
MEDIAN SALES PRICE MEDIAN PRICE PER SF CLOSED SALES AVERAGE DAYS ON MARKET MAY 23 MAY 22 YOY% CHANGE MAY 23 YOY% CHANGE MAY 23 YOY% CHANGE MAY23 BOCA RATON $1,700,000 $1,672,500 2% $525 5% 75 7% 75 BOYNTON BEACH $1,350,000 $1,289,500 5% $411 -2% 21 55% 39 DELRAY BEACH $1,782,500 $1,795,000 -1% $532 -14% 46 0% 78 HIGHLAND BEACH N/A N/A N/A N/A N/A - N/A N/A JUNO BEACH $1,165,000 $2,745,000 -58% $923 19% 1 -50% 1 JUPITER $1,825,000 $1,780,000 3% $553 -2% 46 -4% 74 JUPITER INLET COLONY N/A N/A N/A N/A N/A - N/A N/A LAKE PARK N/A N/A N/A N/A N/A - N/A N/A LAKE WORTH $1,212,500 $1,287,500 -6% $553 8% 3 -25% 52 LANTANA $6,660,000 $1,700,000 292% $1,208 72% 2 0% 81 NORTH PALM BEACH $3,050,000 $3,137,500 -3% $869 -7% 13 225% 59 MANALAPAN N/A N/A N/A N/A N/A - N/A N/A PALM BEACH $9,600,000 $15,800,000 -39% $2,949 -17% 9 -10% 145 PALM BEACH GARDENS $1,800,000 $1,531,219 18% $516 7% 53 33% 58 SINGER ISLAND N/A $1,350,000 N/A N/A N/A - N/A N/A TEQUESTA $1,267,500 $2,900,000 -56% $376 -68% 2 -33% 26 WELLINGTON $2,225,000 $1,987,500 12% $657 12% 22 -27% 110 WEST PALM BEACH $1,777,750 $1,777,777 0% $610 -25% 19 -30% 103
$ $
PALM BEACH COUNTY
MARKET DATA FOR CONDOMINIUMS, $1,000,000+
CONDOMINIUMS | STRONG PRICE GAINS
The median price per unit increased by 14% from the previous year and 5% from April. Sales volume slowed, but remained elevated compared to the beginning of the year.
Neighborhood Snapshots
*ALL PERCENTAGES REFLECT YEAR OVER YEAR CHANGE.
1.8M 80
MEDIAN SALES PRICE AVERAGE DAYS ON MARKET ACTIVE LISTINGS SOLD LISTINGS MEDIAN PPSF ↑ 14% ↑ 101% ↓ 8% ↓ 23% ↑ 80%
533 99 799
MEDIAN SALES PRICE MEDIAN PRICE PER SF CLOSED SALES AVERAGE DAYS ON MARKET MAY 23 MAY 22 YOY% CHANGE MAY 23 YOY% CHANGE MAY 23 YOY% CHANGE MAY23 BOCA RATON $1,487,000 $2,025,000 -27% $1,487,000 -10% 26 4% 84 BOYNTON BEACH $1,125,000 $1,300,000 -13% $683 -16% 3 0% 77 DELRAY BEACH $1,290,000 $1,700,000 -24% $693 -17% 12 9% 85 HIGHLAND BEACH $1,800,000 $1,424,500 26% $639 -9% 5 -69% 183 JUNO BEACH $1,650,000 $1,889,000 -13% $867 6% 4 100% 35 JUPITER $1,900,000 $1,960,000 -3% $880 -3% 7 -22% 48 JUPITER INLET COLONY N/A N/A N/A N/A N/A - N/A N/A LAKE PARK N/A N/A N/A N/A N/A - N/A N/A LAKE WORTH N/A N/A N/A N/A N/A - N/A N/A LANTANA N/A N/A N/A N/A N/A - N/A N/A NORTH PALM BEACH $3,225,000 $1,572,800 105% $1,278 120% 2 -60% 15 MANALAPAN N/A N/A N/A N/A N/A - N/A N/A PALM BEACH $2,210,000 $2,850,000 -22% $1,049 -26% 11 -56% 64 PALM BEACH GARDENS $1,200,000 $2,200,000 -45% $406 -49% 3 -25% 42 SINGER ISLAND $2,075,000 $1,335,000 55% $736 13% 5 -44% 139 TEQUESTA $5,442,500 $2,425,000 124% $1,634 36% 2 0% 87 WELLINGTON $1,225,000 $1,357,500 -10% $573 0% 4 100% 27 WEST PALM BEACH $1,951,314 $1,350,000 45% $1,040 19% 6 -25% 126
$ $
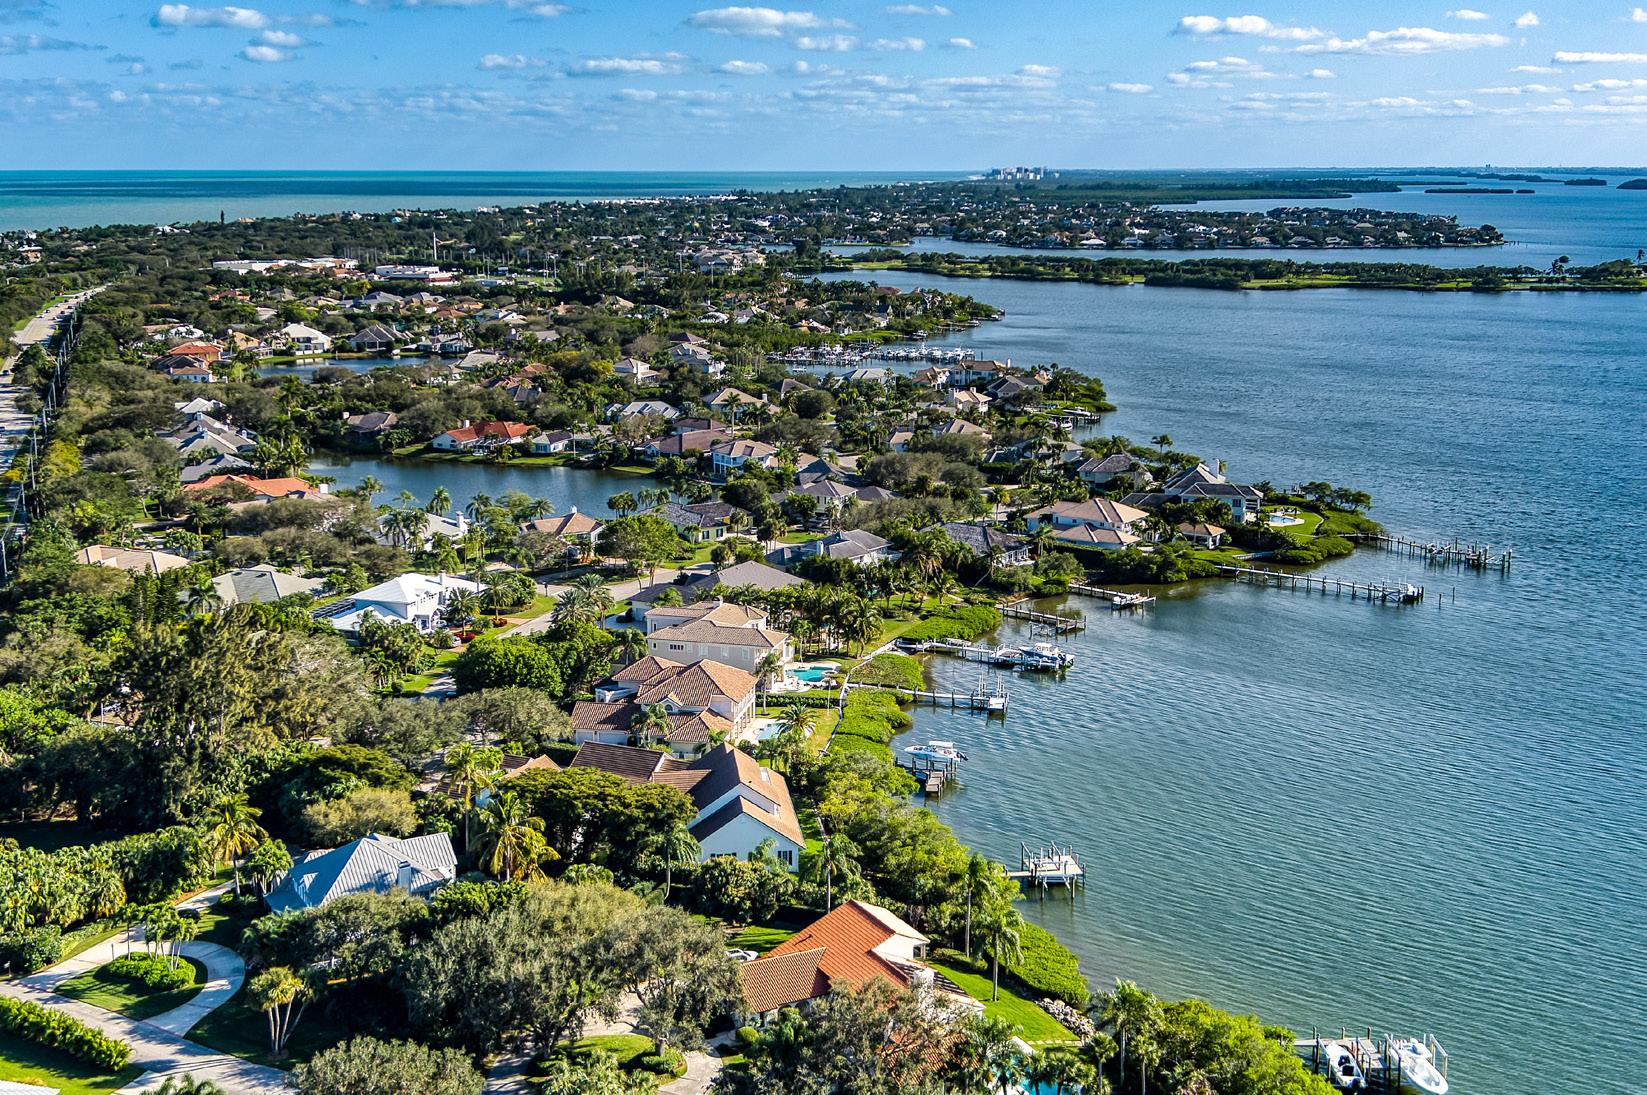
MARTIN COUNTY
MARKET DATA FOR SINGLE- FAMILY HOMES, $500,000+
SINGLE-FAMILY HOMES | SALES ACCELERATE, PRICING DECREASES
The number of sales increased by 11% compared with last year. Despite the pick up in pace, the median price remained 11% lower than in 2022.
Neighborhood Snapshots
767K 62 169 70 327 MEDIAN SALES PRICE AVERAGE DAYS ON MARKET ACTIVE LISTINGS SOLD LISTINGS MEDIAN PPSF ↓ 11% ↑ 77% ↓ 3% ↑ 11% ↑ 54%
MEDIAN SALES PRICE MEDIAN PRICE PER SF CLOSED SALES AVERAGE DAYS ON MARKET MAY 23 MAY 22 YOY% CHANGE MAY 23 YOY% CHANGE MAY 23 YOY% CHANGE MAY23 HOBE SOUND $770,000 $625,163 23% $348 17% 7 607% 39 HUTCHINSON ISLAND $2,000,000 $990,000 102% $575 49% 4 -33% 112 JENSEN BEACH $619,950 $570,000 9% $295 -1% 14 180% 54 JUPITER ISLAND $16,000,000 $35,500,000 -55% $2,642 -19% 1 0% 237 PALM CITY $727,000 $850,000 -14% $297 -6% 60 -2% 58 SEWALL'S POINT $927,000 $1,406,000 -34% $417 13% 4 0% 28 STUART $760,000 $815,000 -7% $383 11% 19 -10% 43
$ $
*ALL PERCENTAGES REFLECT YEAR OVER YEAR CHANGE.
MARTIN COUNTY
MARKET DATA FOR CONDOMINIUMS, $500,000+
CONDOMINIUMS | SALES UP FROM LAST YEAR
Sales of higher-priced units increased from last year, though the more than $500,000 segment is a small part of the overall condo market. In this price range, few condos sell above the list price.
Neighborhood Snapshots
*ALL PERCENTAGES REFLECT YEAR OVER YEAR CHANGE.
630K
MEDIAN SALES PRICE AVERAGE DAYS ON MARKET ACTIVE LISTINGS SOLD LISTINGS MEDIAN PPSF ↓ 15 % ↑ 174% ↓ 12 % ↑ 17 % ↑ 62 %
50 34 14 452
MEDIAN SALES PRICE MEDIAN PRICE PER SF CLOSED SALES AVERAGE DAYS ON MARKET MAY 23 MAY 22 YOY% CHANGE MAY 23 YOY% CHANGE MAY 23 YOY% CHANGE MAY23 HOBE SOUND N/A N/A N/A N/A N/A - N/A N/A HUTCHINSON ISLAND $592,500 $737,500 -20% $452 -12% 8 -33% 58 JENSEN BEACH N/A N/A N/A N/A N/A - N/A N/A PALM CITY $1,199,000 N/A N/A $491 N/A 1 N/A 124 STUART $660,000 N/A N/A $424 N/A 5 N/A 23
$ $
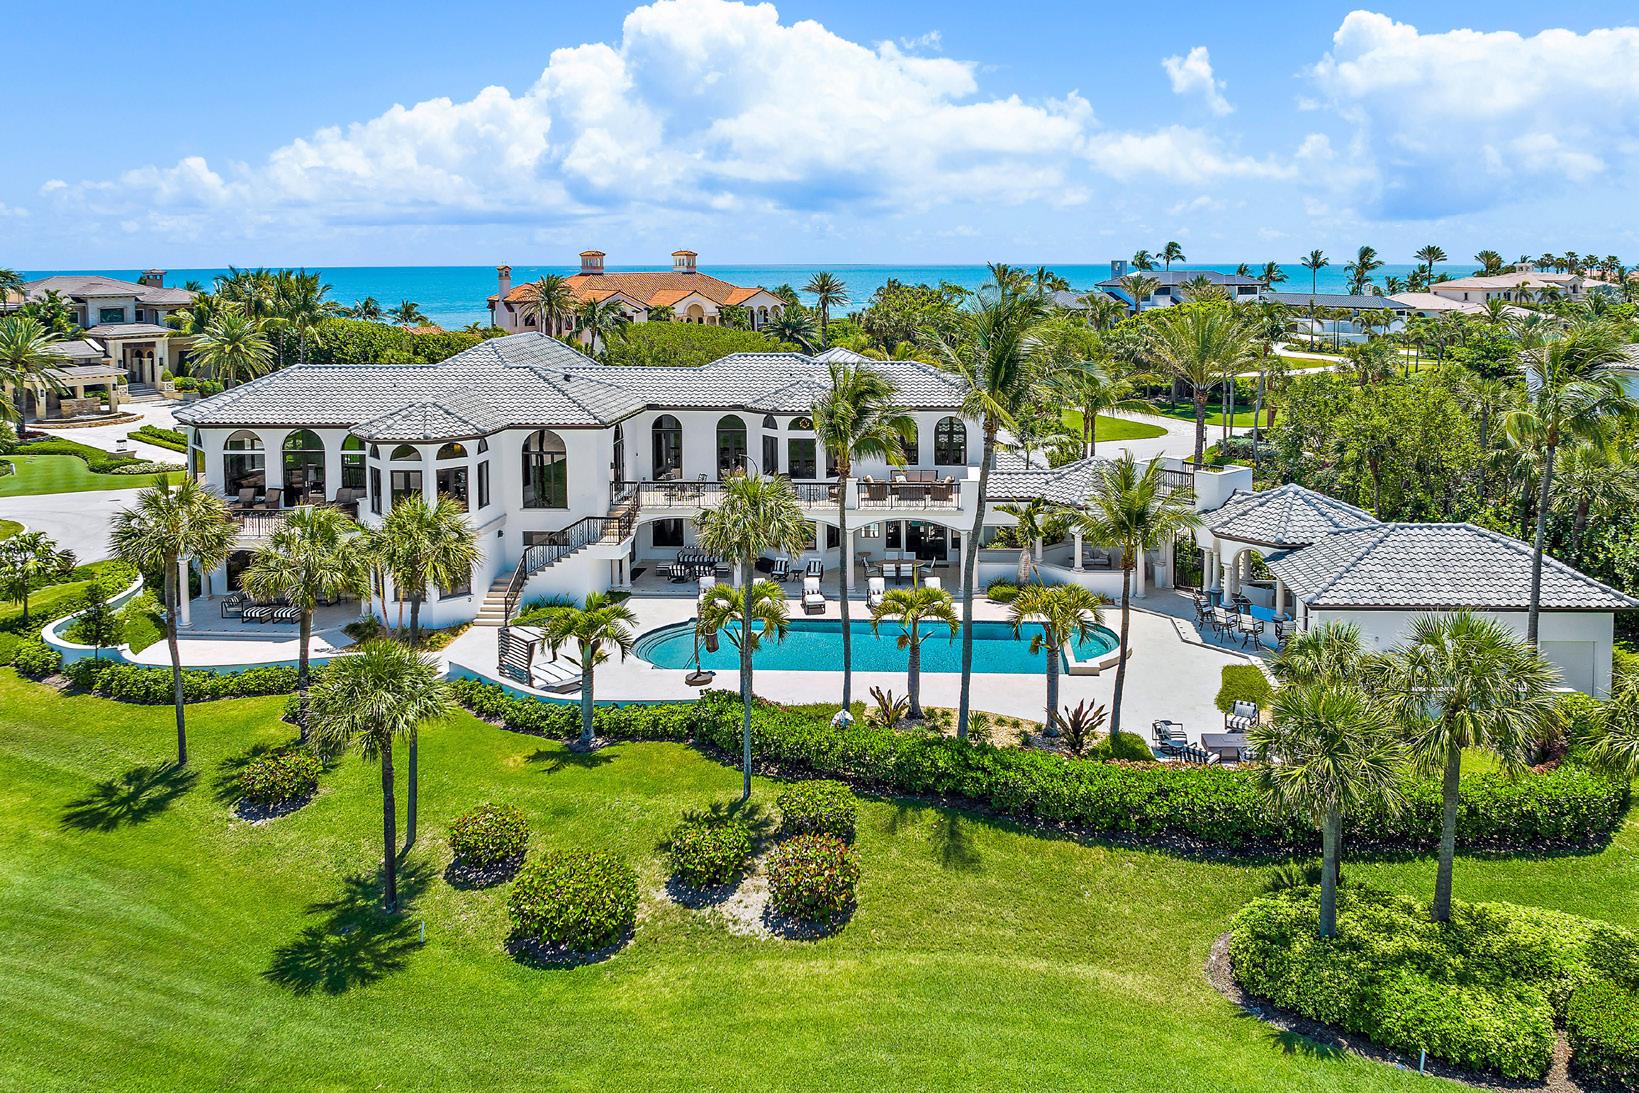
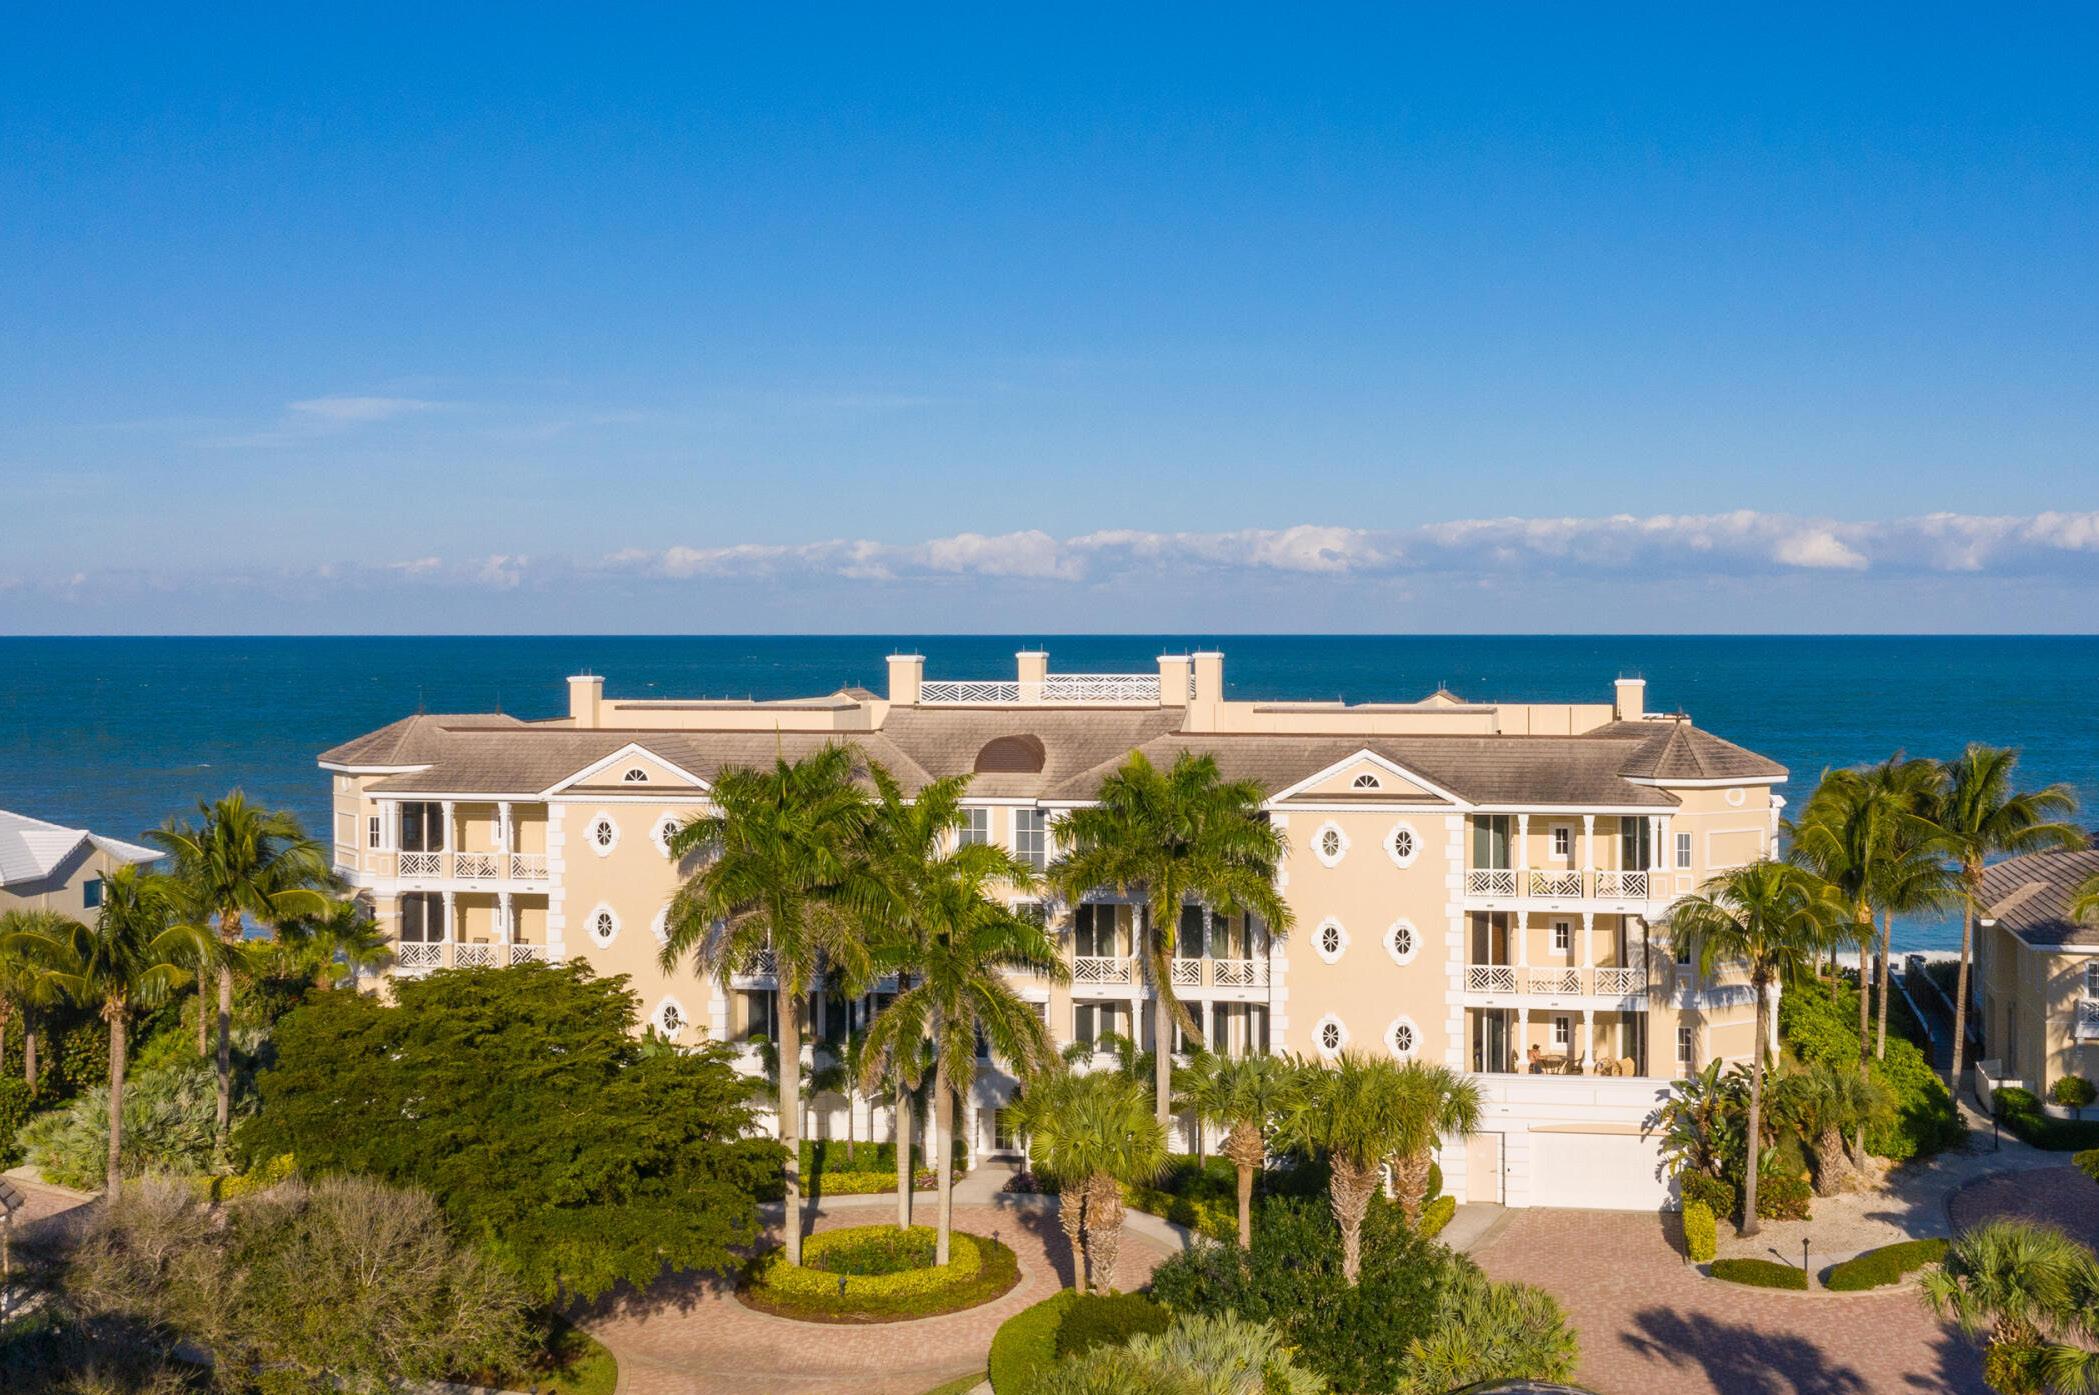
INDIAN RIVER COUNTY
SINGLE-FAMILY HOMES | SALES ACCELERATE TO NEW HEIGHTS
Sales increased by 40% compared with one year ago, the largest increase among neighboring counties. May sales of homes priced greater than $500,000 were the highest on record.
Neighborhood Snapshots
*ALL PERCENTAGES REFLECT YEAR OVER YEAR CHANGE.
774K 86 362 112 315 MEDIAN SALES PRICE AVERAGE DAYS ON MARKET ACTIVE LISTINGS SOLD LISTINGS MEDIAN PPSF ↓ 3 % ↑ 81% ↓ 3 % ↑ 40 % ↑ 125%
MEDIAN SALES PRICE MEDIAN PRICE PER SF CLOSED SALES AVERAGE DAYS ON MARKET MAY 23 MAY 22 YOY% CHANGE MAY 23 YOY% CHANGE MAY 23 YOY% CHANGE MAY23 BARRIER ISLAND $1,375,000 $2,392,829 -43% $458 -41% 42 35% 116 MAINLAND VERO BEACH $615,000 $600,000 2% $272 0% 40 21% 70 SEBASTIAN/FELLSMERE $570,000 $590,000 -3% $274 5% 5 0% 107
$ $
MARKET DATA FOR SINGLE- FAMILY HOMES, $500,000+
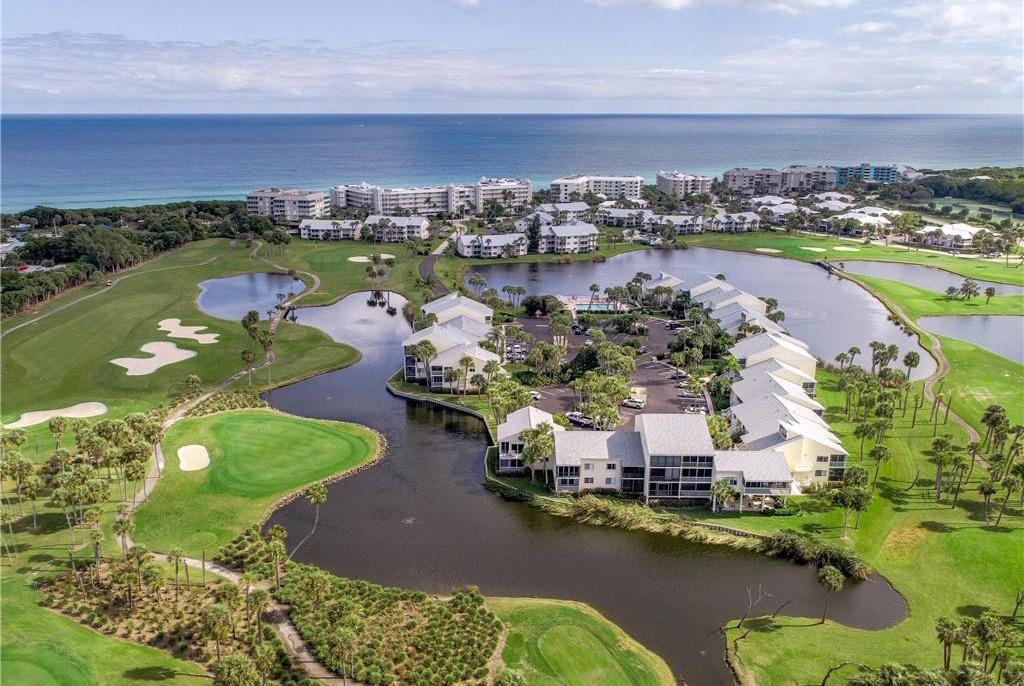
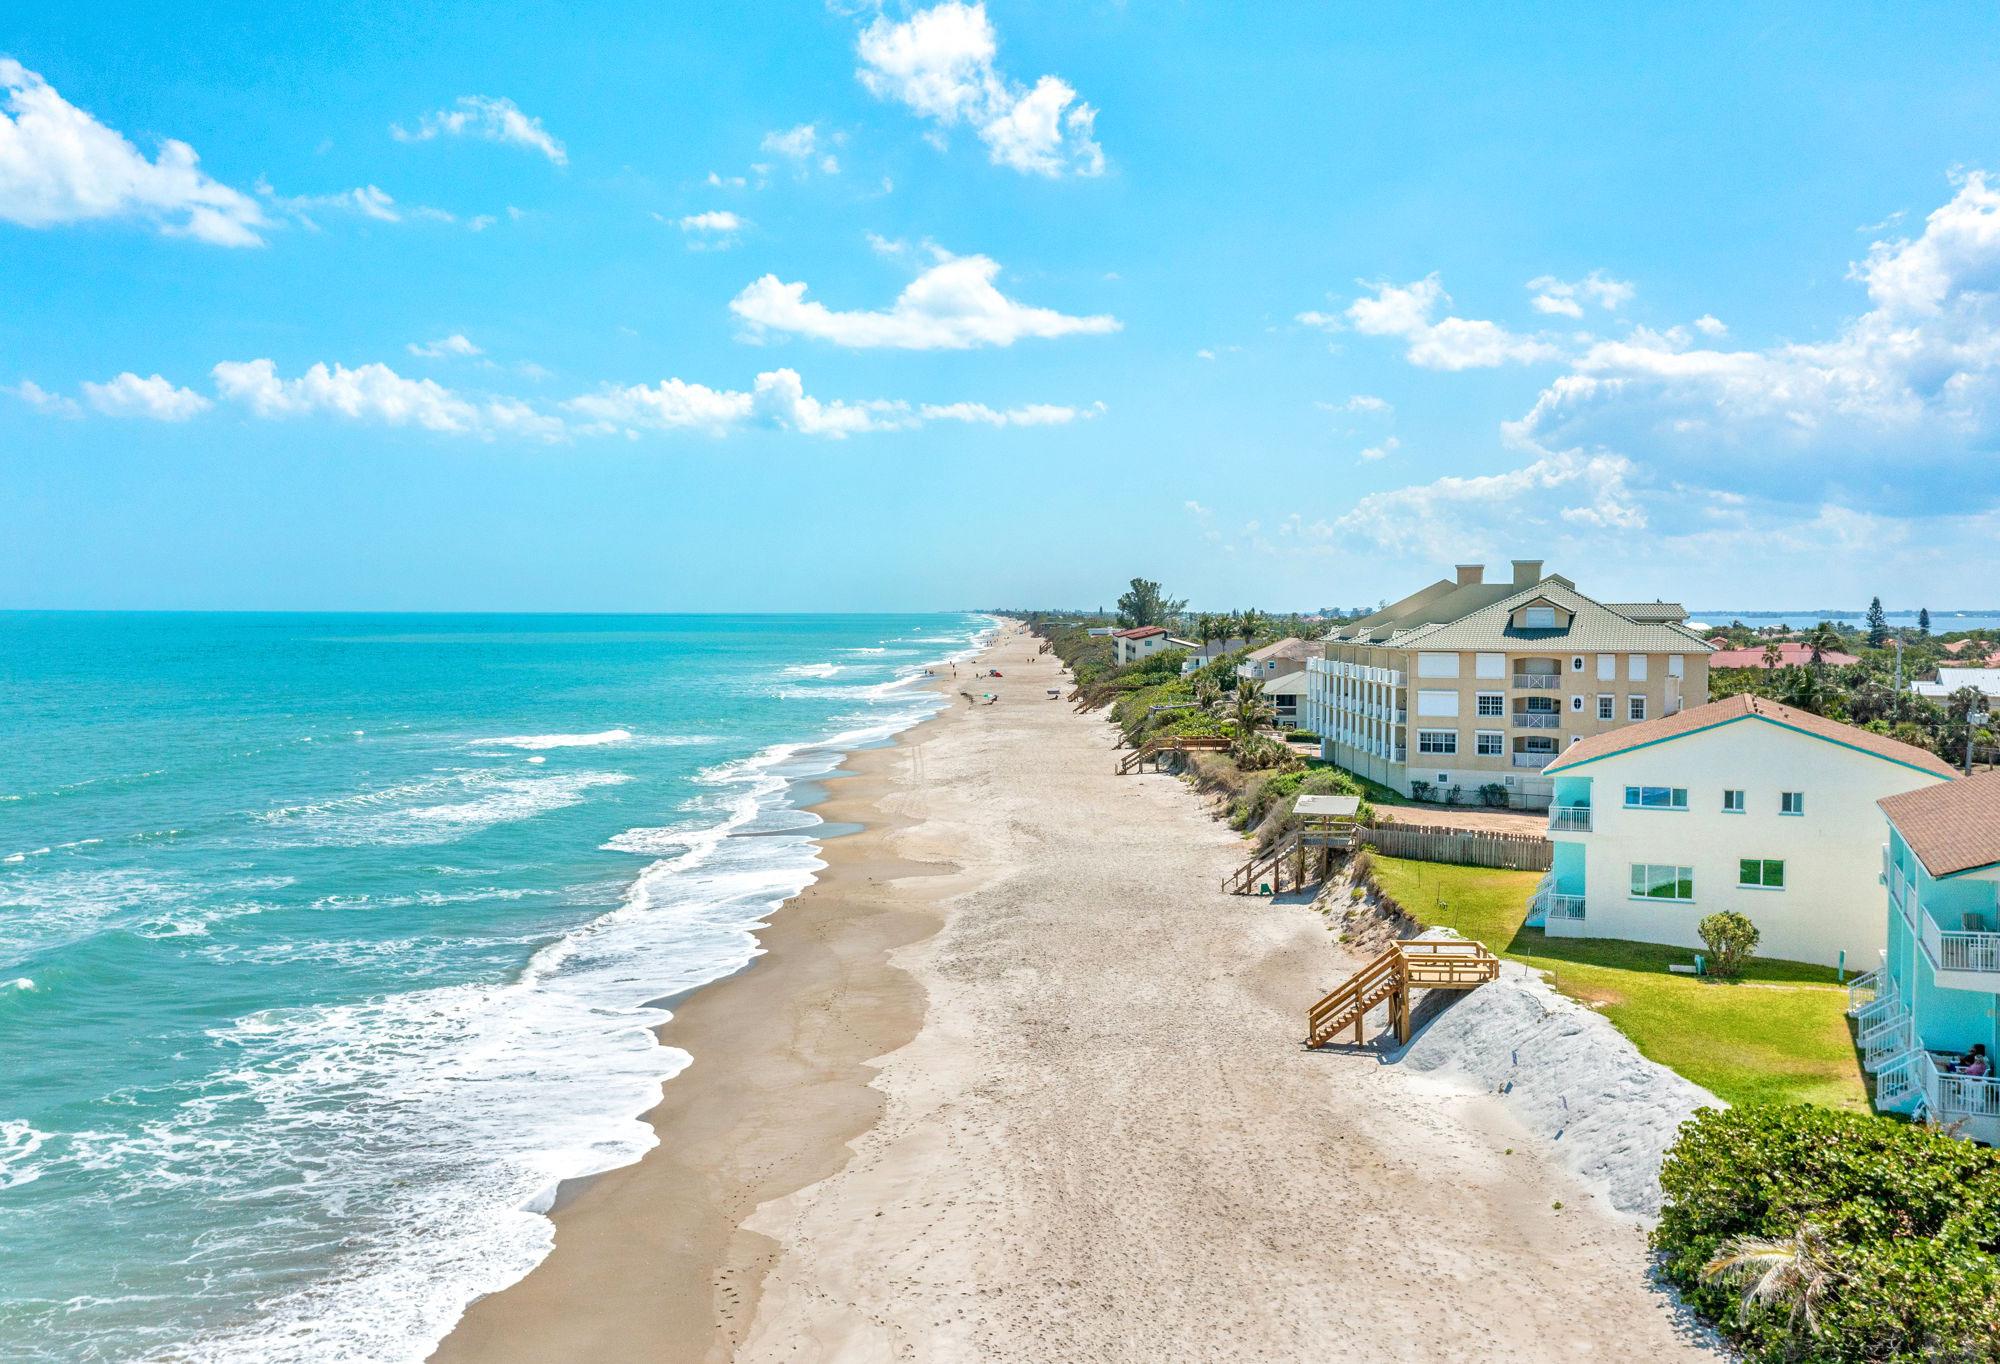
INDIAN RIVER COUNTY
MARKET
CONDOMINIUMS | SALES VOLUME INCREASES
Closed sales increased by 21% compared with one year ago. Though the heightened pace is a welcome sign, few condos sold above the list price.
Neighborhood Snapshots
750K 82 87 29 418 MEDIAN SALES PRICE AVERAGE DAYS ON MARKET ACTIVE LISTINGS SOLD LISTINGS MEDIAN PPSF ↑ 9 % ↑ 248% ↑ 1% ↑ 21% ↑ 89%
MEDIAN SALES PRICE MEDIAN PRICE PER SF CLOSED SALES AVERAGE DAYS ON MARKET MAY 23 MAY 22 YOY% CHANGE MAY 23 YOY% CHANGE MAY 23 YOY% CHANGE MAY23 BARRIER ISLAND $910,000 $802,500 13% $466 -6% 21 5% 85 MAINLAND VERO BEACH $712,500 $577,450 23% $386 17% 6 50% 69 SEBASTIAN/FELLSMERE $590,000 N/A N/A $391 N/A 1 N/A 129
$ $
*ALL PERCENTAGES REFLECT YEAR OVER YEAR CHANGE.
DATA FOR CONDOMINIUMS, $500,000+
BREVARD COUNTY
SINGLE-FAMILY HOMES | PRICING STABLE
The median price of higher-priced homes was on par with last year, one of the few counties in the region that avoided a decline in pricing. For-sale inventory increased by 43%, one of the lowest increases in Southeast Florida.
Neighborhood Snapshots
*ALL PERCENTAGES REFLECT YEAR OVER YEAR CHANGE.
660K 41 436 226 285 MEDIAN SALES PRICE AVERAGE DAYS ON MARKET ACTIVE LISTINGS SOLD LISTINGS MEDIAN PPSF 0 % ↑ 144 % ↑ 2 % ↓ 15% ↑ 43%
MEDIAN SALES PRICE MEDIAN PRICE PER SF CLOSED SALES AVERAGE DAYS ON MARKET MAY 23 MAY 22 YOY% CHANGE MAY 23 YOY% CHANGE MAY 23 YOY% CHANGE MAY23 COCOA $599,000 $580,000 3% $314 12% 5 -55% 46 COCOA BEACH $708,500 $657,000 8% $504 19% 7 -53% 41 GRANT $590,000 $645,000 -9% $254 -11% 2 100% 39 INDIALANTIC $802,500 $770,000 4% $342 -1% 16 0% 28 MALABAR $594,950 $549,900 8% $292 17% 2 -71% 93 MELBOURNE $652,000 $630,000 3% $275 4% 85 18% 32 MELBOURNE BEACH $807,500 $975,000 -17% $372 -13% 12 -29% 55 MERRITT ISLAND $625,000 $650,000 -4% $273 3% 39 -9% 69 MIMS $545,000 $686,858 -21% $255 1% 1 -86% 35 PALM BAY $594,900 $513,073 16% $226 13% 5 -38% 13 ROCKLEDGE $580,500 $673,250 -14% $281 3% 14 -36% 31 SATELLITE BEACH & INDIAN HARBOUR BEACH $727,500 $660,000 10% $339 1% 23 10% 45 TITUSVILLE $570,000 $710,000 -20% $198 -7% 8 -27% 44 WEST MELBOURNE $615,000 $580,000 6% $231 -2% 4 -56% 17
$ $
MARKET DATA FOR SINGLE- FAMILY HOMES, $500,000+
BREVARD COUNTY
MARKET DATA FOR CONDOMINIUMS, $500,000+
CONDOMINIUMS | MEDIAN PRICE FALLS
The median condo price decreased in May following a modest rebound in April. The number of units sold at a premium increased to 10%.
Neighborhood Snapshots
MEDIAN SALES PRICE MEDIAN PRICE PER SF CLOSED SALES AVERAGE DAYS ON MARKET MAY 23 MAY 22 YOY% CHANGE MAY 23 YOY% CHANGE MAY 23 YOY% CHANGE MAY23 COCOA $535,000 N/A N/A $237 N/A 1 N/A 51 COCOA BEACH $560,000 $596,950 -6% $398 -11% 13 -7% 37 INDIALANTIC $625,000 $886,250 -29% $429 -4% 5 -17% 35 MELBOURNE $535,000 $609,900 -12% $221 -25% 1 -80% 5 MELBOURNE BEACH $544,500 $792,500 -31% $378 -9% 3 -25% 8 MERRITT ISLAND $558,750 N/A N/A $257 N/A 2 N/A 8 PALM BAY $500,000 N/A N/A $232 N/A 1 N/A 52 SATELLITE BEACH & INDIAN HARBOUR BEACH $997,500 $650,000 53% $481 11% 12 -8% 56 TITUSVILLE $511,500 $1,350,000 -62% $267 -23% 2 100% 99 WEST MELBOURNE N/A N/A N/A N/A N/A - N/A N/A
600K 41 156 41 412 MEDIAN SALES PRICE AVERAGE DAYS ON MARKET ACTIVE LISTINGS SOLD LISTINGS MEDIAN PPSF ↓ 6 % ↑ 46% ↓ 3 % ↓ 15% ↑ 68% $ $
PERCENTAGES REFLECT YEAR OVER YEAR CHANGE.
*ALL
ST. JOHNS COUNTY
MARKET DATA FOR RESIDENTIAL PROPERTIES, $500,000+
ALL RESIDENTIAL | PRICING INCREASES TO SET NEW RECORD
Closed sales in May increased by 4% from a year ago to reach the highest level since last summer. The median price also increased by 3%, setting a new record-high.
Neighborhood Snapshots
*ALL PERCENTAGES REFLECT YEAR OVER YEAR CHANGE.
74 498 470 295 MEDIAN SALES PRICE AVERAGE DAYS ON MARKET ACTIVE LISTINGS SOLD LISTINGS MEDIAN PPSF ↑ 3% ↑ 164% ↑ 4 % ↑ 4 % ↓ 14 %
706K
MEDIAN SALES PRICE MEDIAN PRICE PER SF CLOSED SALES AVERAGE DAYS ON MARKET MAY 23 MAY 22 YOY% CHANGE MAY 23 YOY% CHANGE MAY 23 YOY% CHANGE MAY23 JULINGTON CREEK AREA $670,000 $645,500 4% $237 -4% 71 -1% 55 NOCATEE $755,625 $811,000 -7% $311 2% 39 -36% 48 PONTE VEDRA BEACH $850,000 $1,450,000 -41% $388 -10% 53 4% 49 SOUTHEAST ST JOHNS COUNTY $702,000 $659,000 7% $424 1% 49 26% 84 ST. AUGUSTINE BEACHES/ANASTASIA ISLAND $750,000 $604,500 24% $415 25% 9 -36% 144 ST. JOHNS $669,402 $620,229 8% $254 5% 75 29% 122 SOUTHWEST ST JOHNS COUNTY $625,000 $599,500 4% $342 43% 3 -50% 85 ST. AUGUSTINE/VILANO BEACH $792,500 $815,000 -3% $345 5% 29 38% 80 WORLD GOLF VILLAGE AREA/PALENCIA $610,000 $668,180 -9% $236 -4% 50 11% 59
$ $
DUVAL COUNTY
MARKET DATA FOR RESIDENTIAL PROPERTIES, $500,000+
ALL RESIDENTIAL | MEDIAN PRICE SURGES
The median price increased by 8% from last year, the largest increase in the region. Listing volume decreased by 19% from last year, highlighting the strengthened buyer demand.
Neighborhood Snapshots
*ALL PERCENTAGES REFLECT YEAR OVER YEAR CHANGE.
679K 70 215 246 295 MEDIAN SALES PRICE AVERAGE DAYS ON MARKET ACTIVE LISTINGS SOLD LISTINGS MEDIAN PPSF ↑ 8 % ↑ 141% ↑ 1 3 % ↓ 17% ↓ 19 %
MEDIAN SALES PRICE MEDIAN PRICE PER SF CLOSED SALES AVERAGE DAYS ON MARKET MAY 23 MAY 22 YOY% CHANGE MAY 23 YOY% CHANGE MAY 23 YOY% CHANGE MAY23 ARLINGTON/FORT CAROLINE $625,000 $618,000 1% $223 0% 5 -29% 61 AVONDALE/RIVERSIDE/ORTEGA $675,000 $680,000 -1% $306 2% 19 -14% 52 BARTRAM $613,000 $548,000 12% $206 2% 2 -71% 31 BEACHES $830,000 $857,500 -3% $478 12% 57 19% 55 BEAUCLERC/MANDARIN $611,750 $627,000 -2% $230 4% 30 -25% 84 DOWNTOWN JACKSONVILLE $537,500 N/A N/A $219 N/A 2 N/A 47 INTRACOASTAL $675,000 $604,949 12% $285 10% 91 -11% 88 NOCATEE (DUVAL) $510,181 N/A N/A $226 N/A 1 N/A 183 NORTH JACKSONVILLE $619,500 $645,135 -4% $243 17% 6 -57% 33 SAN MARCO/SAN JOSE $649,900 $610,000 7% $330 17% 13 8% 65 SOUTHSIDE $575,000 $580,000 -1% $224 1% 5 -76% 29 WEST JACKSONVILLE $709,944 $925,000 -23% $322 -5% 2 0% 72
$
$
CLAY COUNTY
MARKET DATA FOR RESIDENTIAL PROPERTIES, $500,000+
ALL RESIDENTIAL | STEADY PRICING, SALES DOWN
The median price of higher-priced homes was flat from one year ago, though sales volume slowed.
Neighborhood Snapshots
*ALL PERCENTAGES REFLECT YEAR OVER YEAR CHANGE.
614K 73 33 43 219 MEDIAN SALES PRICE AVERAGE DAYS ON MARKET ACTIVE LISTINGS SOLD LISTINGS MEDIAN PPSF 0% ↑ 115% ↑ 5 % ↓ 35% ↓ 45 %
MEDIAN SALES PRICE MEDIAN PRICE PER SF CLOSED SALES AVERAGE DAYS ON MARKET MAY 23 MAY 22 YOY% CHANGE MAY 23 YOY% CHANGE MAY 23 YOY% CHANGE MAY23 FLEMING ISLAND $613,900 $618,500 -1% $212 -1% 9 -74% 75 GREEN COVE SPRINGS $569,792 $576,000 -1% $220 17% 10 900% 83 MIDDLEBURG/KEYSTONE $667,100 $555,000 20% $237 21% 13 30% 56 ORANGE PARK N/A $549,900 N/A N/A N/A - N/A N/A OAKLEAF PLANTATION $612,500 $623,999 -2% $193 7% 3 -73% 75
$ $
NASSAU COUNTY
MARKET DATA FOR RESIDENTIAL PROPERTIES, $500,000+
ALL RESIDENTIAL | SALES AND PRICES DIP
Compared with last year, sales were off by 13%, and the median price was 4% lower. For-sale inventory trended lower from the peak in March and fell to 4% less than a year ago.
Neighborhood Snapshots
*ALL PERCENTAGES REFLECT YEAR OVER YEAR CHANGE.
690K 47 146
MEDIAN SALES PRICE AVERAGE DAYS ON MARKET ACTIVE LISTINGS SOLD LISTINGS MEDIAN PPSF ↓ 4% ↑ 24% ↑ 13 % ↓ 13% ↓ 4 %
137 344
MEDIAN SALES PRICE MEDIAN PRICE PER SF CLOSED SALES AVERAGE DAYS ON MARKET MAY 23 MAY 22 YOY% CHANGE MAY 23 YOY% CHANGE MAY 23 YOY% CHANGE MAY23 AMELIA ISLAND/FERNANDINA BEACH $690,000 $757,500 -9% $371 8% 75 -20% 43 YULEE/WILDLIGHT $628,372 $522,500 20% $248 30% 4 100% 55
$ $
FLAGLER COUNTY
ALL RESIDENTIAL | RECORD-BREAKING SALES PACE
Sales volume for higher-priced homes increased by 20% compared with one year ago. The number of homes sold for more than $500,000 reached an all-time high in May.
Neighborhood Snapshots
*ALL PERCENTAGES REFLECT YEAR OVER YEAR CHANGE.
665K 59 128 131 314 MEDIAN SALES PRICE AVERAGE DAYS ON MARKET ACTIVE LISTINGS SOLD LISTINGS MEDIAN PPSF ↑ 6 % ↑ 119 % ↑ 1% ↑ 20% ↓ 4 %
MEDIAN SALES PRICE MEDIAN PRICE PER SF CLOSED SALES AVERAGE DAYS ON MARKET MAY 23 MAY 22 YOY% CHANGE MAY 23 YOY% CHANGE MAY 23 YOY% CHANGE MAY23 BUNNELL N/A $819,000 N/A N/A N/A - N/A N/A FLAGLER BEACH $705,000 $630,000 12% $356 4% 14 56% 61 PALM COAST $665,000 $649,500 2% $295 -5% 65 12% 63
$ $
MARKET DATA FOR RESIDENTIAL PROPERTIES, $500,000+


Explore Your Mortgage Options > Bank on Better Finance your next home with 75 years of trusted Florida-based mortgage expertise at your side. Extensive local real estate experience and market knowledge. Flexible home loans with competitive rates. 1 Personalized service from application to close. Primary Residences & Second Homes Vacation Homes & Investment Properties New Construction & Land Acquisition Member FDIC NMLS#412469 © 2022 City National Bank of Florida 4218351587 / r03/23 1 Loans and lines of credit are subject to credit approval and program requirements. Fees and restrictions apply Terms and conditions subject to change.
ONE Sotheby’s International Realty prides itself in being at the forefront of innovation, service, and marketing that push the boundaries within our industry. Our commitment to providing the highest caliber of expertise and dedication sets us apart as we continue to raise the standard of excellence. As real estate’s most trusted brand, our name alone opens the most prestigious doors and creates opportunities to connect sellers and buyers worldwide. That is our mission: to give extraordinary lives a home to thrive.
#1
BEST LUXURY BROKERAGE IN FLORIDA IN 2022 by
Our brand, your advantage Nothing
BEST BROKERAGE WEBSITE IN 2022 by South Florida Agent Magazine
compares.
© 2023 ONE Sotheby’s International Realty. All rights reserved. Sotheby’s International Realty® and the Sotheby’s International Realty Logo are service marks licensed to Sotheby’s International Realty Affiliates LLC and used with permission.
VOTED
VOTED
Luxury Lifestyle Magazine
MOST
LUXURY
ESTATE
#1 Source:
#1
PROFILED
REAL
BRAND IN THE PRESS
Meltwater Jan 2022-Dec 2022 8x AWARD -WINNING MARKETING POWERHOUSE
For unmatched real estate expertise © 2023 ONE Sotheby’s International Realty. All rights reserved. Sotheby’s International Realty® and the Sotheby’s International Realty Logo are service marks licensed to Sotheby’s International Realty Affiliates LLC and used with permission. ONE Sotheby’s International Realty fully supports the principles of the Fair Housing Act and the Equal Opportunity Act. Each franchise is independently owned and operated. Any services or products provided by independently owned and operated franchisees are not provided by, affiliated with or related to Sotheby’s International Realty Affiliates LLC nor any of its affiliated companies. The information contained herein is deemed accurate but not guaranteed.
