
Academic Authors: Jatinder Kaur, Ayushi Jain, Chandani Goyal, Kashika Parnami, Anuj Gupta, Simran Singh
Creative Directors: Bhavna Tripathi, Mangal Singh Rana, Satish
Book Production: Rakesh Kumar Singh, Sakshi Gupta
Project Lead: Jatinder Kaur
VP, Learning: Abhishek Bhatnagar
All products and brand names used in this book are trademarks, registered trademarks or trade names of their respective owners.
© Uolo EdTech Private Limited
First published 2023
Second published 2024
Third published 2025
This book is sold subject to the condition that it shall not by way of trade or otherwise, be lent, resold, hired out, or otherwise circulated without the publisher’s prior written consent in any form of binding or cover other than that in which it is published and without a similar condition including this condition being imposed on the subsequent purchaser and without limiting the rights under copyright reserved above, no part of this publication may be reproduced, stored in or introduced into a retrieval system, or transmitted in any form or by any means, electronic, mechanical, photocopying, recording or otherwise, without the prior written permission of both the copyright owner and the above-mentioned publisher of this book.
Book Title: Tekie Computer Science 5
ISBN: 978-81-978912-6-7
Published by Uolo EdTech Private Limited
Corporate Office Address:
85, Sector 44, Gurugram, Haryana 122003
CIN: U74999DL2017PTC322986
Illustrations and images: www.shutterstock.com, www.stock.adobe.com and www.freepik.com
All suggested use of the internet should be under adult supervision.
Standing at the forefront of the digital and AI revolution, the importance of coding and computational skills has reached unprecedented heights. In today’s professional landscape, whether it is in the fields of medicine, space exploration, education, science, or business, no sector remains untouched by this transformative wave. To thrive in the 21st century, basic computer literacy is no longer sufficient. Learners must evolve into ‘digital natives’ who can fluently read, write, and communicate in the languages that machines and AI comprehend.
Recognising this imperative, the National Education Policy (NEP) 2020 has strongly recommended the integration of coding skills, computational thinking, critical analysis, and problem-solving abilities into the curriculum. Moreover, forward-looking subjects like AI, Data Science, Computer Applications, and IT have been introduced as elective subjects from grade 9 onwards. It wouldn’t be surprising if further transformative measures are taken even at the elementary education level.
Uolo has introduced an innovative 360-degree program for a coding-focused computer science curriculum, known as Tekie, spanning grades 1 to 8. Tekie is a significant stride towards STEM education that aims at making learners future-ready—enabling them with skills needed in the ever-changing, technology-driven, and dynamic 21st-century world.
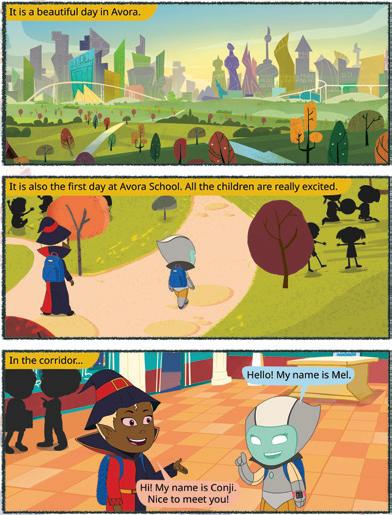
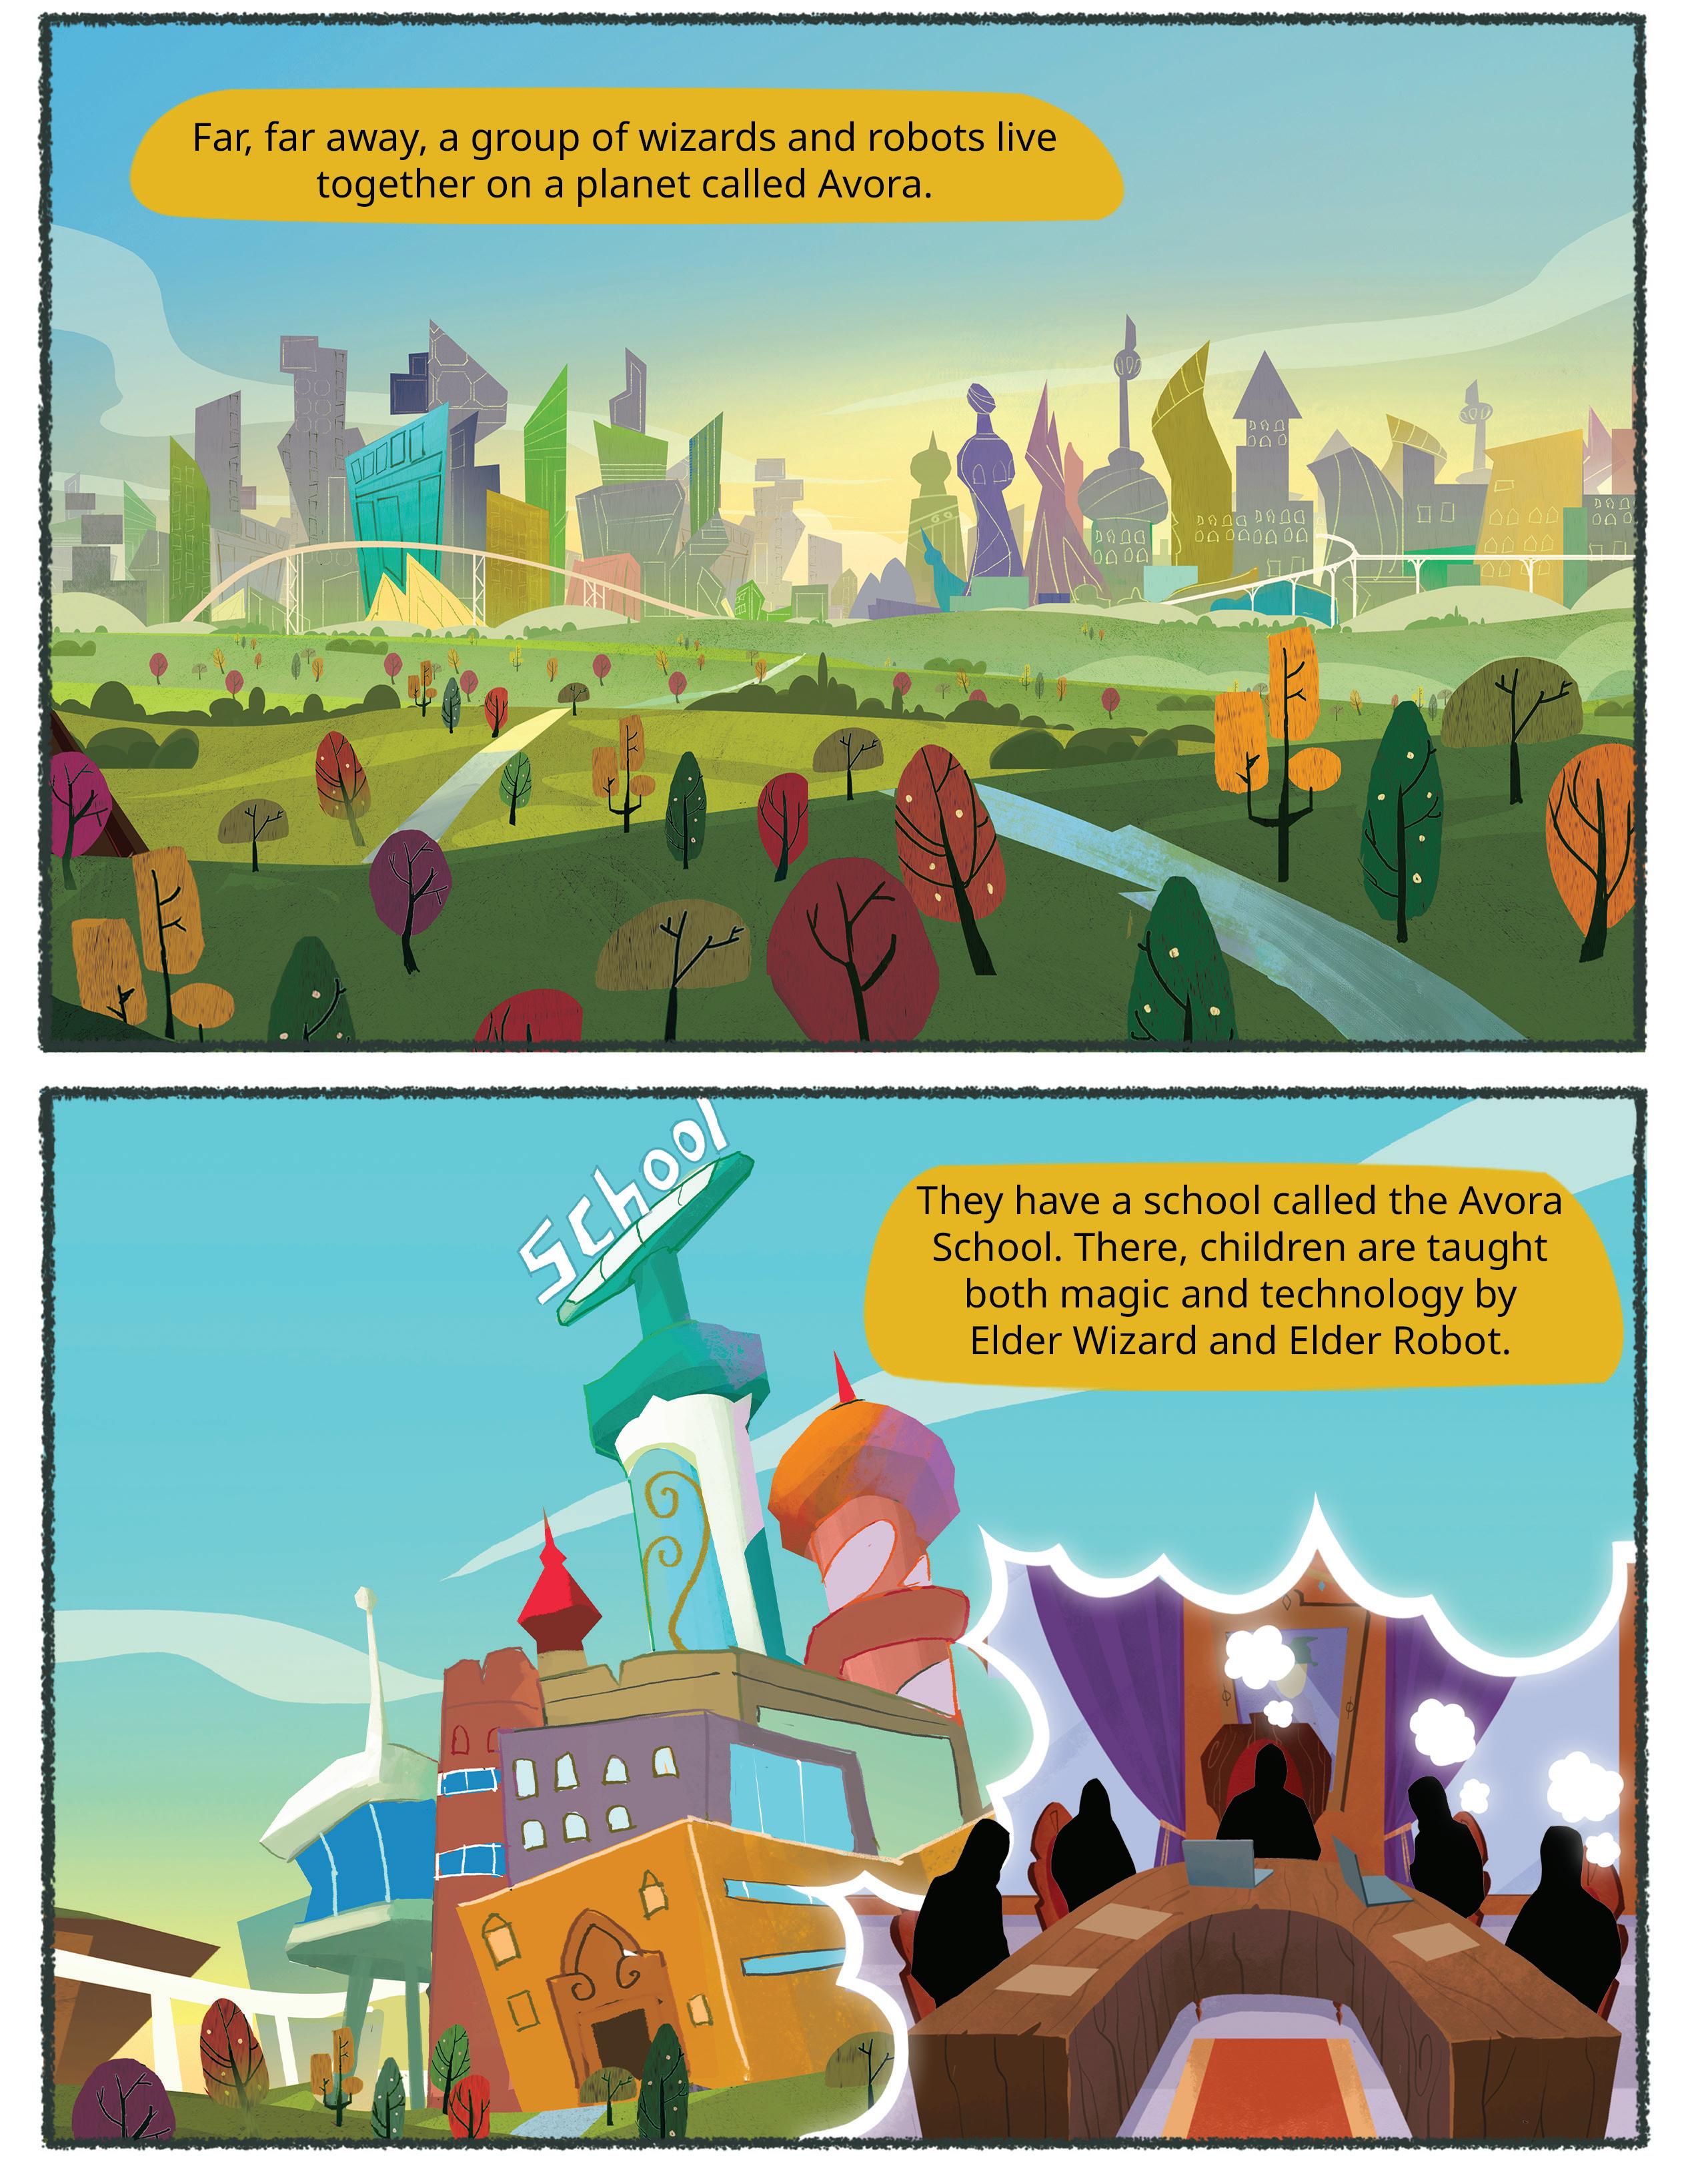
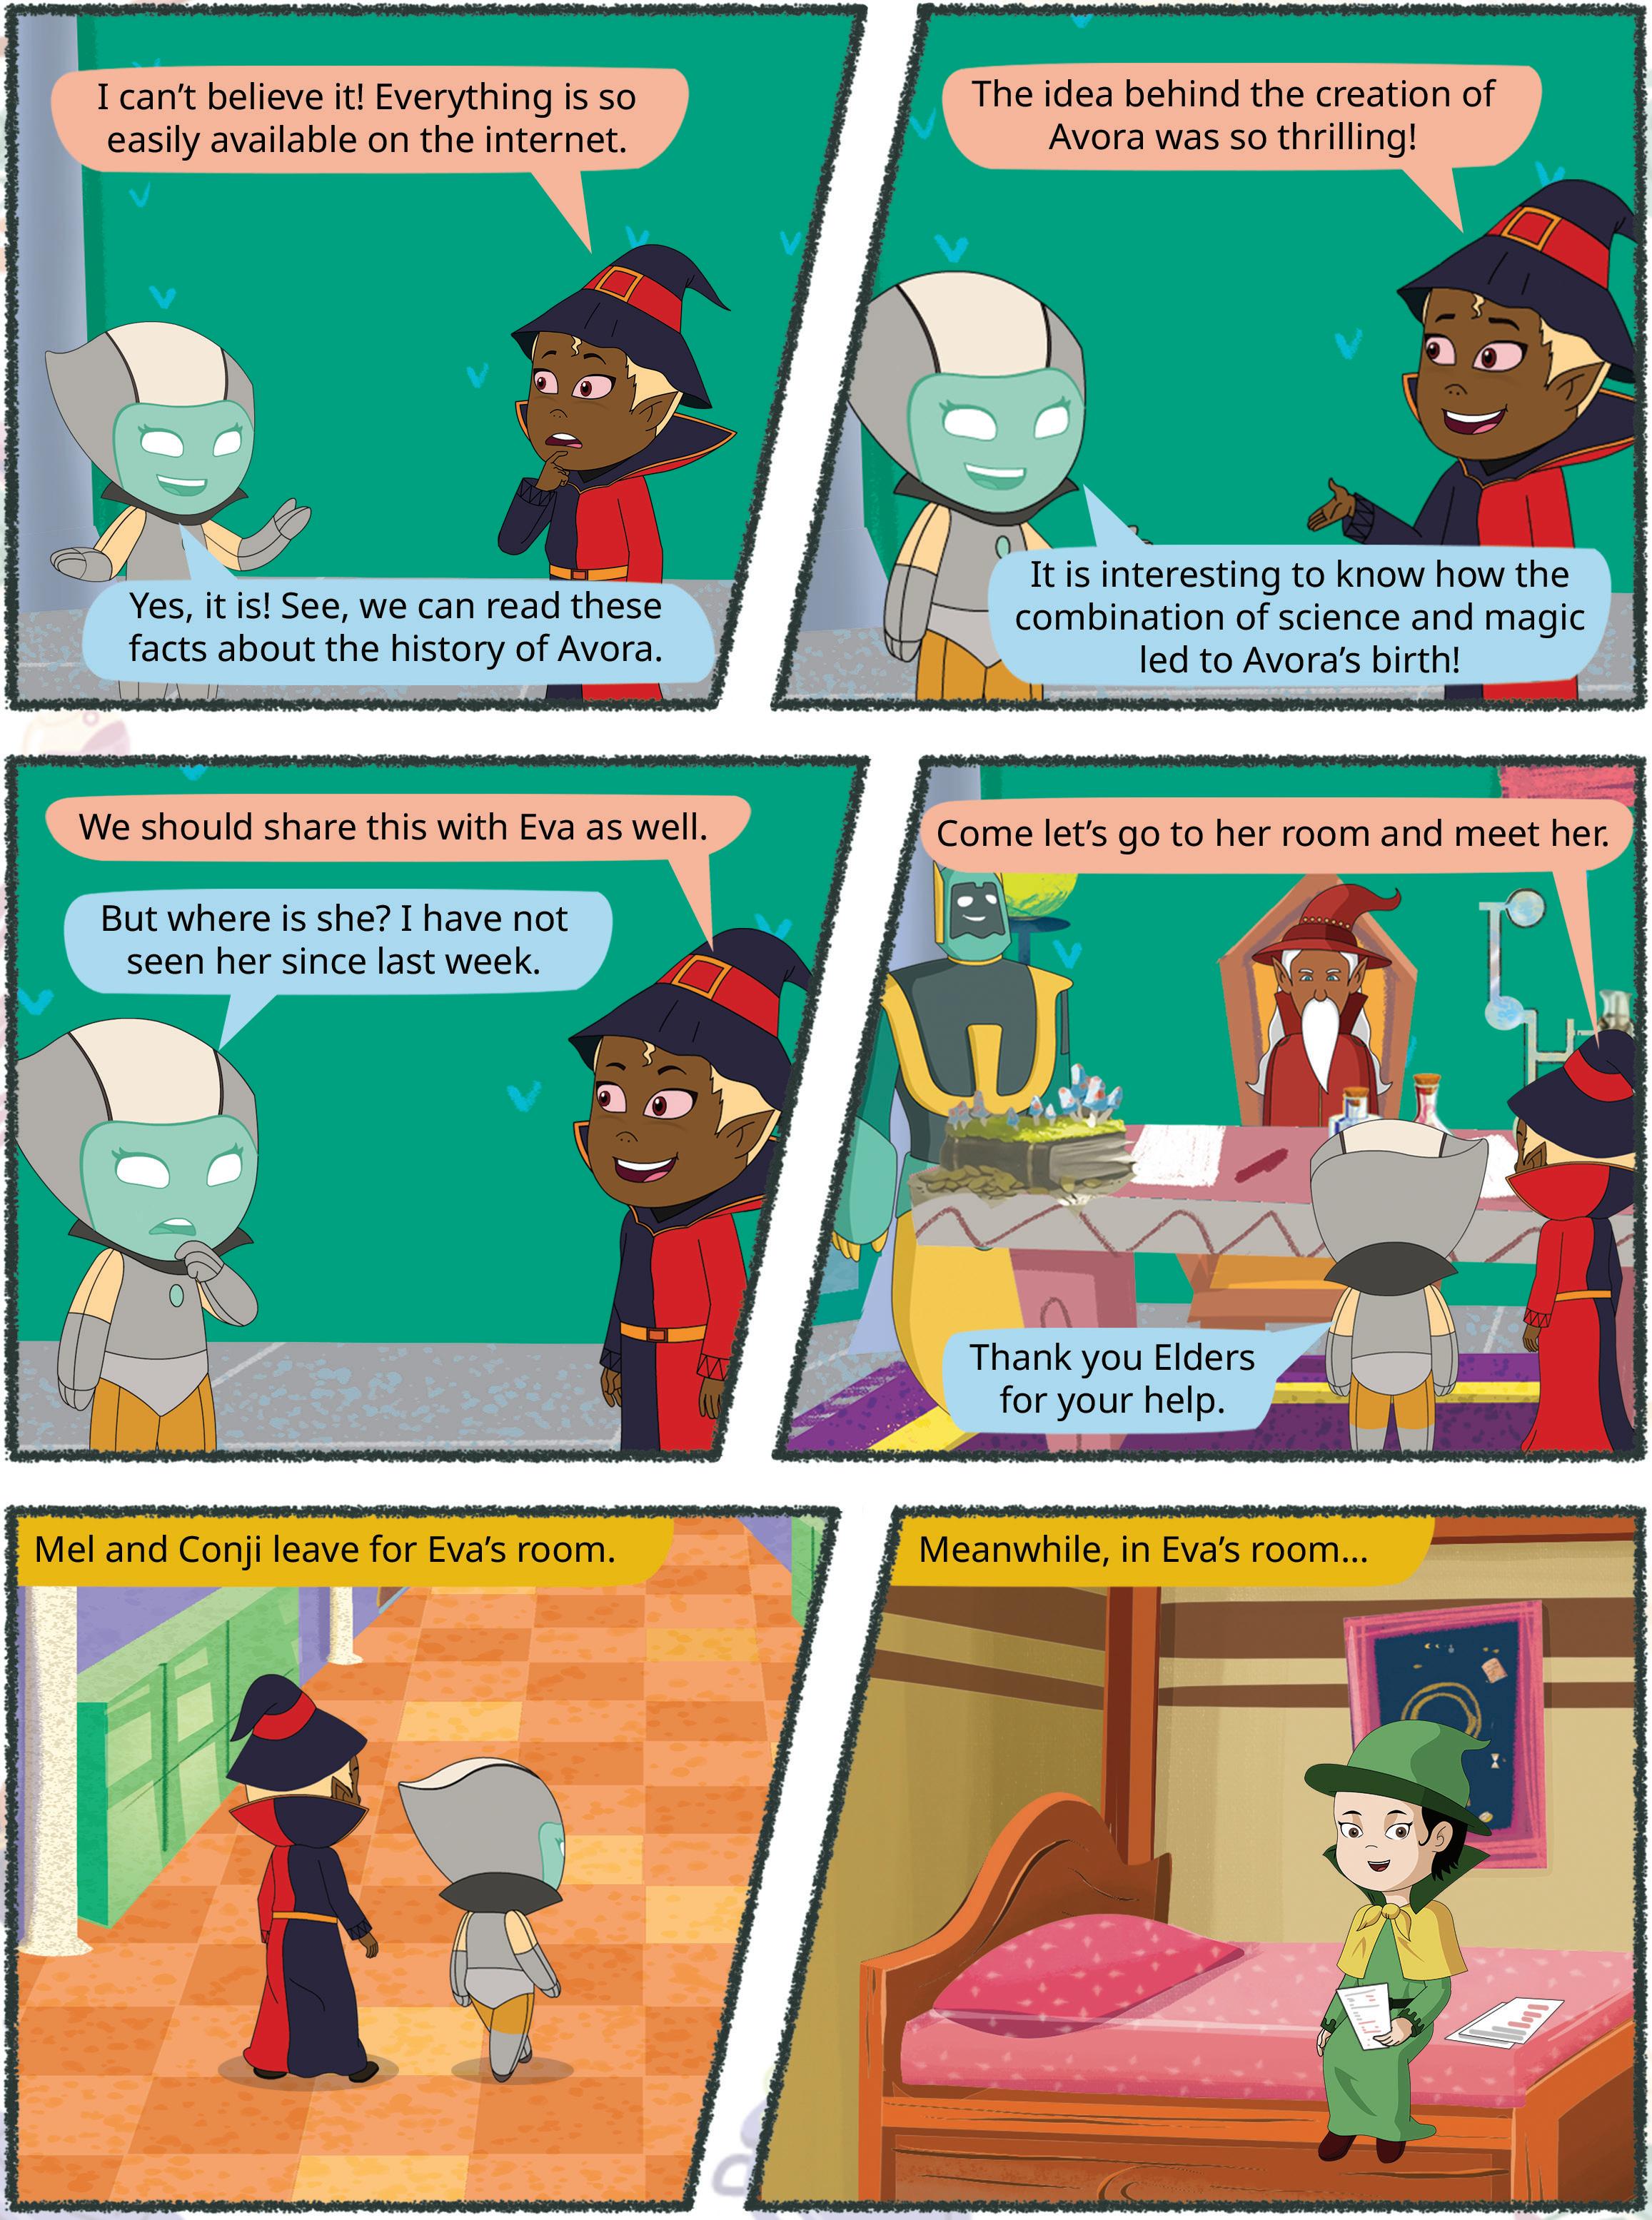
Tekie adopts a captivating and engaging approach to learning, in line with the recommendations of the National Curriculum Framework (NCF) 2023 and NEP 2020. The curriculum is ingeniously woven into the thrilling adventures of Mel and Conji, fictional characters from the enchanting land of Avora. The Mel and Conji series epitomises a modern method of acquiring computer science knowledge and honing computational thinking skills. The program includes chapters that provide a deeper immersion in computer science that both learners and teachers may find interesting.
Tekie is a technology-empowered curriculum that encompasses the following components:
• Main Content Books: These introduce learners to the theory of computer science and computer tools. Topics in AI are also covered, along with experiential and project-based learning resources.
• Coding Books: Specifically designed to nurture coding skills, this booklet aligns with the experiential and contextual learning approach of the coding curriculum, fostering critical thinking and problemsolving abilities.
• Animated Learning Videos: The program is powered by high-quality animation-based learning videos that deliver learning in an engaging manner.
• Teacher Manual: This valuable resource supports classroom instruction, ensuring that educators effectively deliver the curriculum.
Welcome to the captivating realm of Tekie! We hope you relish this educational journey as it equips you with the tools you need to thrive in the exciting and ever-changing world of the 21st century.
Tekie is an interactive, engaging, and experiential computer science program. It enables learners to attain mastery in computer science theory, new-age computer tools and coding. These are delivered through a storytelling-based coursebook and an experiential learningoriented coding book.
The learning experience is augmented by a digital platform that gives learners access to learning videos and experiential activities and projects that are rooted in the curriculum.
Engaging Textbooks
Comic Stories
Teacher Manual
Test Papers
Additional Projects
Test-paper Generator
Student and Teacher Platform


Learning Videos
Interactive Classroom and Homework Assignments
Byte-size Lesson Modules

The National Education Policy (NEP) 2020, introduced by the Government of India, represents a transformative shift in the country’s education system. It aims to create a more holistic, dynamic and multidisciplinary approach to education. The NEP highlights the need for early development of computational thinking, coding, and digital literacy as vital skills for students’ holistic growth. UOLO is fully committed to actualising the vision of NEP 2020 by meticulously adhering to its outlined recommendations.


1. Focus on conceptual understanding
2. 21st century skills, values, and dispositions
3. Computational and critical thinking
4. Application in real life
5. Holistic and integrated learning
6. Experiential learning
7. Enjoyable and engaging
8. Artificial intelligence and coding concepts
9. Digital literacy and emerging technologies
10. Factoids on India
Competency-based Education
NEP Pages 12, 17 and 22
Teaching and Learning Pedagogy
NEP Pages 3, 5, 11, 12 and 56
National Pride
NEP Pages 15, 16 and 43
11. Assessment of core concepts and application skills Assessments
NEP Pages 12, 18 and 22
Project-based Learning
Engaging hands-on projects encouraging practical application of computer science and coding
Story-based Approach
Enchanting tales that bring learning themes to life, making education a captivating adventure 5 7
Equipping the students with future-ready skills through exposure to the latest tools and technologies
2 3 4 6 8 9
Engaging activities to deepen students’ understanding and engagement with AI concepts
Test papers designed to evaluate understanding of core concepts and application of skills 3 4 11
Projects on the digital platform to deepen understanding and develop essential practical skills
Invites learners to discuss in small groups and present different perspectives
Story-style learning videos that deliver concepts to students.
Intellectually stimulating questions designed to encourage deep, analytical, critical, and evaluative thought process
Interactive quizzes that reinforce learning and assess students’ understanding
3 7 9 11 7 Enjoyable and engaging 8 Artificial intelligence and coding concepts 9 Digital literacy and emerging technologies 10 Factoids on India 11 Assessment of core concepts and application skills
Think It Through
Probing question related to the concept that arouses curiosity
Tool to create customised assessments that align with the curriculum and help evaluate students’ progress effectively.
The National Education Policy (NEP) 2020 outlines essential skills, values, dispositions, and learning approaches necessary for students to thrive in the 21st century. This textbook identifies and incorporates these elements throughout its content, activities, and exercises. Referred to as “NEP Tags”, they are defined as follows:


INTEGRATED


Art Integration
Bringing creativity and fun into learning by combining music, drama, and art with other subjects
Sports Integration
Using games and sports in daily life to enrich computer-related activities
Cross-curricular linkages to make the learning experience more holistic, joyful and meaningful
Critical Thinking
Coding opportunities to apply higher-order skills like algorithmic and computational thinking, and problem-solving
Step-by-step activities to enable learners put theoretical knowledge into practice

SDG
Applied computer science activities related to real-world issues and sustainable development

SEL Social Emotional Learning
Developing the skills to understand and manage emotions, build positive relationships with others and make responsible choices
The curriculum is thoughtfully mapped to introduce tools and technologies at each grade level, ensuring a smooth and progressive learning experience for students. Beginning with basic concepts in junior grades, the curriculum gradually incorporates more advanced tools and concepts in higher grades. This structured approach enables students to build on their knowledge each year, equipping them with essential skills in computer science and technology as they progress from grade 1 through grade 8. By the time they reach the higher grades, students are well-equipped to tackle complex projects, think critically, and apply their skills in real-world scenarios. The curriculum not only fosters technical proficiency but also encourages creativity, problem-solving, and a deeper understanding of the digital world.

1
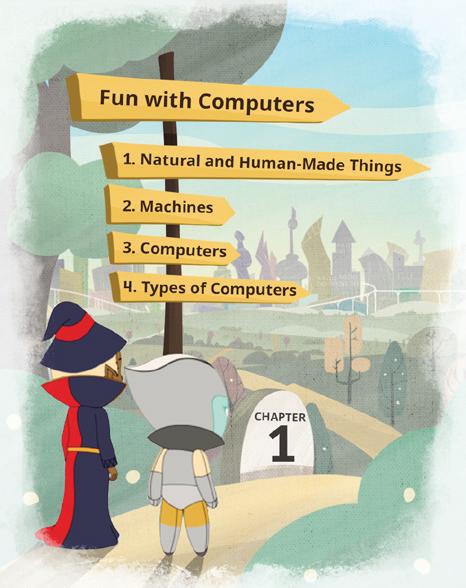
We
Theme Page: Lists the chapters covered under a unit


2
We see many things around us. Some things are present in nature like
animals,
and rivers. These are called natural things
Comic Story: To introduce key concepts in a fun way
Did You Know: Interesting facts related to the topic
Discuss: A multi-faceted probing question related to the concept that arouses curiosity

4

3


and

Explore More: Short videos to find out more about the topic
Do It Yourself: Short exercises between the chapter to pause and assess comprehension


Some things are made by humans. These are called human-made things Buildings,
are some human-made things.


Let

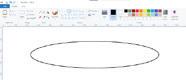
2. Click on the Oval shape. 3. After selecting the shape, go to the drawing area.
4. Hold the left mouse button, drag the mouse, and then release the mouse button. You will see that an oval has been drawn. Oval
Project-based Learning: A project-based learning approach employed to foster an engaging and interactive learning experience Points to Remember: Summary of the chapter
Chapter Checkup: Chapter-end practice exercises aligned to different levels of Bloom’s Taxonomy

Apply your learning: Intellectually stimulating questions designed for higher-order thinking and analysis
Have you ever given a command to the speaker at your home to play a song, and it plays it?
Do you know what these speakers are known as?


These special speakers, which follow your voice commands, are smart speakers Smart speakers can do this because of AI.
What is AI?


Artificial Intelligence: Chapters on Artificial Intelligence to explore the fundamentals of AI, including its principles and applications in various fields
AI stands for Artificial Intelligence It gives machines the ability to learn and do things on their own, just like humans do
AI Around Us
• Talking Toys: Some toys use AI to understand your voice and respond with sounds, songs, or even short sentences.

A. Fill in the blanks.
• Robot Helpers: These machines help us with daily tasks at home. They can clean floors, cook food, etc. They do work in the same way as a human does.
Fun with AI: Engaging AI activities designed to help students explore and apply AI concepts in practical ways


AI devices are all around us. There are many types of machines that use Artificial Intelligence (AI) to perform tasks or respond to us. Some examples of such AI devices are:

• Smart Speakers: These speakers respond to your voice commands. They use AI to understand your voice commands, like when you ask them to play music or tell you a story.

• Selfie Magic: Some phones use AI to edit your selfies. The AI can adjust lighting, smooth out backgrounds, or add fun filters.


Test Paper 1 (Based on Chapters 1 to 3)
Test Papers: Designed to evaluate understanding of core concepts and application of skills
1 Things that are present in nature are called
2 Some machines need to work.
3 Computers are used in to keep information of patients.
4 At restaurants, computers are used to order and pay for
B. Tick () the correct answer.
1 Which of the following is a human-made thing?
a Mountains b Trees
c Cars d Animals
2 Which machine helps us keep our food fresh?
a Refrigerator
1 The Journey of Computers ................. 1
• History of Computers
• Generations of Computers
• Characteristics of Computers
• Limitations of Computers
2 Communicating Online .................... 15
• Internet
• Ways to Connect to the Internet
• Browsing the Internet
• Communication over the Internet
• Electronic Mail
• Netiquette
3 Working with Tables in Word Processor ........................................... 35
• Creating a Table
• Entering Data in a Table
• Editing a Table
• Formatting a Table
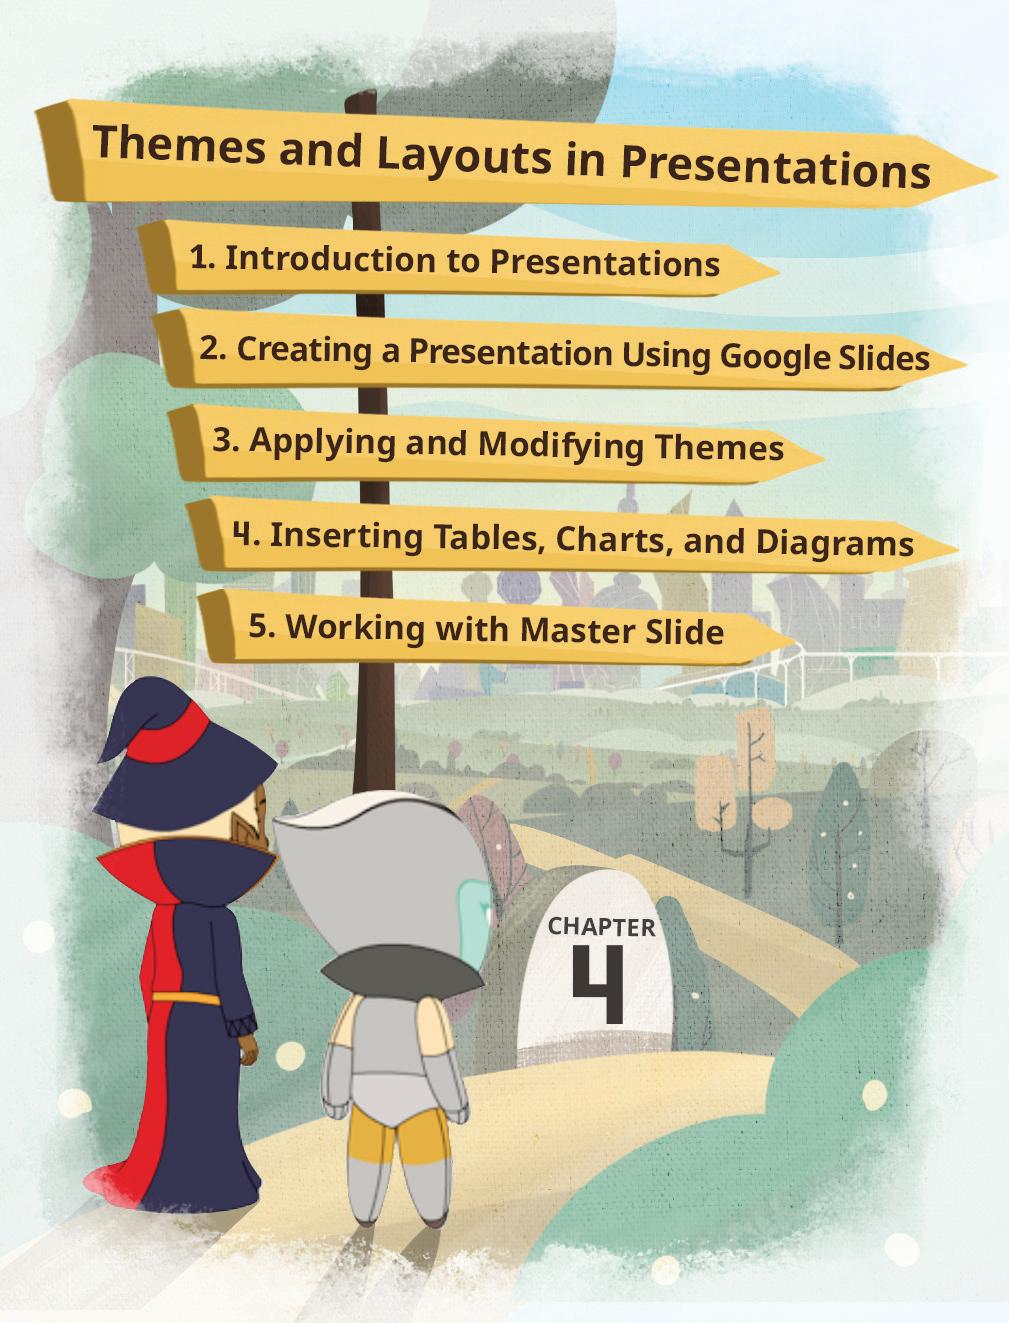
4 Themes and Layouts in Presentations .................................... 54
• Introduction to Presentations
• Creating a Presentation Using Google Slides
• Applying and Modifying Themes
• Applying Layouts
• Inserting Tables, Charts, and Diagrams
• Working with Master Slide
5 Animations and Transitions in Presentations .................................... 78
• Applying Animations
• Applying Transition
• Adding Audio and Video
6 Starting with Spreadsheets ............. 95
• Introduction to Google Sheets
• Components of Google Sheets Window
• Moving Around in a Spreadsheet
• Entering Data
• Saving and Closing a Sheet
• Opening a Sheet
7 Editing Data in Spreadsheets ........ 113
• Interacting with Spreadsheets
• Using Undo and Redo
• Copying Cell Data
• Moving Cell Data
• Deleting Cell Data
8 Artificial Intelligence and Its Domains...................................... 131
• Introduction to Artificial Intelligence
• Domains of AI

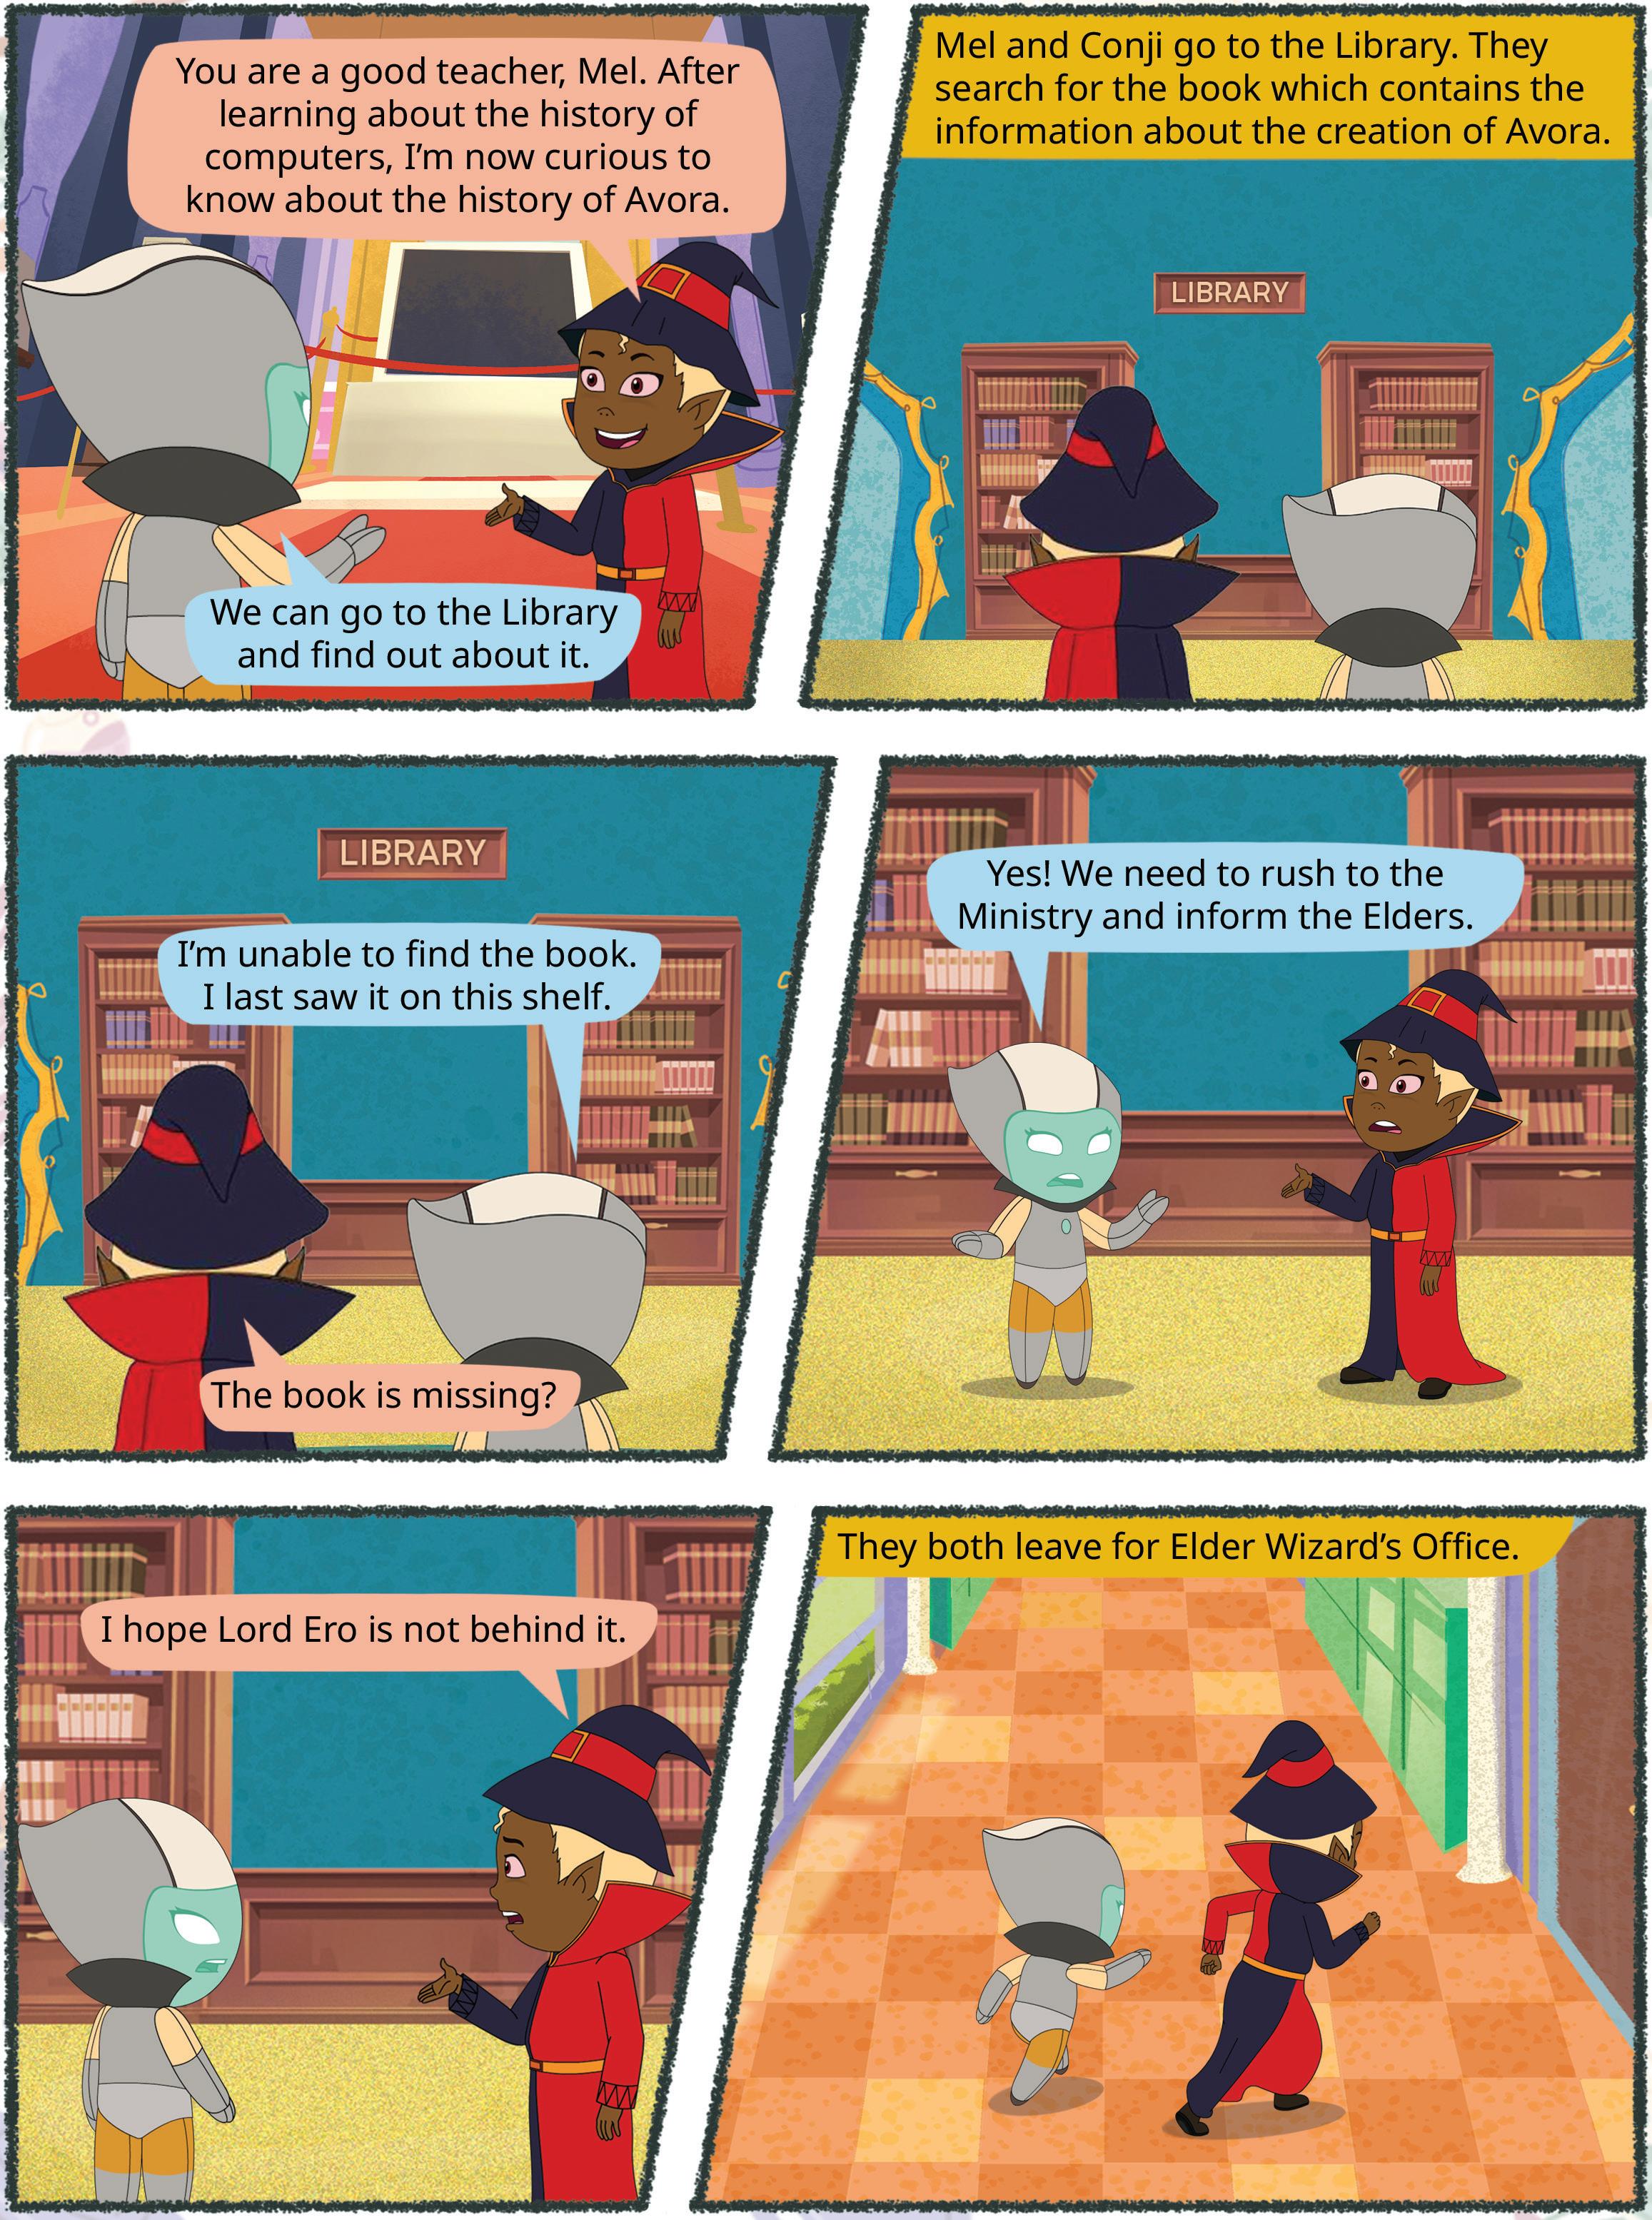
Computers have become an integral part of our lives. They help us in almost every sphere of life these days. We cannot even imagine a world without computers. Have you ever wondered how people were managing without computers before their invention?
Let us learn about some early-age devices and the history of computers and how they have evolved from slow, bulky, and room-sized machines to fast, smart, and sleek gadgets.
1. Abacus:
a. Abacus is one of the earliest counting devices.
b. It is a wooden frame divided into two parts.
c. Both the parts have rods on which the beads move and are used for basic mathematical calculations.
2. Napier’s Bones:
a. It is a manually-operated calculating device developed by John Napier in 1617.
b. In this calculating tool, he used nine different ivory strips or bones marked with numbers to multiply and divide.
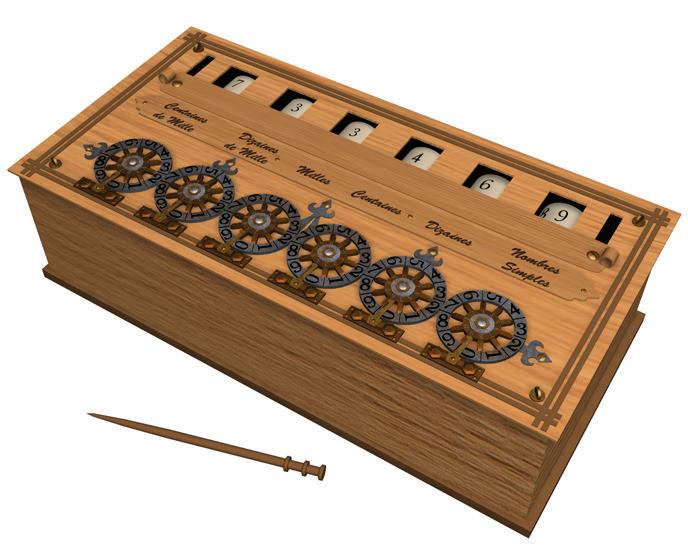
3. Pascaline:
a. Pascaline, also called the Arithmetic Machine or Adding Machine, is considered one of the first mechanical and automatic calculator.
b. It was invented between 1642 and 1644 by the French mathematician and philosopher, Blaise Pascal.
c. It can perform only addition and subtraction.
4. Stepped Reckoner or Leibniz Wheel:
a. Leibniz, a German mathematician and philosopher, created the Stepped Reckoner in 1673, improving upon earlier mechanical calculators.


b. It is a digital mechanical calculator that uses a stepped drum (also known as the Leibniz wheel) to represent numbers.
c. Leibniz’s machine helped us see that machines could do maths automatically, which eventually contributed to the development of modern computers.
5. Difference Engine and Analytical Engine:
a. Charles Babbage designed both engines and is known as the ‘Father of Modern Computers’.
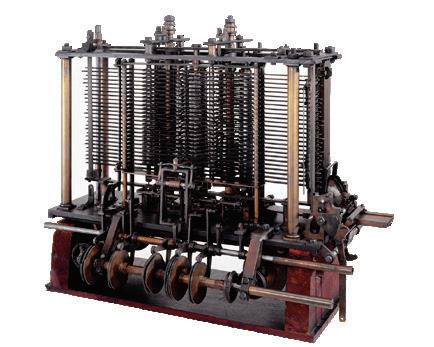
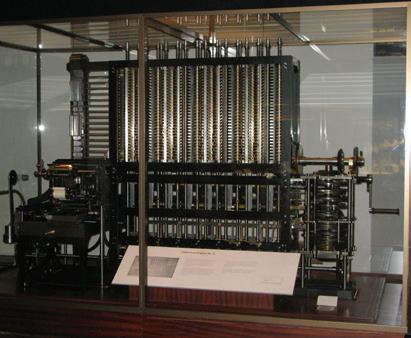
b. The Difference Engine performs simple calculations, whereas the Analytical Engine uses punch cards for input. A punch card is a piece of card that stores digital data using punched holes.
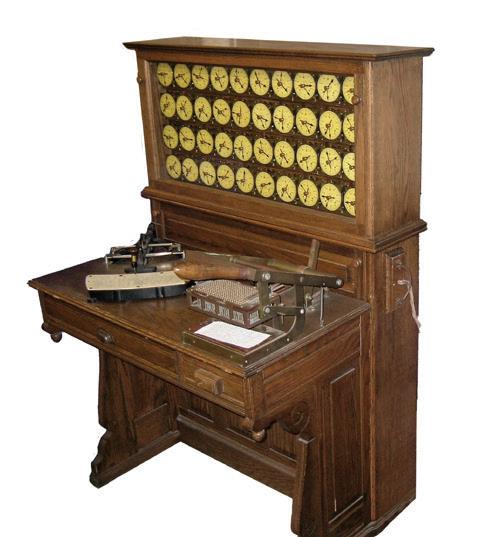
6. Tabulating Machine:
a. It was invented by an American statistician Herman Hollerith in 1890.
b. This electromechanical machine was developed to help in processing data stored on punch cards.
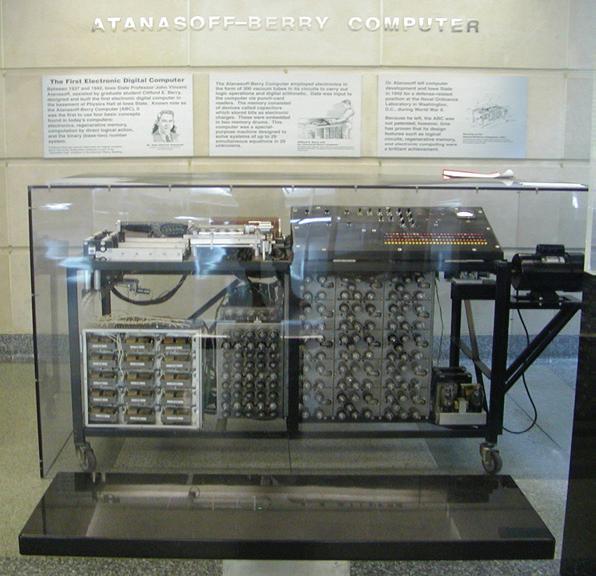
7. Differential Analyzer:
a. It is the first electronic computer invented in the United States in 1930.
b. This analog device, invented by Vannevar Bush, could perform 25 calculations in a few minutes.
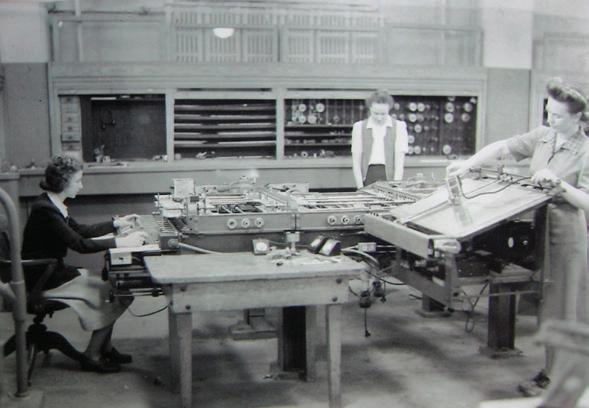
8. Mark I:
a. In 1937, Howard Aiken thought of the idea of a machine to handle large-scale calculations.
b. In 1944, IBM and Harvard collaborated to build the Mark I computer.
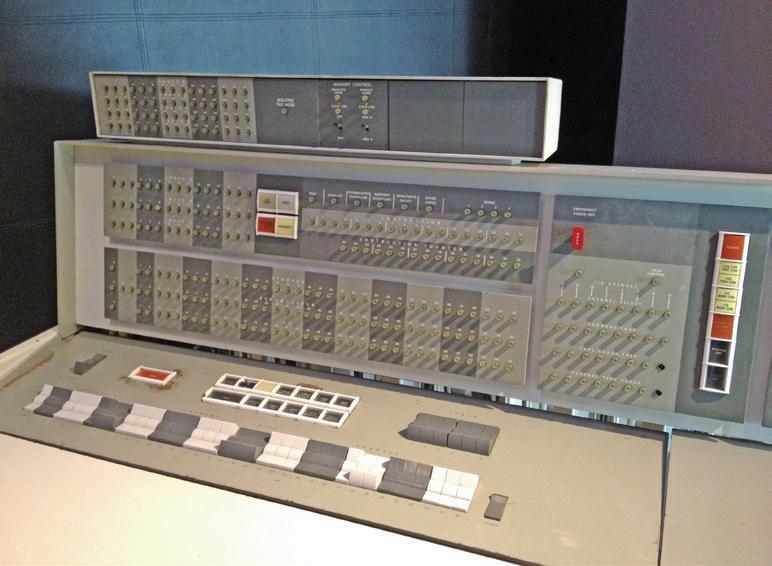
9. ENIAC:
a. Electronic Numerical Integrator and Computer (ENIAC) was one of the first programmable, general-purpose, electronic digital computers. It was built in 1945 by John Mauchly and J. Presper Eckert.
b. It was massive and superfast for its time, like a giant calculator with lots of tubes and wires.
c. It helped with important tasks like calculating for the military, predicting the weather, and studying science.
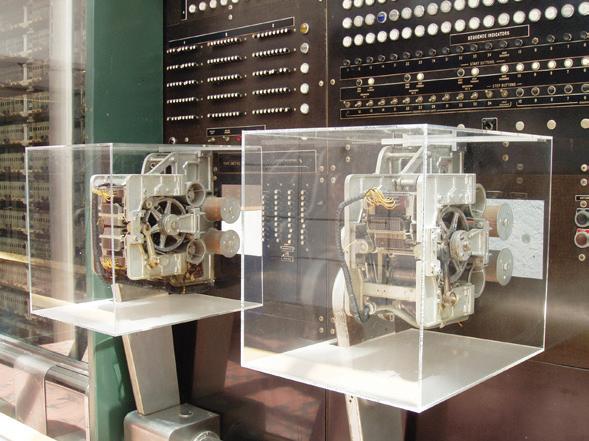
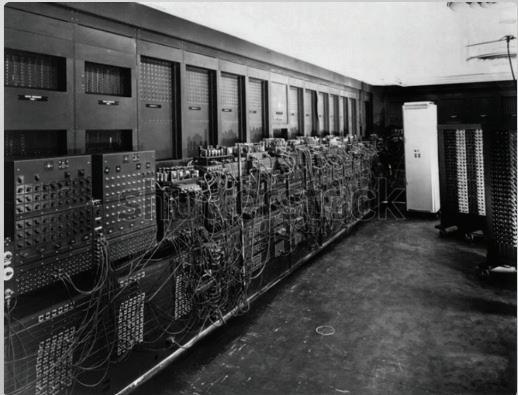
d. ENIAC started the era of modern computers, demonstrating their ability and inspiring the development of improved, smaller, and more efficient machines.
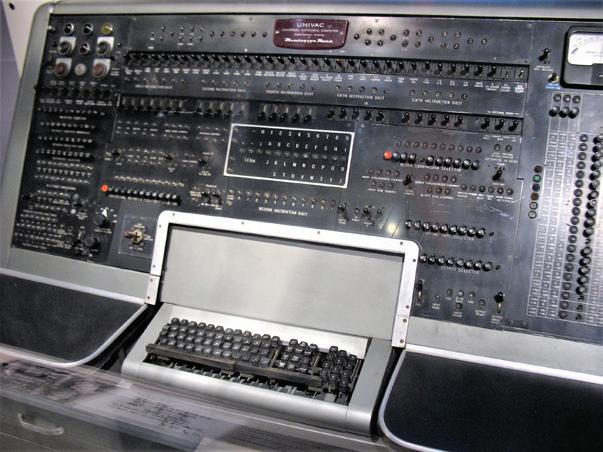
10. UNIVAC:

a. After ENIAC, John Mauchly and J. Presper Eckert developed the Universal Automatic Computer (UNIVAC) and delivered it to the Census Bureau on March 31, 1951. It is one of the earliest commercial computers.
b. It replaced the punch card accounting machines. It was the fastest machine developed in its time.
c. It helped with research-level calculation in universities, and helped make office calculations automatic.

ENIAC weighed more than 27 tons and took up 1,800 square feet space. Did You Know?

Learn more about ENIAC, the first programmable, electronic, generalpurpose digital computer.
Generations of computers mean the various stages of advancement in computer technology. These generations are usually categorised into five main phases:
1. First Generation Computers (1946–59):
a. These early computers used vacuum tubes, which consisted of thin filaments, that caused the computers to heat up a lot.
b. They had limited memory, so they could not store much information.
c. These computers were huge, costly, slow, and not very reliable. They required a lot of maintenance.
d. People programmed them using machine language assembly language, both of which were quite complex.
e. Famous first generation computers include ENIAC and UNIVAC.
2. Second Generation Computers (1959–65):
a. These computers were relatively smaller because they used tiny transistors instead of bulky vacuum tubes.
b. These computers were faster and cheaper, making them more efficient.
c. They stored information using magnetic core memory.
d. People used punched cards for input and got results on paper or magnetic tapes.
e. These computers used assembly languages for programming and could work on data in organised batches.
f. Famous computers from this time were the CDC 3600 and IBM 7090.
a. The third generation computers used integrated circuits (ICs). They are also known as silicon chips or microchips. They were used widely. Integrated circuits are circuits of many electronic components together on a chip. This dramatically reduced the size of computers.
b. The ICs in this generation used small scale integration (SSI) and medium scale integration (MSI) technologies.
c. They used a variety of memory technologies, including core memory (from the previous generation) and emerging options like semiconductor memory, which offered faster access times and potentially higher capacity.
d. Keyboards and friendlier interfaces were introduced for users which helped them interact with the computers.
e. Programming languages like Common Business-Oriented Language (COBOL), Formula Translation (FORTRAN), and Beginner’s All-purpose Symbolic Instruction Code (BASIC) made it easier to write software for these machines.
f. These computers were smaller, but they were still expensive. IBM’s System/360 and DEC’s PDP-11 were popular models during this time.
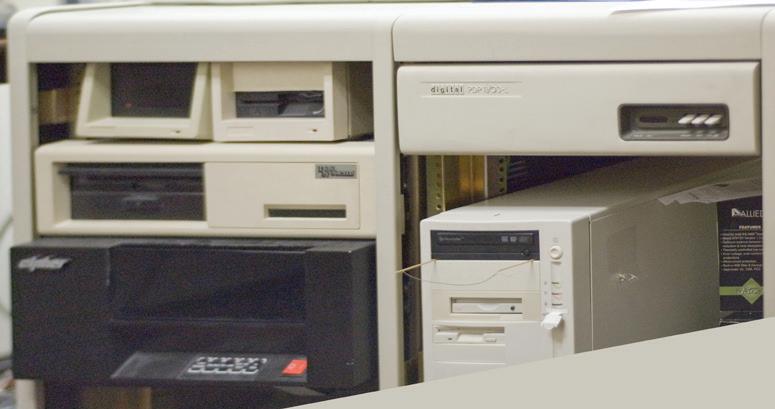
a. Fourth generation computers used integrated circuits with VLSI technology. VLSI stands for Very Large-scale Integration, which means almost up to 1,00,000 electronic components are present on a single small chip. This chip is also known as a microprocessor.
b. They use the faster and more reliable Random Access Memory (RAM) instead of the older magnetic core memory.
c. Input devices like keyboards and mouses are used to interact with these computers. For output, they have monitors and printers.
d. High-level programming languages like C, Pascal, and FORTRAN are used to write software for these computers.
e. Fourth-generation computers are faster, smaller, and cheaper than their predecessors. Some popular names from this era include IBM PC, HP 9000 Series, and DEC 10.
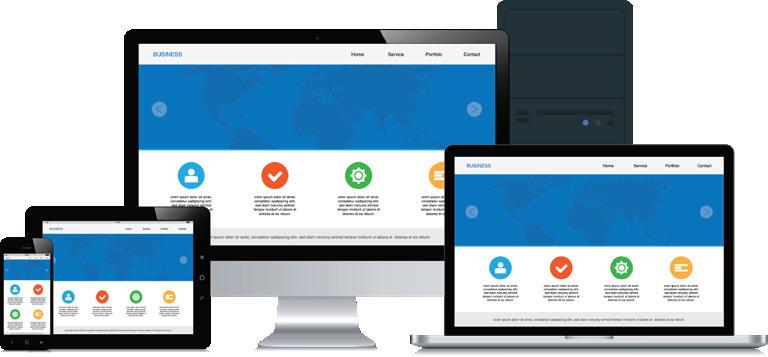
5. Fifth Generation Computers (1980–current):
a. Fifth generation computers use Artificial Intelligence (AI) and Machine Learning (ML) as their main technologies, which are still under development.
b. They have advanced memory to store and handle large amounts of data effectively.
c. Input and output methods include voice recognition, gesture control, augmented reality, virtual reality, and brain-computer interfaces.

d. Popular programming languages like Python, R, and Julia are used to create AI and ML programs.
Even though the first modern computer was huge, it could perform only four tasks: addition, subtraction, multiplication, and division.

Match the generation of computers with their technology.
Column A
Column B
First Generation Computers Integrated circuits (SSI, MSI)
Second Generation Computers Integrated circuits (VLSI)
Third Generation Computers Artificial Intelligence
Fourth Generation Computers Transistors
Fifth Generation Computers Vacuum tubes
Let us learn about different characteristics of a computer.
1. Speed: Computers are super-fast at doing things. They can do lots of calculations and tasks in just a fraction of a second, way faster than humans can.
2. Accuracy: Computers are good at being accurate. They do not make mistakes like humans, who might get tired or rushed.
3. Storage: Computers have vast memories. They can store large amounts of data, including pictures, documents, videos, and much more.
4. Automatic: Computers can do things on their own, following the instructions they have been given.
5. Multitasking: Computers can work on various tasks at the same time. Just like you can read a book while listening to music, a computer can run a game while also performing calculations.
6. Communication: With the help of computers, you can connect and communicate with other people using the internet.
Using the latest technology, you can make and receive phone calls by connecting your phone to a computer.
Computers are incredibly powerful and versatile machines, but they also have several limitations. Here are some of the key limitations of computers:
1. Computers cannot think like humans: Computers are designed and controlled by humans. Even when they seem to operate independently, it is because humans have programmed them to do so.
2. Maintenance: Computers need regular maintenance and timely updates for their proper functioning.
3. Lack of emotional intelligence: While humans experience a range of emotions like happiness, sadness, and excitement, computers lack emotional intelligence and empathy. This limits their applications in fields that require emotional understanding, such as counselling and therapy.
Write T for True and F for False.
1 Computers are faster than humans at performing calculations and tasks.
2 Communication with other people using the internet cannot be done through computers.
3 Computers can work on multiple tasks simultaneously.
4 Computers can experience and express human emotions like happiness and sadness.
Charles Babbage’s designs, the difference engine and the analytical engine, laid the foundation for modern computers.
The ENIAC, built in 1945, was the first electronic and programmable computer.
First generation computers (1946–59) used vacuum tubes, and were large and unreliable.
Second generation computers (1959–1965) introduced transistors, magnetic core memory, and punch cards. These computers were more reliable than the first-generation computers.
Third generation computers (1965–71) brought integrated circuits, core memory, and userfriendly interfaces. The use of IC dramatically reduced the size of computers.
Fourth generation computers (1971–80) featured microprocessors, RAM, and advanced input/ output devices.
Fifth generation computers (1980–to date) use AI and ML technologies, advanced memory, and innovative input/output methods.
Computers are known for their speed and can perform complex calculations in a fraction of a second.
Computers possess memory to store vast amounts of information, ensuring quick access.
Computers let us communicate through the internet, letting us connect globally.
Computers lack independent thinking, emotions, and empathy. They rely on precise instructions and require regular maintenance.
A. Fill in the blanks.
Hints ENIAC vacuum tubes artificial intelligence integrated circuits abacus
is one of the earliest counting devices.
The first programmable electronic digital computer, often considered the beginning of modern computing, was called .
The first generation of computers, from 1946 to 1959, used .
The third generation of computers introduced , which significantly reduced the size of computers.
Fifth-generation computers use and have advanced memory for handling large data sets.
B. Tick () the correct option.
What type of memory did second generation computers use for storage?
a Magnetic core memory
c Magnetic drum memory
b RAM
d Punch cards
In which generation of computers were integrated circuits (ICs) introduced instead of transistors?
a Second generation
c Fourth generation
b Third generation
d Fifth generation
Which programming language is NOT associated with the third generation of computers?
a Python
c FORTRAN
b COBOL
d BASIC
Which computer inventor is often referred to as the ‘Father of Modern Computers’?
a Charles Babbage
c Blaise Pascal
b John Napier
d Vannevar Bush
Which characteristic of computers allows them to perform multiple tasks simultaneously?
a Memory
c Speed
b Automation
d Multitasking
I am the one who designed two significant machines, the Difference Engine and the Analytical Engine.
I am the generation of computers characterised by large size, slow speed, and use of vacuum tubes for computation.
I am a machine, invented between 1642 and 1644 by the French mathematician-philosopher Blaise Pascal, and am capable of performing addition and subtraction operations.
I am a German mathematician known for inventing the Leibniz Wheel, a digital mechanical calculator.
I am one of the first electronic computers ever made in 1945, and I helped with important tasks like military calculations, weather prediction, and scientific research.
D. Write T for True and F for False.
The Tabulating machine was invented by American statistician Herman Hollerith.
A punched card is an input device.
Fifth generation computers use AI.
Computers require regular maintenance and updates to ensure that they function properly. Computers have emotional
E. Answer the following questions.
and empathy.
F. Apply your learning.
Sree lived a long time ago, way before computers were invented. Name some devices that he could have used for faster calculations.
Ravi found something to help him with multiplication and division. It is not a modern calculator, and it has ‘bones’. What do you think it can be?
Tanya had a digital-mechanical calculator that uses a stepped drum to represent numbers. Tell Tanya the name of the inventor of this wooden rack and what it is called.
Archi discovered that computers have a big closet where all their important data can be kept. Can you let Archi know what this closet is called?
Ram thought about a computer that could do many things at once. It is like a clever friend who can solve maths problems while also having fun playing a game. What do you call this characteristic of a computer?
It is the time of summer vacations. Riya and all her friends are visiting different places during their vacations. They are discussing their experiences over a video call. Do you know what makes them connect over a video call?
Yes! The internet. You have learnt the basics of the internet in the previous class. Now, let us learn more about the internet in this chapter.
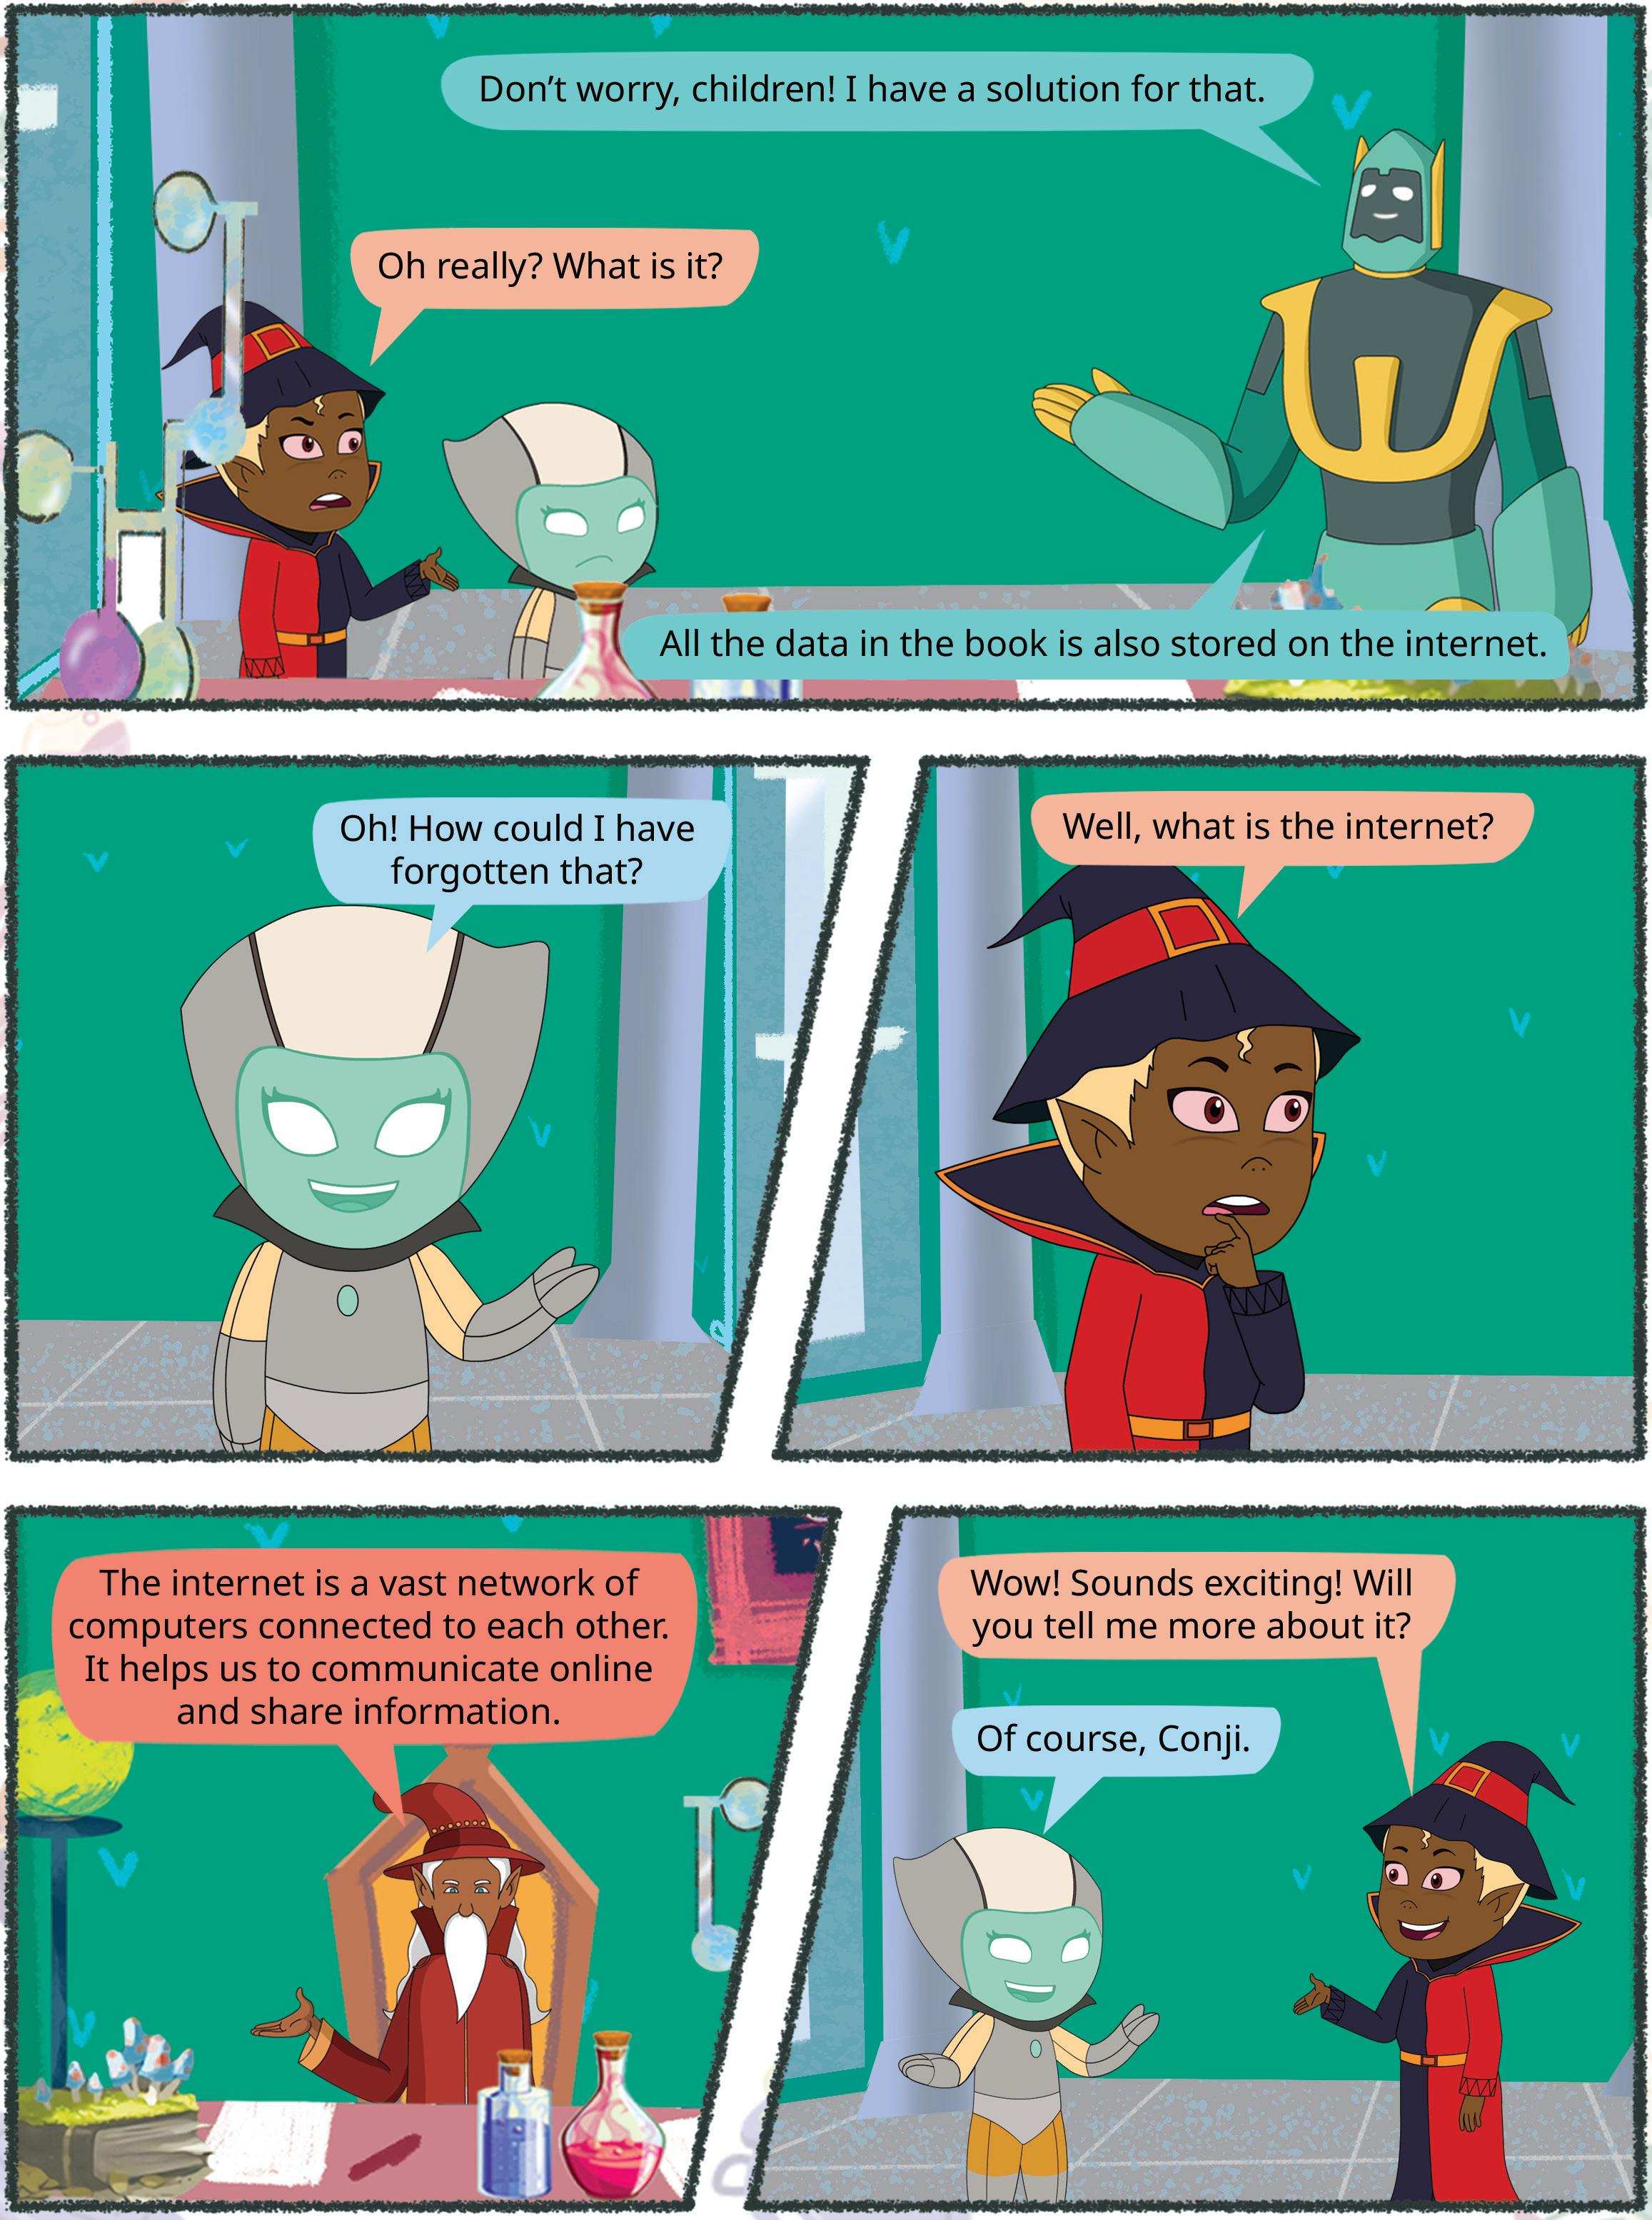
The internet is a huge network of millions of computers connected worldwide. It allows communication and the sharing of information.
The internet is now an integral part of our daily lives. We cannot imagine doing any task without using the internet. Whether it is studying, shopping, banking, or communication, we rely on the internet for various task. Let us learn about some uses of the internet.
Some of the important uses of the internet are:
1. Online shopping: You can buy toys, clothes, and many other things online, all from the comfort of your home. Apps like Amazon, Flipkart, and Myntra make it easy to buy things with just a click.

2. Cashless payment: You can use apps like Paytm, Google Pay, or credit and debit cards to pay for things online. These transactions, known as cashless payments, are becoming increasingly popular.
3. Online learning: The internet allows you to discover new information from all over the world, making it possible to learn about a wide range of topics anytime and anywhere.


4. Online communication: Using the internet, you can talk to your friends, see their pictures and videos, and share a lot of data with them. There are some applications, like Facebook, Instagram, and more, that make this possible.
5. Entertainment: The internet offers you plenty of entertainment options. You can enjoy videos, play games, and listen to your favourite songs. Additionally, you can download films, games, and music. Apps like Netflix, Hotstar, and YouTube provide access to a wide range of video content as well.
Did You Know?


The internet is so massive that no one knows exactly how many websites are on it. The first website on the internet was created in 1991 by Tim Berners-Lee.

1 Match the following.


2 Write the name of one application that helps you do the following:
a Online shopping
b Entertainment
c Online communication
There are several ways to connect to the internet. Here are some common methods:
1. Wired connection (using cables): This method uses copper or fibre-optic cables to transmit data. Wired connections are known for their reliability and speed. They are commonly used in homes and businesses where stable, high-speed internet access is required. These connections are also known as broadband connections.
2. Wireless connection (using signals): Wireless connections use radio waves to transmit data between devices and a router. This method is highly convenient, as it eliminates the need for physical cables. Wi-Fi is one of the most commonly used wireless connections.
3. Cellular connection (like a mobile phone): Cellular connections rely on mobile networks and cell towers to provide internet access. They are widely used for mobile devices such as smartphones and tablets. These devices have data limitations and varying speeds based on network coverage.
4. Satellite: Satellite internet relies on communication satellites in orbit to provide internet access, especially in remote or rural areas where other forms of internet connectivity may not be readily available. It may have a slightly longer delay compared to other methods.
5. Dial-up: Dial-up is an old and slow way to get on the internet. It worked using a regular phone line. However, it is no longer suitable for today’s internet requirements due to its slow speed. Most people now use faster internet connections, like broadband.
What are some other ways to connect to the internet?

Browsing the internet refers to using a web browser to search for and access information on the World Wide Web (WWW), which is a part of the internet.
There are many different web browsers, but some of the most common ones include Microsoft Edge, Google Chrome, Safari, Mozilla Firefox, and Opera.
Name the following.


To see how you can check your browsing history on a Wi-Fi connection, scan the given QR code.
1 An application that helps you browse the internet.
2 The type of connection that uses copper or fibre optic cables to transmit data.
3 The type of network that uses mobile networks and cell towers to provide internet access.
In the previous section, you have learnt the capabilities of the internet across various fields. A major use of the internet in today’s life style is online communication.
There are many ways using which you can communicate online. Let us explore some of these methods and applications.
Email (electronic mail) is one of the oldest and most widely used forms of online communication. It allows users to send text messages, attachments, and multimedia to one or more recipients over the internet.
Features
• It is widely used for personal and professional communication.
• Users can send files, images, and other documents.
• Examples of websites providing email services are Gmail, Outlook, Rediffmail, etc.
Messaging apps offer real-time communication through text messages, voice calls, and even video conferencing. It is also called instant messaging (IM). It is often used for quick, informal conversations.
Features
• Multiple users can participate in the same conversation using group chats.
• Users can send images, documents, and other files using IM apps.
• Some IM services also support voice and video communication.
• Popular examples of messaging apps include WhatsApp, Telegram, and Signal.
Video conferencing allows multiple participants to engage in live video and audio communication. It is widely used for virtual meetings, webinars, and online classes.
• It is used to conduct meetings with colleagues working from different locations.
• It facilitates online learning with live video interactions between teachers and students.
• Users can present their screen to other participants and record meetings as well.
• Some common video conferencing platforms are Google Meet, Microsoft Teams, and Zoom.
Social media platforms enable users to interact with other users using the same platform. They can create and share content with other users also. Social media platforms are used for personal communication, networking, and content sharing.
• Users can share text, photos, and videos to keep their network informed about their life.
• They can join groups and communities based on their interests.
• They can leave comments and participate in conversations on posts.
• Some examples of social media platforms are Facebook, Instagram, and X (formerly known as Twitter).
Blogging platforms allow users to create and maintain blogs, which are regularly updated with content such as articles, photos, and videos, such as travel blogs, restaurant blogs, and so on. Microblogging platforms enable users to share short updates.
• Users can write and publish blog posts. The authors or creators of blogs are called bloggers.
• They can add images, videos, and other media to their posts allowing for a personalised look and feel.
• Readers of blogs can leave comments on posts.
• Examples of blogging websites include WordPress and Tumblr.
Twitter, or X, can be considered both a microblogging site and a social media platform. It allows for microblogging by facilitating the creation and sharing of short posts, and it also functions as a social media platform by offering features for social interaction and community building. Did You Know?
Forums are online discussion boards where users can post messages and engage in conversations on various topics. These portals focus on specific interests or communities. They provide a platform for users to ask questions, share knowledge, and engage in discussions.
• Users seek information or advice from experts or fellow users.
• Anyone can answer questions and contribute their expertise to the community.
• Users can debate ideas and participate in ongoing conversations on various topics.
• Some examples include Reddit and Quora.
Match the communication technology with its corresponding feature.
Column A
Video Conferencing
Column B
Real-time chat
Sending and receiving messages
Instant Messaging Voice and video calls
Social Media
Writing and publishing blog posts Blogging Creating profiles and sharing updates
You have learnt in the previous section that electronic mail, or email, is used to send and receive messages over the internet. Emails are sent and received instantly, making them a much quicker alternative to traditional mail. Let us learn how to create an email account using Gmail.
Gmail is a free and popular email service offered by Google. Follow the given steps to create a Gmail account:
• Visit the link: https://accounts.google.com/
• The following screen appears:
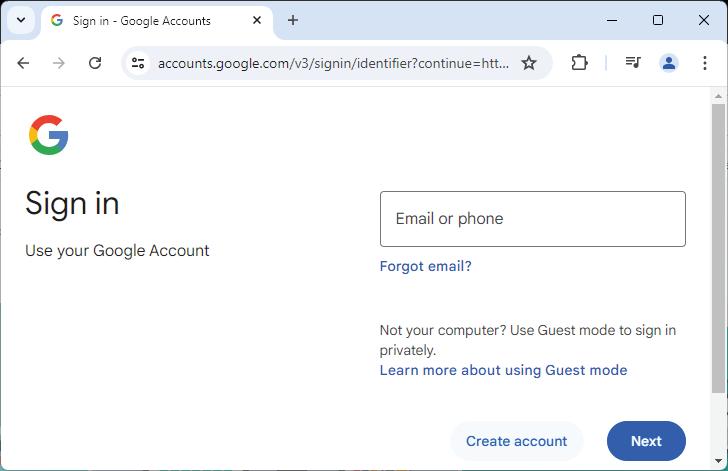
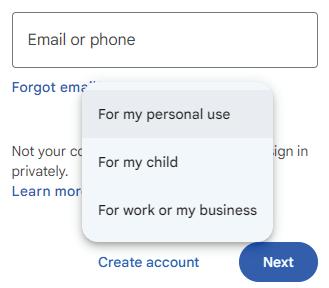
• Click on the Create account button, and select the ‘For my personal use’ option from the list of options.
• On the following screens, you need to fill in your first name and last name, your date of birth, and your gender.
• Then you will be asked to select a username for your email ID.
• Select a relevant username. If the username that you have selected is already taken, then you can either select from the alternatives shown by Google or create your own.
• After that, you will be asked to create a strong password. Be sure to create a password by using a mix of letters, numbers, and symbols.
• Now, you will be asked to provide your phone number. You can enter your parents’ mobile number to receive a verification code.
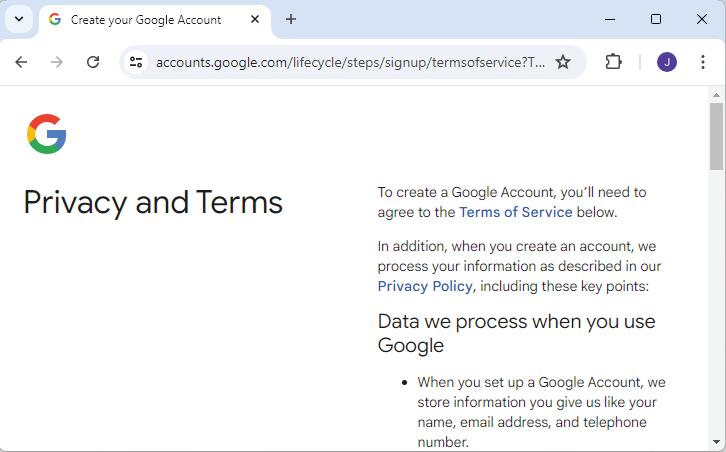
• Enter the verification code to view Gmail’s ‘Privacy and Terms’. Scroll down the page to read the terms and conditions.
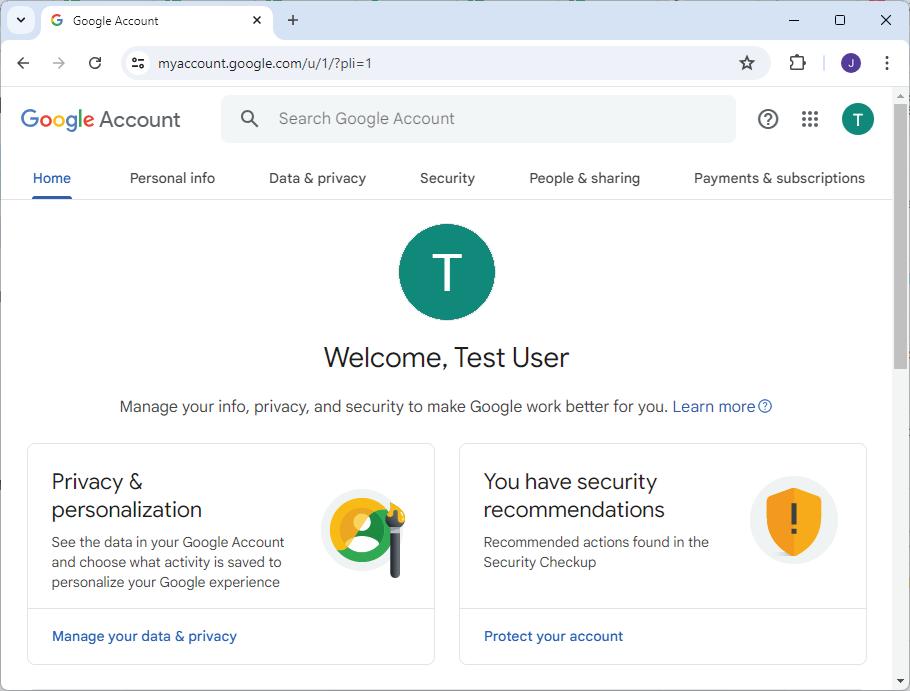
• After reading the terms and conditions, click on the I agree button. Your Google account will be created and the home page will open.
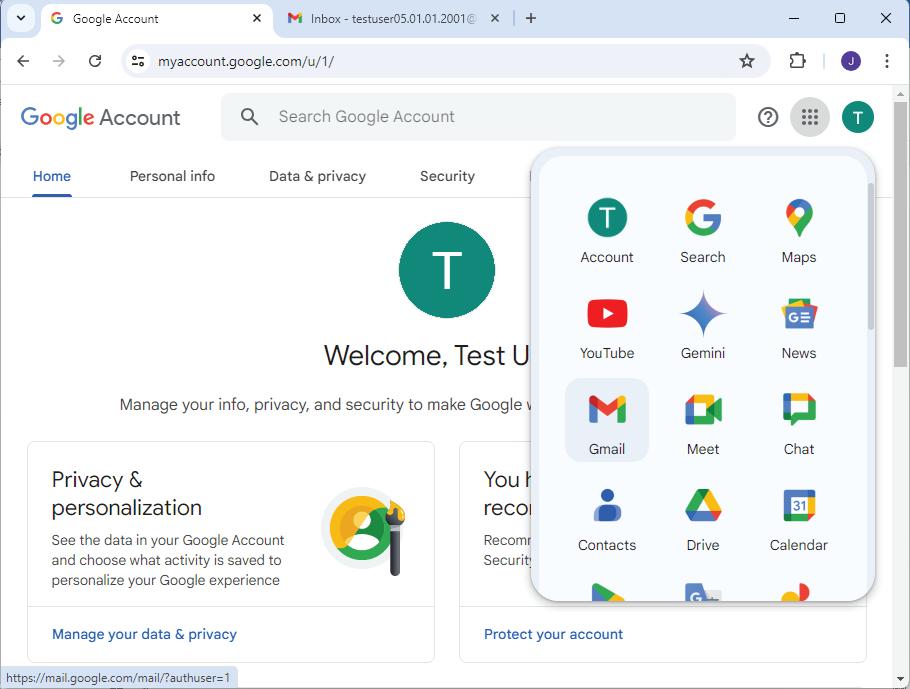
• Now, click on the Google Apps icon present on the top right-hand corner of the screen (represented by nine dots) and select the Gmail option.
• Your Gmail Inbox will open. All the messages received are displayed in the inbox of the Gmail account.
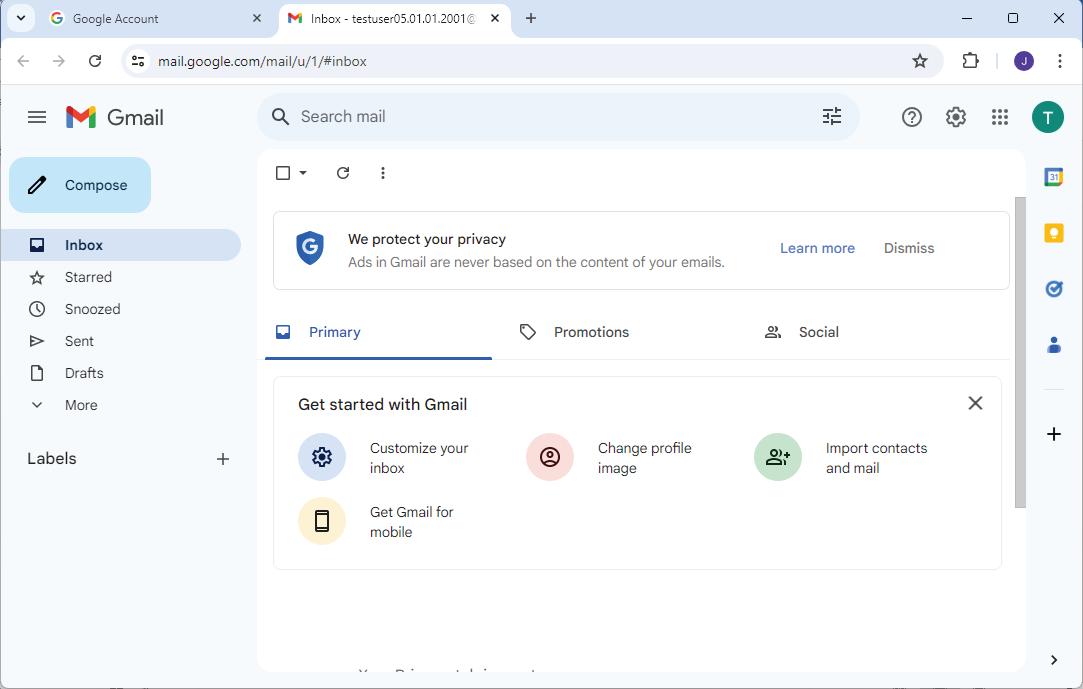
• Now, you can use your Gmail account to send or receive emails.
To send an email:
• Click on the Compose button present in the left-hand panel of your Gmail interface.
• The New Message window opens.
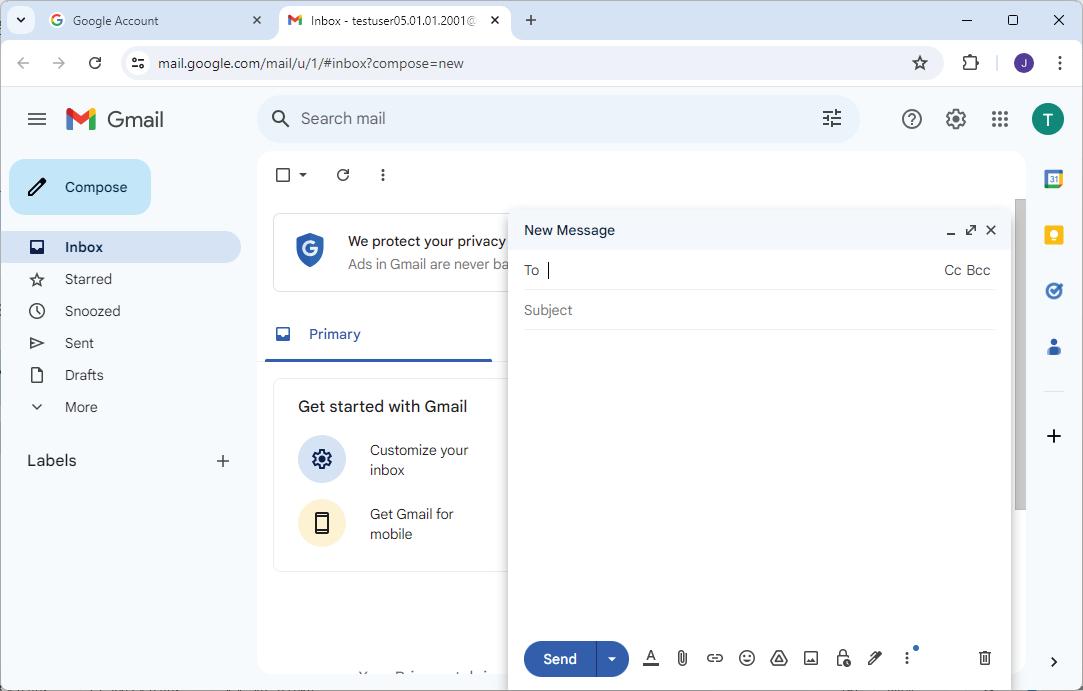
• Let us understand the various components of the New Message window before writing a message.
To: This field is where you enter the email address of the person you want to send the email to. That person is referred to as the recipient of the email.
Subject: To let the recipient know about the subject of your email, you need to provide a brief description of the email’s topic.
Cc: The full form of Cc is Carbon Copy. If you want to send the same email to another person, then you can click on the Cc option and enter the email ID of the other person. In this case, all the recipients can see to whom you have sent the same message.
Bcc: Bcc stands for Blind Carbon Copy. It allows you to send the same message to multiple people without revealing their email addresses to each other. In this case, every recipient will get the message but will not be able to know who the other recipient of the same message are.
Message area: This is where you type your message.
Send: After typing your message, click on the Send button. Make sure to check the Cc, Bcc, and Subject fields once again before sending the message.
Attachment: If you want to send a file (image, text, or any document type) along with your message, then you can click on the Attachment icon, represented by a paper clip, and select the relevant file to be sent.

Netiquette, shortform for Internet etiquette, refers to a set of guidelines and rules for polite and respectful behaviour when communicating online. Practising good netiquette is essential for a positive and productive online environment.
Here are some important netiquette principles for the internet users:
1. Be kind and respectful: Treat others on the internet the way you want to be treated. Don’t say bad things or be a bully.
2. Use good language: Don’t use bad words or rude language when you are chatting or leaving comments. Use words that are nice and friendly.
3. Do not share personal information: Never give out your full name, address, phone number, or other private details online. Keep your personal information safe.
4. Be careful with what you post: Think before you post pictures, videos, or messages. Make sure they are safe and don’t hurt anyone’s feelings.
5. Respect other people’s privacy: Do not go through someone’s personal content or spill others’ secrets.
6. Be careful while using emojis: Emojis are a fun and expressive way to communicate, but it is important to use them carefully and considerately. Emojis may be more appropriate in casual conversations with friends than in formal business emails.
7. Do not spam: Spamming means sending the same message over and over again. It is annoying. Hence, do not do it.
8. Do not shout: Writing in all capital letters is like shouting when talking to someone online. Use lowercase letters most of the time.
Do It Yourself 2D
Give a term for the following:
1 A person to whom the email is sent.
2 An option used to send the same email to multiple email ids.
3 A set of guidelines to know how to behave online.
4 Process of sending the same message over and over again.
1 The internet connects millions of computers worldwide and allows communication and information sharing.
2 The internet is used for online shopping, cashless payments, online learning, communication, and entertainment.
3 Common methods to connect to the internet include wired, wireless, cellular, satellite, and dial-up connections.
4 Web browsers like Google Chrome, Safari, and Firefox help you access information on the World Wide Web.
5 Email, messaging apps, video conferencing, social media, blogging, and online forums are popular methods of communicating online.
6 Polite and respectful behaviour online includes being kind, using good language, protecting personal information, and not spamming.
A. Fill in the blanks.
1 The internet connects millions of worldwide.
2 You can use to buy toys, clothes, and many other things online.
3 allows you to send text messages and multimedia to one or more recipients over the internet.
4 is a wireless connection method that uses radio waves.
5 is a set of guidelines for polite behaviour online.
B. Select () the correct option.
1 Which app is used for online learning?
a Amazon b Paytm
c Google Classroom d Netflix
2 Which type of internet connection uses cell towers? a Wired b Cellular
c Satellite d Dial-up
3 What does the Bcc field in an email stand for?
a Blind Carbon Copy
c Broad Carbon Copy
4 Which app is known for video streaming?
b Blind Customer Copy
d Basic Customer Copy
a Paytm b Flipkart
c Netflix
5 What is the main purpose of using a web browser?
a To send emails
c To play games
C. Who am I?
1 I am a service that allows you to buy things online.
d Telegram
b To browse the internet
d To make video calls
2 I am a field in an email where recipients cannot see each other’s addresses.
3 I am a wireless connection method using radio waves.
4 I am a platform for sharing short updates.
5 I am a set of guidelines for polite online behaviour.
D. Write T for True and F for False.
1 Wi-Fi uses cables to transmit data.
2 Gmail is a free email service provided by Google.
3 Messaging apps can only send text messages.
4 Spamming means sending the same message over and over again.
5 Writing in all capital letters is considered polite online behaviour.
E. Answer the following questions.
1 What is the internet?
2 Name two popular apps for online shopping.
3 What is the difference between Cc and Bcc in an email?
4 Name two popular video conferencing apps.
5 Why is netiquette important?
F. Apply your learning.
1 You want to send a picture to your friend using email. Which feature will you use?
2 Raima needs to attend an online class with live video interaction. Which method will she use?
3 Sneha’s friend sent her an email but also copied another person in it. Which email field shows this information?
4 Shailja wants to post a picture and share it with her friends online. Which platform can she use?
5 Lovey wants to ask a question and get advice from other internet users. Which platform should she use?

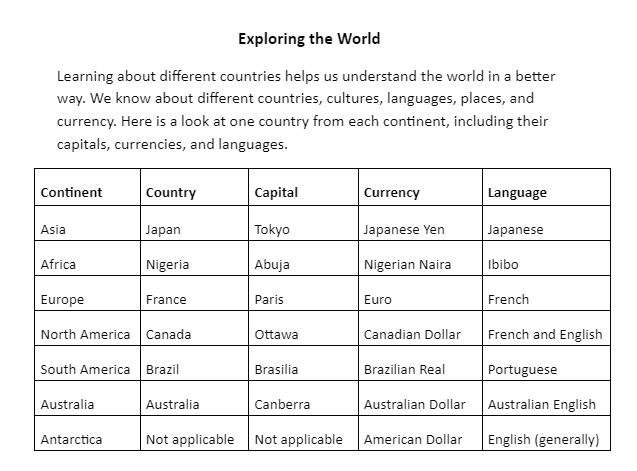
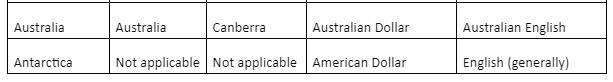
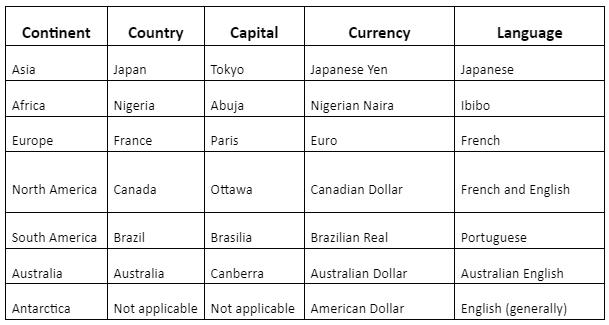
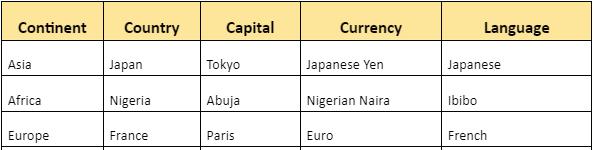
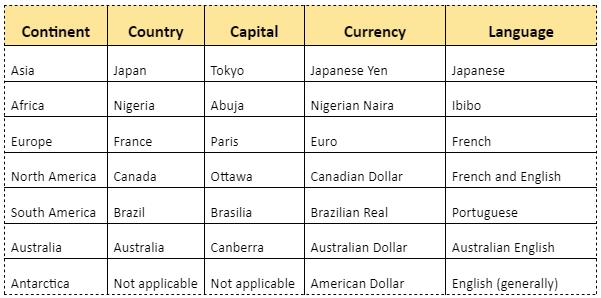
Imagine you are working on a social science project where you need to gather some data for different countries all around the world.
You need to collect data about which continent the country belongs to, what the capital of the country is, and which currency is used there.
After collecting the data, you can put this data in a table to represent it in a better way.
Let us create a table in Google Docs to record these values.
Google Docs allows users to create and edit documents online while collaborating with other users in real time.
Table: A table is a structured set of data arranged in rows and columns.
Row: A row is a horizontal line of data in a table.
Column: A column is a vertical line of data in a table.
Cell: A cell is the intersection of a row and a column in a table.
Steps to create a table:
1. Open Google Docs.
2. Click on the big plus sign (+) or Blank option to create a new document.
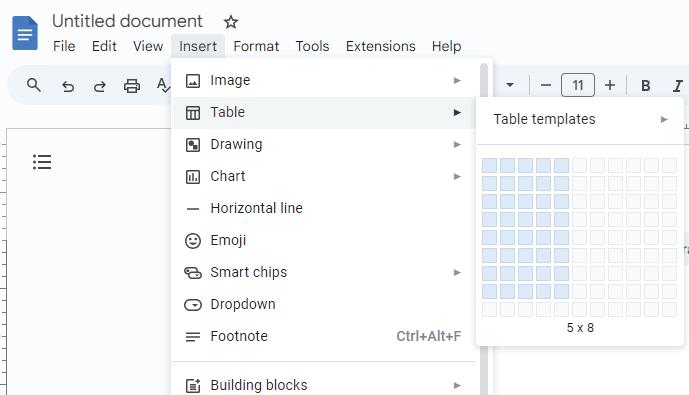
3. Click on the Insert menu from the menu bar.
4. Select the Table option from the drop-down list that appears.
5. Select the number of rows and columns from the Table templates grid. Here, we are creating a table with 5 columns and 8 rows.
Your table is created in the document.
Google Docs tables are great for creating organised lists with checkboxes, making to-do lists, and so on.
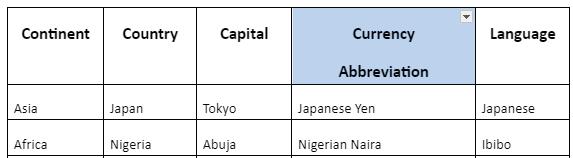
To enter data in a table, follow these steps:
1. Click on the first cell in the table.
2. Start typing the names of the columns, like Continent, Country, Capital, Currency, and Language.
3. Use Tab key to move to the next cell in the table and Shift + Tab to move to the previous cell.
4. In the second row, write the time of the continent under the Continent column, name of the country under the Country column, and so on.
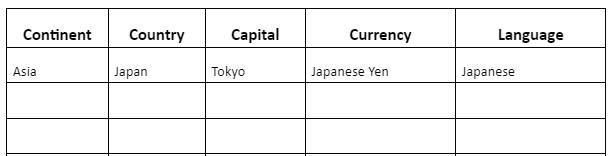
Similarly, enter the details of other continents and the countries.
Editing a table means making some modifications to the table structure or changing the data in it. If you want to update some information, you can edit the table by following the steps given below:
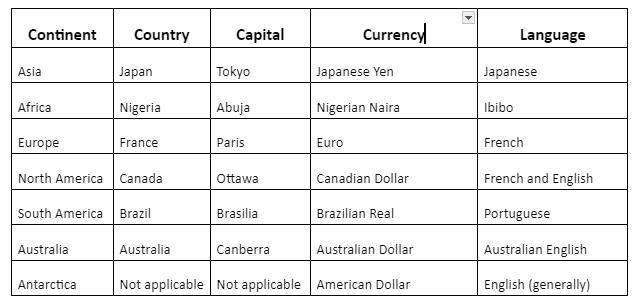
1. For example, if you want to change the currency of Antarctica to the American Dollar, you can locate the cell under the Currency column in the corresponding row.
2. Locate the cell, then click on it to edit the currency as necessary.
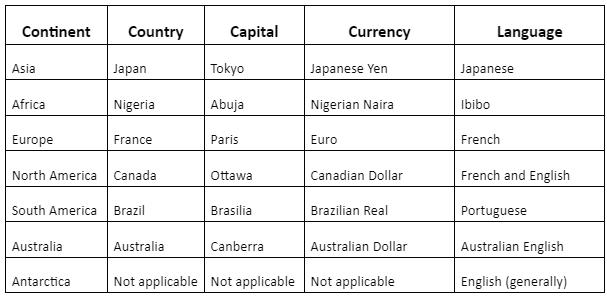
Currently, the currency cell for Antarctica is labelled as ‘Not Applicable’. You can change it to ‘American Dollar’.
Just like you can add comments on the text in Google Docs, you can also add comments on the cells in a table.
1 Plan your birthday party games! Create a table with two columns (Game Name and Players Needed) and list three games you want to play with the number of players for each game.
2 Answer the following questions.
a Write the shortcut key to move to the next cell in a table.
b Write the shortcut key to move to the previous cell in a table.
When you write something on a computer or on paper, you can change the way it looks to make it easier or more interesting to read.
Formatting means to change the overall appearance of a table.
To make your table look even better, you can change the height of the rows to make things easier to read and more organised.
A row is a horizontal line of data in a table.
Row height is the vertical distance between the top and bottom borders of a row in a table.
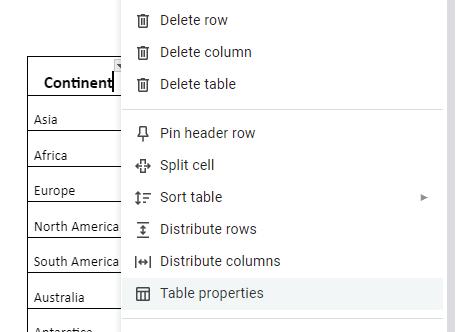
To change the height of rows, follow the steps given below:
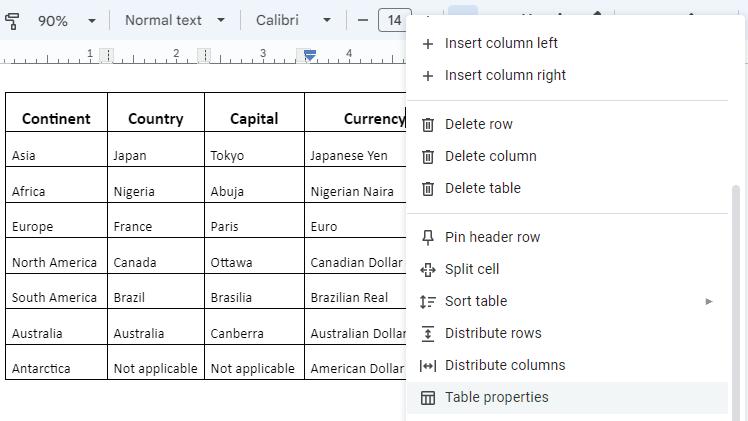
1. Right-click in the row that you want to make taller or shorter. A context menu will appear.
2. Select the Table properties option.
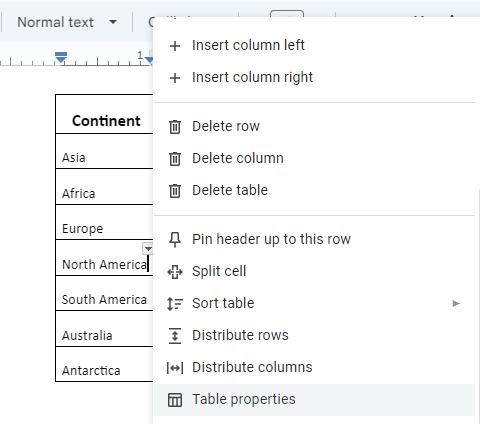
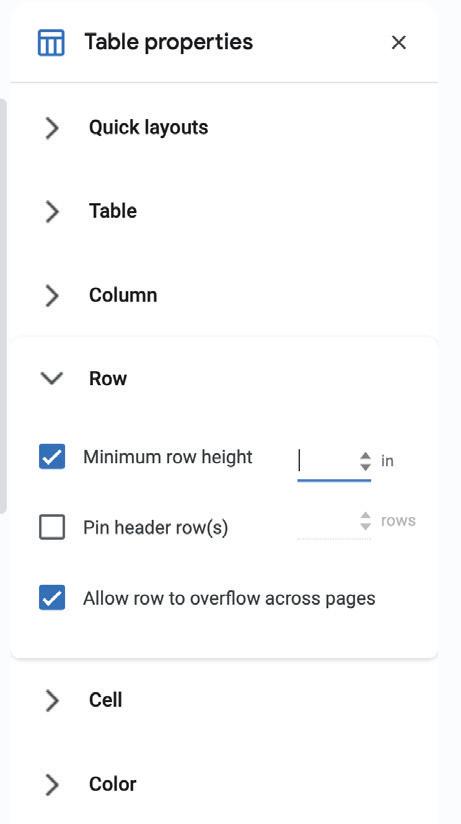
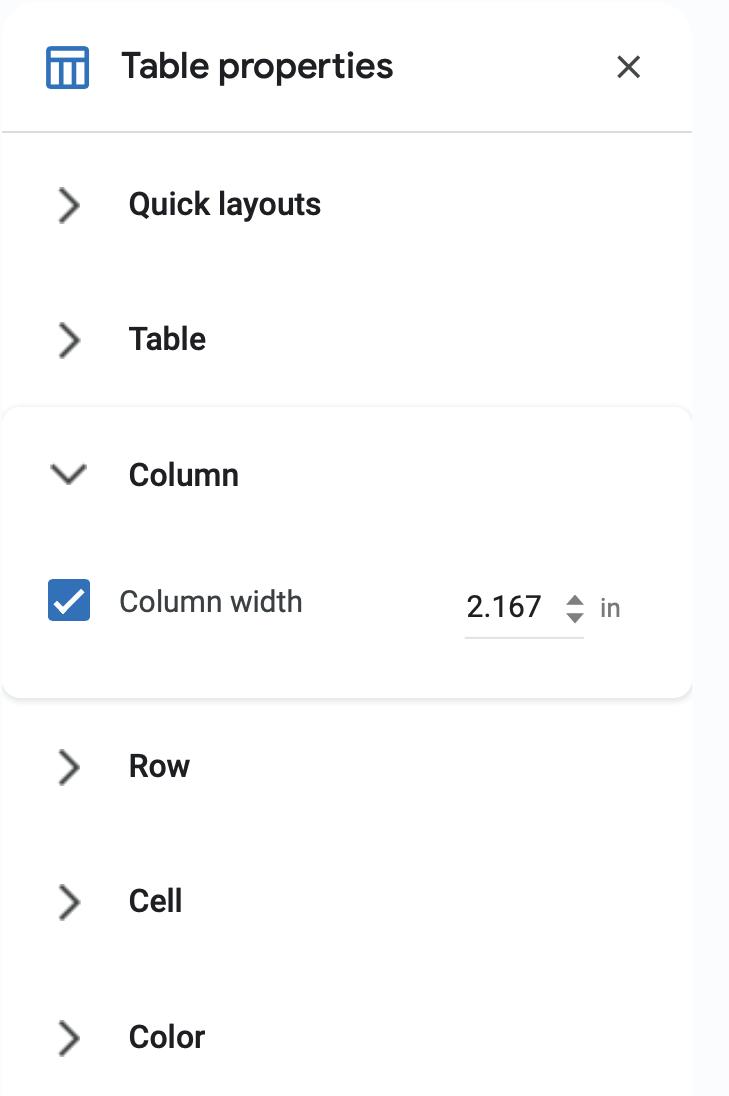
3. In the Table properties pane, click on the Row category.
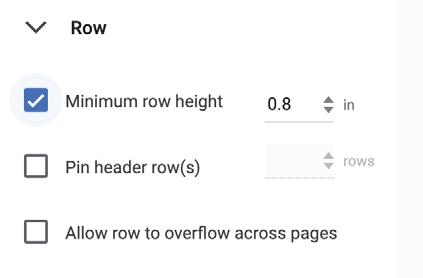
4. Select the Minimum row height check box.
5. Adjust the row height value to change the row’s height. The row height will be changed as shown in the image.
You can also open the Table properties pane by selecting the Format → Table → Table properties option from the menu bar.
You can sort data in Google Docs tables by selecting a column and using the ascending (A to Z) or descending (Z to A) sorting options in the toolbar. Did You Know?
A column is a vertical arrangement of cells or boxes that run from top to bottom.
Column width is the horizontal distance between the left and right borders of a column in a table.
The column width can be changed using the following steps:
1. Right-click on the column that you want to make wider or narrower.
2. Select the Table properties option from the context menu that appears.
3. In the Table properties pane, click on the Column category.
4. Adjust the column width value to make the column wider or narrower.
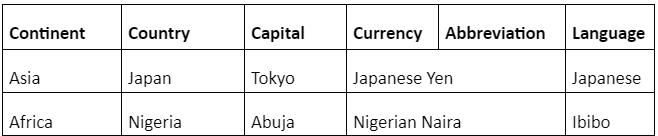
Splitting cells in a table can help you separate and categorise information in a clear and structured way.
For example, you can split up the Currency column into two cells, one cell to contain the name of the currency and the other cell to contain the abbreviation used for it.
Steps to split cells are as follows:
1. Right-click on the cell that you want to split into smaller parts.
2. A context menu will appear.
3. Select the Split cell option.
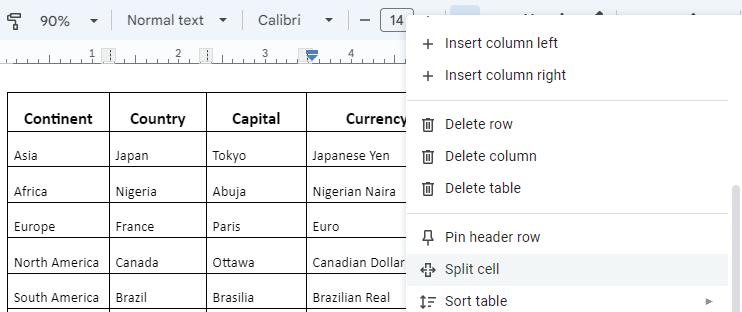
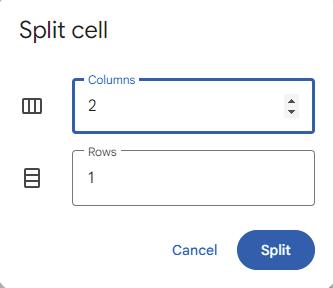
4. The Split cell dialog box will appear, asking you to specify how many rows and columns you want to divide the cell into. Enter the number of rows and columns based on how you want to organise your information.
5. Click on the Split button to confirm your choices and split the selected cell. The cell will be divided into smaller cells based on your specifications.
6. Type the
Merging cells in a table can help you combine information and create headings, improving the clarity and organisation of the table.
Merging cells is combining two or more cells in a table to create a single, larger cell.
Steps to merge the cells are as follows:
1. To merge cells, first select the cells you want to combine. You can do this by clicking and dragging over the cells.
2. Once the cells are selected, right-click on them.
3. In the menu that pops up, click on the Merge cells option.
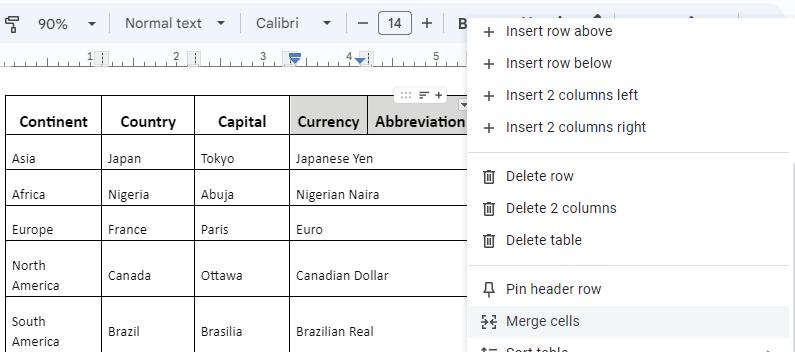
4. The selected cells will become one big cell. When two cells are merged, the text written in both cells is also merged. You can change the text according to your requirement. 3
After creating a table, you can add more rows and columns to it by following the steps:
1. Right-click in the cell where you want to add a row/column. The context menu that appears allows you to add a column to the left or right of the selected cell. Similarly, it also has options to add a row above or below the selected cell.
2. Select the Insert row below option.
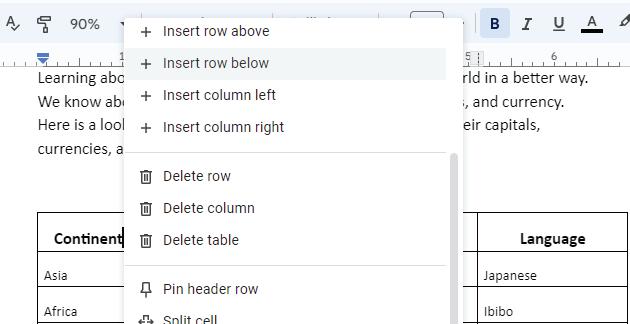
A row will be inserted. Similarly, you can add a column by selecting the Insert column left/Insert column right option.
Sometimes, you may need to delete a row/column from a table. You can delete a row/ column from a table by following the given steps:
1. Select the row/column you want to delete and right-click on it.
2. Select the Delete row option.
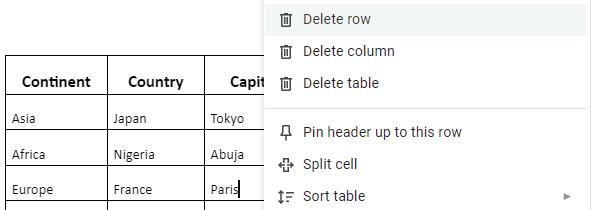
Similarly, you can delete a column.
Applying borders and shading to a table in Google Docs can enhance its visual appeal and make it stand out.
Borders: It is a dark outline around any text or picture that makes it look a little standout.
Shading: It means to set the background colour of a cell.
Follow the steps below to apply border and shading to a table:
1. Right-click on any cell of your table.
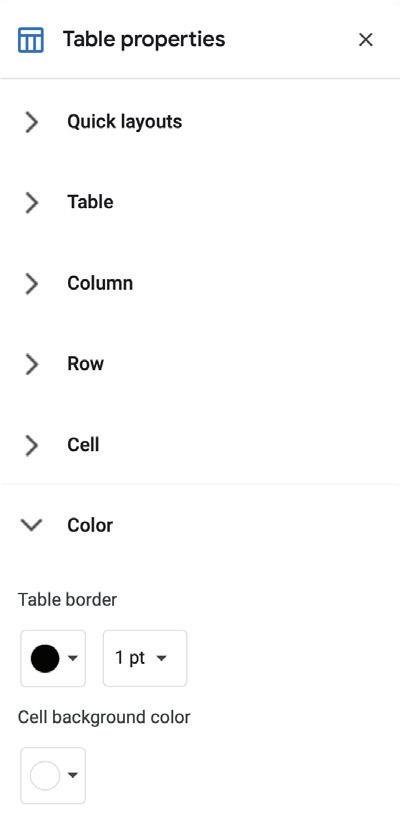
2. Select the Table properties option.
3. The Table properties pane will appear. Click on the Color category. You will see a Table border option.
4. Here, you can select the colour and thickness for the table border.
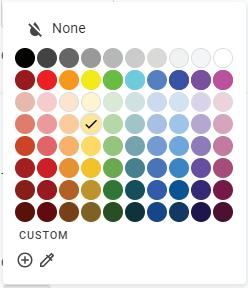
5. You can also set a background colour of cell by using the Cell background color option.
6. Click on a desired colour from the palette. Apply the same colour to the other cells also. You can see that the colour of the table heading background has now changed.
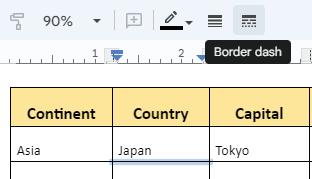
Let us learn how you can change the type of a border:
1. Select the border that you want to change by clicking on it.
2. Click on the Border dash from the Toolbar. A list of different types of borders will appear.
3. Select the type of border which you want to apply.
The selected border will be changed. Similarly, you can change the border of whole table.
1 What is the difference between merging cells and splitting cells in a table?
Merging Cells
Splitting Cells

2 What are borders in a table? How are they useful?
1 A table in Google Docs is a grid made up of rows and columns.
2 You can enter data in a table by clicking on a cell and typing the information.
3 Editing a table involves clicking on cells to make changes, such as modifying text or data.
4 You can change the appearance of a table by adjusting row heights, column widths, and adding borders.
5 Splitting cells allows you to divide a cell into smaller parts for better organisation.
6 Merging cells combines multiple selected cells into one large cell.
7 Border and shading can be applied to tables to enhance their visual appeal.
A. Fill in the blanks.
Hints rows columns grid vertical adjacent
1 A table in Google Docs is like a made up of rows and columns.
2 To create a table, select Insert → Table option and select the number of and you need.
3 Row height is the distance between the top and bottom borders of a row in a table.
4 Merging cells combines cells into one large cell.
B. Tick () the correct option.
1 How do you start creating a table in Google Docs?
a Open a new email.
b Click on the Insert menu.
c Open Google Docs and click on the plus sign (+) or Blank.
d Open a new browser tab.
2 What does splitting cells mean in the context of a table?
a Combining two or more cells into one larger cell.
b Changing the font size of the text inside the cells.
c Dividing a cell into smaller parts.
d Adding a background colour to cells.
3 What is the purpose of adding borders to the cells of a table?
a To make the table look bigger.
b To make the text bold.
c To make the table visually appealing and stand out.
d To change the font style.
4 How can you change the row height in a table to make it easier to read?
a By clicking on the table border.
b By changing the background colour.
c By adjusting the row height value in the Table properties pane.
d None of these
C. Who am I?
1 I am the menu in Google Docs that is used to change the table properties.
2 I am a vertical arrangement of cells or boxes that run from top to bottom.
3 I am the horizontal distance between the left and right borders of a column in a table.
4 I am like a dark outline around any text or picture that makes it look a little standout.
D. Write T for True and F for False.
1 The intersection of a row and a column is called a table.
2 Moving from one cell to another can be done using the Ctrl key on your keyboard.
3 Merging cells combines multiple selected cells into one large cell.
4 You can’t change the appearance of a table by adding borders or shading.
E. Answer the following questions.
1 What is a cell in a table?
2 What is the difference between rows and columns?
3 Write the two methods to open the Table properties pane.
4 Which option is used to change the type of border of a table?
F. Apply your learning.
1 You receive an allowance of ₹1000. Create a table with two columns, one for how much money you will spend and one for how much you will save, and explain your choices.
2 You have Maths, Science and History homework. Create the table with three columns, one for each subject, and mark which one you will start with and why.
3 Create a table with two columns, one for destination ideas for a trip you want to go on with your family, and one for the activities you’d like to do on the trip.
4 Imagine you have three breakfast options: cereal, toast, and fruit. Create a table with two columns, one for the breakfast item and the other for nutrient in each food item.
5 Leena has a table listing various tasks for a project. She realises that some cells contain related subtasks that need to be grouped together. Which feature of Google Docs should she use to create a cleaner layout?
When you share an idea or a thought with an audience, a visual representation—with pictures, words, videos, and sound—makes this task much easier. This helps to get the message across to the audience. It also helps the audience to visualise the idea and makes them interested in what you’re saying.


A presentation is a way to share information, ideas, or stories using a combination of pictures, text, and sometimes even audio or video.

How do you think presentations could help your teacher during a class?

We can create presentations on different applications like PowerPoint, Canva, Google Slides, etc. In this chapter, we will learn to create beautiful presentations on Google Slides. Google Slides is one of Google’s apps that is used to create presentations online.
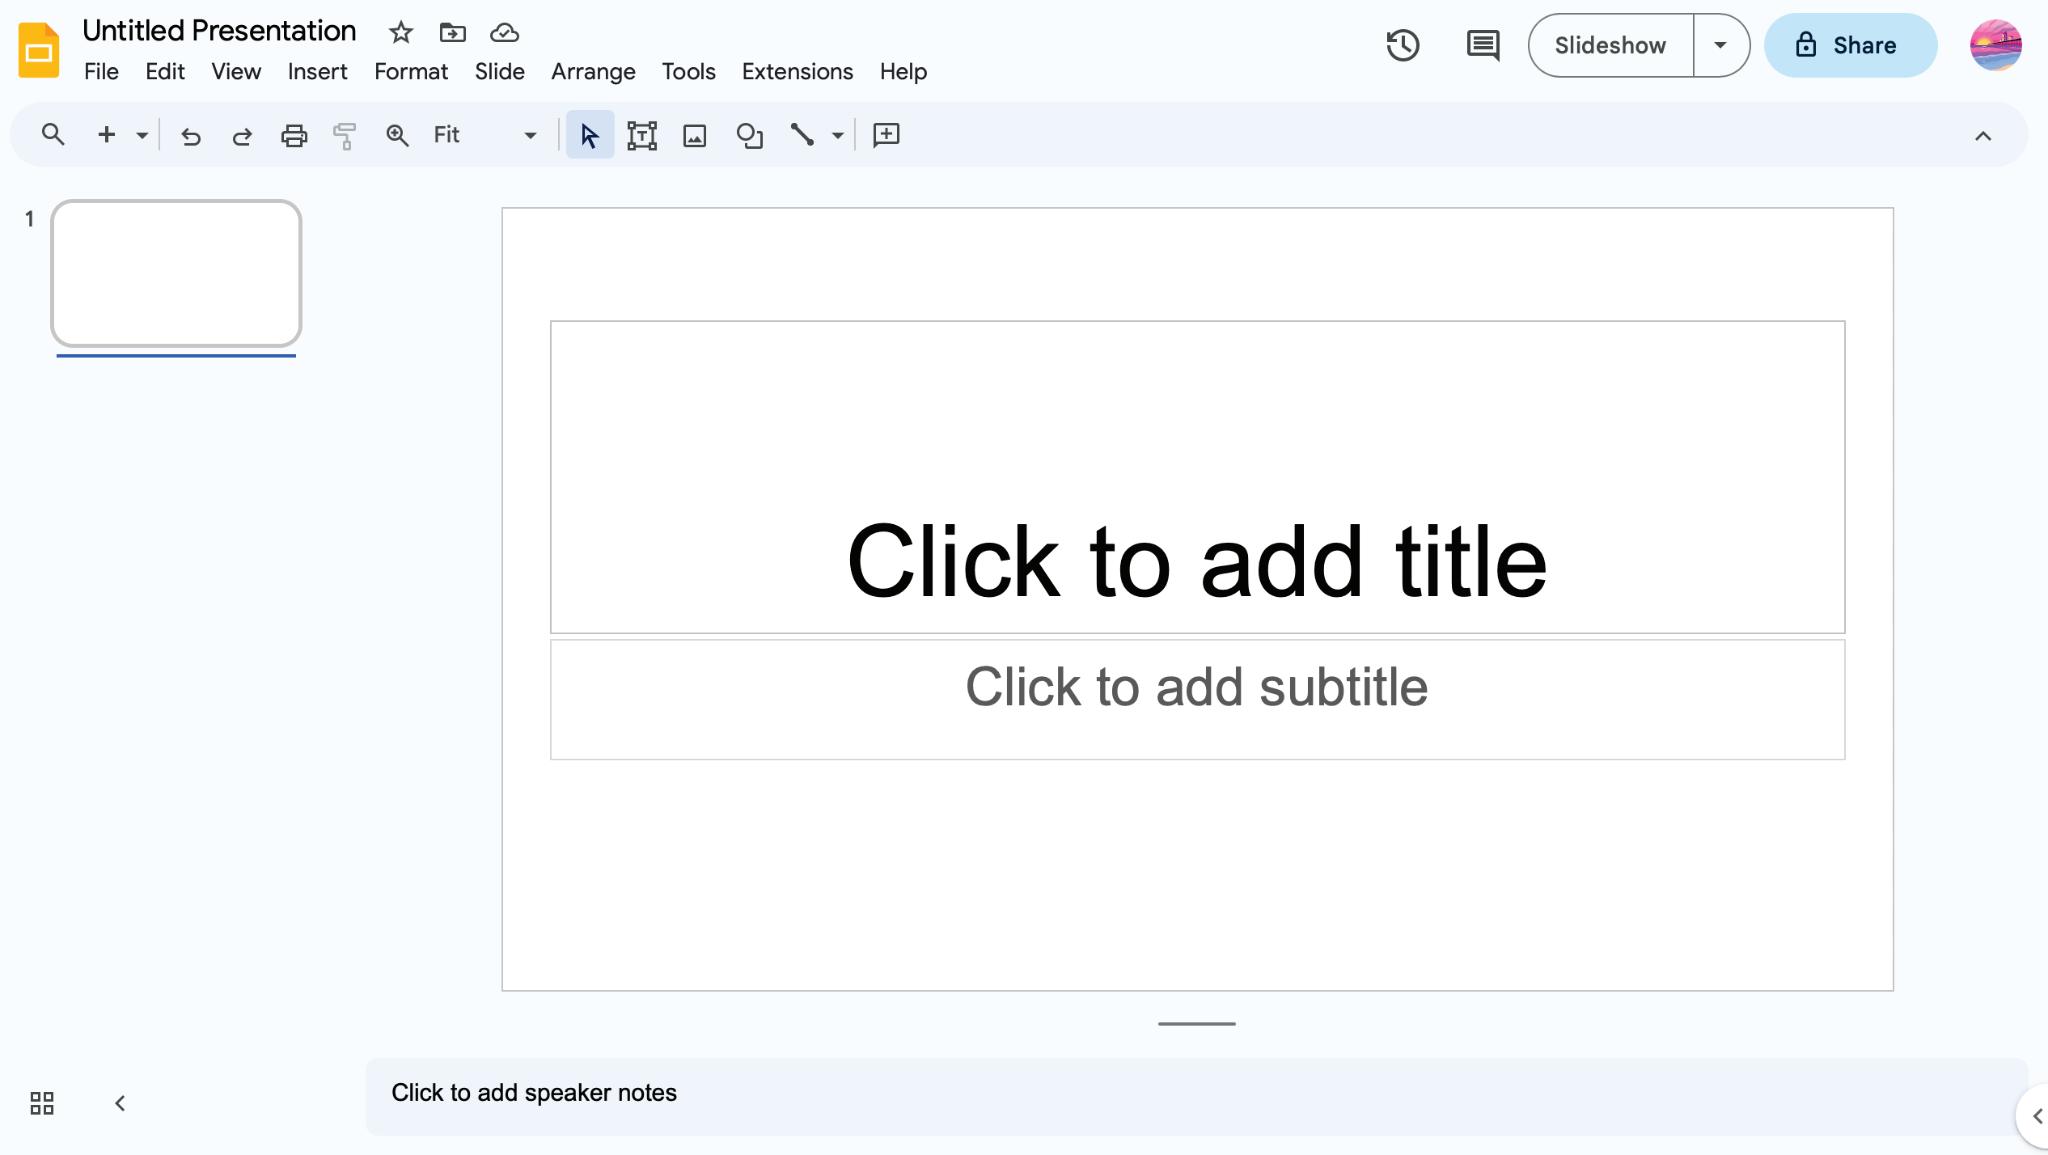
Let us learn how to create a new presentation on Google Slides:
1. Open the Google Chrome browser and go to the link: https://docs.google.com/presentation/
2. Click on the plus + sign to open a blank presentation.
Now, let us learn about the different parts of the presentation window.

1. Presentation Title It shows the name of a presentation.
2. Menu Bar It contains various menus like File, Edit, View, etc. Each menu offers different options.
3. Toolbar It contains tools for quick and easy access.
4. Slide Workspace It is the area where you add items such as text, images, and videos for a slide.
5. Slide Navigation Pane It is space where you can see thumbnails or miniature images of all the slides of your presentation.
6. Speaker Notes It is the area where you can add notes for the speaker to remember important points during the presentation.
7. Slideshow Button It turns the slides into the presenter view to showcase the slides in full-screen mode.
Did You Know?
Ancient Egyptians used papyrus scrolls to record information in the same way we use digital documents and presentations nowadays.
Now, let us learn how to choose themes that suit our presentation. Let us also learn to use various layouts to organise our slides.
Themes are special designs for your slides. They make the presentation look colourful and interesting.
When you start making a presentation in Google Slides, you can choose different themes.

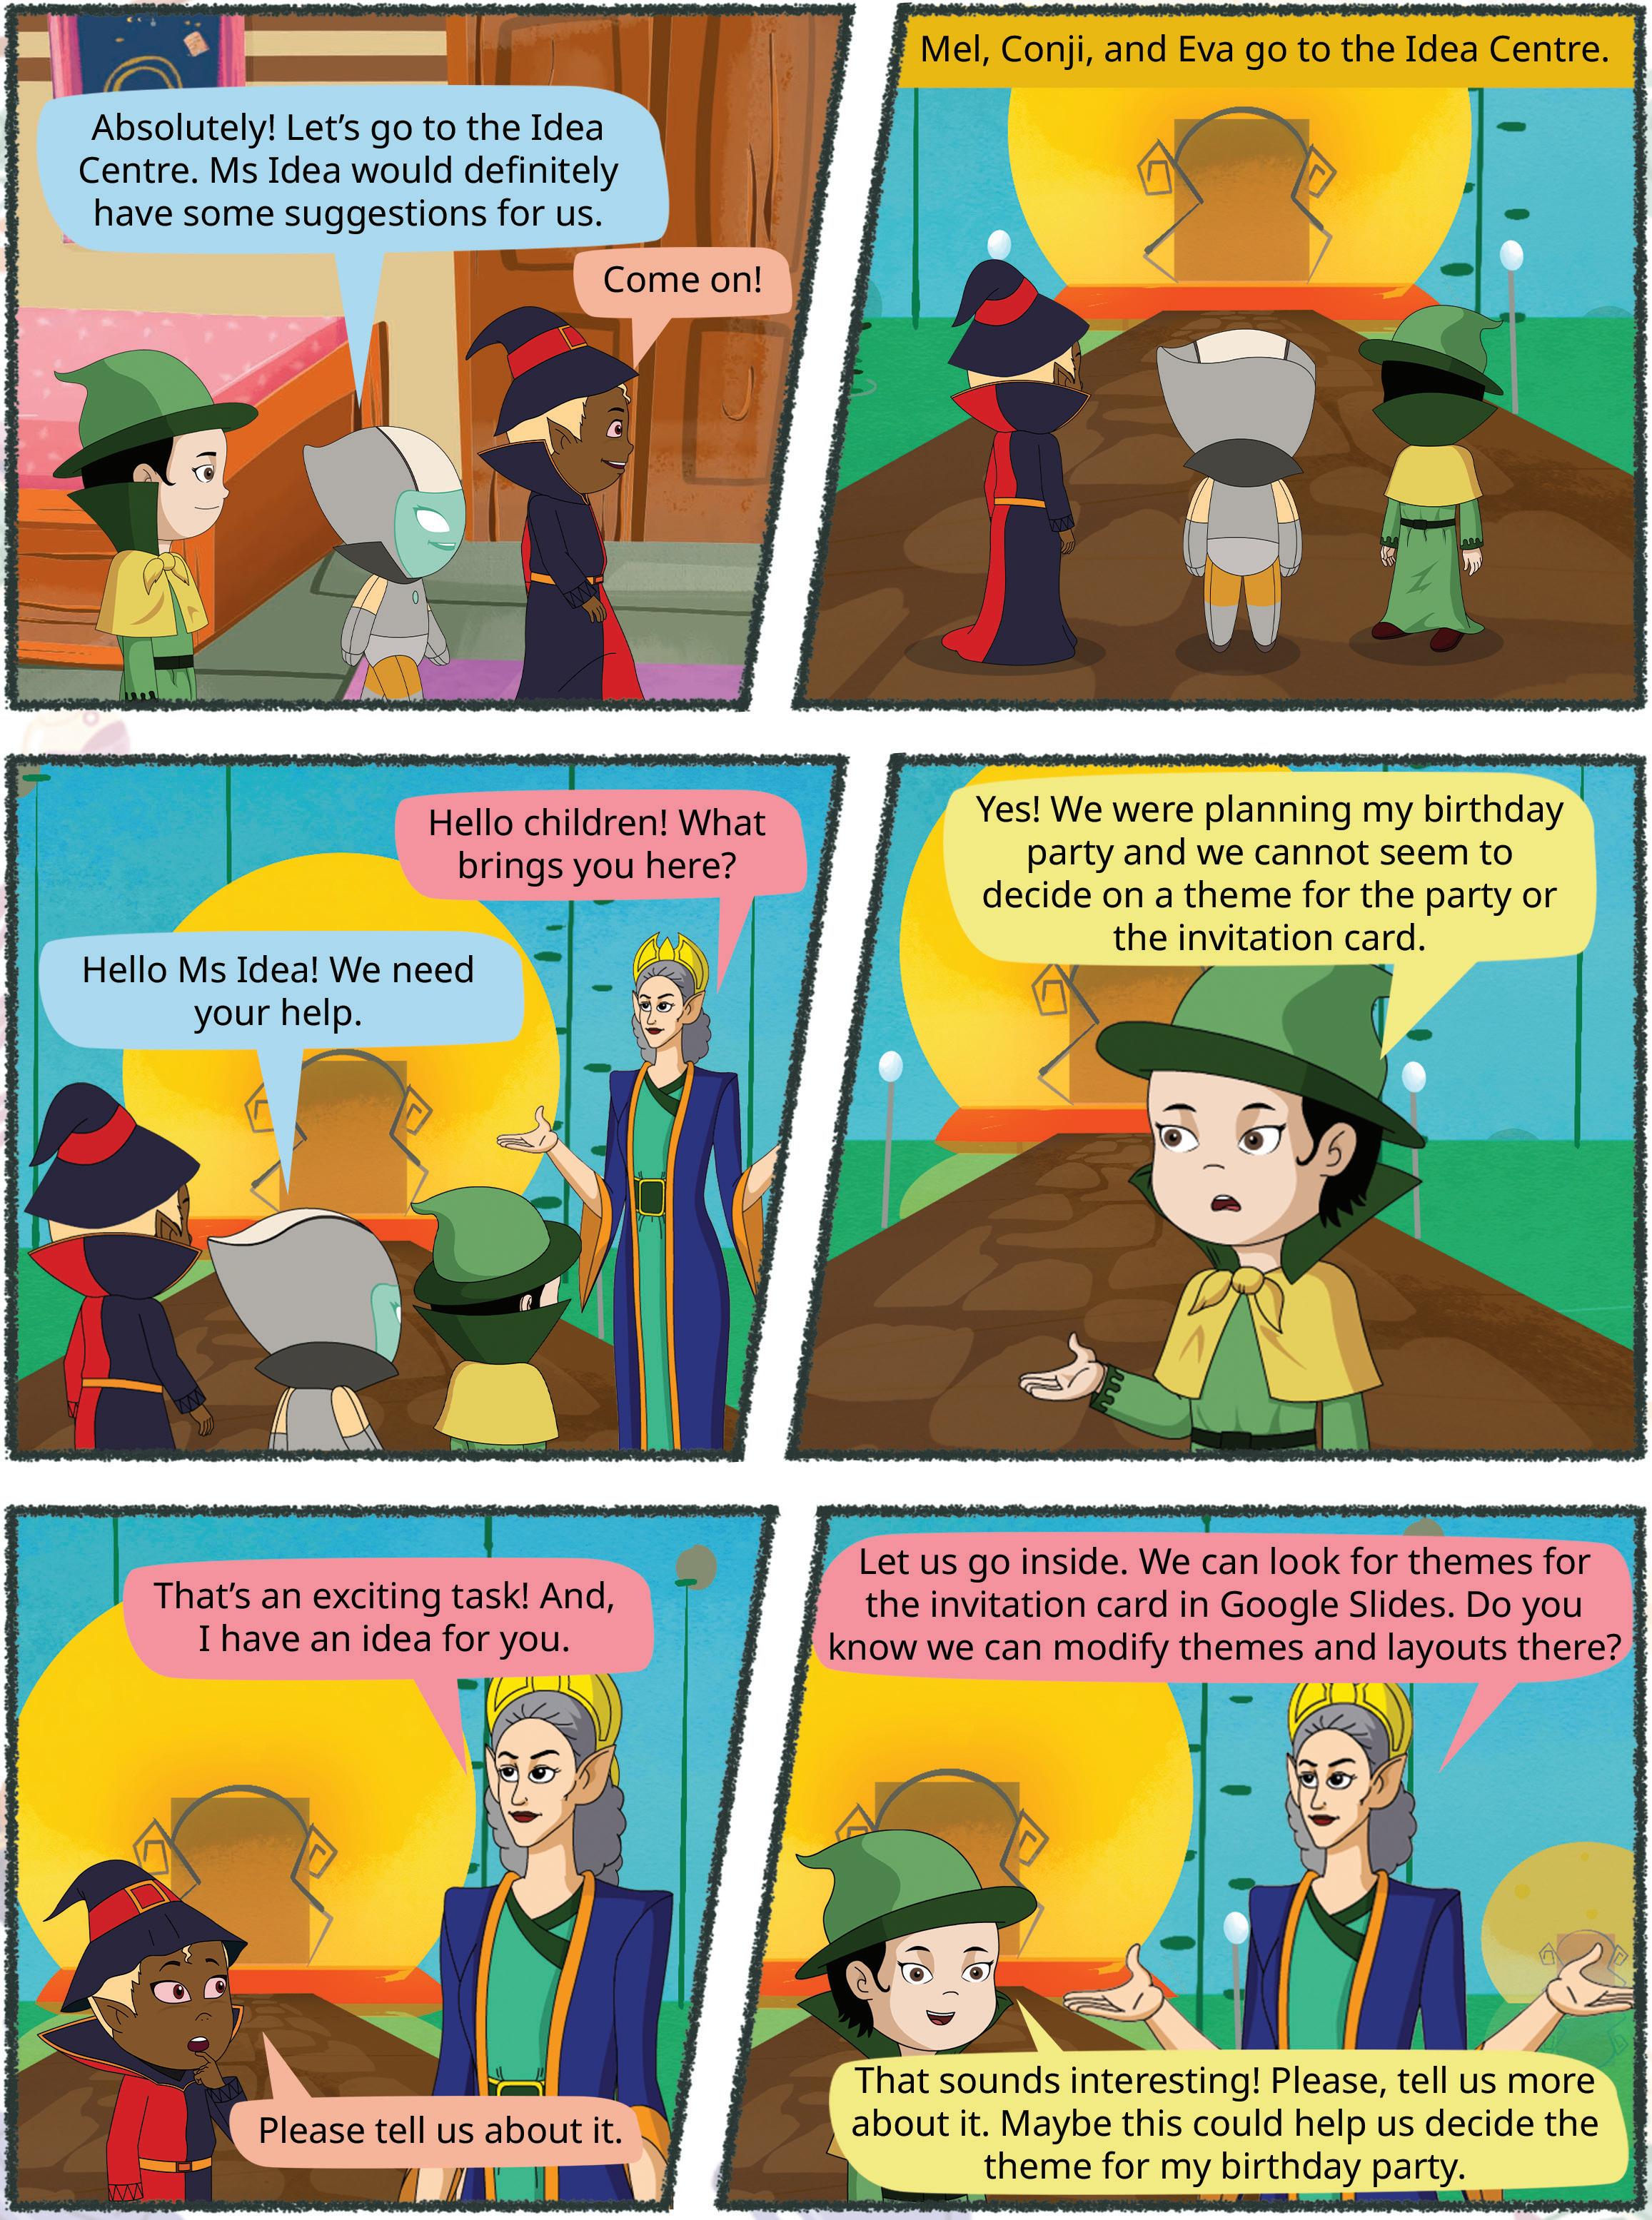
Imagine you’re creating a presentation about A Journey Through India’s Diverse States. To apply themes to this presentation, open Google Slides and follow the given steps:
1. Click on the Rename box in the newly created presentation.
2. Enter the title A Journey Through India’s Diverse States in the Rename box.
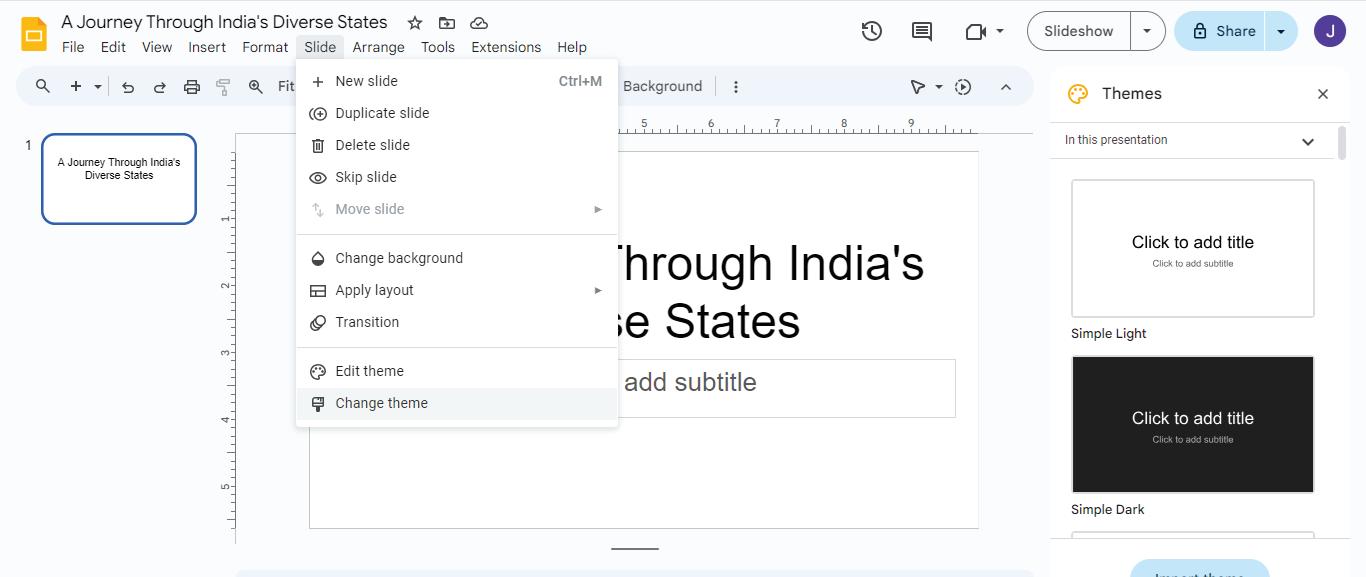
3. Click on the Slide menu in menu bar.
4. Select the Change theme option. The Themes pane will open on the right-hand side. It will contain different themes that are available.
5. Check out different themes for your slide and click on a theme of your choice. The selected theme will be applied to all the slides.

Sometimes, we might like a theme but we still want to make certain changes in it. To do that, we can use different colours, fonts, effects, and background styles.
Modifying themes in a presentation is important because it allows you to make the presentation look exactly the way you want it to.
To add new colours to the background of your slides:
1. Select the slide in the Slide Navigation Pane.
2. Click on the Slide menu in the menu bar.
3. Select the Change background option from the drop-down menu.
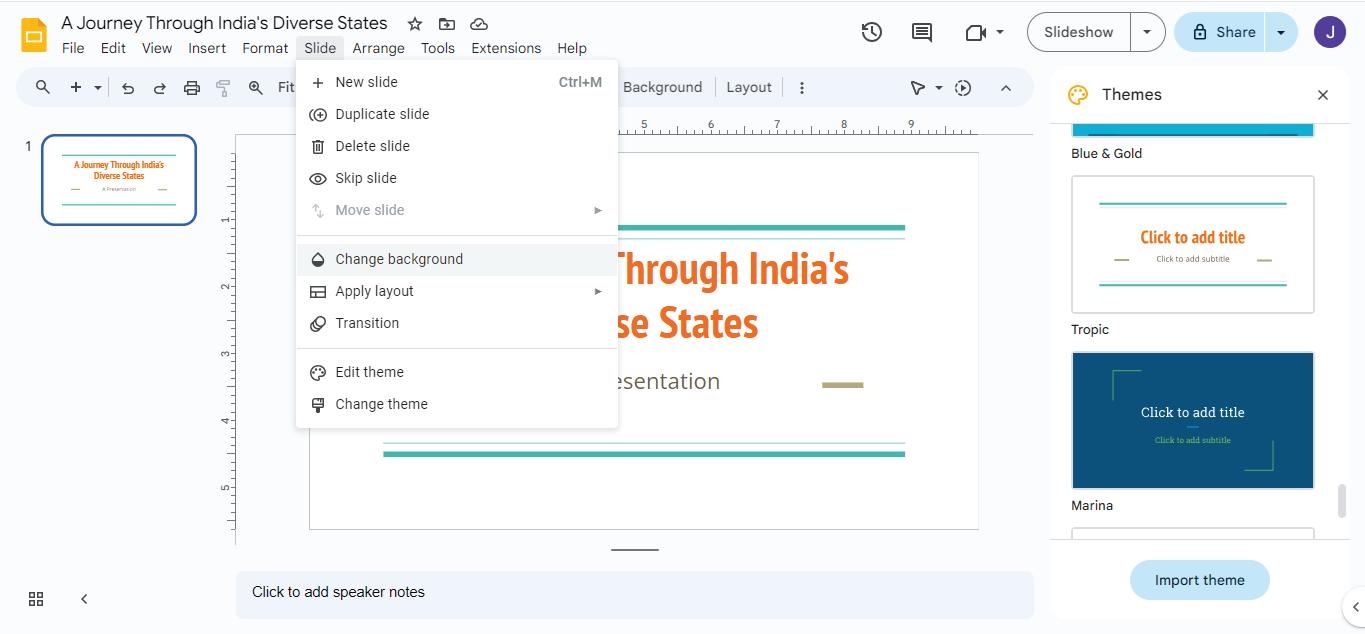
4. The Background pane appears. Select the colour of your choice from the Color drop-down list.
5. Click on the Done button.

You can set an image as a background of the slides of your presentations. Did You Know?
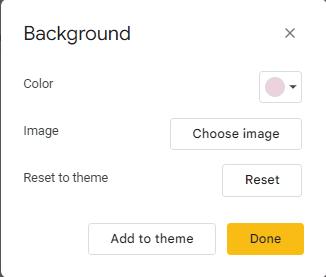
Layouts determine how your content, such as titles, text, and images, is organised on the slide. You can choose a different layout for each selected slide. Let us learn how to add different layouts to different slides:
1. Select the slide in the Slide Navigation pane.
2. Click on the Slide menu from the menu bar.
3. Select the Apply layout option.
4. You will see different layout options. Choose the one you like the most.
Your slide will change to the new layout.

Similarly, you can use a Title and Body layout to talk about the states of India from east, west, north, and south.


1 Choose the correct answer and fill in the blanks.
a The shows the name of a presentation.
i Presentation Title
iii Speaker Notes
ii Toolbar
iv Slide Workspace
b An area where you add items such as text, images, and videos for a slide is called the
i Menu bar
iii Speaker Notes
ii Toolbar
iv Slide Workspace
c The holds tools for quick and easy access.
i Presentation Title
iii Slides panel
2 Match the Following.
Column A
Theme
ii Toolbar
iv Themes section
Column B
It is used to change the background of the slides.
Layout It is a special design for your slide.
Slide → Change background It is an online presentation-making app.
Google Slides
It determines how your content is organised on the slide.
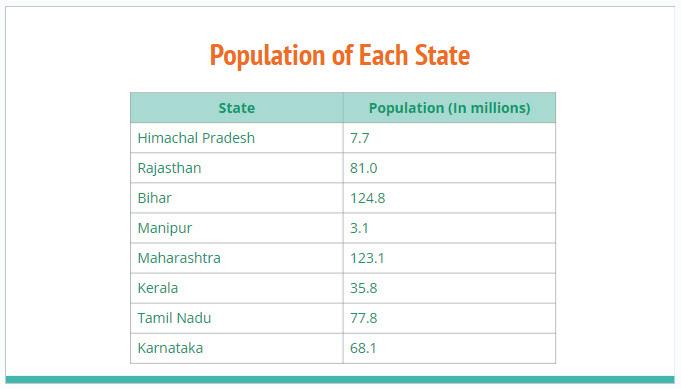
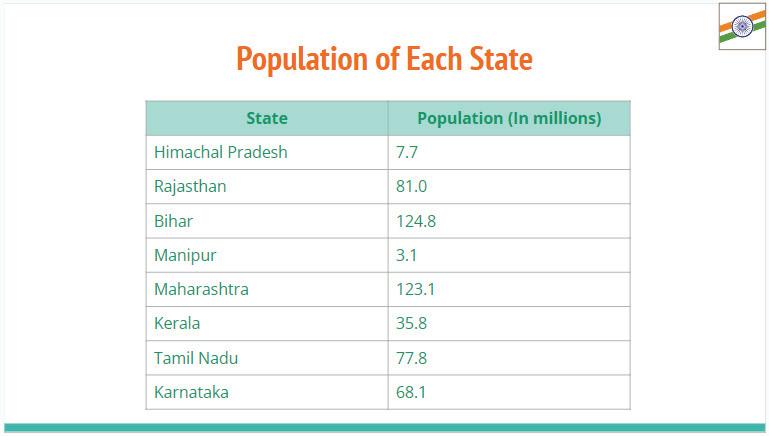
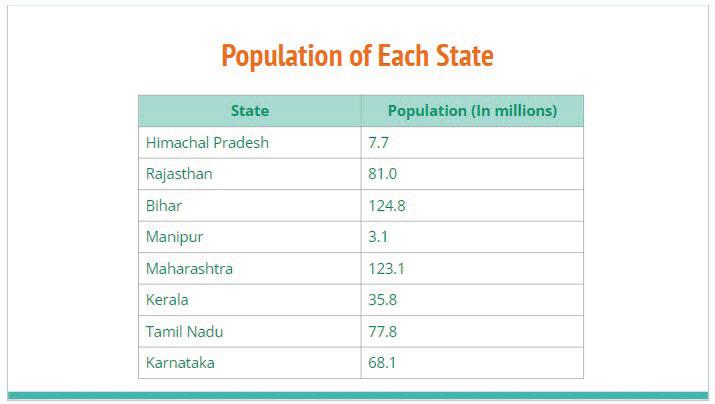
Tables are used to organise information neatly and in an easy-to-understand manner. They help you put information clearly in rows and columns.
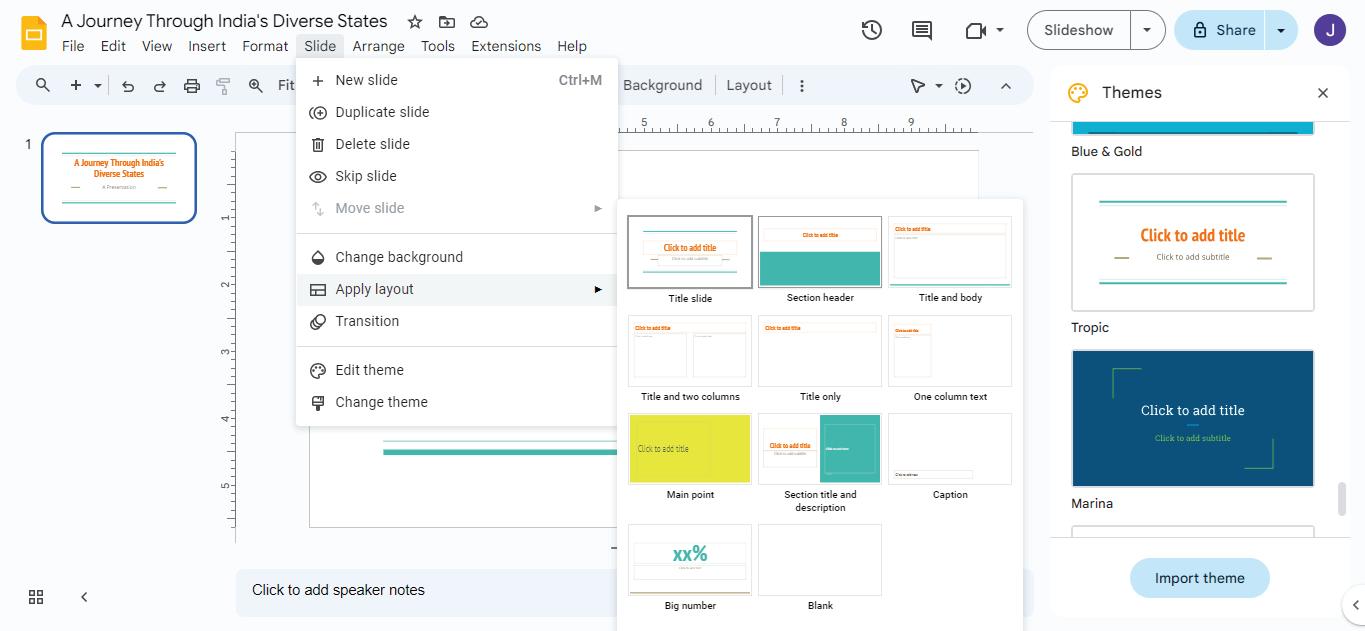
Let us say we want to show the population of each state. We can use a table in Google Slides.
To insert a table:
1. Click on the Insert menu in the menu bar.
2. Select the Table option from the drop-down list.
3. Pick the number of rows and columns required from the grid that appears. The table will appear on the slide.
4. Type in the states in one column and their population (in millions) in the next column. You can adjust the size of the table and add colours using the Fill color tool to make it look beautiful.

The Fill color tool is used to fill colour in a table’s cell, row, column, or complete table. This tool will appear on the Toolbar when you click on the table cell.
Charts are graphics or visual representations that are used to display and compare data easily. Charts make your information more interesting and easier to understand. There are different kinds of charts in Google Slides, such as:
• Bar chart: A bar chart represents data using bars of different lengths, which are arranged sideways horizontally.
• Column chart: A column chart represents data using bars of different heights, which are arranged like vertical columns.
• Line chart: A line chart represents data using a series of points which are connected by a line.
• Pie chart: A pie chart represents data using ‘slices’ of a whole circle. The size of each ‘slice’ shows how much value that specific ‘slice’ holds.


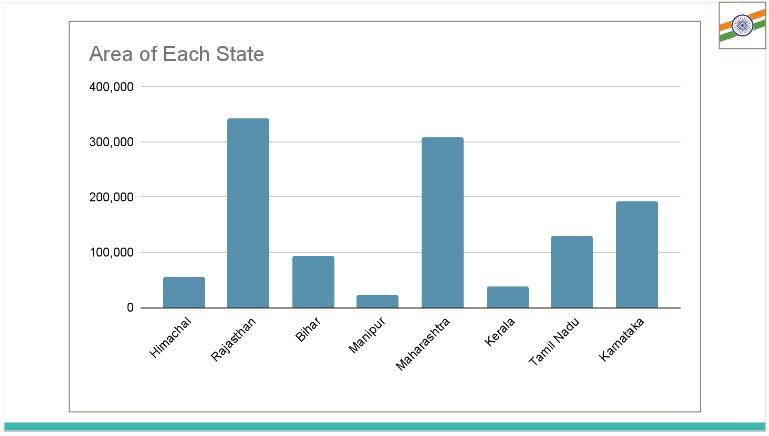
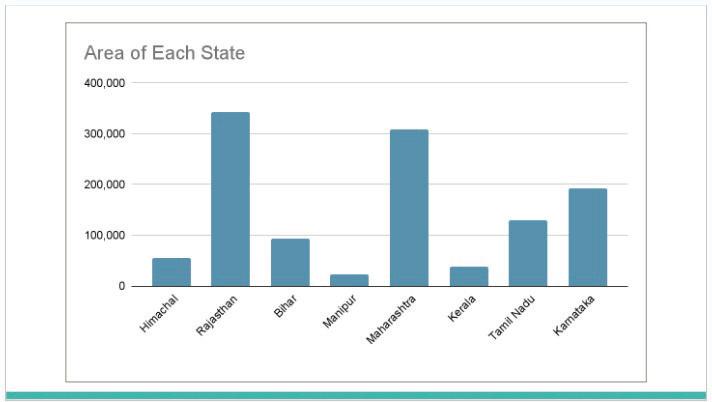
Suppose that in our presentation, we want to show the area of the states. We can use a column chart to represent this data.
To insert a chart:
1. Click on the Insert menu from the menu bar.
2. Select the Chart option.
3. Select the type of chart. Let us select Column chart.
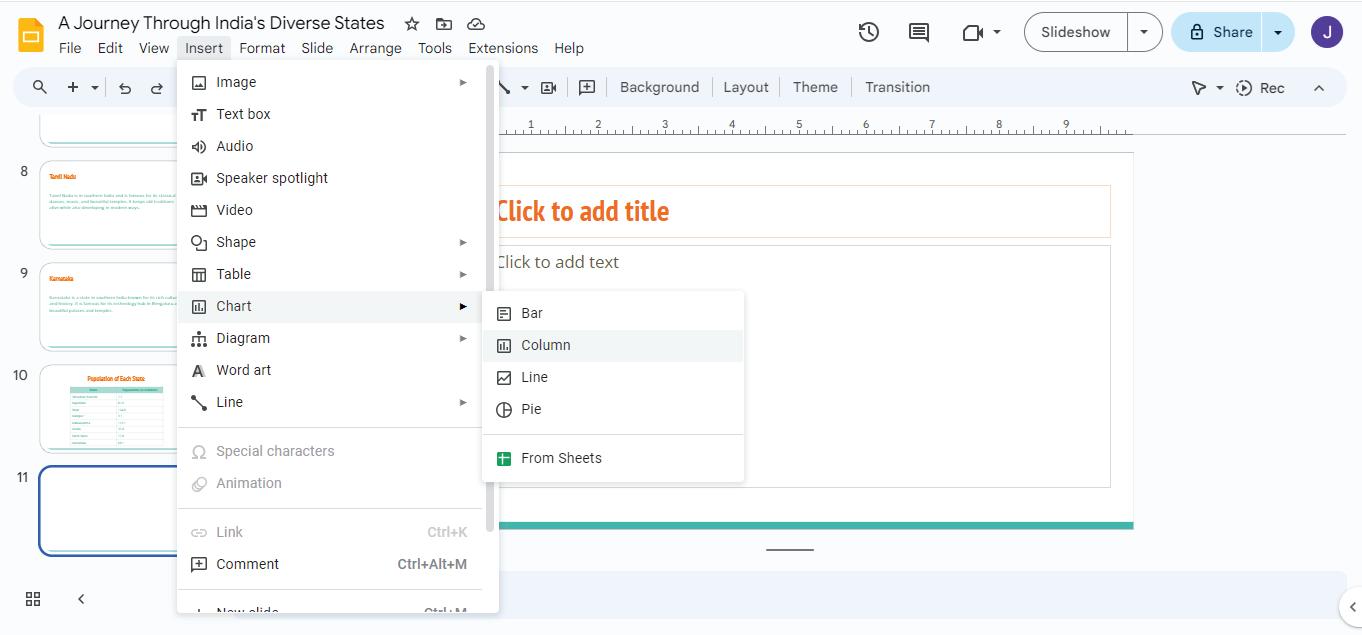
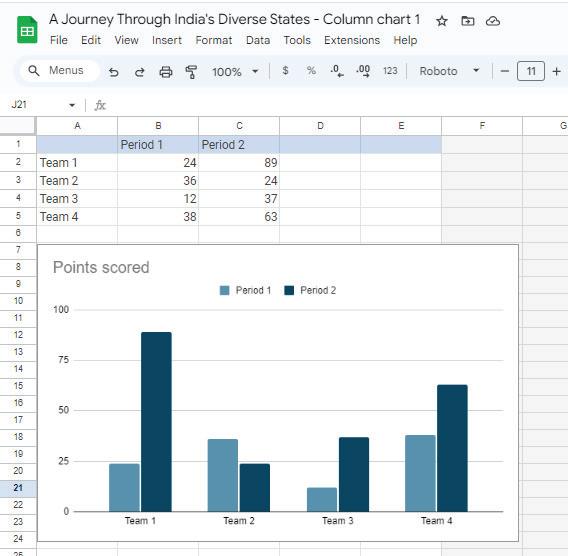
4. The Column chart will be inserted on the slide. Now, click on the three dots in the right-hand corner and select Open source.
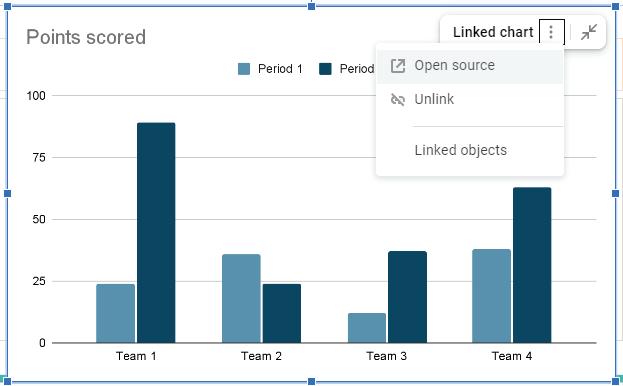
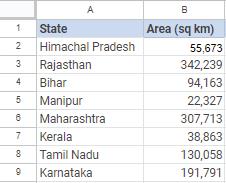
A new Google Sheet will open containing a table. This is where we will add the data, that is, the area of the states.
Google Sheets is another app by Google which is used to record and work with numbers, words, formulas, etc. You will learn more about it in the next chapters.
For now, we will write the area of each state in this table. This data will be reflected directly on the chart.
Now, let us enter the data.
a. Enter the name of the states in the first column. Enter the area in square kilometres in the second column. Remember to rename the columns to State and Area (sq km).
b. Delete the third column as we don’t need it. You can simply click on the column and press the Backspace key on the keyboard to do so.
5. After you enter your data, return to your slide and click on Update button.
Your column chart will appear on the slide. Each state will have its own colourful columns.
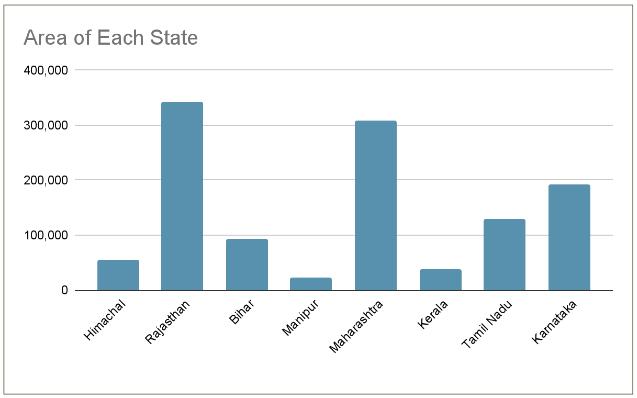
The taller the column, the more the area of the state. Looking at the chart shown above, we can easily say that Rajasthan has the highest area among the states shown here and Manipur has the smallest area. This way, we can easily compare the area of different states.
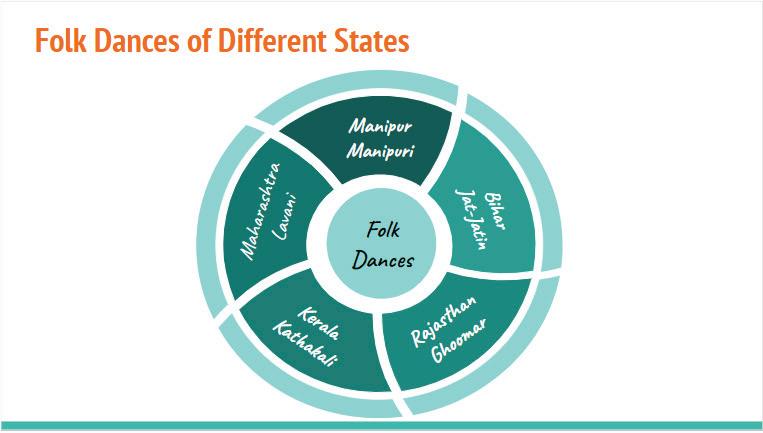
Diagrams are colourful pictures that help you show how things are connected, explain processes, or display information in a clear and organised way.


In our project about ‘A Journey Through India’s Diverse States’, we can use diagrams to show the folk dances of some states. Let us follow the steps given below:
1. Click on the Insert menu in the menu bar.
2. Select the Diagram option. We will see various types of diagrams you can use, like Grid, Hierarchy, and more.


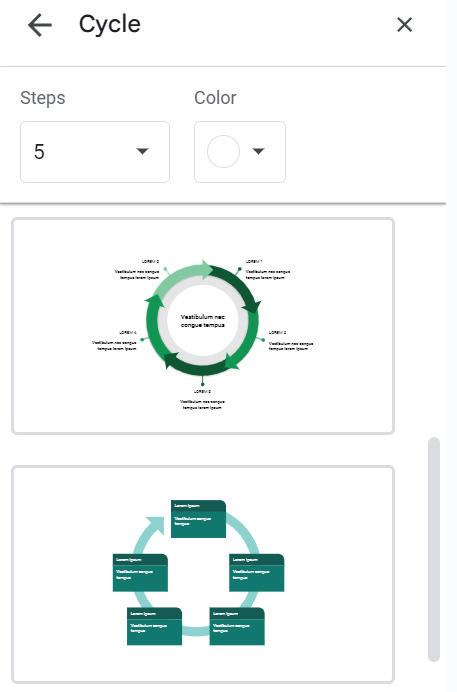
3. Since we are showing the folk dances of different states, a Cycle might be a good choice. Select the Cycle option.
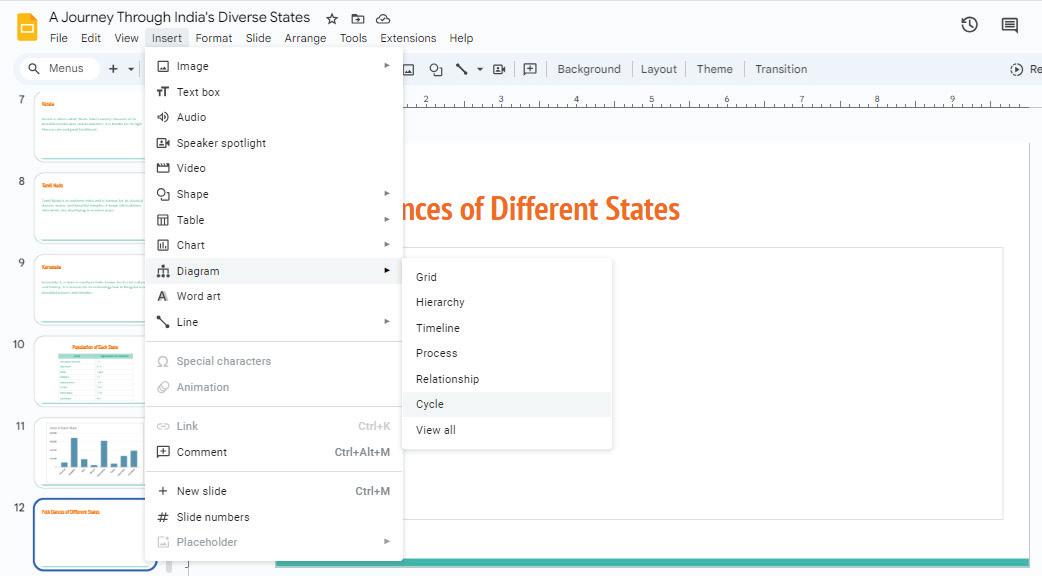
4. The Cycle pane appears on the right-hand side. Customise your diagram by adding more shapes and labels. The maximum number of Steps in a cycle is 5. You can also select suitable colours and styles of diagram based on your project’s requirements.
5. You can also customise the diagram by using the Fill color tool to colour the different components of the diagram.
The style and colour that you select will apply to the diagram.
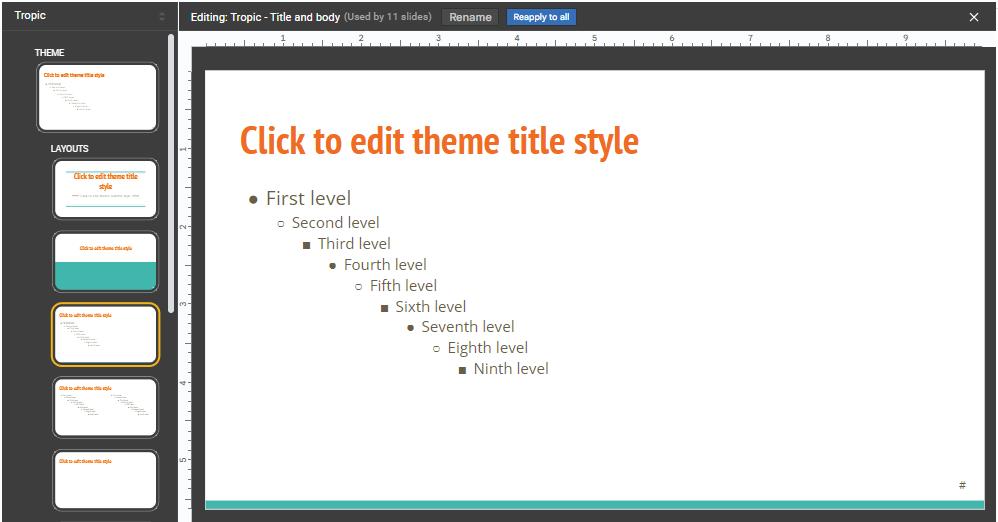
The Master Slide is the main slide. It allows you to change the appearance of your entire presentation all at once.
Suppose, we want the image of our national flag on all of our slides. What would we do? We could add the image in each of the slides, resize and place it how we want it to be.
But if you have fifteen slides, would it not be easier if we could make the changes in one slide and it could reflect on all the slides? Here, the master slide comes into play.
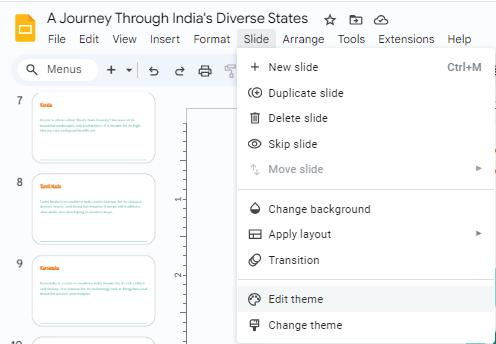
In Google Slides, we have the Edit theme option in the Slide menu, which helps us reflect one change in all the slides. When you use a theme, it changes the colours, fonts, and background designs of all your slides. Let us understand how we can do this by following the steps given below:
1. Click on the Slide menu in the menu bar.
2. Select the Edit theme option from the drop-down list.
3. A pane will appear with lots of colourful slides as options.
4. Copy the image you want to add and paste it here on the slide.
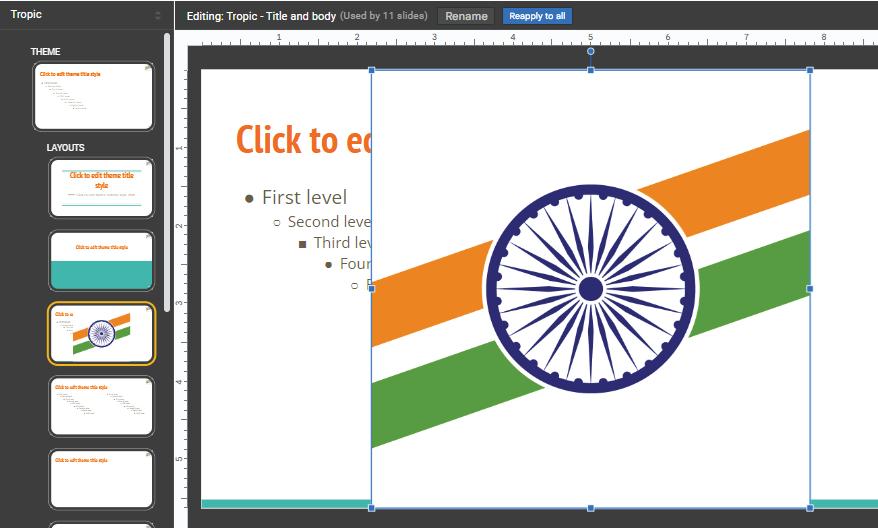
5. Resize the image according to your choice and place it anywhere where you want it to appear.
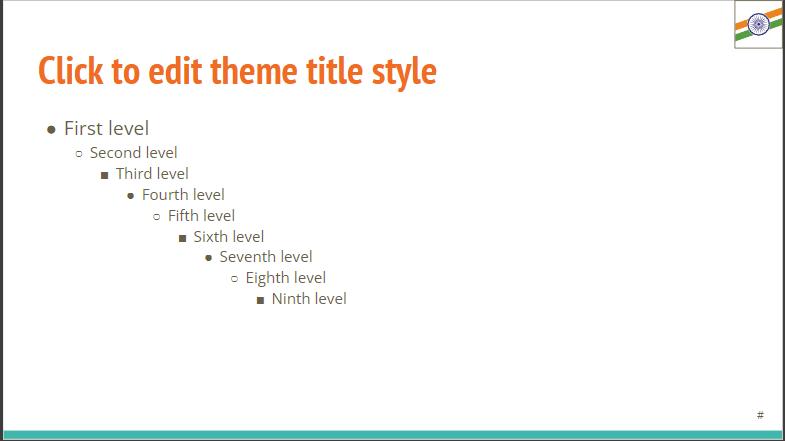
6. You will notice that the image has been added to all the slides.


Similarly, you can add titles, change the font, add more images, visuals, etc., to the main slide and it will reflect on all the slides of your presentation.
Changing the order of the slides means to rearrange the slides in a desired order. Suppose you want to change the existing order of the slides. You can click and drag the slides in the sidebar to arrange them in the order that you want.
Learn to draw a cartoon character in Google Slides!
Do It Yourself 4B
1 Fill in the blanks.
a displays data across rows and columns.
b are graphics that are used to display and compare data easily.
c A column chart represents data using bars of different heights.
d The is a slide that allows you to change the appearance of your entire presentation all at once.
2 Write the correct order of steps (1 to 4) to add changes to all the slides using the master slide:
a Select Edit theme from the drop-down.
b Click on Slide from the menu bar.
c Add the changes in selected master slide.
d A pane will appear.
1 A presentation is a way to share information, ideas, or stories using a combination of visuals, text, and sometimes even audio.
2 Google Slides is one of Google’s apps that is used to create presentations online.
3 Themes are special designs for your slides. They make your presentation look colourful and interesting.
4 Layouts determine how your content is organised on the slide, such as titles, text, and images.
5 Tables are used to organise information neatly and in an easy-to-understand manner.
6 Charts are visual representations or graphics that are used to display and compare data easily.
7 Diagrams are colourful pictures that help you show how things are connected, explain processes, or display information in a clear and organised way.
8 The master slide allows you to change your entire presentation’s look all at once.
A. Fill in the blanks.
Hints
columns themes menu master Apply layout
1 bar holds various menus like File, Edit, View, etc.
2 are like special designs for your slides.
3 To apply a layout on a slide, select Slide > option.
4 Tables consist of rows and
5 The slide allows you to change the appearance of your entire presentation all at once.
B. Tick () the correct option.
1 Which component of Google Slides allows you to add notes for the speaker during a presentation?
a Slide Workspace
b Slides Panel
c Speaker Notes d Toolbar
2 What is the purpose of a theme in Google Slides?
a To change the design of the presentation.
c To change the layout of the presentation.
b To change the font style.
d To insert charts and tables.
3 Which menu will you use to change the background colour of a theme in Google Slides?
a Insert menu
b Slide menu
c View menu d File menu
4 What are tables used for in Google Slides?
a Creating diagrams.
c Applying theme.
b Displaying information neatly in rows and columns.
d Changing slide backgrounds.
5 Which chart is used to represent data using horizontal bars of different lengths?
a Bar chart
c Line chart
C. Who am I?
b Column chart
d Pie chart
1 I am a component in Google Slides window that turns the slides into the presenter view to showcase the slides in full-screen mode.
2 I am a pane in Google Slides that contains different themes for your presentation.
3 I am a menu that allows you to add a table into your presentation.
4 I am a set of colourful pictures that helps you show how things are connected and explain processes.
5 I am a type of chart in Google Slides that represents data with a series of data points connected by a line.
D. Write T for True and F for False.
1 Google Slides is a tool for creating and sharing presentations.
2 Themes in Google Slides only change the background colours of your slides.
3 A column chart is a circular graph which uses slices to represent the relative size of data.
4 Changing slide order in Google Slides means deleting some slides.
5 Diagrams in Google Slides are used mainly for creating mathematical charts.
E. Answer the following questions.
1 Write the names of any three presentation applications.
2 What is Slide
3 What is the difference between themes and layouts?
4 In which menu is the Edit theme option present?
5 What is a pie chart?
F. Apply your learning.
1 Imagine Shaina is making a presentation on her favourite books and their authors. What features would she use to make it look good?
2 Himank is preparing a presentation on different animals found in a zoo. He wants to organise information about the animals’ names, habitats, and diets in rows and columns. Which feature should he use?
3 Vamika wants to showcase pictures of various sports for her school’s annual sports day in full-screen mode. Name the component of the Google Slides window that can help her achieve this.
4 Suppose Komal is giving a presentation on the solar system. Which option should she use to ensure that a specific image, such as a planet, appears consistently on all the slides?
5 Saharsh has created a presentation on famous monuments around the world. He realises that he wants to change the order in which the slides were arranged. Which feature of Google Slides will help him achieve this?
In our previous chapter, we explored how to create effective presentations. However, the presentation did not have anything that moved and was animated in any way. So, is there a way that you can make those additions to your slides? Of course you can! You can do it by using animation. Let us understand what animation is.
Animation is a process through which you can bring still objects, such as text, shapes, images, charts, logos, etc., ‘to life’ by making them move.
Animation is a great tool with which you can make your presentation lively and engaging. You can add one animation effect to multiple objects or add more than one animation effect to a single object. It enables you to control the flow of information presented or convey processes and alterations with greater efficiency. It also helps you connect with your audience in a better way. But applying too many animations distracts the audience from the actual content.
So let us start with how to add animation to your slides. We will be using the same project that is created in the last chapter.
The word “Animation” comes from the Latin word “Anima”, which means “soul”. So, the process of animation refers to making characters come to life.
Let us learn how to add animation to our presentation. Open the presentation on ‘A Journey Through India’s Diverse States’ in Google Slides. Follow the steps given below to add animation to different objects on a slide:
1. Select an object on a slide that you want to animate.
2. Click on the Insert menu in the menu bar.
3. Select the Animation option from the drop-down list. The Motion pane will open on the right-hand side.
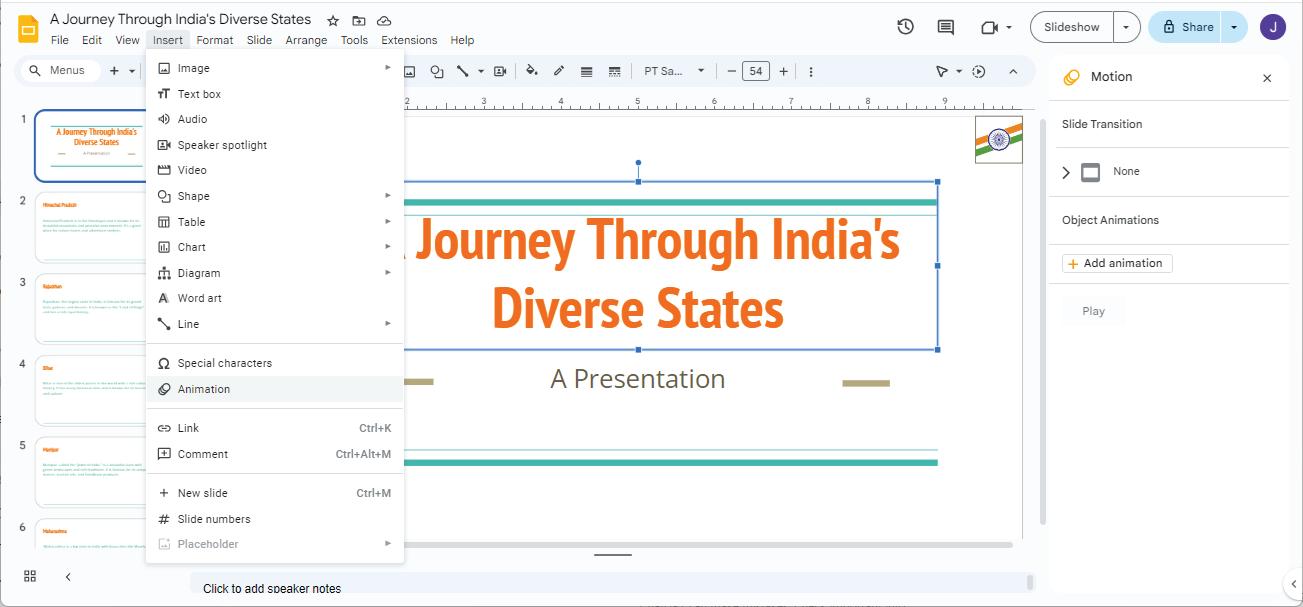
4. In the Motion pane, go to the Object Animations section.
Here, the first option is Animation type. Click on this option and select an animation from the drop-down list.
5. The next option is the Start condition. Select one of the following options from the dropdown list:
On click: Animation starts when you click your mouse.
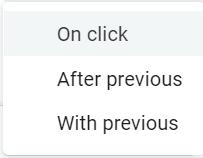
After previous: Animation starts once the previous animation ends. With previous: Animation starts with the previous animation.
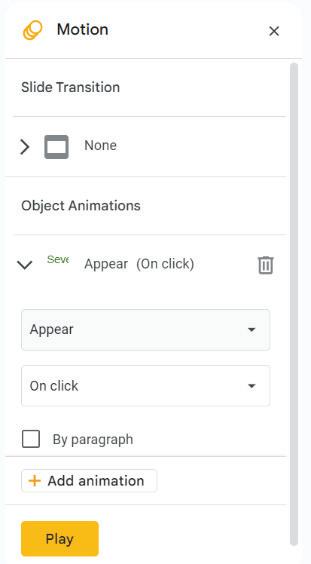
6. If the object is a placeholder or text box, the By paragraph check box will be displayed. If this check box is checked, each paragraph of text in the box will be displayed one by one. Otherwise, the entire box will be displayed at once.
7. If you want to add more animations, you can select an object and click on the Add animation option.
8. Click on the Play button to check how that animation effect works on the selected object.


Transition is a way to move smoothly from one slide to the next.
A slide transition provides a visual effect that takes place when one slide changes to another during a presentation. You can control its speed, add sound, and personalise the appearance of these transition effects.
To add a transition effect to your presentation, you need to follow the steps given below:
1. Select the slide to which you want to apply the transition effect.
2. Click on the Slide menu from the menu bar.
3. Select the Transition option from the drop-down list.
Alternatively, you can right-click on the selected slide from the Slide Navigation pane and click on the Transition option.
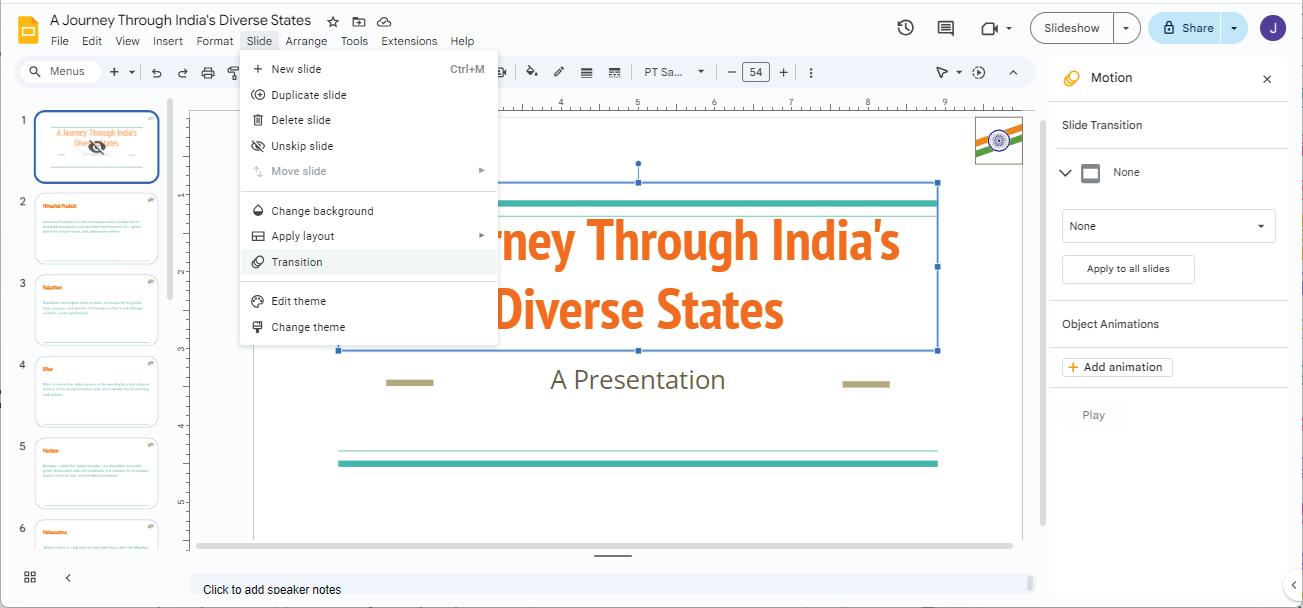
4. The Motion pane will appear on the righthand side. In the Motion pane, go to the Slide Transition section.
Select the Transition type from the dropdown list.
5. Set the transition’s Duration by dragging the slider. This slider will only appear once you have selected the Transition type
6. Click on the Apply to all slides button to apply this transition effect to all the slides.
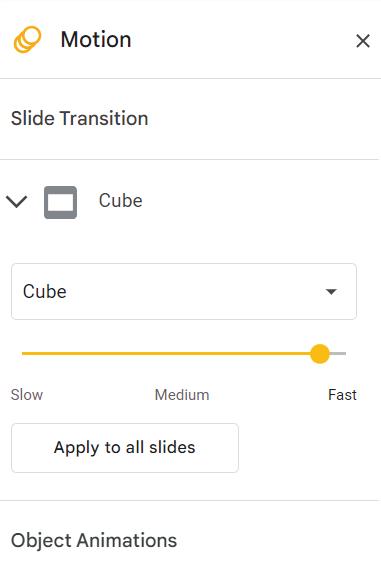
If you do not click this button, the transition will be applied to the current slide only.
7. Click on the Play button to view the transition effect.

Scan the QR code to know how to create a flipbook animation using Google Slides.
1 Read the following statements and place a tick mark beside the correct statements:
a Animation can be added to only one object on the slide.
b When we select the starting condition as “After previous”, the animation starts once the previous animation ends.
c Applying too many animations distracts the audience from the actual content.
d The speed of the slide transition cannot be controlled.
e A Cube is a type of transition.
2 Avi has to revise the concepts he has learnt. But he is confused about how to add a transition. He has written the steps in an incorrect order. Help him by numbering the steps (a. to e.) in the correct order.
Select the Transition option from the drop-down list.
Click on the Slide menu from the menu bar.
Set the transition’s Duration.
Click the Play button.
Select the Transition type from the Motion pane.
Why are transitions important?
Adding audio and video elements to your presentation can add a new dimension to it. Using audio or sound, you can include background music and narrate key points. Using videos, you can showcase the video content in your presentation. Your presentation can become more engaging and informative using audio and videos. The most commonly used audio format is .mp3, while the most popular video format is .mp4.
Let’s add music to your presentation. To insert any audio file in your presentation, you need to first upload an audio file to Google Drive.
Let us learn how to upload an audio file to Google Drive from your computer:
1. Open drive.google.com.
2. Click on the New button.
3. Select the File upload option from the drop-down list.
4. The Open dialog box will appear. Select the audio file you want to upload.
5. Click on the Open button.
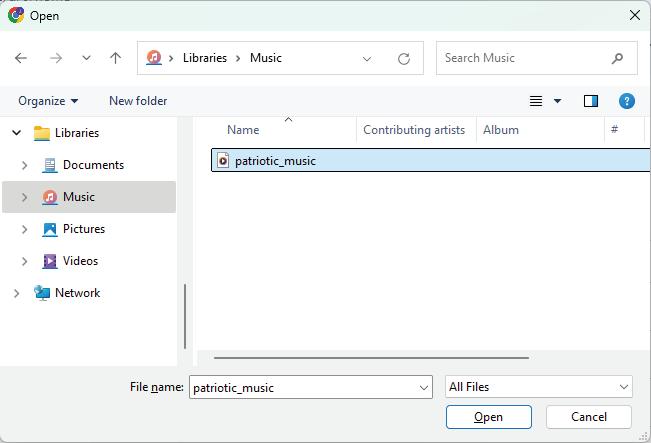
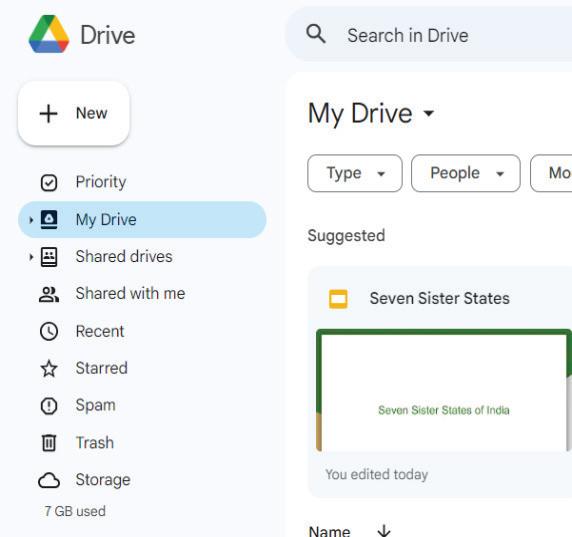
6. Wait for the file to upload. Once the file is uploaded, proceed with the next step.
Once you have uploaded the audio file, you can add the audio file to the presentation. To add an audio file in the presentation:
1. Go to your presentation again.
2. Click on the Insert menu.
3. Select the Audio option from the drop-down menu.
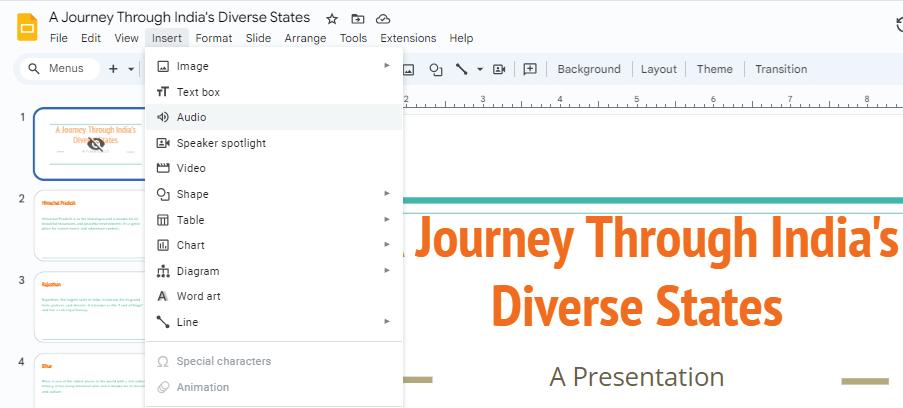
4. The Insert audio window will open. Select the audio file that you want to add.
5. Click on the Insert button.
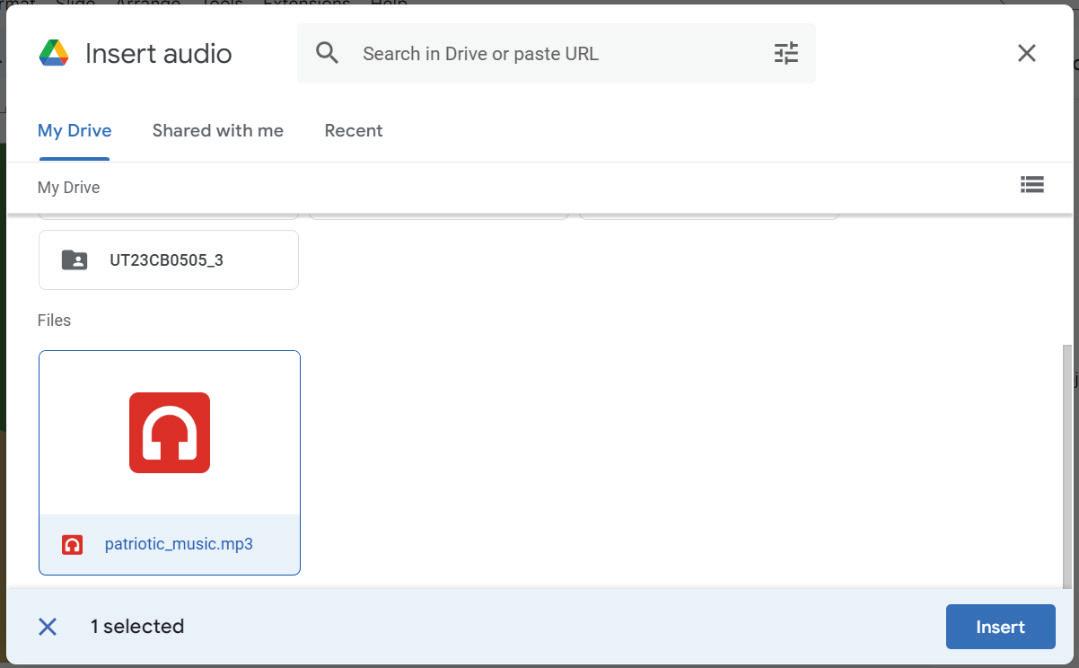
6. The speaker icon on the slide indicates that the audio file is attached to your presentation. You can play it by using the Play button.
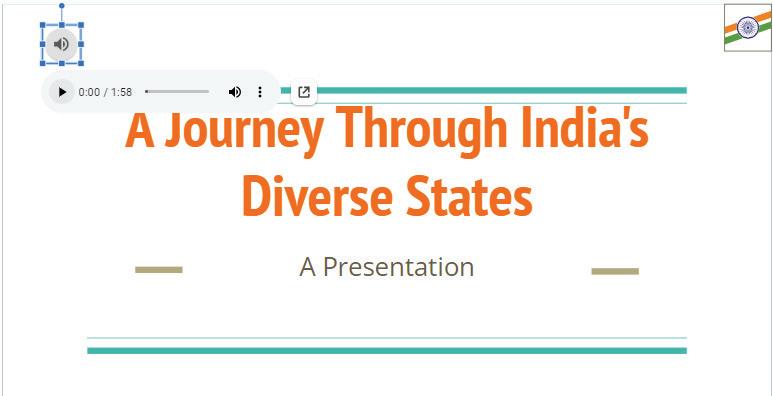
Are different types of background sounds important in presentations?
You can add videos to your presentations in two different ways:
A. From YouTube: You can add videos from YouTube. Let us learn how to add videos using YouTube:
1. Click on the Insert menu.
2. Select the Video option from the drop-down list.
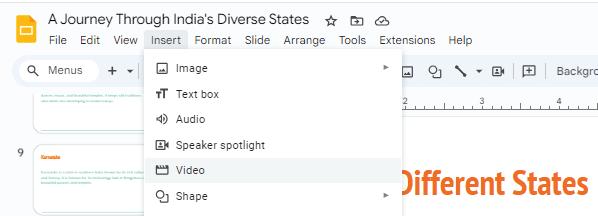
3. The Insert video window will open. Here, click on the YouTube tab.
4. To search for a video, enter the video name in the search bar and press the Enter key.
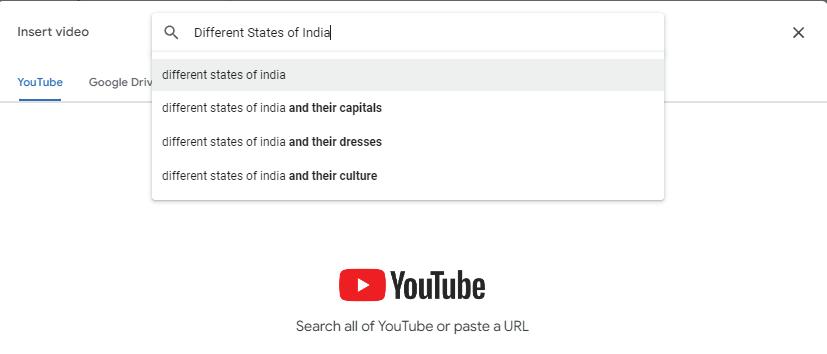
5. A list of videos will appear. Select a video and click on the Insert button that appears when you click on the video.
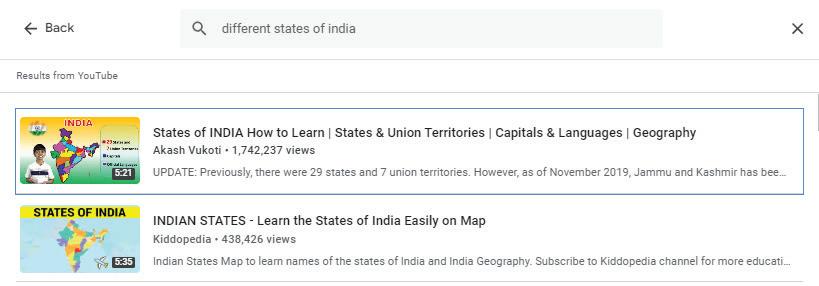
6. You can see the inserted video on the slide. Click on the Play button.
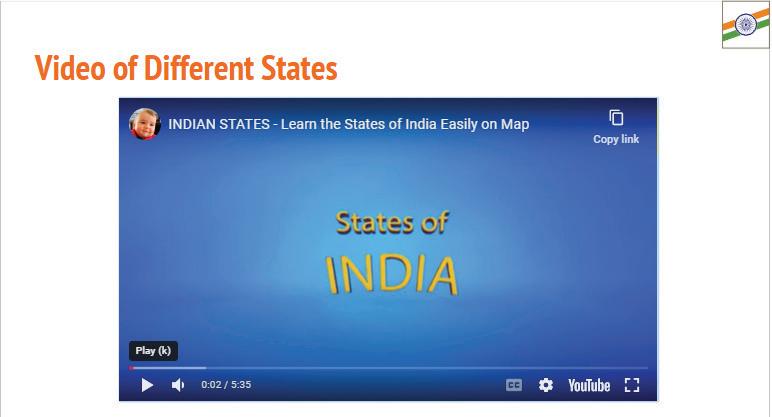
B. From Google Drive: Like the audio file, you need to first upload the video to Google Drive. After uploading the video, you can add it to your presentation by following the steps given below:
1. Click on the Insert menu.
2. Select the Video option.
3. The Insert video window will open. Here, click on the Google Drive tab.
4. Click on the video to be added to the presentation.
5. Click on the Insert button.

The video is added to the presentation.
How do you think inserting a video in your presentation can give the audience a better understanding of the topic? Think and Tell
1 Match the following.
Terms
YouTube tab
.mp4
Play button
.mp3

Meaning
Allows to play audio/video on the slide
Audio format
Video format
Used to add videos from YouTube
2 Rearrange the steps of adding a YouTube video to a slide.
Select the Video option from the drop-down list.
Search for the video you want to add.
Select a video and click on the Insert button.
Click on the Insert menu.
In the Insert video window, select the YouTube tab.
1 With the animations, you can make objects like text, images, and shapes move on your slides.
2 A single object can have multiple animation effects applied to it. But too many animations can cause distraction.
3 Transitions are visual effects that can be applied to slides when one slide changes to another.
4 The speed of transitions can be changed, and the same transition effect can be applied to all the slides or any individual slide.
5 The most commonly used audio format is .mp3, while the most popular video format is .mp4.
6 Audios can be added as background music, voice narration, or sound effects in your presentation.
7 Any video from Google Drive or YouTube can be inserted into the presentation.
A. Fill in the blanks.
Hints on click animation audios slide transition videos objects
1 In a presentation, animations can be applied on .
2 To add an animation effect to a presentation, go to the Insert menu and choose option.
3 A provides a visual effect that takes place when one slide changes to another during a presentation.
4 With option, animation starts when you click your mouse.
5 and make the presentation more engaging and informative.
B. Tick () the correct option.
1 Which menu contains the options to smoothly move from one slide to the next? a File b Slide c Insert d View
2 What does this button signify?

a A picture is inserted into the presentation b Sound is attached to the presentation
c Text is inserted into the presentation d Shape is inserted into the presentation
3 Which option would you choose if you want to make an object move on a slide?
a Click on Insert → Animation b Click on Insert → Image
c Click on Insert → Audio d Click on Slide → Transition
4 How do you insert an audio file into your slide?
a Click on Insert → Audio b Click on Insert → Video
c Click on Insert → Picture d Click on Insert → Table
5 Press this button to ...

a Upload an audio file to Google Drive
c Add a video to a presentation
C. Who am I?
b Add an audio to a presentation
d Add animation in a presentation
1 I am a feature that makes objects move on slides and makes the presentation more engaging.
2 I am a visual effect that makes your slides change smoothly during a presentation.
3 I am the option that adds sound to your presentations. It can be background music, voice narration, or even special sound effects.
4 I am an option in the Motion pane that helps you change the speed of a transition effect.
5 I am a button that helps you reuse the same transition for all the slides.
D. Write T for True and F for False.
1 Animations can only be added to text in a presentation.
2 In a presentation, videos can only be added from YouTube.
3 Sound cannot be added to a presentation.
4 Sounds, videos, animations, and transitions make a presentation more engaging.
5 Animations and transitions are the same thing, and you can use them interchangeably.
E. Answer the following questions.
1 What is the purpose of animations in a presentation?
2 Can you add animations to both text and objects in a presentation?
3 Define slide transition. Name the button used to view the transition effect.
4 Write down the two ways in which you can add a video to your presentation.
5 What is the purpose of adding a video to a presentation?
F. Apply your learning.
1 Siya has made a presentation. She wants to show some movement of objects in her presentation. What should she use to add movement?
2 Rita has to present her project, for which she has prepared multiple slides. She wants smooth movement from one slide to another during her presentation. Which feature should she use?
3 Raju has used a transition effect in his presentation. But when he started the presentation, the slides were moving very slowly. Which option should he use to increase the speed of the slides?
4 Suman watched a video on YouTube that suits her presentation for the science fair perfectly. Can she add this video to her presentation?
5 Preeti has created a presentation that she wants to make more engaging. She has added transition effects to one slide. What can she do to apply transition effects to all the slides?
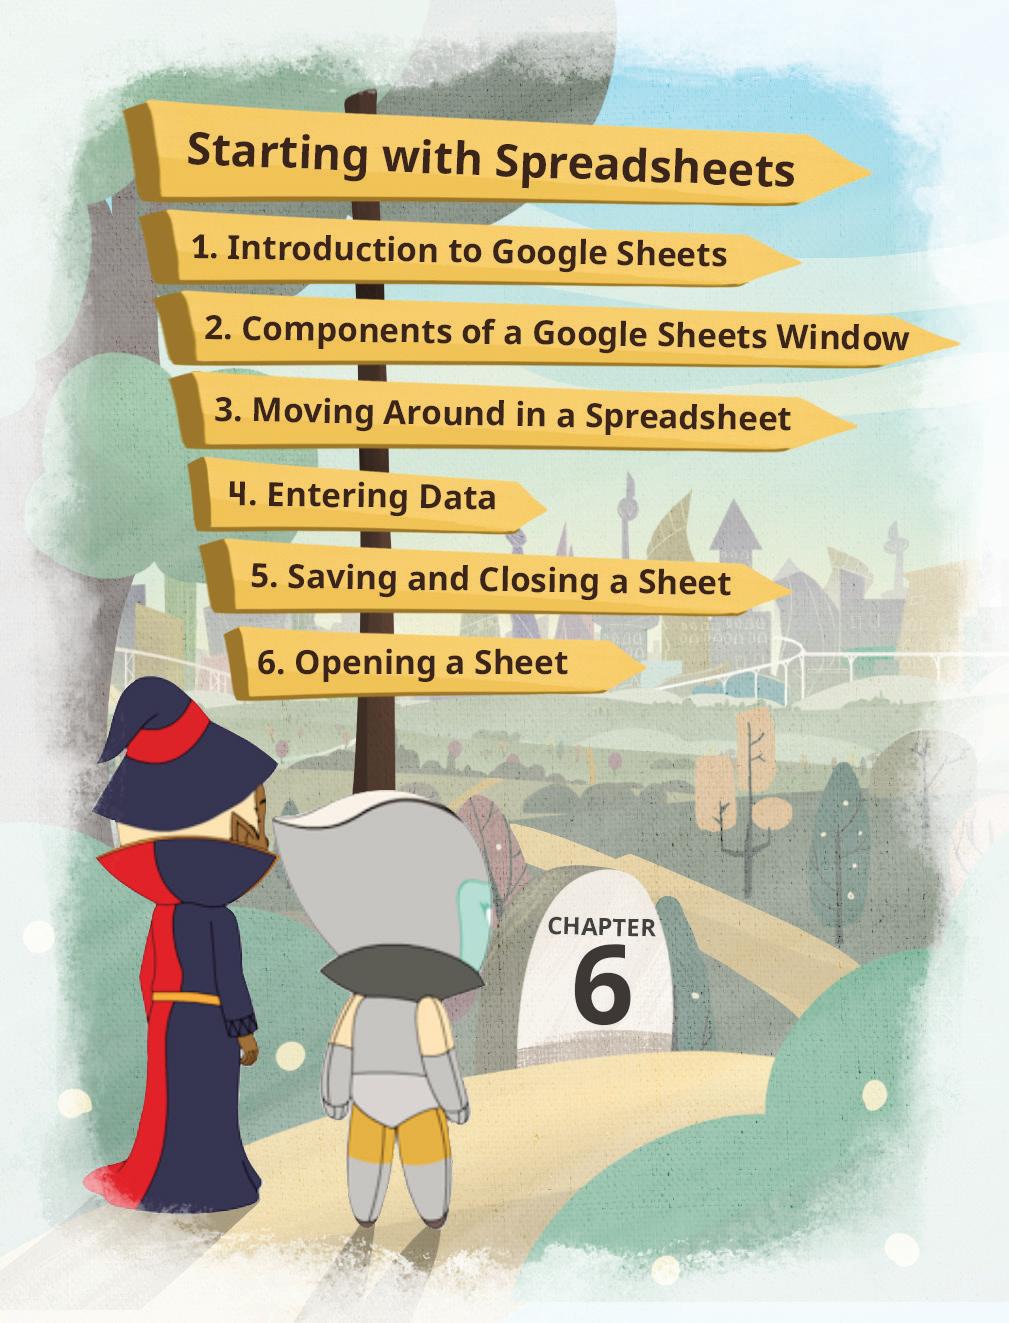
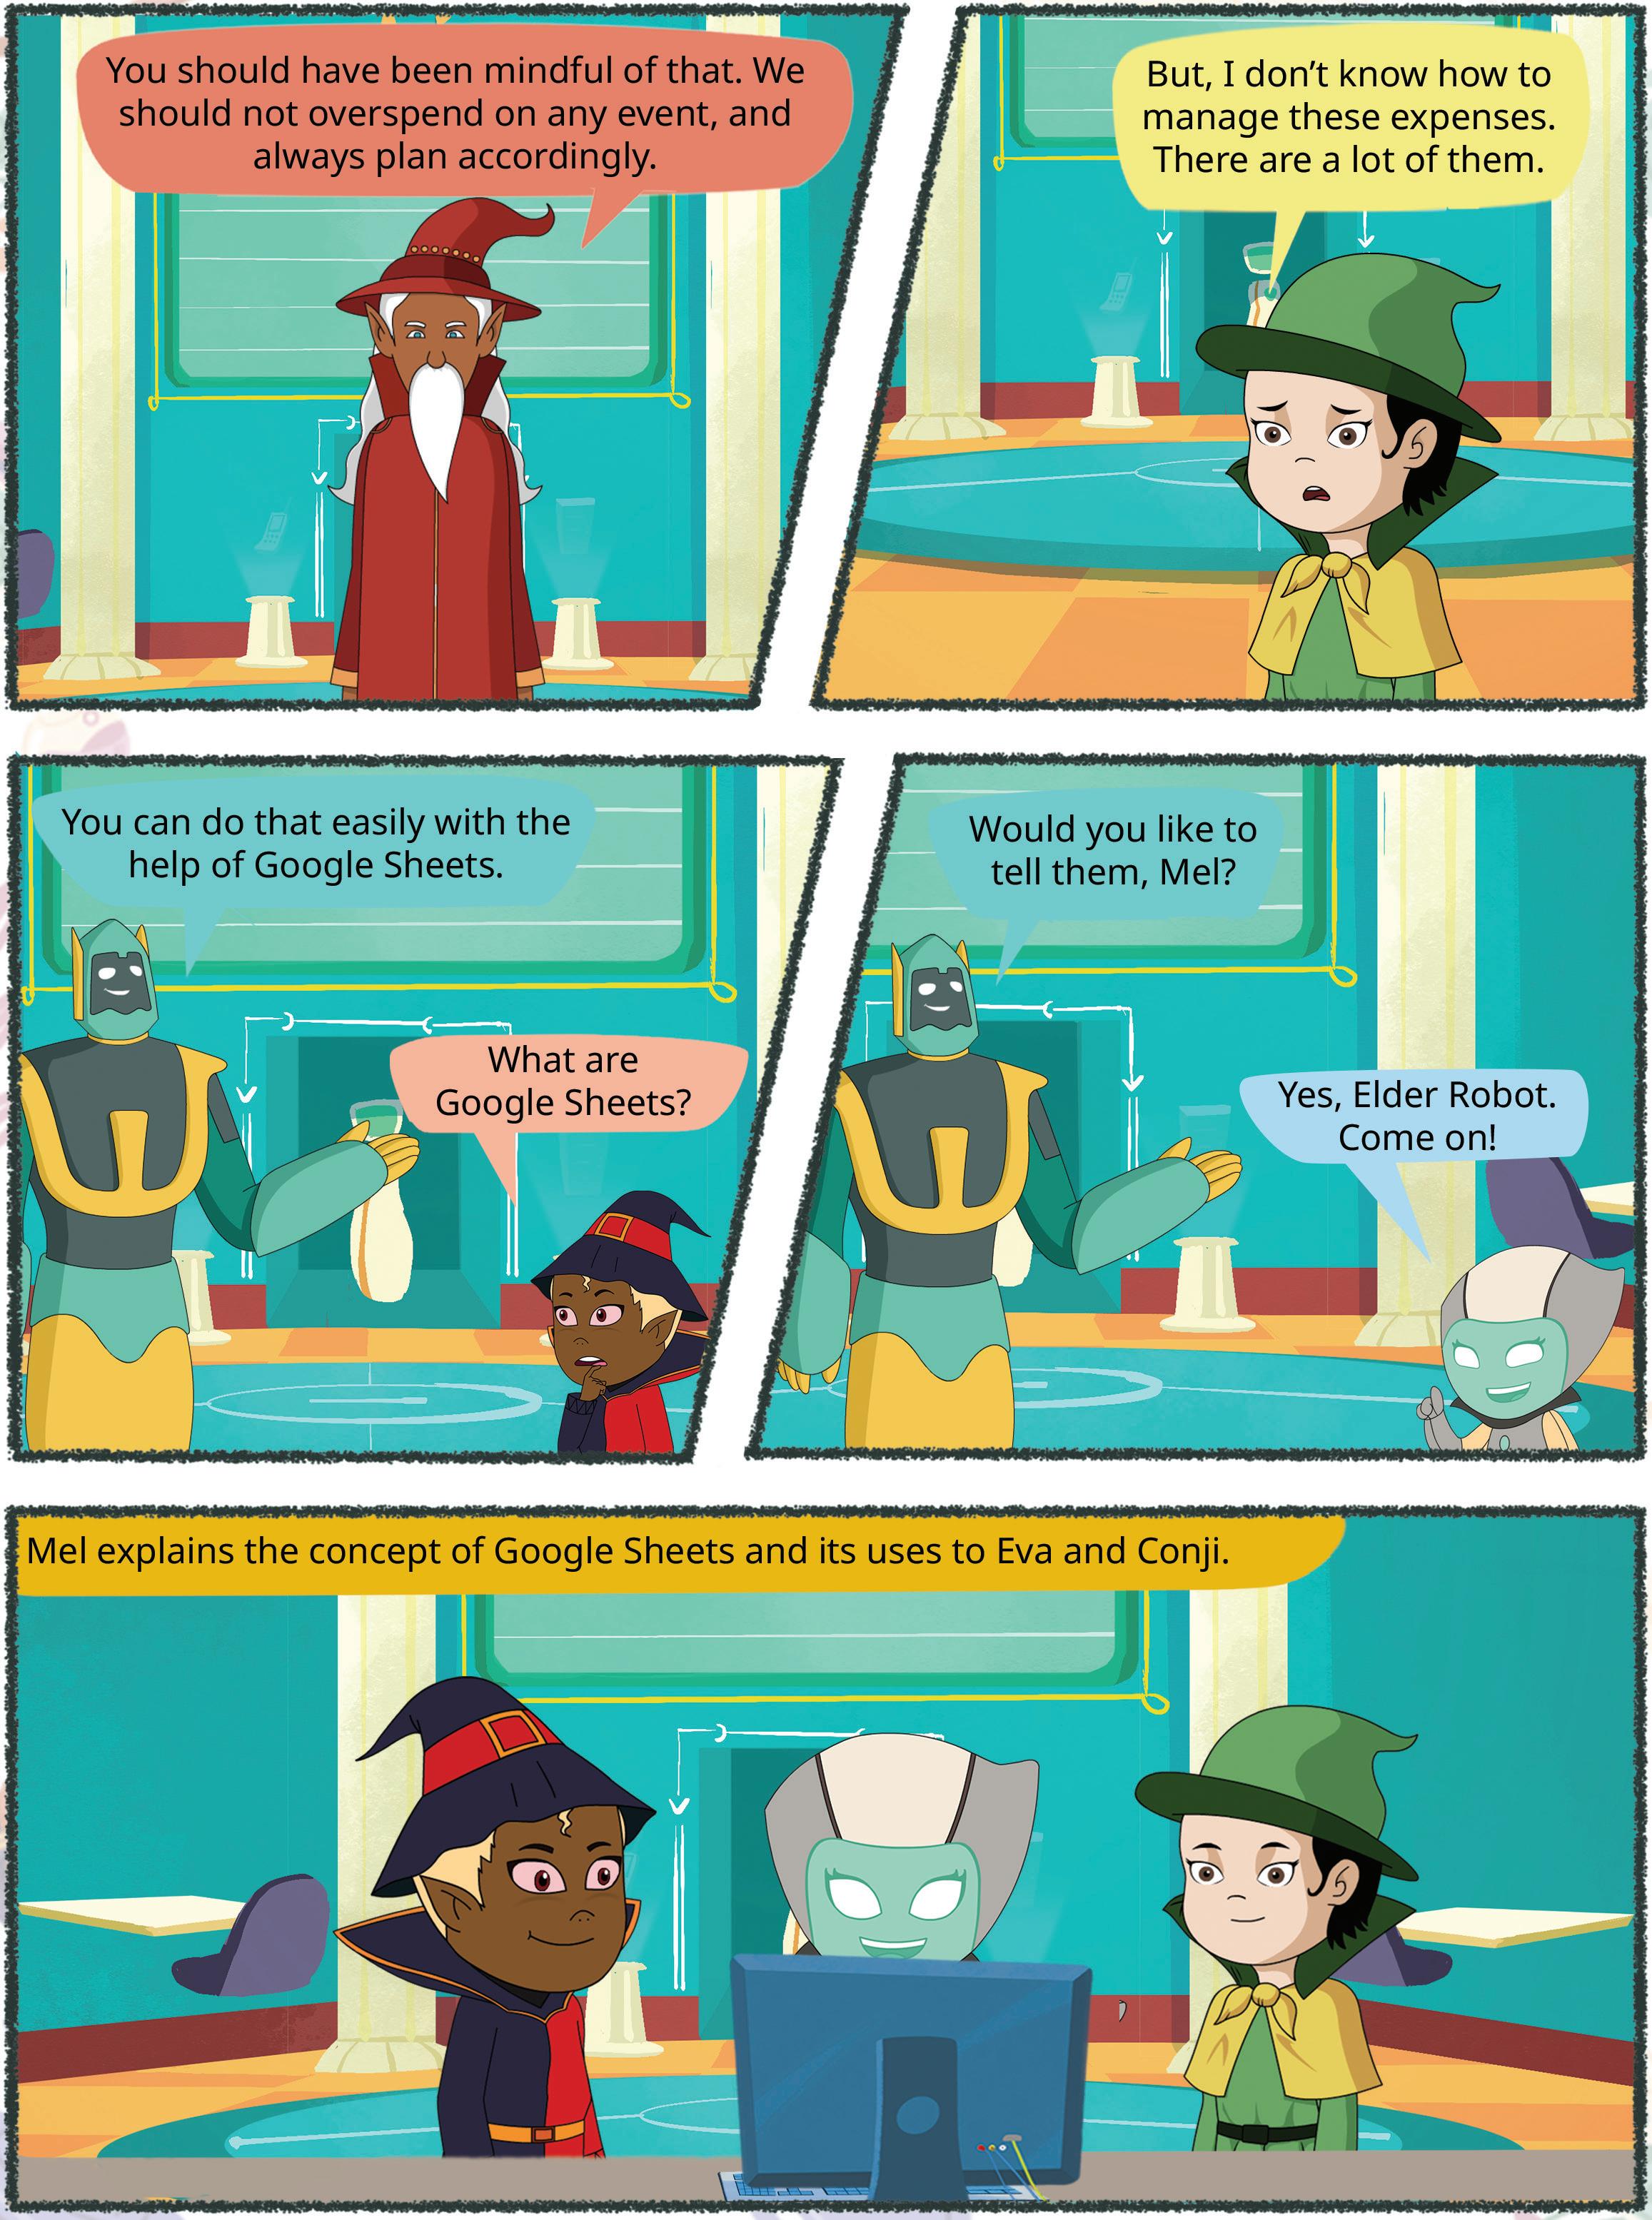
Imagine you have planted sunflower seeds and want to monitor their growth over time, noting their height and any other observations.
To record the various stages of the growth of the plant, you need to keep your list organised and managed on your computer. For this, you can use a spreadsheet.
A spreadsheet is a digital table that helps you organise and work with numbers, data, and information in a neat and structured way.
The most popular spreadsheets are Microsoft Excel and Google Sheets. Microsoft Excel is a software that you need to pay for, but Google Sheets is a free online spreadsheet tool.
Here are some uses of spreadsheets:
• Organise data by making tables, to-do lists, plan tasks, etc.
• Automate mathematical calculations for most data.
• Visualise data, using vibrant charts.
• Manage students’ attendance and grades.
• Manage money, like tracking expenses and planning budgets.
• Analyse and present research data.
• Record data, sales analysis, and financial calculations.
Here are some advantages of using Google Sheets:
• Google Sheets allows multiple people to work on the same spreadsheet at the same time.
• Google Sheets can be accessed from any computer, worldwide.
• Google Sheets offers Smart Fill and Autocomplete features, which means it can help you complete words in your spreadsheet.
• Google Sheets automatically saves your work.
Let us create a Google Sheet for your Plant Growth Tracker. Follow the steps:
1. Open the Google Chrome browser (web browser) and go to the website: https://docs.google.com/spreadsheets
2. Click the plus (+) sign to open a blank spreadsheet.
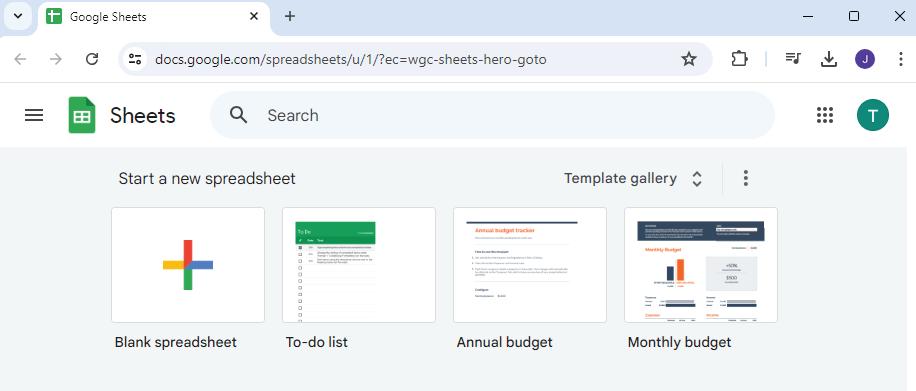
3. Change the name of the spreadsheet at the top-left by typing your project name where it says Untitled spreadsheet.
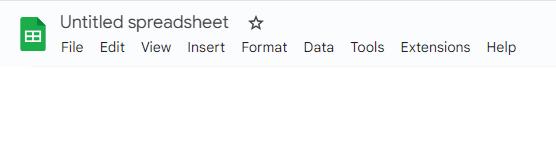
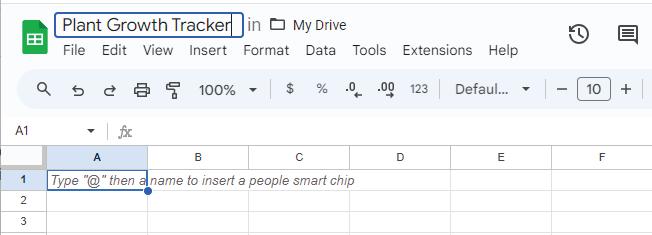
Your first Google Sheet is ready.
What are some other things you can do with Google Sheets?
Tick () the correct option.
1 Which of the following is the use of a spreadsheet?
a Making drawings
c Playing video games
2 What is the primary purpose of Google Sheets?
a To play online games
c To send emails
b Managing attendance
d Watching movies
b To organise data in tables
d To edit photos
3 Which of the following is a free online spreadsheet tool?
a Google Drive
c Microsoft Excel
b Google Sheets
d Google Slides
1. Spreadsheet title: This is where you write the name of a file. You can choose any name related to the project for your spreadsheet.
2. Row: The horizontal group of cells in a spreadsheet is called a row. The rows are numbered 1, 2, 3, and so on. They run across the spreadsheet from left to right.
The rows are numbered consecutively, starting with 1. By default, there are 1,000 rows in Google Sheets. The maximum number of rows that you can add to a sheet is 10 million.
3. Column: A column is a vertical group of cells denoted by letters. These letters range from A to Z, followed by AA, AB, through to AZ, and so on. It is important to note that each spreadsheet allows a maximum of 18,278 columns within a single sheet.
4. Cell: A cell in spreadsheet is the small box in which you can type text or numbers, or make calculations. Cells are located at the intersections of rows and columns.
Each cell on a sheet has a unique address. In a spreadsheet, the cell address format is the column letter followed by the row number, such as A1, B2, or C3.
5. Name box: When you click a cell, the respective cell address shows up in the Name box.
6. Active cell: When you click a cell in a spreadsheet, it becomes the active cell. Any data you type there can be entered in that cell.
7. Menu bar: A menu bar provides a range of tools to help you create, edit, format, and effectively manage your spreadsheet.
8. Toolbar: The toolbar is located below the menu bar. You can perform multiple actions in your spreadsheet, like editing text, zooming, printing, and more.
9. Formula bar: The formula bar is located just below Toolbar where you can enter and edit formulae or cell contents in an active cell.
10. Sheet tabs: At the bottom of the window, you can see tabs that represent various sheets within the same spreadsheet. You can create multiple sheets in one Google Sheets.
Think and Tell
Observe the following text: “ZZ10”. Can this be a cell address on Google Sheets?
11. Share Button: This option helps you to share your spreadsheet with your friends and work together with them. Explore
You can also chat with your friends and leave messages in the Google Sheets. Scan this QR code to know how this can be done.
• Using a keyboard
You can use various key combinations to move around the sheet, as follows:
Keys Function(s)
Arrow Keys (↑, ↓, ←, →)
Use the arrow keys on your keyboard to move the active cell up, down, left, or right.
Ctrl + Up Arrow Moves the cell pointer to the first cell in a column.
Ctrl + Down Arrow Moves the cell pointer to the last cell in a column.
Ctrl + Left Arrow Moves the cell pointer to the first cell in a row.
Ctrl + Right Arrow Moves the cell pointer to the last cell in a row.
Tab Moves the cell pointer to the next cell in the same row.
Shift + Tab Moves the cell pointer to the previous cell in the same row.
Ctrl + Home Moves the cell pointer to the first cell of a spreadsheet, i.e., A1.
Ctrl + End Moves the cell pointer to the last cell of the current spreadsheet.
Now that you have learnt to move in the sheet, let us learn how to enter data in the Google Sheets.
1. Select the cell in which you want to enter data. The cell becomes an active cell.
2. Type the data in the active cell.
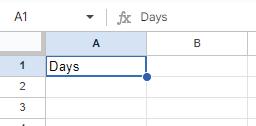
3. Press the Enter key to go to the next row; or to move to the next cell, either press the Tab key or use the Arrow keys on your keyboard.
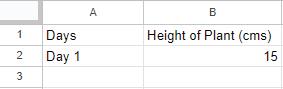
4. You can add any type of information in a cell: letters, numbers, or even images. Add the data in the spreadsheet to complete it.
After entering the data, it is time to save the data. Google Sheets makes it easy, as it has an auto save feature that keeps your data safe.
Auto save means that you do not need to save the sheet repeatedly; it will be saved automatically. You can see that Google Sheets is saving your work by looking at the “Saving…” icon on the top right corner of your screen.
After Google Sheets has saved your work, it shows an icon shaped like a cloud with a tick mark (✔) inside it.
When your work is saved, you can close your spreadsheet. To close a spreadsheet, click the X button on the web browser tab, which is the Close button.
What can happen if you close the sheet without saving it?
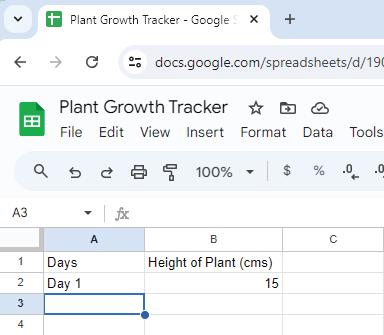
Suppose you want to see your sheet again or you want to add more data to your sheet. Here is how you can open your spreadsheet:
1. Open the Google Chrome web browser and then go to the Google Sheets website. All the sheets that you have created will be listed at the bottom.
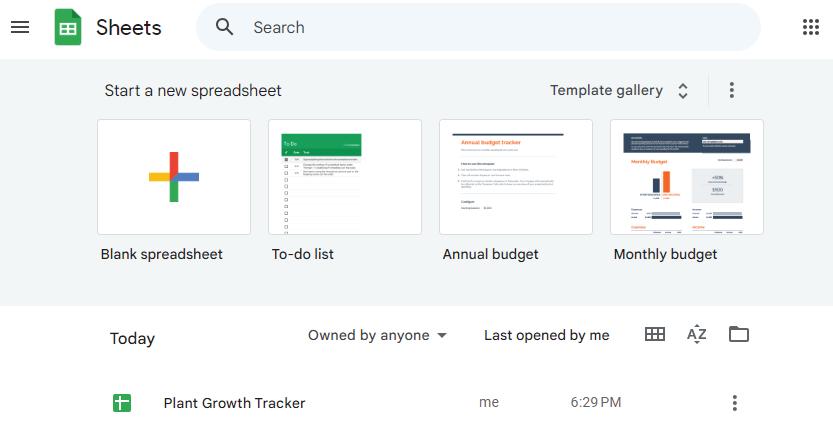
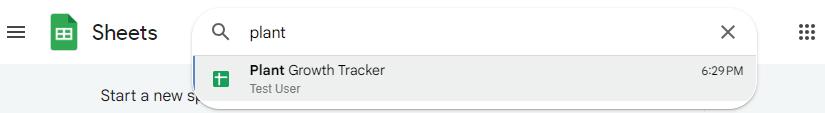
3. Select the sheet and it will open.
2. Look for the spreadsheet you want to open, or you can find it by typing its name in the Search bar at the top centre. Do It Yourself 6C
1 Match the Following.
Component Description
Saving
Entering
2 What key do you use to go to the next row when entering data?
1 A spreadsheet is a digital table that helps you organise and work with numbers, data, and information in a neat and structured way.
2 Google Sheets is a popular web-based spreadsheet application.
3 Google Sheets autosaves your work and it also allows you to work offline.
4 The horizontal group of cells in the spreadsheet is called rows. Rows are numbered 1, 2, 3, and so on.
5 A column is a vertical group of cells denoted by letters. These letters range from A to Z, followed by AA, AB, through to AZ, and so on.
6 Cells are at the intersections of rows and columns.
7 The cell address format is the column letter followed by the row number, such as A1, B2, or C3.
8 The currently selected cell in a spreadsheet where you can enter or edit data is called an active cell.
9 The formula bar is where you can enter and edit formulae or cell contents in an active cell.
10 The menu bar provides a range of tools to create, edit, format, and manage the spreadsheet.
11 The toolbar is a set of tools or options in Google Sheets that allows users to perform various actions or tasks such as editing text, zooming, and printing.
12 The Share button helps you to share your spreadsheet with your friends and work together with them.
A. Fill in the blanks.
Hints name box share autosave columns formula
1 Spreadsheets help organise information neatly in rows and
2 The bar lets you enter and edit formulae or cell contents in an active cell.
3 The button helps you to work on your spreadsheet together with your friends.
4 The means that you do not need to save the sheet repeatedly.
5 When we click on a cell, the respective cell address shows up in the .
B. Tick () the correct option.
1 How can you change the name of a Google spreadsheet?
a By clicking the plus (+) sign
c By clicking the File menu
b By typing your project name in the chat
d By renaming the Untitled spreadsheet
2 Which Google Sheets component represents various sheets within the same spreadsheet?
a Active Cell
c Sheets Tab
b Row Numbers
d Column Letters
3 What is the name of the horizontal group of cells in a spreadsheet?
a Rows
c Cells
4 What happens when Google Sheets saves your work?
a It shows a smiley face icon.
b Columns
d Sheets
b It plays a sound.
c It displays a cloud icon with a check mark. d It shuts down your computer.
5 To close a spreadsheet created using Google Sheets, what do you need to click?
a The X button
c The Share button
C. Who am I?
1 I am placed at the intersection of a row and a column.
b The Plus + sign
d The Home button
2 I provide many tools to help you create, edit, format, and manage your spreadsheet.
3 I am the shortcut key that moves the cell pointer to the first cell of the spreadsheet, i.e., A1.
4 I am the key that moves the active cell to the next line.
5 I am a currently selected cell in a spreadsheet.
D. Write T for True and F for False.
1 The address format of any cell is written as a number followed by a letter.
2 You can have multiple sheets in one spreadsheet.
3 Google Sheets is a software application that you need to pay for.
4 You cannot move within a sheet, using a keyboard.
5 You can go the last cell of the sheet by pressing the Ctrl + Home key combination.
E. Answer the following questions.
1 What is a spreadsheet?
2 What are the various advantages of Google Sheets?
3 Name all the components of Google Sheets.
4 Differentiate between a row and a column.
5 Name the two methods to move around in a spreadsheet.

F. Apply your learning.
1 Riya is an athlete who needs to achieve a certain height and weight to be able to compete in the next year’s racing competition. She wants to keep track of her height and weight in a tabular manner. Which online application can be helpful?
2 Kashish is creating a food menu for the school fair and has entered a few details. Identify the cell address of the active cell in the given screenshot.
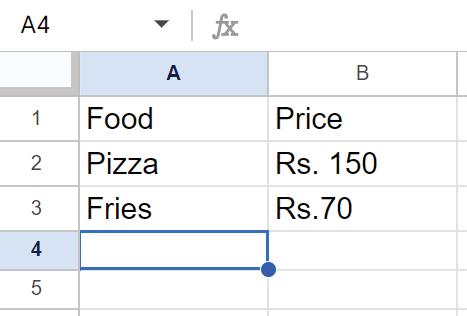
3 Raima was editing using Google Sheets when suddenly the internet got disconnected. When she rechecked, all the details were still there. Which feature of Google Sheets helped her not lose any data?
4 Mishi and Richa are two friends who created a spreadsheet using Google Sheets, to organise their study schedule for the upcoming exams. Will the use of Google Sheets be helpful to them?
5 Anshi is adding her test scores to a spreadsheet. Name the keys that helped her move from one cell to another.
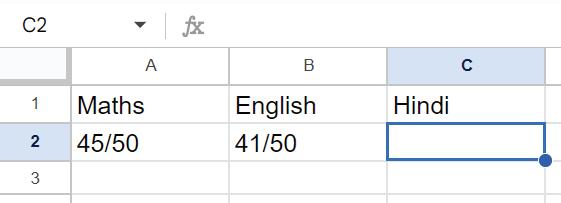


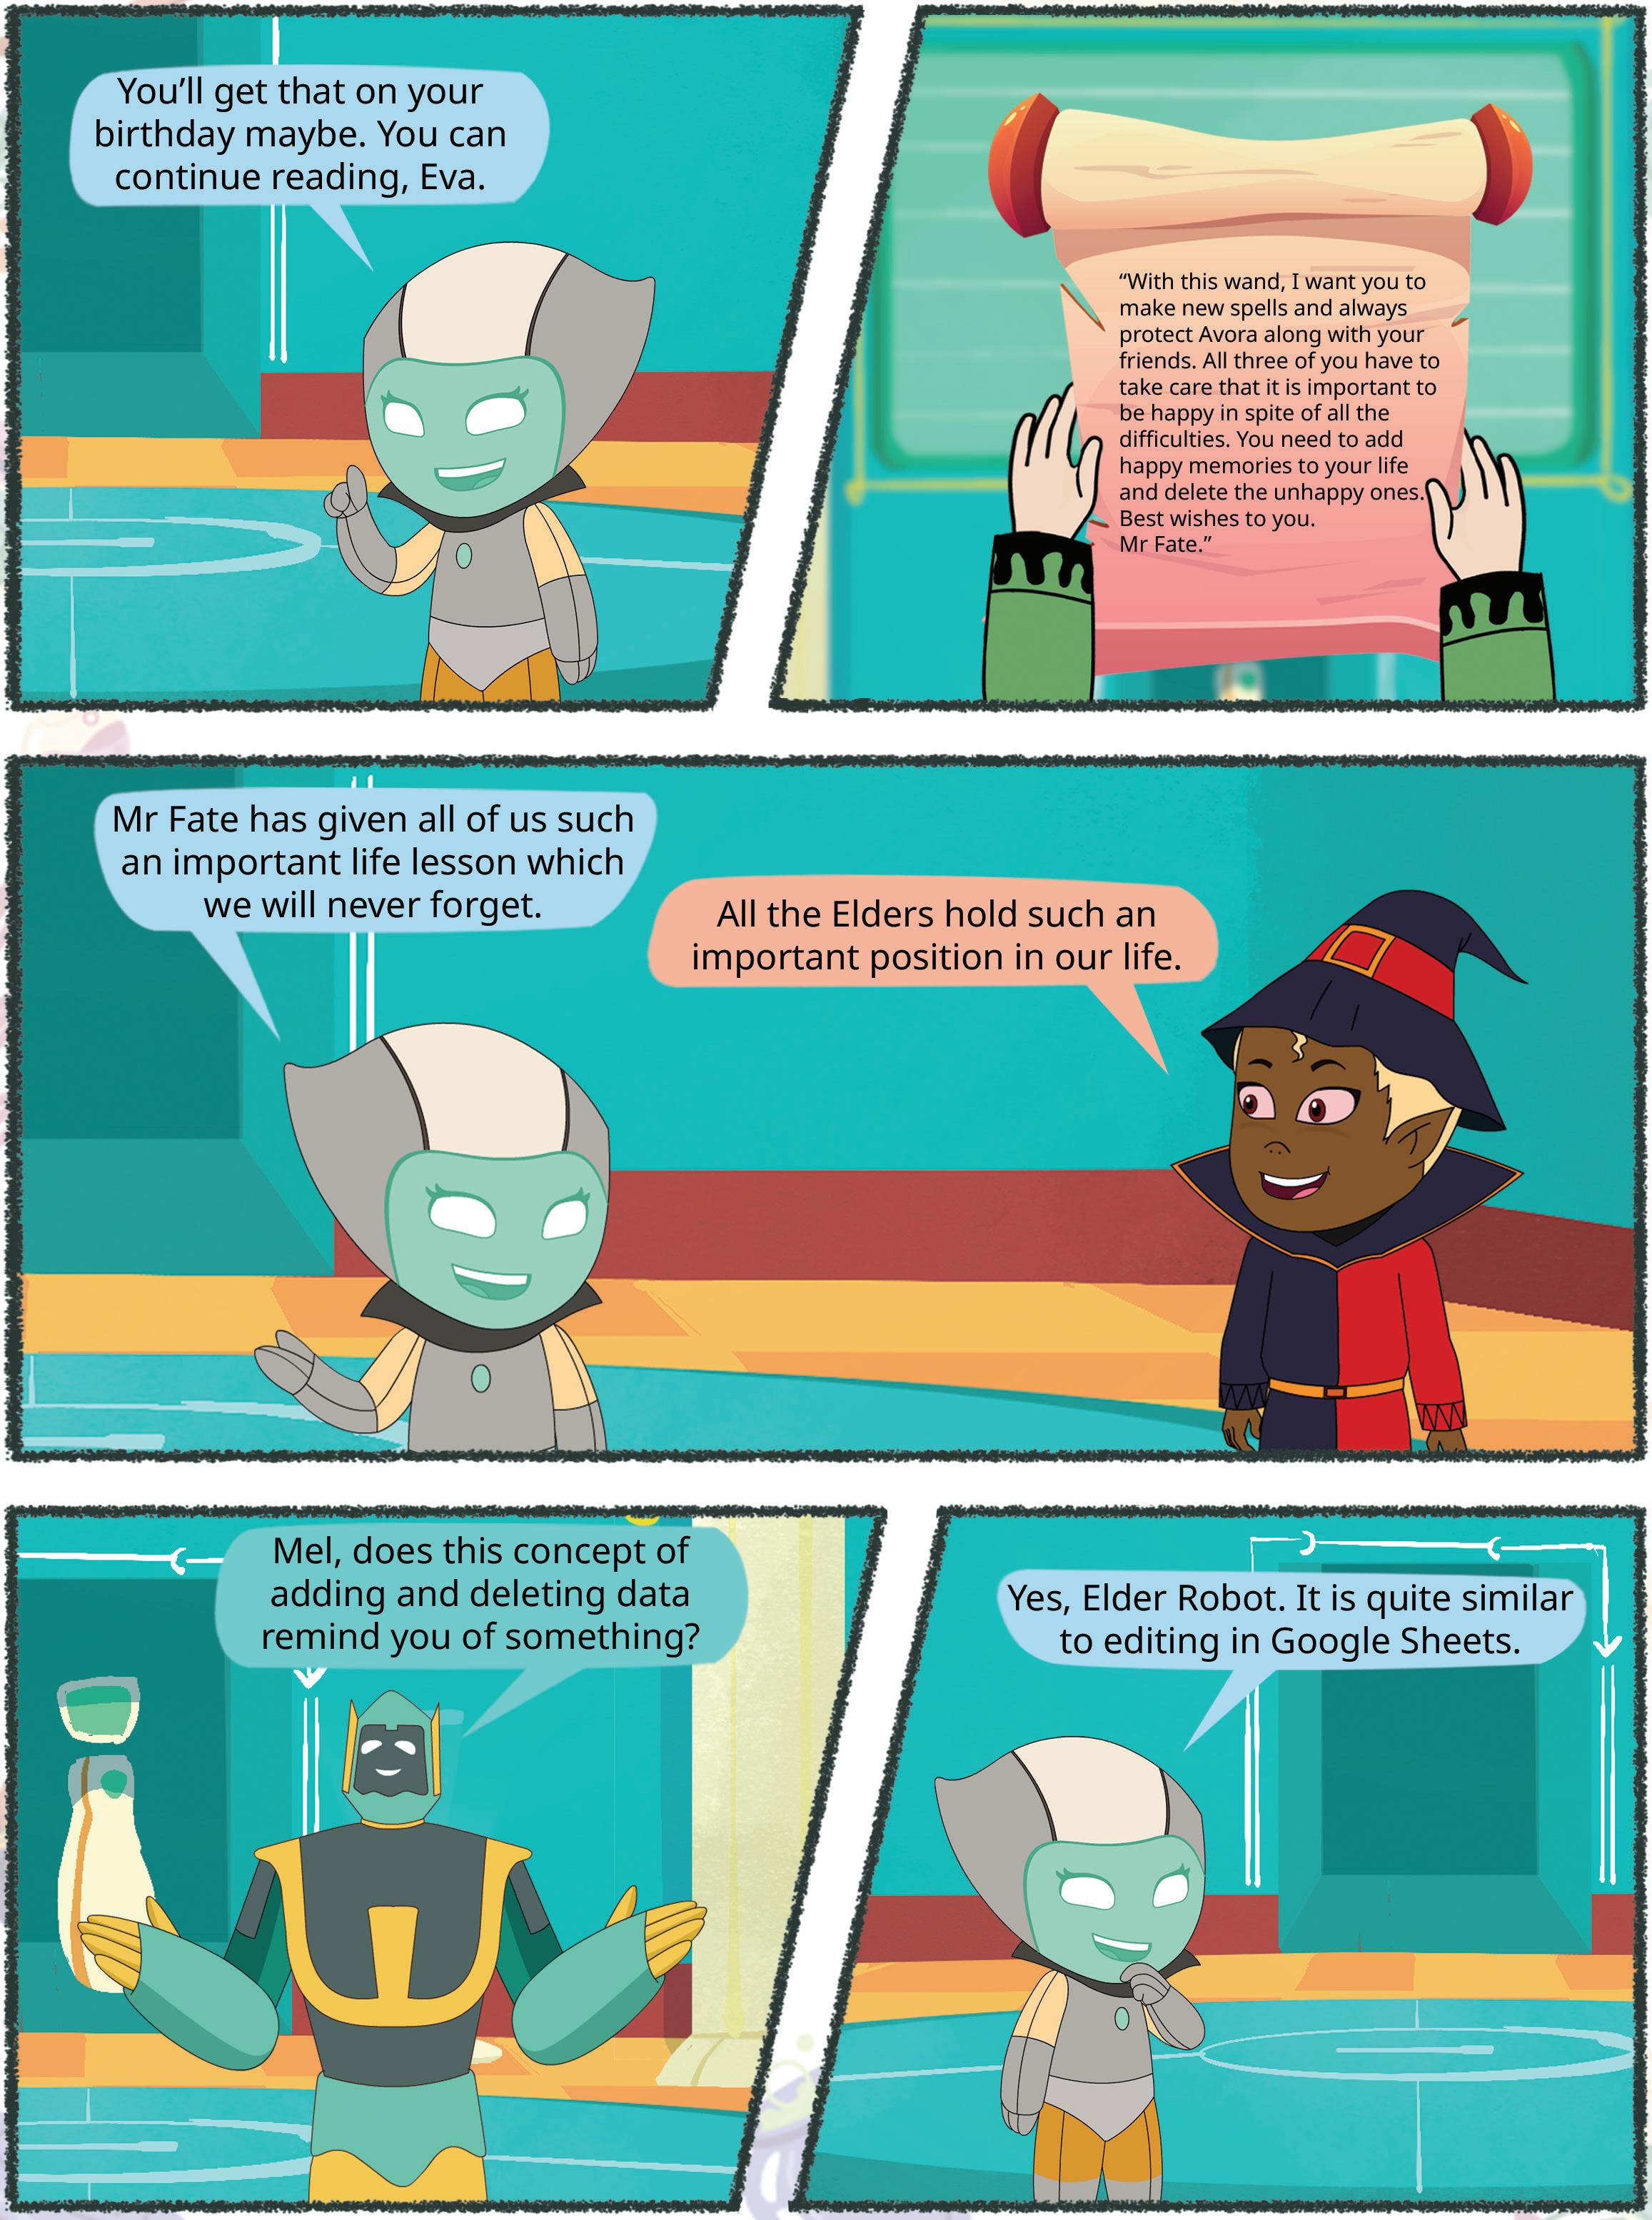
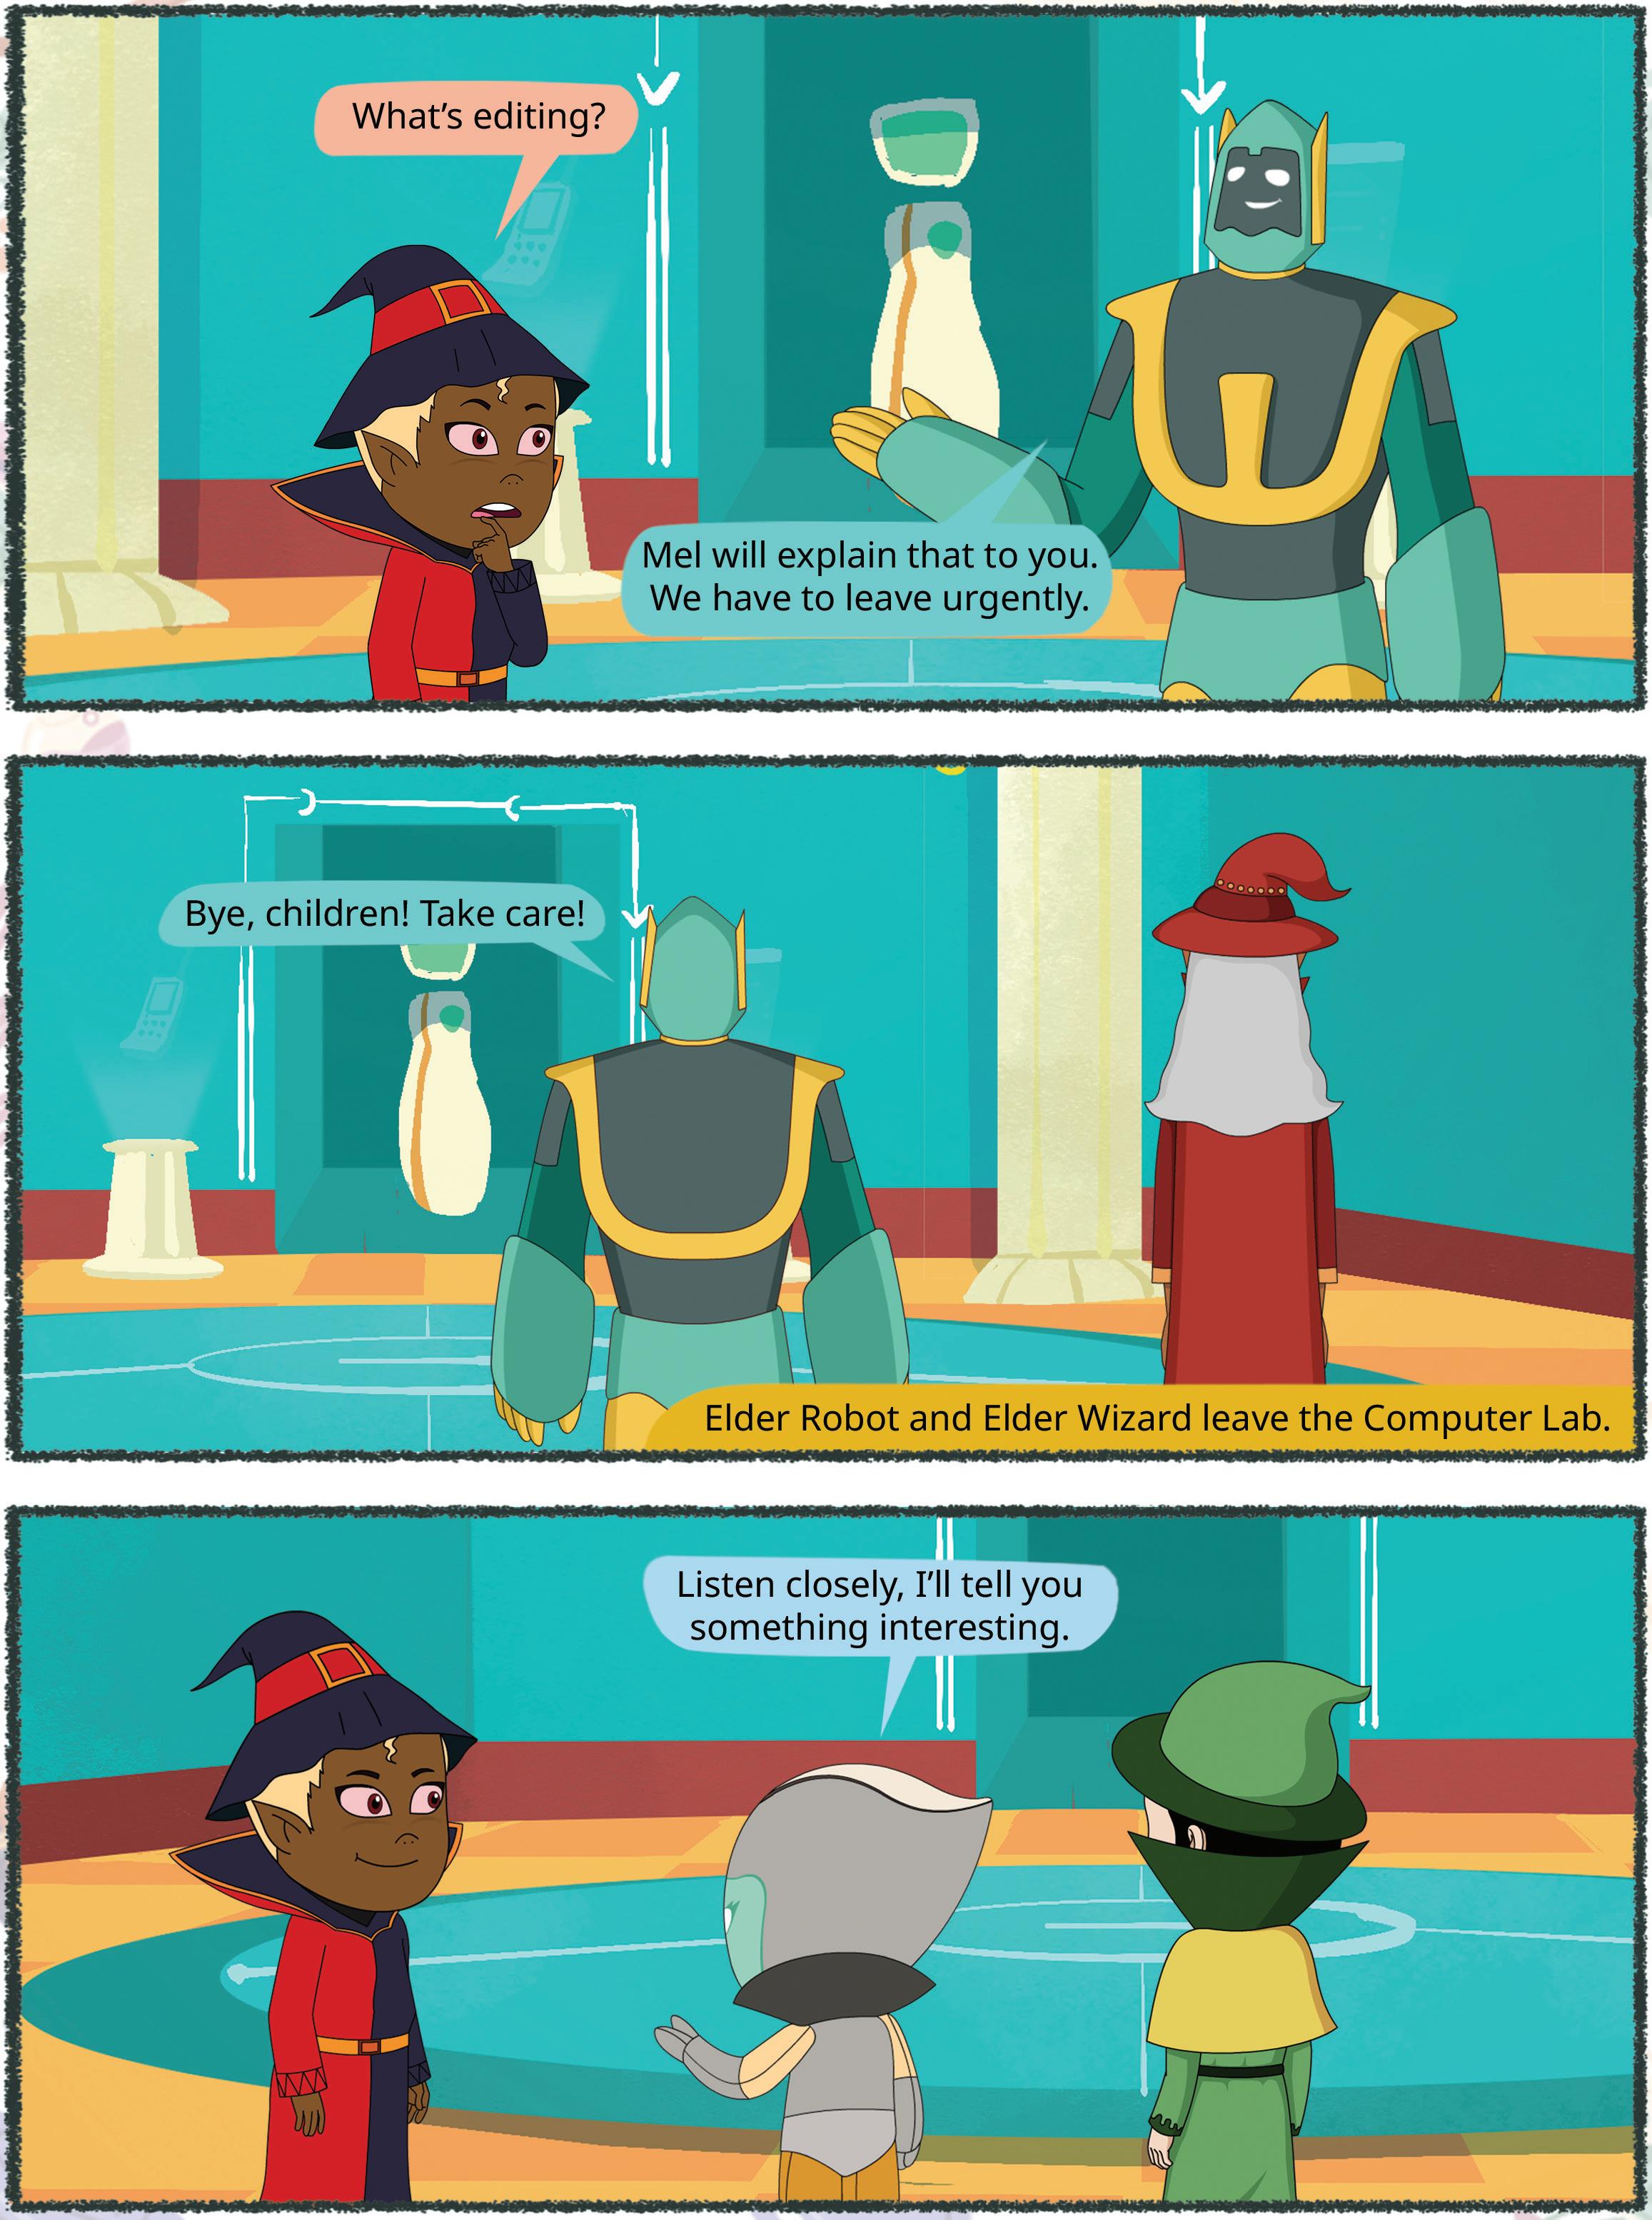
In the previous chapter, you learnt about the most popular spreadsheet application, Google Sheets, which is used to process complicated mathematical calculations. It also allows you to store, organise, and analyse data. You also learnt about components like cells, entering data, and saving a sheet.
Let us continue with the project, Plant Growth Tracker that we created in the previous chapter. Now, you will learn how to select and modify cell content and delete cell data in Google Sheets.
Sometimes, you need to select a cell or a group of cells to perform various operations, such as copying, moving, or deleting.
Steps to select cells in a spreadsheet are as follows:
1. Open Google Sheets containing your data in a browser by using the following link: https://docs.google.com/spreadsheets
Here, we have opened the sheet that was created in the previous chapter.
2. Click on the Select All button, which is located at the top left-hand corner, to select the entire sheet. You can also select the entire sheet by pressing the Ctrl + A keys.
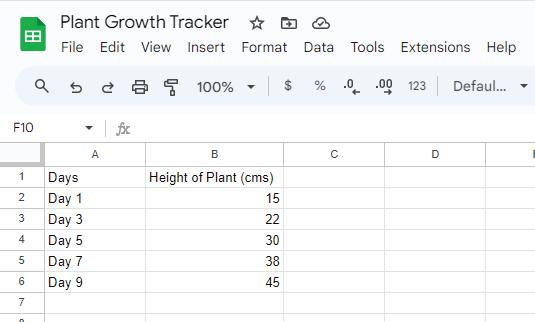
You can select multiple cells at the same time using the Shift + (Up and Down) Arrow keys. Or To select multiple cells using the mouse, click on the first cell and drag your mouse over the cells to be selected. Release the mouse button.
There are three types of data that are mostly used, text, numbers, and date and time. Entering numbers as text refers to a situation where you enter a number in such a way that it is considered text rather than a number. You can do so by adding an apostrophe (‘) symbol before the number.
For example, if you type ‘123 in a cell, the data is considered as text, and the spreadsheet program will treat it as a string of characters rather than a number. By default, text is leftaligned and numbers are right-aligned in a cell.
You can enter the date and time in the selected cell. You can also set the format of the date and time, such as 20/09/2023 or 20-09-2023, according to your choice. By default, the date is right-aligned in a cell.
Follow these steps to change the format of the date:
1. Enter the date values in the third column, that is Column C.
2. Select the cell containing date.
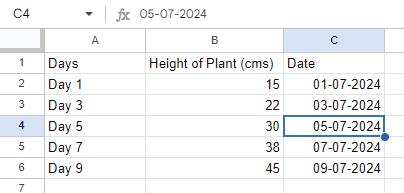
3. Click on the Format menu.
4. Select the Number option.
5. Select the Custom date and time option.
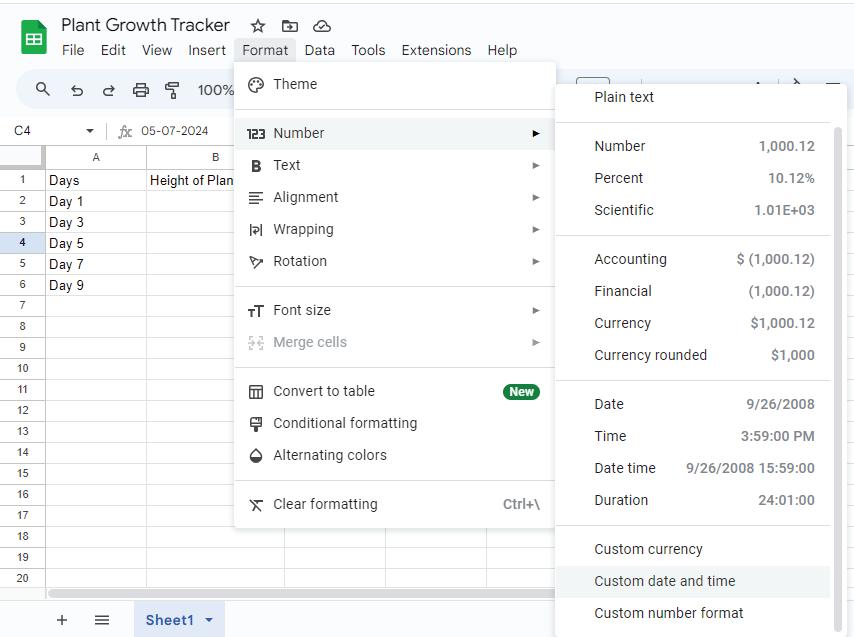
6. The Custom date and time formats dialog box appears. Select the desired date format. Also remove the hyphens from the format using the Delete key.
7. Click on the Apply button. The date format is applied to the selected cell. Similarly, you can change the format in other cells.
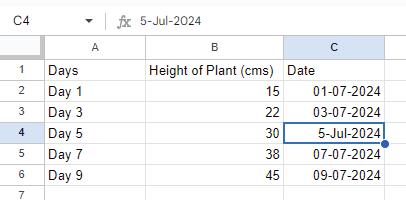
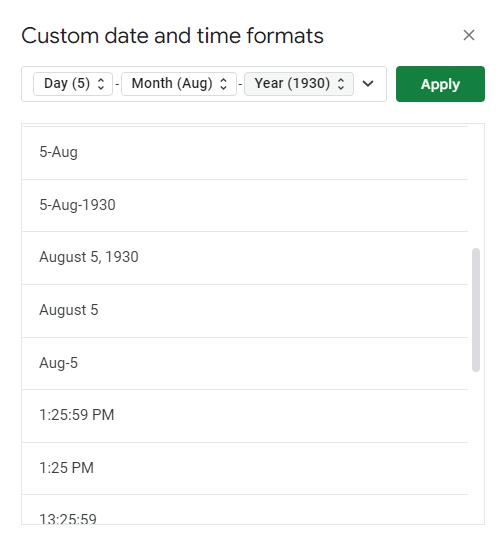
When you enter any character or number in the worksheet, it shows up in both the cell and the formula bar. Simply enter your information and press the Enter key to save it.
Follow these steps to change cell data:
1. Select the cell in which you wish to make a change.
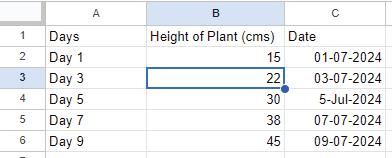
2. Replace with the value you want to enter.
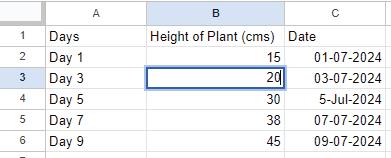
You can see that the amount has been changed.
If you have entered a wrong date, how will you change it?
What is the default alignment of the following in a cell?
a Date
b Number
c Text
When you follow these steps, what action will happen?
a Select the cell data.
b Replace it with another cell.
After you entered and modified data in a cell, it may happen that you want to cancel the changes or retrieve the previous data. For this, you can use the Undo and Redo features in a spreadsheet.
Undo helps you to cancel the effect of the last action that you performed, while Redo helps when you want to reverse the action of the Undo command. It allows you to bring back the data you previously removed or changed.
Follow these steps to use the Undo and Redo features:

1. Click on the Undo icon on the Toolbar. Or You can use Ctrl + Z key combination.
2. Click on the Redo icon on the Toolbar. Or You can use Ctrl + Y key combination.

Do the Undo and Redo features apply only to spreadsheets, or do they apply to other applications as well?
Copying cell data means making an exact duplicate of the data.
Follow these steps to copy cell data:
1. Select the cell or a range of cells whose data you want to copy.
2. Right-click on the selected cell and select the Copy option from the context menu that appears. Or You can also use the Ctrl+C command on the keyboard to copy.
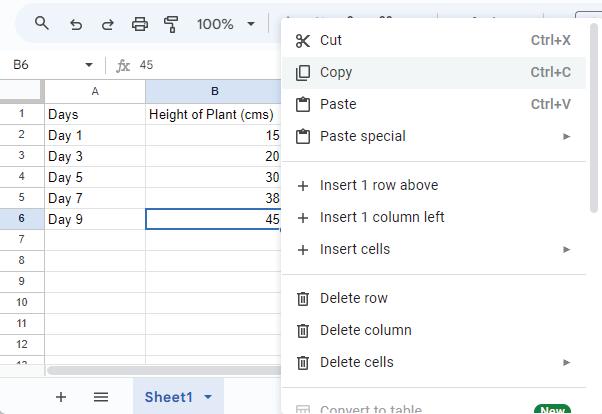
The selected cell’s data is copied and a dotted border appears on the cell that is copied.
3. Right-click on the cell where you want to paste the copied data, and select the Paste option from the context menu that appears. Or You can also use the Ctrl+V command on the keyboard to paste. You can see data is duplicated in another cell.
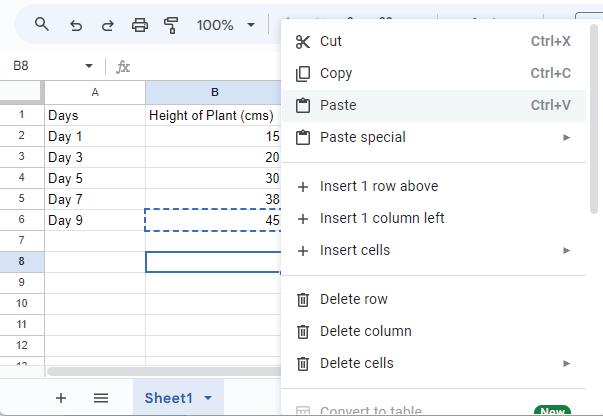
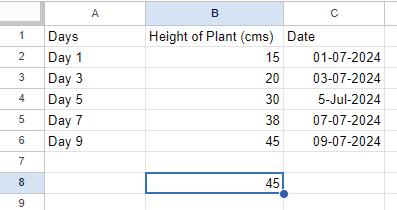
Moving data in spreadsheets refers to the process of relocating data from one cell or a range of cells to another.
Follow these steps to move cell data:
1. Click on the cell or drag to select a range of cells whose data you want to move.
2. Right-click on the selected cell and select the Cut option from the context menu. You can also use the Ctrl + X key combination.
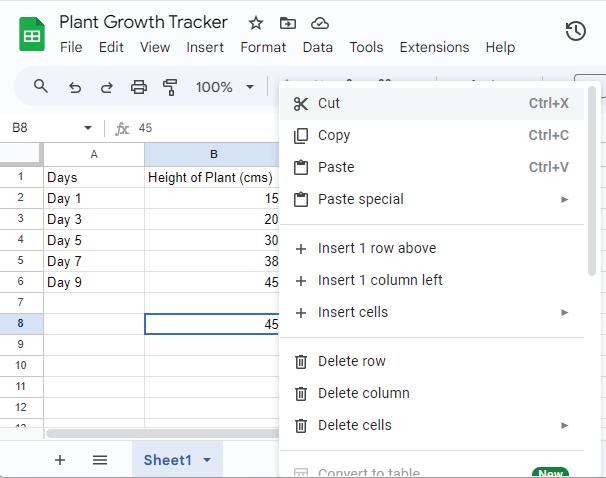
3. Right-click on the cell where you want to move the data and select the Paste option from the context menu. You can also use the Ctrl+V key combination.
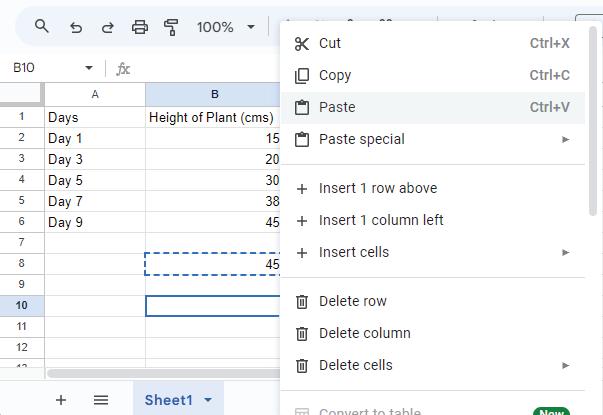
You can see that the data has been moved.
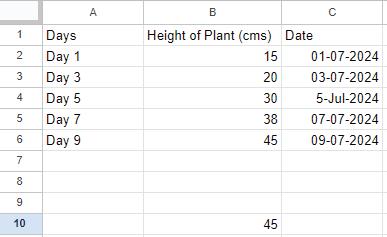
Deleting cell data refers to removing the content that is currently in a cell. This can delete text, numbers, formulas, or any other type of data that is stored in a cell.
Follow these steps to delete data from the cell:
1. Select the cell whose data you want to delete.
2. Right-click on the selected cell and select the Delete cells option from the context menu.
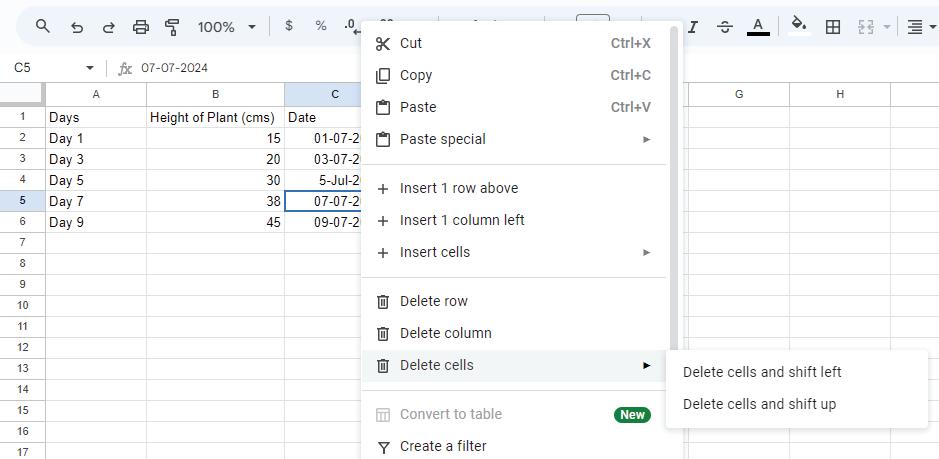
3. Select any option from the Delete cells menu and choose how the other cells around will move after you delete.
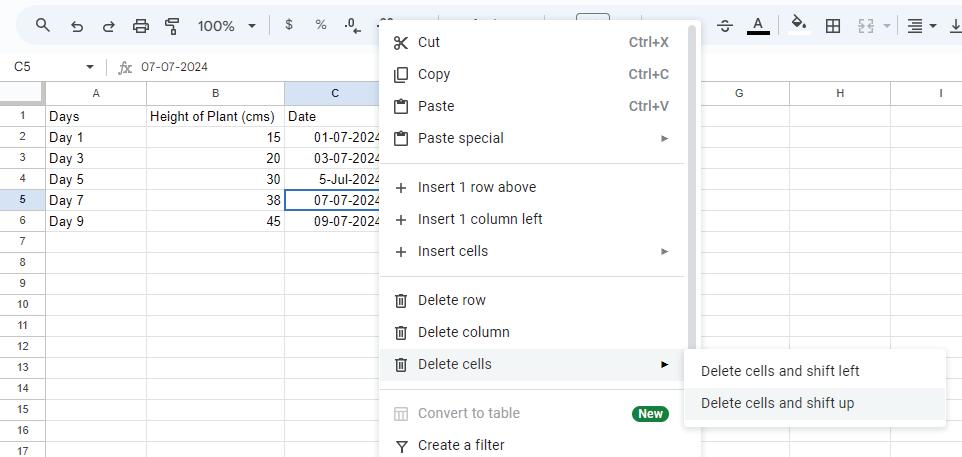
3 You can also delete the cell data by pressing the Delete key on the keyboard.
You can see that the date has been deleted.
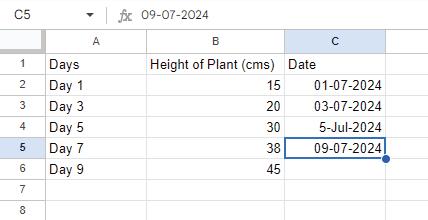
Match the following shortcut keys. Column A
How do you move data from one cell to another?
+ Y
+ C
+ Z
+ V
Google Sheets allows you to perform complex mathematical calculations and efficiently organise and analyse data.
Sometimes, you need to select a group of cells for operations like copying, moving, or deleting.
Entering numbers as text refers to a situation where you enter a number in such a way that it is considered as text rather than a number.
You can set the date format according to your choice, such as 20/09/2023 or 20-09-2023.
Undo helps you go back if you make a mistake or change your mind, while Redo helps when you want to reverse the action of the Undo command.
Copying cell data means making an exact duplicate of the data.
Moving data in spreadsheets refers to the process of relocating data from one cell or a range of cells to another.
Deleting cell data means removing content from a cell, which can be text, numbers,or formulas.
A. Fill in the blanks.
Hints
Enter copying Ctrl + A text Undo
You can select the entire sheet with the use of keys.
The is a type of data used in a spreadsheet.
When you want to correct your mistake, use the feature. data means making an exact duplicate of the data.
After entering data in a cell, you can press the key to move to the next row.
B. Tick () the correct option.
What is the purpose of selecting cells in a spreadsheet?
a To perform complex mathematical calculations
b To organise and analyse data
c To enable operations like copying, moving, or deleting data
d All of these
Which of the following is not a type of data in Google Sheets? a Number
Which combination key is used to undo the mistakes? a Ctrl + V
Ctrl + A
and Time
Ctrl + C
What does the Redo feature in a spreadsheet allow you to do?
a Correct mistakes or changes
c Create a duplicate of data
Ctrl + Z
b Reverse the action of Undo
d None of the above
Which of the following key combinations allow you to select multiple cells at the same time?
a Shift + (Up and Down) Arrow keys b Ctrl + (Up and Down) Arrow keys
c Tab + (Up and Down) Arrow keys d None of these
C. Who am I?
I am a button in Google Sheets, to select all cells in a spreadsheet.
I am responsible for relocating information within a spreadsheet.
I let you duplicate information from one place to another within a spreadsheet.
I am an option in the Format menu to change the format of a date.
I am the key on the keyboard used to remove cell data.
D. Write T for True and F for False.
A dotted border appears on the cell that is copied.
Deleting cell data can include removing text, numbers, formulas, or any type of data.
You can customise the format of the date and time in Google Sheets.
Redo button reverses the action performed by the Undo button.
The Paste option is used to remove data from the cell.
E. Answer the following questions.
What are the two options for deleting cells?
What are the two ways to select multiple cells?
What happens when you enter a number as text in a cell?
Write the shortcut keys involved in moving cell data.
F. Apply your learning.
Anita is making a list of books for her teacher with titles, authors, and genres. By mistake, she entered the wrong name for the author. Which feature will help her fix it in the spreadsheet?
You have been given the task of creating a date sheet for your school exams. You write down the various dates on which the exams for different subjects are conducted. Name the menu that you will use in order to change the format of the dates.
You have some information in one cell that you want to shift to a different cell. What action do you take to do this?
The data entry operator entered the same section for Ritu Gupta and Satish Pandey. The correct section for Ritu Gupta is B. How would you correct this in the spreadsheet?
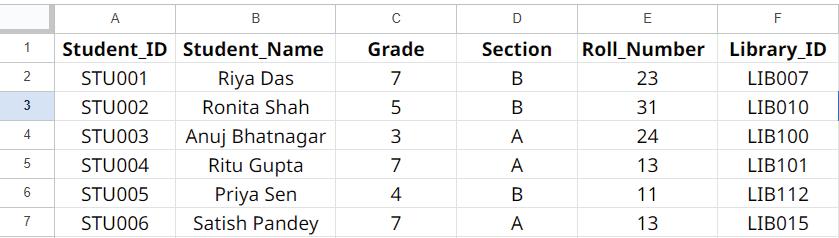
In the above sheet, you made some changes, but now you want to revert to the previous state. How would you do that?
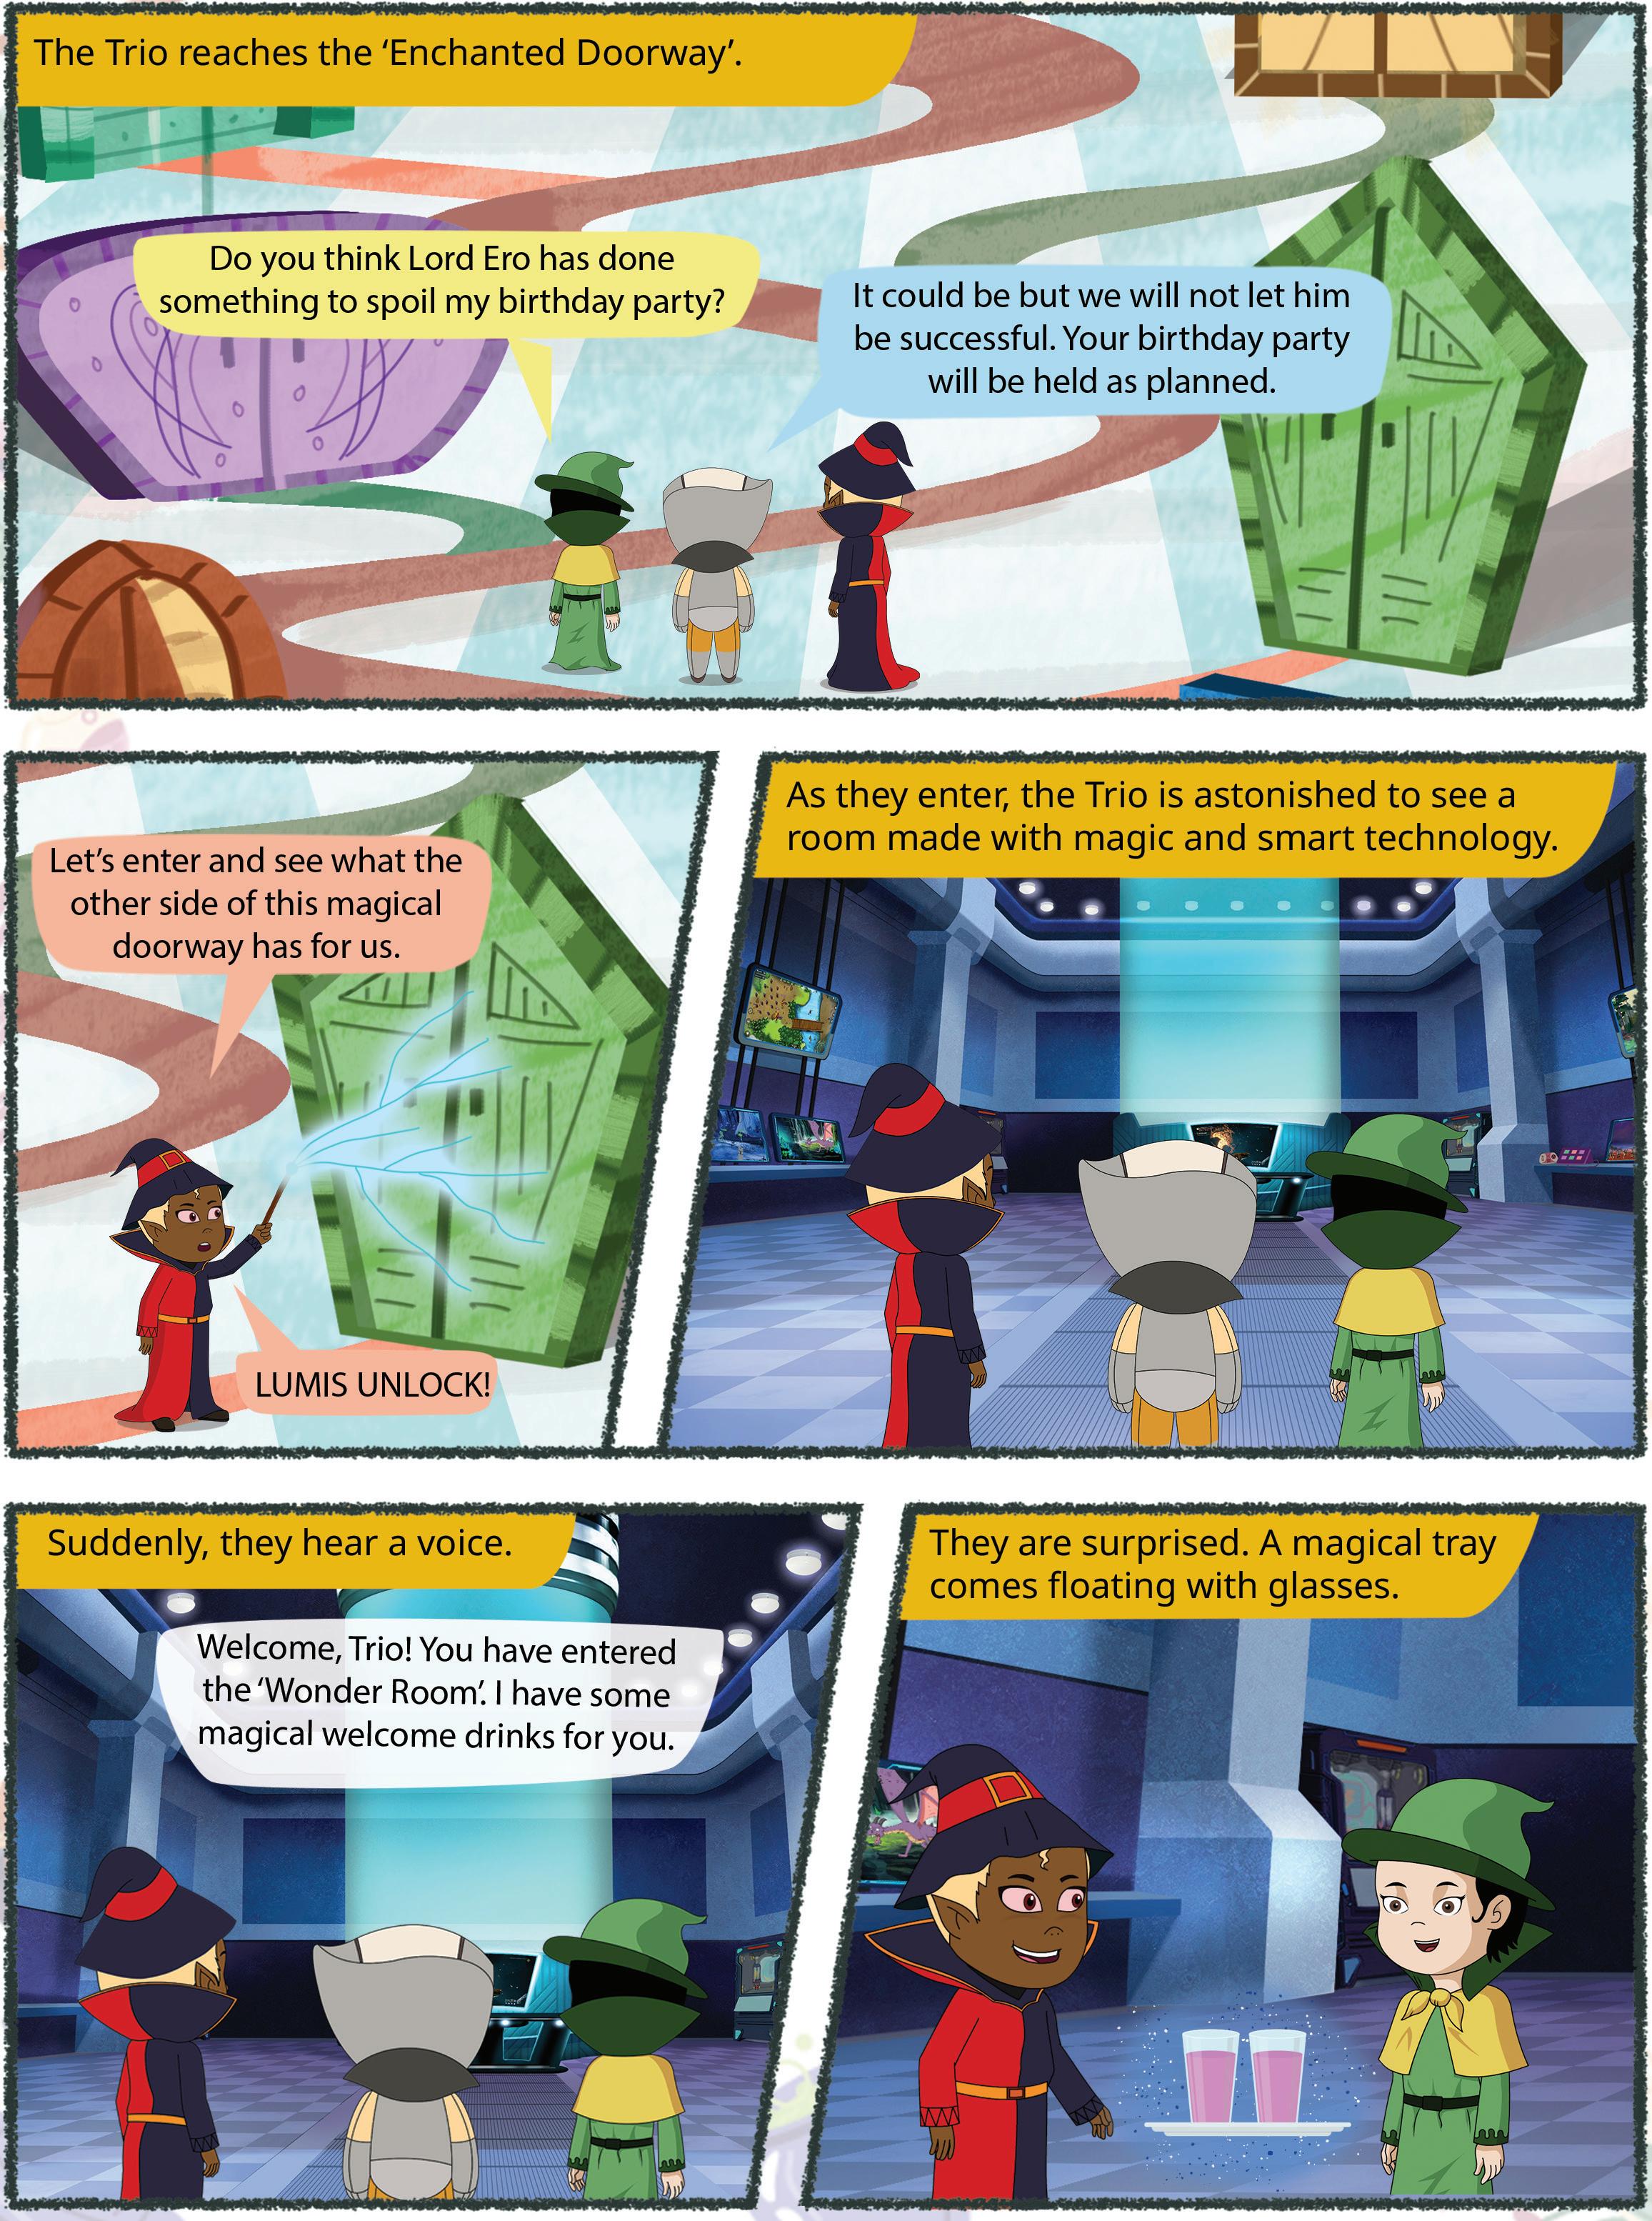
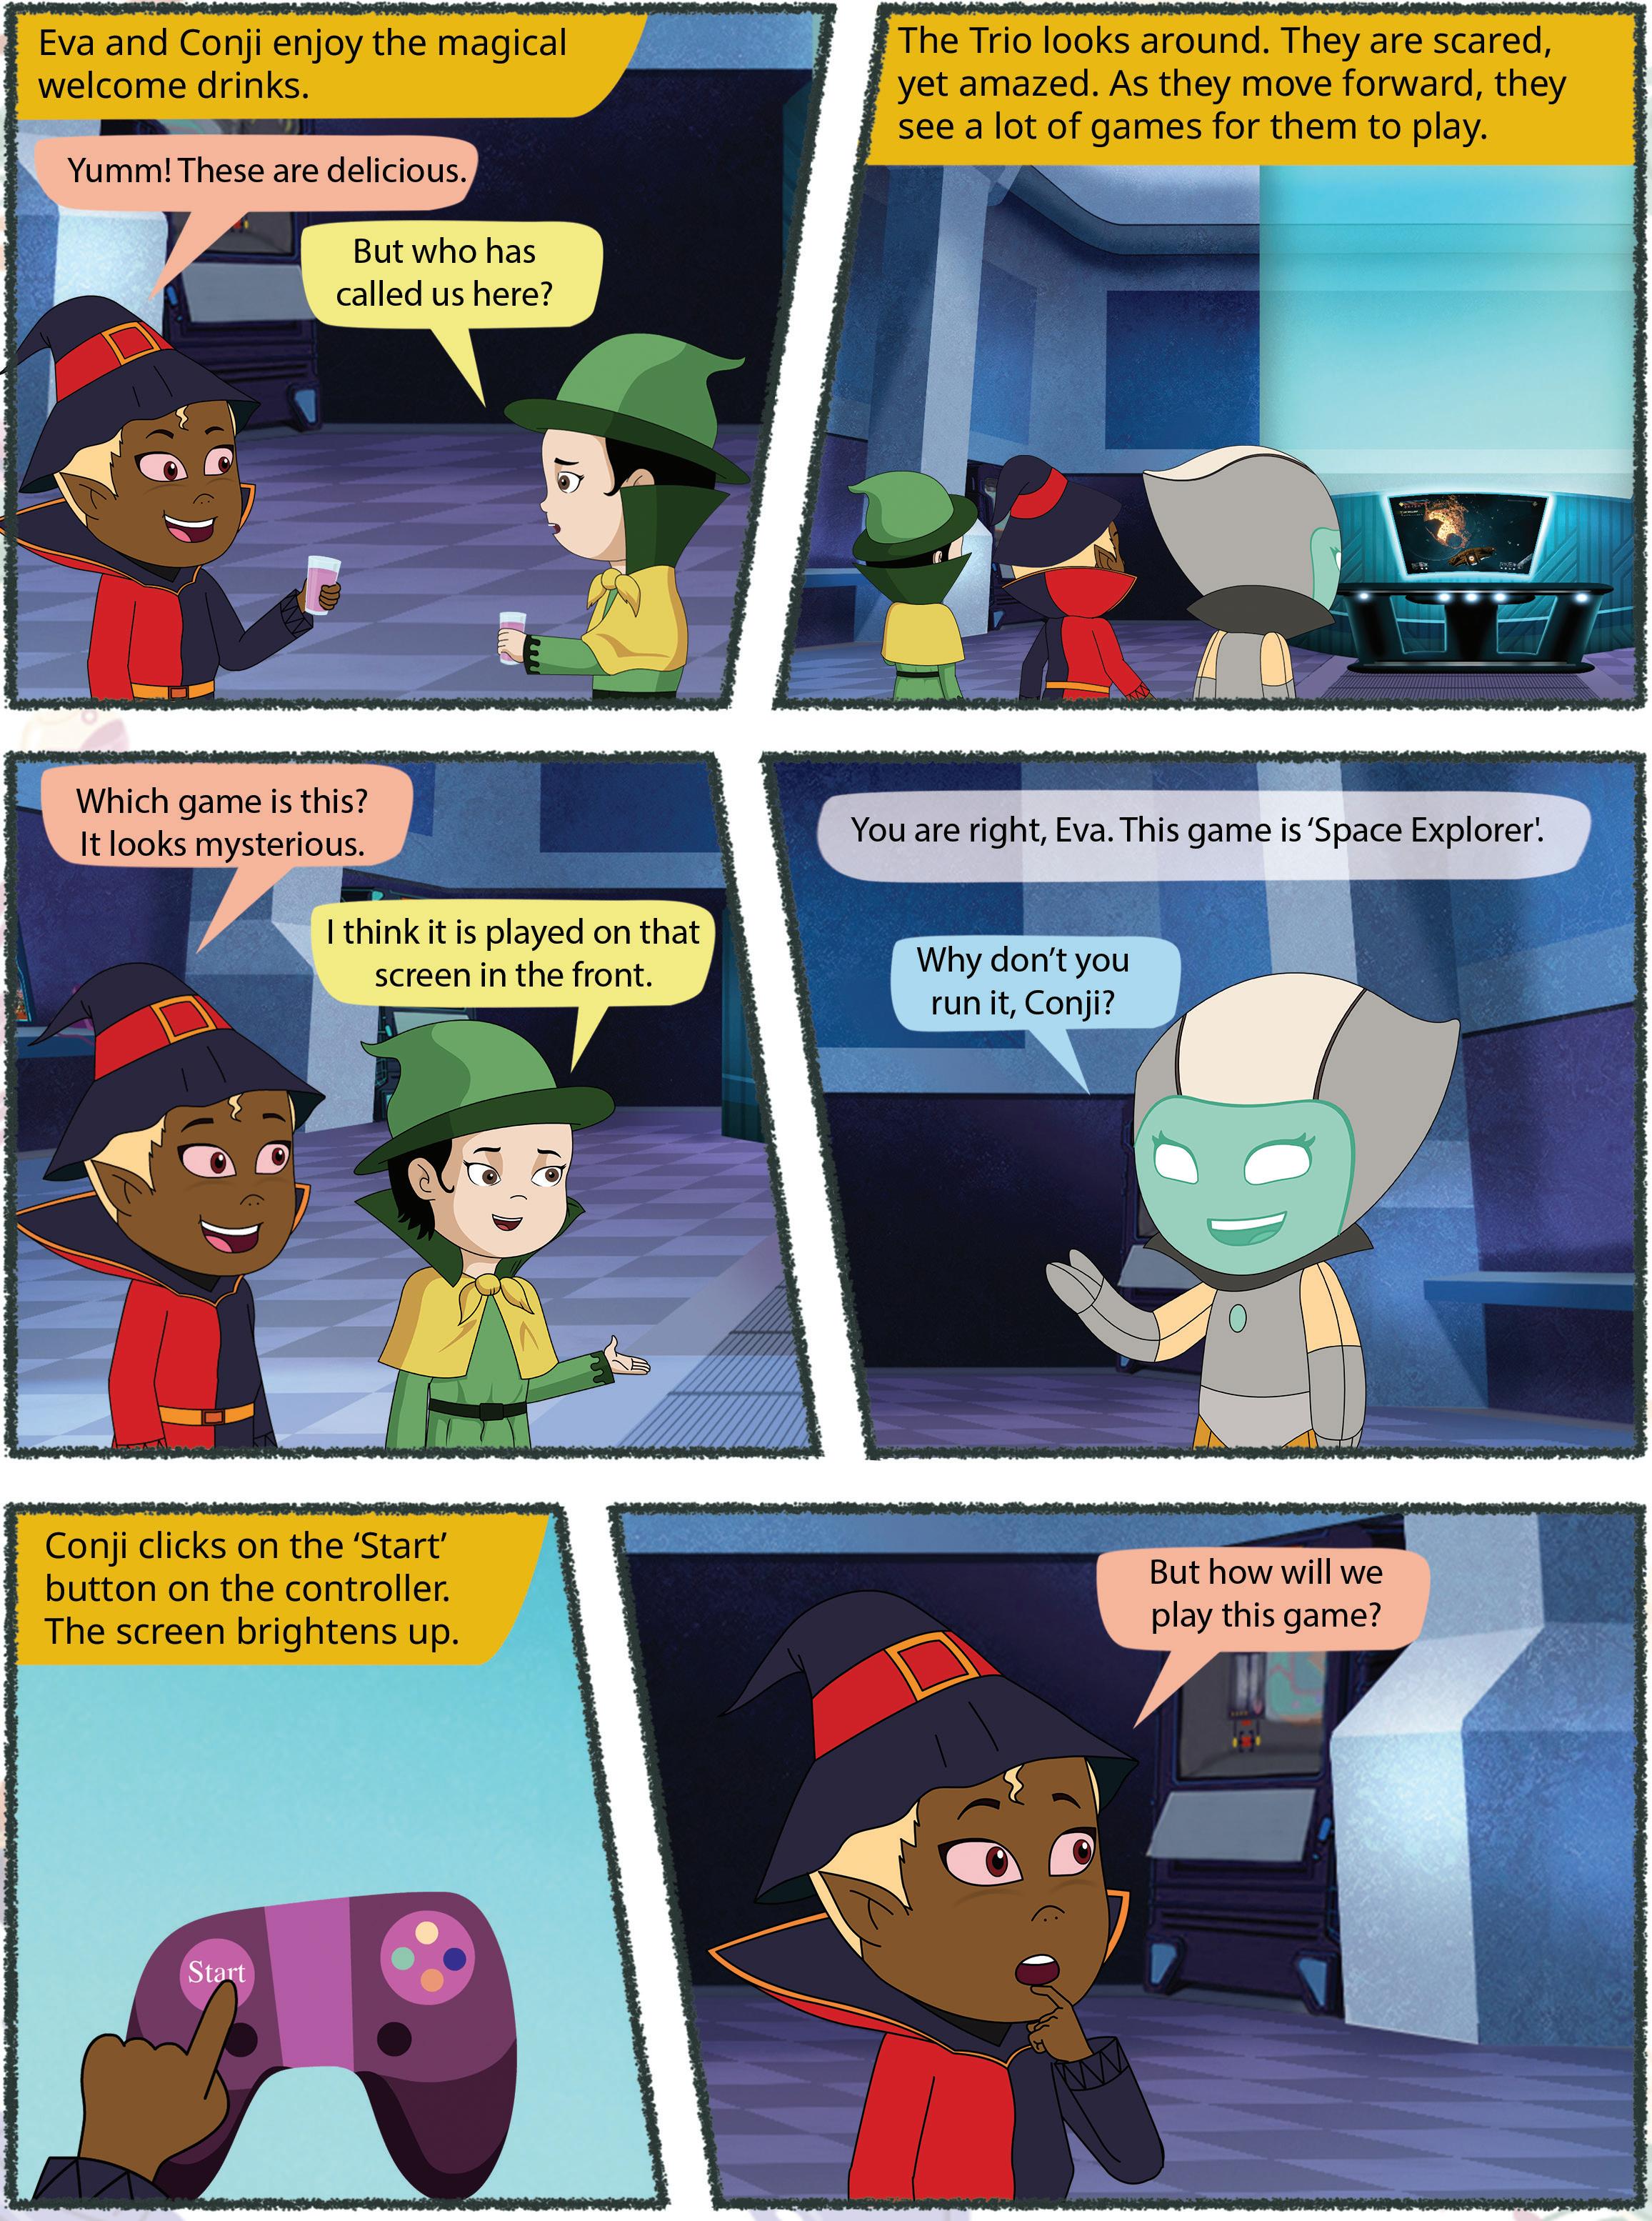
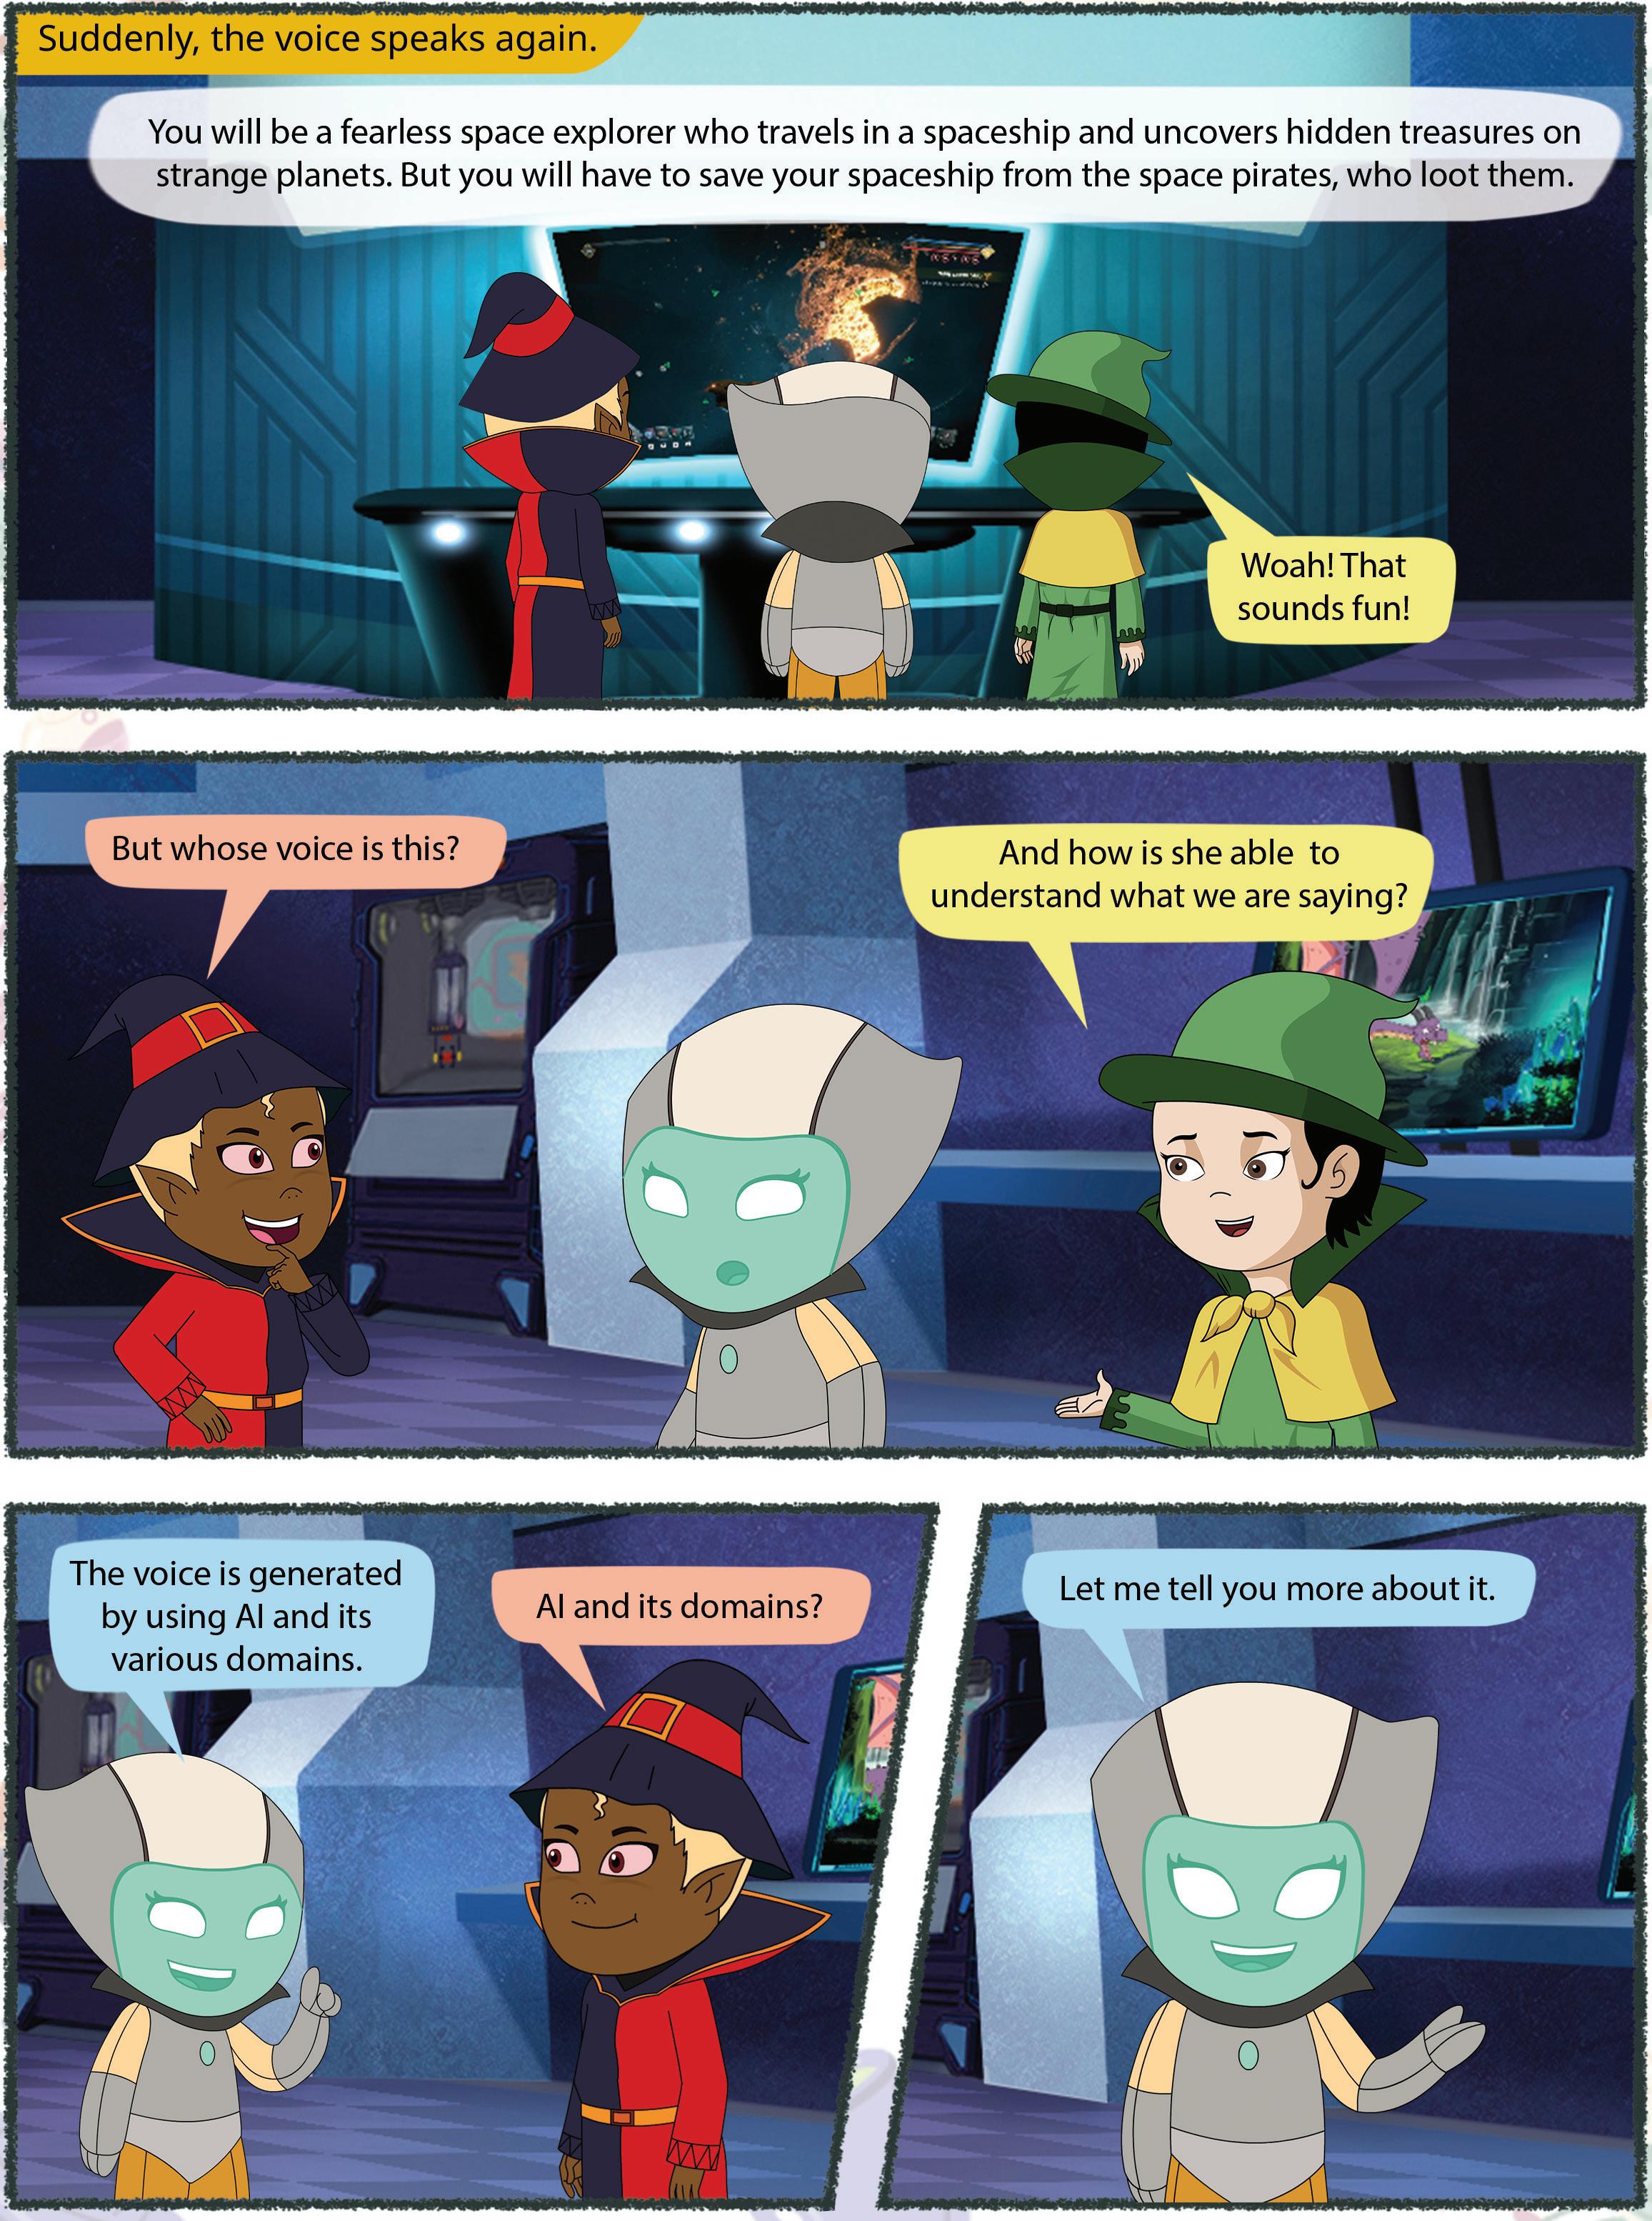
What do you think of when you hear or read the word ‘intelligence’? Mostly, you may think of the smartness within humans. But did you know that these days, even machines have a built-in form of smartness?
For example, when Google Maps shows you the shortest route to your home; or when streaming platforms, like Netflix or YouTube, gives you recommendations based on your viewing history.
Have you ever wondered where these technologies get their intelligence from? This is where Artificial Intelligence, or AI, comes into the picture. AI enables machines to be smart, solve problems, and handle various tasks automatically.
Just like how we use our intelligence to do everyday tasks and become better at them, similarly, machines become increasingly smart thanks to Artificial Intelligence (AI).
AI can be defined as a branch of computer science concerned with creating intelligent machines that can learn from data, solve problems, and make decisions.

It involves the study of principles, concepts, and technologies that enable machines to exhibit human-like intelligent behaviour.
AI involves using special programs and techniques that enable computers to learn and perform the tasks. AI gives machines the ability to think smartly, solve issues, and perform a variety of activities.
John McCarthy, who is regarded as the father of AI, defined AI as “the science and engineering of making intelligent machines.”
AI can help computers play sports like chess, recognise faces in pictures, respond to our voice commands, etc. AI is basically an umbrella term that has different domains or areas where it can be used. The three main domains of AI are Data Science, Computer Vision, and Natural Language Processing (NLP). Let us learn about these domains.
Data is a collection of raw facts that can be transformed into useful information. It can be in the form of text, images, audio, or video. Data science is a vast and interdisciplinary field that involves extracting knowledge and insights from data.
AI enhances computer performance by learning from data. The more the data, the more intelligent the machine becomes. AI can process and analyse data, and identify patterns, and trends based on its goals. For example, when you play games online, AI applies what it has learnt to make the game more fun and challenging.
Across various industries, data science provides valuable insights that can help you in making strategic decisions. Here are some examples:
Marketing: Understanding customer demographics, preferences, and online behaviour allows companies to develop targeted marketing campaigns and optimise their marketing budget.
Public Health: Analysing disease outbreaks and tracking vaccination rates helps public health officials make informed decisions about resource allocation and disease prevention strategies.
Scientific Research: Data science allows researchers in various fields to analyse massive datasets, leading to new discoveries and advancements in medicine, material science, and other areas.
Compare Prices Online: There are various websites which help you compare the prices of numerous items from different web stores. These sites use extensive datasets to provide the convenience of comparing product prices across multiple vendors in one place. Some examples include PriceGrabber, PriceRunner, Junglee, Shopzilla, and DealTime.
Let us perform the following experiment to understand how AI learns from data.
Objective: Tic Tac Toe game is an interactive online game based on data for AI where the machine tries to predict the next move of the participant by learning from their previous moves. It is a digital translation of the classic Xs and Os game played on a 3x3 grid. In this game, two players take turns to mark the spaces with either an X or an O. The one who creates a line of three with these symbols either horizontally, vertically, or diagonally on the grid wins the game.
Follow the given steps to explore how this application works.
1. Visit the link: https://www.google.com/fbx?fbx=tic_tac_toe
2. The following window appears.
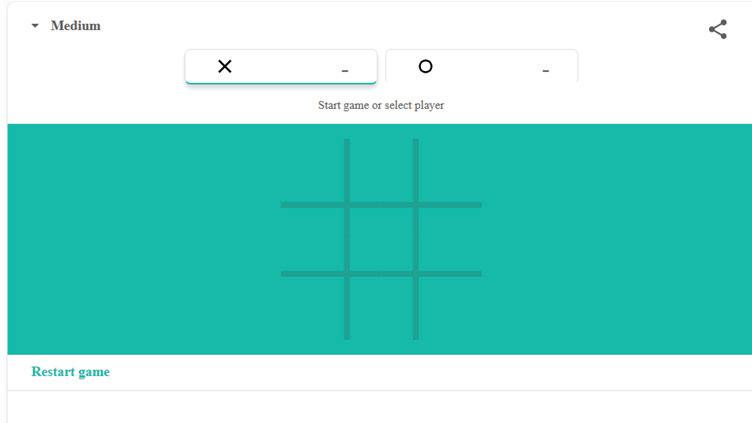
3. Select either ‘X’ or ‘O’ as your input move for the game. Here, we have selected ‘X’, and the AI game makes ‘O’ in the grid to make a counter move.
4. Continue the game until three Xs or three Os are drawn in a row, column, or diagonal.
5. If you win the game, the following screenshot will depict your victory.
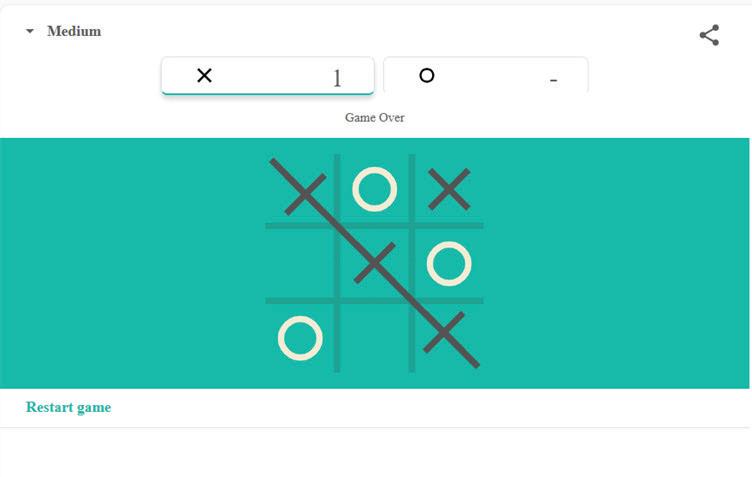
Computer Vision is another important domain of AI which uses cameras to see and understand visual information.
By using cameras to monitor the environment and keep an eye on the activity at the front door, a smart home security system makes use of computer vision. It detects familiar faces to unlock the door for family members and send alerts for unfamiliar faces.
Computer vision has numerous applications across various fields. Some of the most common applications include:
Autonomous Vehicles: Computer vision enables vehicles to perceive and understand their surroundings, identifying objects like pedestrians, traffic signs, and other vehicles to navigate autonomously.
Healthcare: In medical imaging, computer vision aids in diagnostics by analysing images from X-rays, MRIs, and CT scans to detect anomalies and assist medical professionals in making accurate diagnoses.
Retail: Computer vision powers applications, such as automated checkout systems and Google Lens, in which cameras identify and track items selected by shoppers, enabling seamless transactions without the need for manual scanning.
Security and Surveillance: Video surveillance systems use computer vision to monitor environments in real-time, detecting suspicious activities, recognising faces, and alerting authorities to potential threats.
Let us perform the following experiment to understand how AI uses computer vision to see and understand things.
Objective: AutoDraw is a fun and free online drawing tool based on computer vision. It uses AI to guess your drawing and provides suggestions to turn your scribbles into complete drawings.
Follow the given steps to explore how this application works.
1. Visit the link: https://www.autodraw.com/
2. The following window appears.
3. Click on the Start Drawing button.
4. Now, select the AutoDraw tool from the left panel.

5. As soon as you begin to scribble in the drawing area, the AutoDraw tool will make use of computer vision to guess your drawing.
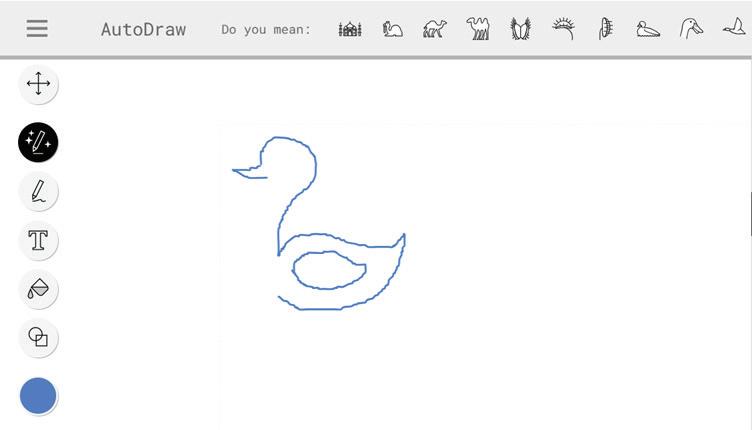
6. Choose the drawing from the list of suggestions provided in the top bar that most closely resembles the one you plan to create.
7. You may further customise your drawing by using the Shape tool to draw a circle for the eyes and fill in colours using the Fill tool.
Natural Language Processing (NLP) is a domain of AI that enables computers to understand human language and generate appropriate responses when we interact with them.
It allows computers to talk to us in a way that feels natural to us. Popular examples of NLP applications include Google Assistant, Siri, Alexa, Google Translate, etc.
Natural Language Processing (NLP) has several key applications across different domains. Here are some of the common applications:
Language Translation: NLP is used extensively in translation applications like Google Translate, where it processes and translates text from one language to another, preserving context and meaning.
Sentiment Analysis: NLP techniques analyse text data to determine the sentiment or opinion expressed. This is used in social media monitoring, customer review analysis, and market research to gauge public opinion and sentiment towards products or brands.
Chatbots and Virtual Assistants: NLP powers chatbots and virtual assistants like Siri, Alexa, and chat interfaces on websites. These systems understand and generate human-like responses to user’s queries, providing information, assistance, and helps in performing tasks.
Information Extraction: NLP is used to extract structured information from unstructured text sources such as documents, articles, and emails. This includes named entity recognition (identifying names of people, organisations, and locations) and relationship extraction, which aids in tasks like summarisation and knowledge base construction.
Let us perform the following experiment to understand how AI makes use of NLP.
Objective: Wordtune is an AI-powered writing assistant that helps users improve their writing in various ways. It suggests alternative ways to phrase sentences, offer synonyms and different sentence structures, and maintain the original meaning. When prompted, Wordtune can generate additional text to elaborate on ideas and create new content that aligns with the existing text.
Follow the given steps to explore how this application works.
1. Visit https://www.wordtune.com/ in your web browser.
2. The following window appears. Click on the Get started button.

3. You will be prompted to sign in with your Google, Apple, or Facebook account. Choose any option and login to the portal.
4. Next, you will be asked about your purpose for using the Wordtune portal. You can select “Study”.
5. Select the language by entering your preferred language.
6. The Wordtune portal opens. You have two options:
o Copy and Paste: Copy the text you want to improve and paste it into the large text box on the Wordtune homepage.
o Write Directly: You can directly write your text in the text box if you have not already copied it.
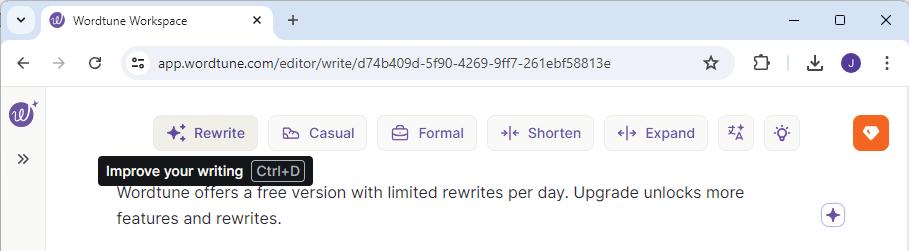
7. If you want to adjust the writing style, choose from options like “Formal,” “Casual,” “Informative,” etc., located above the text box.
8. Click on the blue “Rewrite” button on the right side of the text box.
9. Wordtune will display your original text alongside several suggestions for rephrased sentences or expanded text (depending on your input).
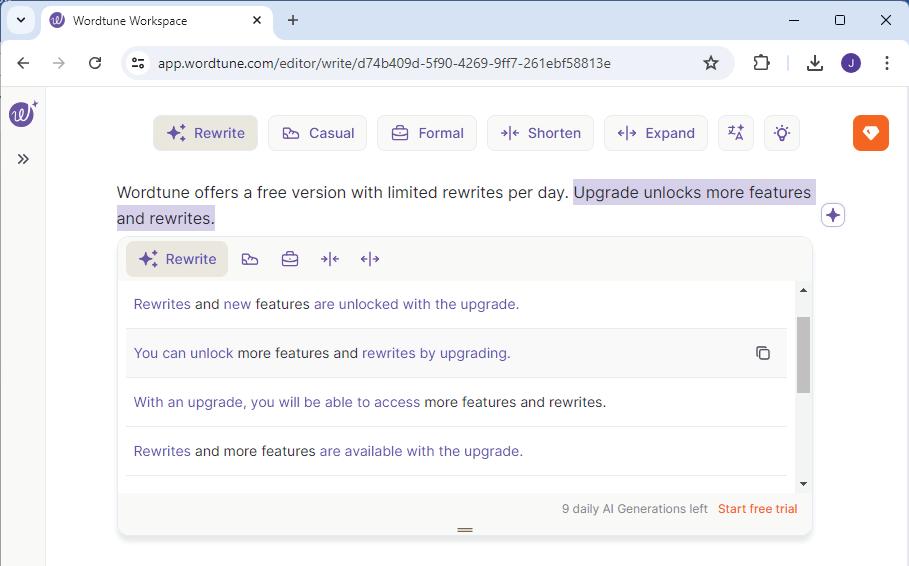
10. Click on the suggestion you prefer to see it replace the original text in the main text box.
11. Once you are happy with the revised text, you can copy it to your clipboard or download it as a document.


Solve the given crossword puzzle with the help of given hints.
2 I am the collection of raw facts.
4 I am the type of intelligence that machines have.
6 I am a domain of AI that enables computers to understand human language.
1 I am a fun and free online drawing tool based on computer vision.
3 I am a vehicle that drives on its own.
5 I am a domain of AI which uses cameras to see.
1 Being intelligent means being good at learning, problem-solving, thinking, remembering, communicating, and making choices.
2 Artifical Intelligence (AI) is a concept that gives computers the ability to think like humans.
3 Machine learning is a subset of AI that enables machines to improve at a task with experience.
4 Deep learning is a subset of machine learning in which a machine is trained with vast amounts of data.
5 Data is a collection of raw facts that can be transformed into useful information. It can be in the form of text, images, audio, or video.
6 Computer vision is how AI uses cameras to see and understand visual information.
7 Natural Language Processing (NLP) is a domain of AI that enables computers to understand human language and generate appropriate responses when we interact with them.
A. Fill in the blanks. Hints John Mccarthy Google Lens artificial intelligence computer vision
1 is a concept that gives computers the ability to think like humans.
2 is a domain of AI that uses cameras to see and understand things.
3 is regarded as the father of AI.
4 is an image and text recognition app developed by Google.
B. Tick () the correct option.
1 Which of the following is a domain of AI?
a Computer Vision b NLP
c Data d All of these
2 Which among the following is a trait of AI?
a Common Sense b Emotions
c Computational Power d Fatigue
3 is a collection of raw facts that can be transformed into useful information.
a Data b Deep Learning
c Machine Learning d NLP
4 Which among the following is an application of NLP?
a Google Lens b Alexa
c Google Sheets d AutoDraw
5 is a domain of AI which uses cameras to see and understand the visual information.
a Computer Vision b NLP
c Machine Learning d Deep Learning
C. Write T for True and F for False.
1 AI can help recognise faces in pictures.
2 AI learns from data fed into algorithms.
3 Computer vision helps computers understand and respond when we talk to them.
4 NLP techniques analyse text data to determine the sentiment or opinion expressed.
D. Answer the following questions.
1 Define Artificial Intelligence.
2 What is Natural Language Processing?
3 What is computer vision?
4 Define data.
E. Apply your learning.
1 Yash recently installed a smart home security system that uses facial recognition technology to enhance home security. Name the domain of AI that this security system uses.
2 Megha is traveling with her father in a self-driving car and she wonders how the car effortlessly detects lanes, pedestrian crossings, and other vehicles on the road. What should her father explain to her about the technology behind these capabilities ?
3 Utkarsh is using Siri, the virtual assistant developed by Apple, to accomplish various tasks on his iPhone. He is amazed at how Siri understands his commands and responds effectively. Name the AI domain that empowers Siri to achieve this level of functionality.
A. Fill in the blanks.
1 is considered one of the first mechanical and automatic calculator.
2 Wireless connections use waves to transmit data between devices and a router.
3 is the vertical distance between the top and bottom borders of a row in a table.
4 determine how your content, such as titles, text, and images, is organised on the slide.
B. Tick () the correct option.
1 Which of the following is a manually-operated calculating device developed by John Napier?
a Abacus
b Pascaline
c Leibniz wheel d Napier’s bones
2 Which type of connection is used by mobile phones?
a dial-up
b cellular
c wired d satellite
3 To move to a previous cell in a table, which key combination is used?
a Shift + Enter
c Ctrl + Tab
b Shift + Tab
d Ctrl + Enter
4 What is the purpose of the Master Slide in Google Slides?
a Add images to slides
b Change font size
c Change appearance of entire presentation d Add slide transitions
C. Write T for True and F for False.
1 Computers can work on various tasks at the same time.
2 Cc stands for carbon copy.
3 If you split a cell, you cannot merge it afterwards.
4 You cannot change the theme of a presentation once you create it.
D. Answer the following questions.
1 What do you know about UNIVAC?
2 Differentiate between Cc and Bcc fields in an email.
3 What is the purpose of merging cells?
4 Why is modifying themes in a presentation important? E. Apply your learning.
1 Arushi is using the voice command application in her computer. In which generation of computers is this possible?
2 Manu wants to send an email to his friends, but he does not want his friends to know to whom else he has sent the same email. Which feature of Gmail can he use for this?
3 Rama is writing the column names in a table, but the names are not displaying properly. What will you suggest Rama do so that the column names fit properly in each cell?
A. Fill in the blanks.
1 is the option that starts the animation when you click your mouse.
2 Google Sheets is a free online tool.
3 helps you to cancel the effect of the last action that you performed.
4 gives machines the ability to think smartly.
B. Tick () the correct option.
1 Which of the following is the most commonly used audio format?
a .mp1 b .mp2
c .mp3 d .mp4
2 are located at the intersections of rows and columns.
a values b cells
c names d menus
3 Which of the following is not a domain of AI?
a NLP b data science
c CV d Google Slides
4 What key combination is used to select the entire sheet?
a Ctrl + C b Ctrl + Z
c Ctrl + A d Ctrl + V
C. Write T for True and F for False.
1 You can only add the videos in the presentation that are stored on your computer.
2 Google Sheets automatically saves your work.
3 When you change the cell data, it appears in the formula bar also.
4 Data is a collection of raw facts that can be transformed into useful information.
D. Answer the following questions.
1 Differentiate between undo and redo commands.
2 What is the use of the autosave feature of Google Sheets?
3 What is the difference between moving and copying cell data in a spreadsheet?
4 Describe how computer vision helps in providing security at homes.
E. Apply your learning.
1 Ayushi has entered the temperatures of the days in a week in a spreadsheet. She wants to move the data in the cells in another spreadsheet. How can she do that?
2 Mayra wants to use a spreadsheet application, but she does not want to pay any licence fee. Which application will be the most suitable for her?
3 Neha’s brother is a researcher in a medical lab. Which domain of AI assists researchers in the medical field to analyse massive datasets?
4 Happy wants to add visual effects to elements on his slides to make them more engaging. Which feature in Google Slides should he use?
This book embodies the principles outlined in the National Curriculum Framework (NCF) and the National Education Policy (NEP) 2020. It unveils the world of computer science through a unique and captivating pedagogical approach— seamlessly integrating curriculum content into the mesmerising adventures of Mel and Conji, fictional figures hailing from the enchanting world of Avora. Our aim is to prepare learners for the dynamic and technology-driven landscape of the 21st century, equipping them with the essential skills they need to thrive in an ever-evolving world.
• NEP Tags: To showcase alignment with NEP skills and values.

• Explore More: QR codes to explore an exciting application of the concept.
• Discuss: Questions to trigger engaging group discussions in the classroom.
• Think and Tell: Probing questions to stimulate thinking at an individual level.
• Did You Know? Interesting facts related to the application of a concept.
• Fun with AI: Engaging AI activities to explore and apply AI concepts in practical ways.
• Do It Yourself: Milestone exercises to practice specific concepts.
• Chapter Checkup: A pool of questions catering to all topics and skills covered in the chapter.
• Test Papers: Designed to evaluate understanding of core concepts and application of skills.
Uolo partners with K-12 schools to provide technology-enabled learning programs. We believe that pedagogy and technology must come together to deliver scalable learning experiences that generate measurable outcomes. Uolo is trusted by over 15,000+ schools across India, Southeast Asia, and the Middle East.
ISBN 978-81-978912-6-7