


Academic Authors: Jatinder Kaur, Ayushi Jain, Chandani Goyal, Kashika Parnami, Anuj Gupta, Simran Singh
Creative Directors: Bhavna Tripathi, Mangal Singh Rana, Satish
Book Production: Rakesh Kumar Singh, Sakshi Gupta
Project Lead: Jatinder Kaur
VP, Learning: Abhishek Bhatnagar
All products and brand names used in this book are trademarks, registered trademarks or trade names of their respective owners.
© Uolo EdTech Private Limited
First published 2023
Second published 2024
Third published 2025
This book is sold subject to the condition that it shall not by way of trade or otherwise, be lent, resold, hired out, or otherwise circulated without the publisher’s prior written consent in any form of binding or cover other than that in which it is published and without a similar condition including this condition being imposed on the subsequent purchaser and without limiting the rights under copyright reserved above, no part of this publication may be reproduced, stored in or introduced into a retrieval system, or transmitted in any form or by any means, electronic, mechanical, photocopying, recording or otherwise, without the prior written permission of both the copyright owner and the above-mentioned publisher of this book.
Book Title: Tekie Computer Science 6
ISBN: 978-81-978912-9-8
Published by Uolo EdTech Private Limited
Corporate Office Address:
85, Sector 44, Gurugram, Haryana 122003
CIN: U74999DL2017PTC322986
Illustrations and images: www.shutterstock.com, www.stock.adobe.com and www.freepik.com
All suggested use of the internet should be under adult supervision.
Standing at the forefront of the digital and AI revolution, the importance of coding and computational skills has reached unprecedented heights. In today’s professional landscape, whether it is in the fields of medicine, space exploration, education, science, or business, no sector remains untouched by this transformative wave. To thrive in the 21st century, basic computer literacy is no longer sufficient. Learners must evolve into ‘digital natives’ who can fluently read, write, and communicate in the languages that machines and AI comprehend.
Recognising this imperative, the National Education Policy (NEP) 2020 has strongly recommended the integration of coding skills, computational thinking, critical analysis, and problem-solving abilities into the curriculum. Moreover, forward-looking subjects like AI, Data Science, Computer Applications, and IT have been introduced as elective subjects from grade 9 onwards. It wouldn’t be surprising if further transformative measures are taken even at the elementary education level.
Uolo has introduced an innovative 360-degree program for a coding-focused computer science curriculum, known as Tekie, spanning grades 1 to 8. Tekie is a significant stride towards STEM education that aims at making learners future-ready—enabling them with skills needed in the ever-changing, technology-driven, and dynamic 21st-century world.
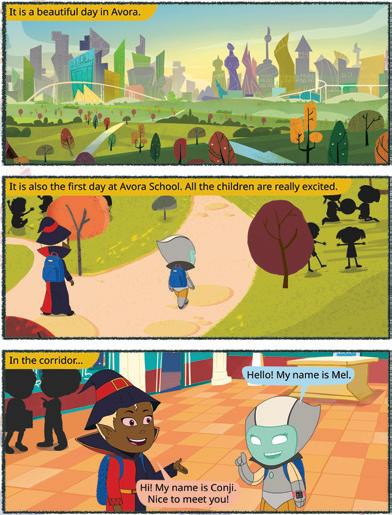
Tekie adopts a captivating and engaging approach to learning, in line with the recommendations of the National Curriculum Framework (NCF) 2023 and NEP 2020. The curriculum is ingeniously woven into the thrilling adventures of Mel and Conji, fictional characters from the enchanting land of Avora. The Mel and Conji series epitomises a modern method of acquiring computer science knowledge and honing computational thinking skills. The program includes chapters that provide a deeper immersion in computer science that both learners and teachers may find interesting.
Tekie is a technology-empowered curriculum that encompasses the following components:
• Main Content Books: These introduce learners to the theory of computer science and computer tools. Topics in AI are also covered, along with experiential and project-based learning resources.
• Coding Books: Specifically designed to nurture coding skills, this booklet aligns with the experiential and contextual learning approach of the coding curriculum, fostering critical thinking and problemsolving abilities.
• Animated Learning Videos: The program is powered by high-quality animation-based learning videos that deliver learning in an engaging manner.
• Teacher Manual: This valuable resource supports classroom instruction, ensuring that educators effectively deliver the curriculum.
Welcome to the captivating realm of Tekie! We hope you relish this educational journey as it equips you with the tools you need to thrive in the exciting and ever-changing world of the 21st century.
Tekie is an interactive, engaging, and experiential computer science program. It enables learners to attain mastery in computer science theory, new-age computer tools and coding. These are delivered through a storytelling-based coursebook and an experiential learningoriented coding book.
The learning experience is augmented by a digital platform that gives learners access to learning videos and experiential activities and projects that are rooted in the curriculum.
Engaging Textbooks
Comic Stories
Teacher Manual
Test Papers
Additional Projects
Test-paper Generator


Student and Teacher Platform
Learning Videos
Interactive Classroom and Homework Assignments
Byte-size Lesson Modules

The National Education Policy (NEP) 2020, introduced by the Government of India, represents a transformative shift in the country’s education system. It aims to create a more holistic, dynamic and multidisciplinary approach to education. The NEP highlights the need for early development of computational thinking, coding, and digital literacy as vital skills for students’ holistic growth. UOLO is fully committed to actualising the vision of NEP 2020 by meticulously adhering to its outlined recommendations.


1. Focus on conceptual understanding
2. 21st century skills, values, and dispositions
3. Computational and critical thinking
4. Application in real life
5. Holistic and integrated learning
6. Experiential learning
7. Enjoyable and engaging
8. Artificial intelligence and coding concepts
9. Digital literacy and emerging technologies
10. Factoids on India
Competency-based Education
NEP Pages 12, 17 and 22
Teaching and Learning Pedagogy
NEP Pages 3, 5, 11, 12 and 56
National Pride
NEP Pages 15, 16 and 43
11. Assessment of core concepts and application skills Assessments
NEP Pages 12, 18 and 22
Project-based Learning
Engaging hands-on projects encouraging practical application of computer science and coding
Story-based Approach
Enchanting tales that bring learning themes to life, making education a captivating adventure 5 7
Equipping the students with future-ready skills through exposure to the latest tools and technologies
Engaging activities to deepen students’ understanding and engagement with AI concepts
Test papers designed to evaluate understanding of core concepts and application of skills 3 4 11
Projects on the digital platform to deepen understanding and develop essential practical skills
Invites learners to discuss in small groups and present different perspectives
Story-style learning videos that deliver concepts to students.
Intellectually stimulating questions designed to encourage deep, analytical, critical, and evaluative thought process
Interactive quizzes that reinforce learning and assess students’ understanding
Think It Through
Probing question related to the concept that arouses curiosity
Tool to create customised assessments that align with the curriculum and help evaluate students’ progress effectively.
Artificial intelligence and coding concepts 9 Digital literacy and emerging technologies
Factoids on India 11 Assessment of core concepts and application skills
The National Education Policy (NEP) 2020 outlines essential skills, values, dispositions, and learning approaches necessary for students to thrive in the 21st century. This textbook identifies and incorporates these elements throughout its content, activities, and exercises. Referred to as “NEP Tags”, they are defined as follows:


INTEGRATED


Art Integration
Bringing creativity and fun into learning by combining music, drama, and art with other subjects CRITICAL

Sports Integration
Using games and sports in daily life to enrich computer-related activities
Cross-curricular linkages to make the learning experience more holistic, joyful and meaningful

SDG
Critical Thinking
Coding opportunities to apply higher-order skills like algorithmic and computational thinking, and problem-solving
Step-by-step activities to enable learners put theoretical knowledge into practice
Sustainable Development Goals
Applied computer science activities related to real-world issues and sustainable development

SEL Social Emotional Learning
Developing the skills to understand and manage emotions, build positive relationships with others and make responsible choices
The curriculum is thoughtfully mapped to introduce tools and technologies at each grade level, ensuring a smooth and progressive learning experience for students. Beginning with basic concepts in junior grades, the curriculum gradually incorporates more advanced tools and concepts in higher grades. This structured approach enables students to build on their knowledge each year, equipping them with essential skills in computer science and technology as they progress from grade 1 through grade 8. By the time they reach the higher grades, students are well-equipped to tackle complex projects, think critically, and apply their skills in real-world scenarios. The curriculum not only fosters technical proficiency but also encourages creativity, problem-solving, and a deeper understanding of the digital world.

1

We
Theme Page: Lists the chapters covered under a unit


2
Comic Story: To introduce key concepts in a fun way
Did You Know: Interesting facts related to the topic

Discuss: A multi-faceted probing question related to the concept that arouses curiosity
4


3
Explore More: Short videos to find out more about the topic
Do It Yourself: Short exercises between the chapter to pause and assess comprehension
We see many things around us. Some things are present in nature like trees, animals, mountains, and rivers. These are called natural things.


Some things are made by humans. These are called human-made things. Buildings, cars, and umbrella are some human-made things.


Let us now learn to draw shapes in Paint.
Drawing an Oval
Follow these steps to draw an oval: 1. Open Paint and click on the Shapes group.
Project-based Learning: A project-based learning approach employed to foster an engaging and interactive learning experience
2. Click on the Oval shape. 3. After selecting the shape, go to the drawing area.


4. Hold the left mouse button, drag the mouse, and then release the mouse button. You will see that an oval has been drawn.
Points to Remember
smartphones.
Chapter Checkup: Chapter-end practice exercises aligned to different levels of Bloom’s Taxonomy
Points to Remember: Summary of the chapter

Apply your learning: Intellectually stimulating questions designed for higher-order thinking and analysis
Have you ever given a command to the speaker at your home to play a song, and it plays it?
Do you know what these speakers are known as?

These special speakers, which follow your voice commands, are smart speakers Smart speakers can do this because of AI.
What is AI?


AI stands for Artificial Intelligence
Artificial Intelligence: Chapters on Artificial Intelligence to explore the fundamentals of AI, including its principles and applications in various fields
It gives machines the ability to learn and do things on their own, just like humans do
AI Around Us
• Talking Toys: Some toys use AI to understand your voice and respond with sounds, songs, or even short sentences.

A. Fill in the blanks.
• Robot Helpers: These machines help us with daily tasks at home. They can clean floors, cook food, etc. They do work in the same way as a human does.
Fun with AI: Engaging AI activities designed to help students explore and apply AI concepts in practical ways


AI devices are all around us. There are many types of machines that use Artificial Intelligence (AI) to perform tasks or respond to us. Some examples of such AI devices are:

• Smart Speakers: These speakers respond to your voice commands. They use AI to understand your voice commands, like when you ask them to play music or tell you a story.

• Selfie Magic: Some phones use AI to edit your selfies. The AI can adjust lighting, smooth out backgrounds, or add fun filters.


Test Paper 1 (Based on Chapters 1 to 3)
Test Papers: Designed to evaluate understanding of core concepts and application of skills
1 Things that are present in nature are called
2 Some machines need to work.

3 Computers are used in to keep information of patients.
4 At restaurants, computers are used to order and pay for
B. Tick () the correct answer.
1 Which of the following is a human-made thing?
a Mountains b Trees
c Cars d Animals
2 Which machine helps us keep our food fresh?
a Refrigerator b Washing


•
•
•
•
•
•


Languages are important because they help people communicate and share ideas. Computer languages work in a similar way, but with machines. They allow us to tell computers what to do, helping us build apps and solve problems. Just as we use words to talk to each other, we use computer languages to talk to computers. First, let us discuss the different categories of computers, and then we will learn about different computer languages and translator programs.
A computer is an electronic device. You must have seen the different types of computers, like a desktop, a laptop, or a tablet. There are many more types of computers that are categorised according to their shape, size, and functionality. Let us learn about them one by one.
Supercomputers are super-fast and the largest of all types of computers. They occupy as much space as an entire floor of a building. They can do lots of tasks very quickly and need experts to take care of them. Many people can use them at the same time. They are used for special jobs, like science research, medicine, simulations, and weather predictions. To measure how fast they work, a special unit called FLOPS (Floating-point Operations Per Second) is used.
Examples: Summit, Fugaku, Sierra, Sunway TaihuLight, Tianhe-2A, etc.


Want to explore the fascinating world of supercomputers? Scan this QR code.
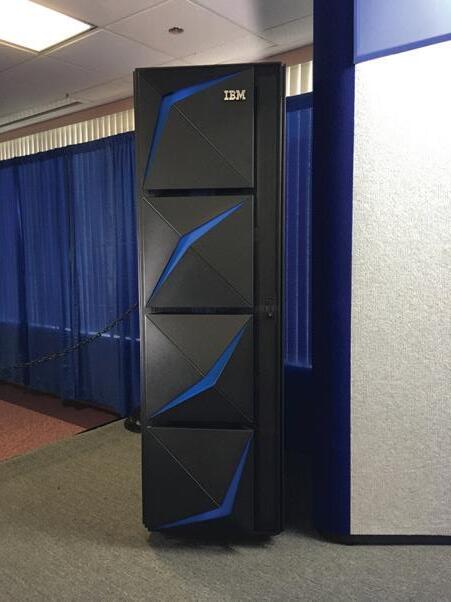
Mainframe computers are also big and super-fast, but smaller than supercomputers. They can do lots of jobs quickly. They are used in places where high precision is required, such as in banks to handle money transactions or in aeroplane guidance. Mainframes are super reliable, and they can work for a long time but they need a lot of power and specialised cooling to stay cool. The functionality of these computers can be extended by adding more parts, like processors and memory.
Examples: IBM z15, IBM z14, Unisys ClearPath Libra, Fujitsu GS21 360, and Hitachi VOS3.
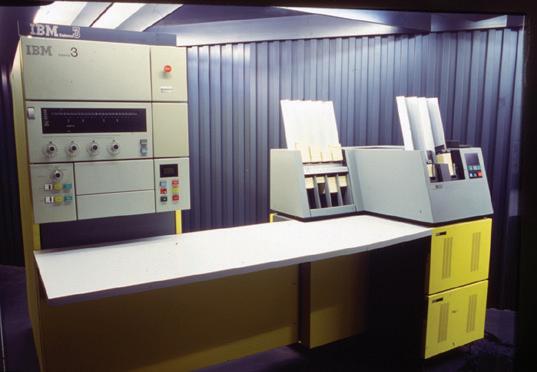
Minicomputers are smaller than mainframes but still offer significant computing power. They are used in scientific research, industrial control systems, and as servers for mid-sized organisations. Minicomputers have a large memory storage capacity due to their large number of processors. They can run multiple operating systems simultaneously.
Example: IBM System/3, DEC PDP-11, Data General Nova, HP 3000, and Wang VS.
Workstations are high-performance computers used for specialised tasks like professional photo and video editing, 3D design, scientific modelling, and software development. They have powerful hardware and are often used by professionals in technical fields. They are mostly used by a single user.
Examples: Dell Precision Mobile Workstations, HP ZBook Studio Workstation, etc.
PCs are the most common type of computer and are designed for individual use. They include desktop computers and laptops. PCs are used for a wide range of tasks, including word processing, internet browsing, gaming, and more.


These portable devices combine computing capabilities with touchscreens. They are also meant for individual use. You can carry tablets and smartphones anywhere you want. They are used for various purposes, such as communication, entertainment, and productivity.


The term “software” was first used by John W. Tukey in 1958.

Do It Yourself 1A
Match the type of computer with its features.
Type of Computer
Tablet and smartphones
Supercomputer
Mainframe computer
Minicomputer
Feature
Smaller than mainframes
Need a lot of power and specialised cooling to stay cool
Can be carried anywhere
Performance is measured in FLOPS
Have you ever thought about how you communicate with your friends or family using words and sentences? Just like we have languages for humans, computers also have their own languages to understand and follow instructions. These languages are called computer languages.
A computer language can be defined as a set of instructions that computers can understand and follow.
A computer language is a special language that is in the form of codes and symbols. There are five categories of computer languages based on their development stages. They are called generations
Programming Languages
Let us learn about these five generations of computer languages.
First-generation language is also called machine language or low-level language. This language is dependent on machines. As you know, the computer is an electronic device. So, it understands the language of electric signals that are symbolised as 0s and 1s, known as binary code. The language that includes the use of binary codes is called binary language.
Advantages of First-generation Languages
1. Quick and effective since statements are directly written in a binary language.
2. No translator is necessary.
Disadvantages of First-generation Languages
1. Binary codes are difficult to learn.
2. It is very difficult to find and fix errors in programs written in machine language.
Second-generation language is also called Assembly Language. It is also a low-level language. This language uses simple mnemonic codes instead of binary numbers to communicate with computers. For example, ADD for addition, SUB for subtraction, MUL for multiplication, and so on.
When compared to programs created in machine language, the programs created in assembly language are simpler to create, understand, and modify.
Advantages of Second-generation Languages
1. When compared to machine language, it is simpler to understand.
2. Changes are easy to make.
3. Errors are easy to locate and correct.
Disadvantages of Second-generation Languages
1. An assembler is required.
2. The instruction set for this language varies according to the architecture and hardware.
3. You can perform only a limited number of operations using this language.
Third-generation languages are called high-level languages. These languages resemble English conversation more closely. The programs written in these languages can be developed in very little time as compared to the first- and second-generation languages. The examples include FORTRAN, COBOL, C, C++, Java, C#, etc.
1. The use of English-like words makes the language easy for others to understand.
2. It requires fewer lines of code than the first- and second-generation languages.
3. By using a compiler specific to that language, the same code can be moved to another system and run on it.
1. You need a compiler and interpreter to execute a program.
2. Different computers require different compilers.
Fourth-generation languages are called non-procedural languages. They are very high-level languages. They enable users to access the database. These languages are easy for people to understand. The fourthgeneration of programming languages was created with the goal of reducing the time, expense, and effort required for creating various software applications. The examples include SQL, Python, FoxPro, and Focus.
1. These languages are simple to understand and learn.
2. The creation of applications takes less time.
3. The chances of introducing errors in the programs are very low.
1. The programs written in fourth-generation languages occupy more space in memory.
2. These languages have less direct hardware control.
3. These languages are not very flexible, because these are often designed with a specific domain in mind.
Fifth-generation languages are used for creating programs for Artificial Intelligence. Artificial Intelligence and Artificial Neural Networks are the two main industries using the fifth-generation of computer languages. The examples include Prolog, Mercury, LISP, etc.
1. Fifth-generation languages focus on the logic of the problems rather than the implementation.
2. They often allow programming in a more natural language like syntax.
3. 5GLs require less code to accomplish tasks.
4. These languages are well-suited for AI and expert system development, where rule-based and symbolic reasoning is essential.
1. 5GLs are often specialised and may not be suitable for all types of programming tasks.
2. 5GLs can be complex to learn.
3. Depending on the implementation, 5GLs may not always offer the same level of performance.
Did You Know?
Computer languages are based on predefined rules, known as syntax, as human languages are based on words and grammar.
A translator program helps the computer to understand various languages. It converts instructions written in a computer language into something the machine can understand, much like translating a foreign language into your native language. So that speakers of different languages can communicate with one another.
There are three main types of translator programs:
A compiler is a language processor that reads the source programs written in high-level language and converts them into an equivalent program written in machine code in one go.
If there are any errors, it immediately informs the programmer about them.
Interpreter is a translator program that converts high-level language code to machine language line by line as the program runs.
A translator, called an assembler, is used to convert assembly language code into machine language code.
1 Fill in the blanks.
a A program that converts assembly language into machine language is called . b languages require less code to accomplish tasks.
2 Write T for True and F for False.
a A compiler translates the source code written in high-level language into machine language in one go.
b A computer is an intelligent machine, so it does not require a translator.
1 Computers can be categorised into supercomputers, mainframes, minicomputers, workstations, personal computers, tablets, and smartphones based on their size and functionality.
2 Supercomputers are super-fast and very big computers with huge storage space.
3 Mainframe computers are also big and super-fast, but smaller than supercomputers.
4 Minicomputers are smaller than mainframes but still offer significant computing power.
5 Workstations are high-performance computers used for specialised tasks like professional photo and video editing, 3D design, scientific modelling, and software development.
6 PCs are the most common type of computer and are designed for individual use.
7 Tablets and smartphones are portable devices that combine computing capabilities with touchscreens.
8 A computer language can be defined as a set of instructions that computers can understand and follow.
9 A computer language is a special language that is in the form of codes and symbols.
10 There are five categories of computer languages based on their development stages. These are called generations.
A. Fill in the blanks.
1 A special unit called is used to measure how fast supercomputers work.
2 computers are super reliable, and they can work for a long time.
3 computers are the most common type of computer and are designed for individual use.
4 The language that includes the use of binary codes is called language.
5 The assembly language uses simple codes instead of binary numbers to communicate with the computers.
B. Tick () the correct option.
1 A computer language can be defined as
a The language that computers speak.
b A way in which computers understand instructions.
c A way of computer-to-computer communication.
d A way of communication between different types of machines.
2 Which computer language is used for giving low-level commands to a computer?
a Binary b Spanish
c Emoji
d English
3 A/an can convert a high-level language code to machine language line-by-line.
a Assembler
c Compiler
4 LISP is a language.
a High-level
c Assembly
b Interpreter
d Processor
b Low-level
d Fifth-generation
5 generation languages enable users to access the database.
a First-generation b Second-generation
c Third-generation
d Fourth-generation
C. Who am I?
1 I am a second-generation of programming language, which uses special code symbols like ADD and SUB.
2 I use 0s and 1s in binary code to give instructions to the computer.
3 I am a program that helps computers understand various languages.
4 I am a computer that is used for creating 3D designs.
5 I am a computer that is portable and can be taken from one place to another.
D. Write T for True and F for False.
1 Many people can use the supercomputers at the same time.
2 Mainframe computers are bigger than supercomputers.
3 Minicomputers are small, so they cannot run multiple operating systems simultaneously.
4 Workstations have touch-enabled screens.
5 Fourth-generation languages are called procedural languages.
E. Answer the following questions.
1 What is a computer language?
2 Name the categories of computers based on their size and functionality.
3 Write the features of mainframe computers.
4 Differentiate between a compiler and an interpreter.
5 How is assembly language different from machine language?
1 Reena’s mother was a computer programmer during the third-generation of computer language. Which kind of language did she use then?
2 Amit’s brother is a scientist and works in the weather-forecasting department. Which type of computer must he be using?
3 Aisha wants a computer that she can carry to college. Which type of computer do you suggest she should take?
4 Rohan is a programmer who writes programs for artificial intelligence machines. Which generation of languages is this?
5 Asmi wants to convert a program written in a high-level language into a low-level language. Which program should she use to do it?


Do you use the internet to search for any topic, send a message to your friend, play a game, etc.? Have you ever wondered how the internet works and what it is?
We use the internet in many instances in our lives.
The internet is a network that connects computers all over the world. You can communicate with people and transfer data from anywhere around the globe with a web connection. The internet is also known as the ‘net’.
In this chapter, you will learn what exactly the internet is and its advantages and disadvantages. Let us surf the internet and realise its benefits!


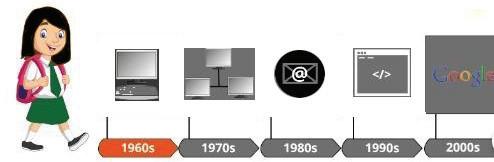
The history of the internet is fascinating and has evolved over several decades. The foundation of the Internet was laid in the early 1960s. The U.S. Department of Defense established Advanced Research Projects Agency (ARPANET) in 1969. ARPANET was created using a group of personal computers at various colleges for sharing information and messages. The key protocol for internet communication is called the Transmission Control Protocol/Internet Protocol (TCP/IP), which allowed computers on different networks to communicate with each other. ARPANET and the Defense Data Network officially adopted the TCP/IP standard on January 1, 1983, marking the transition to the modern internet. This date is often considered the official birthday of the internet.
The adoption of TCP/IP made it possible for different computer networks to communicate using a common language, enabling the global network we know as the internet today.

The internet is one of the most powerful and brilliant creations that offers endless knowledge and enjoyment to human beings. Let us learn more about the benefits of the internet.
Communication: The internet has revolutionised the way we communicate. It allows people to connect instantly through email, social media, video calls, and messaging apps, making it easy to stay in touch with family, friends, and colleagues worldwide.


Online Learning: The internet offers access to a vast number of educational resources and online courses. Students and learners of all ages can acquire new skills, take courses, and earn degrees from the comfort of their homes.
Maps and Navigation: Online maps and GPS services help people find addresses, get directions, and navigate unfamiliar places effortlessly. Services like Google Maps provide real-time traffic updates and even public transportation options.

Online Shopping: E-commerce platforms have made shopping more convenient than ever before. People can browse and purchase products from a wide range of retailers, without leaving their homes. Online shopping also offers the advantage of comparing prices and reading reviews.
Online Payment: The internet has streamlined financial transactions through online payment systems like PayPal and Paytm, and digital wallets. Such services make it secure and easy to send and receive money, pay bills, and make online purchases.
Despite many advantages, the internet has some disadvantages too.
Wastage of Time: The internet has a lot of information that can kill people’s time while surfing the internet.
Impact on Health: People may become addicted to using the internet. It can disturb their minds and affect their physical health in the long run. Spending an excessive amount of time on phones, laptops, or other such devices can cause health problems such as reduced eyesight, lower backache, and neckache.
Cybersecurity Threats: The internet, if not used correctly, can be a bit like leaving your front door unlocked. Some not-so-nice people may try to sneak into your personal networks and systems and cause harm for their gain or just for fun. If your computer is not secured, they can gain unauthorised access to your personal documents and other information such as stealing your bank account details and using them for their benefit.
Misinformation and Fake News: Sometimes, there can be articles or information posted by random people that is not true. On the internet, these made-up stories can spread fast and confuse everyone. It is, therefore, advisable to check the reality and truthfulness of news before sharing it with anyone.
Cyberbullying: On the internet, some people can be mean to others and send messages that may affect them negatively. In some cases, you may not even know these people. If you receive messages from strangers or even known people that start affecting you in an odd way even if not negatively, inform your elders immediately.
Lack of Face-to-face Interaction: When you spend too much time on the internet, you may not talk to and play with your friends and family in person. Such instances can affect both your physical and mental health. It is important to balance online and offline time so that you can keep your social skills and friendships strong.
Name the following advantages of the internet.


Is using the internet an advantage or a disadvantage?

Some popular services on the internet are:
Email stands for electronic mail. It is a way to send messages over the internet to other people. Emails can be used to send textual content, photos, documents, and others as attachments.
The features of email are as follows:
You can write and receive emails to and from anyone with an email address.
You can attach files such as photos or documents with your emails.
You can save email addresses of your contacts for easy access in the contacts list.
The emails can be sorted into separate folders for easy tracking.
You can respond to emails or share them with others.
You can look for specific emails, using keywords.
You can use the filters provided by the email service to block unwanted emails.
You can add your name and contact information to the end of your emails.
1. Most email services are free and easy to use.
2. You can send a message in real time to a person anywhere across the globe.
3. Emails are personal and are secured with passwords.
1. You can only attach a file with a limited size. For example, through Gmail, you can send a file with a maximum size of 25 MB.
2. Email services are prone to attack by hackers.
3. Emails are often used by malicious users to send unwelcome and harmful messages to other users.
Google Drive is a cloud storage service that lets you store files online and access them from anywhere using an internet connection.
1. You can use Google Drive to share large files that cannot be attached to an email.
2. It is a trusted storage location, as it is protected by a password.
3. You can access your files anytime anywhere.
4. As you are storing your files on a cloud storage, your computer storage space is not consumed.
E-commerce, or digital commerce, refers to the buying and selling of products and services online. It is a convenient way to shop for products and services from a variety of retailers without leaving your home. Is using email a more convenient way to send or receive messages than the traditional mail?


1. Customers can shop from anywhere at any time, making it convenient for both buyers and sellers.
2. E-commerce allows businesses to reach a global audience, expanding their customer base.
3. Operating an online store is often more cost-effective than a physical one, reducing overhead expenses.
4. E-commerce websites can personalise recommendations and offers, based on a user’s browsing and purchasing history.
5. Shoppers can easily compare products, prices, and reviews online before making a purchase decision.
1. Online transactions may be vulnerable to security breaches and data theft, causing privacy concerns.
2. Buyers cannot physically inspect products before a purchase, which can lead to dissatisfaction if the product does not meet expectations and does not have a return policy.
3. Technical issues, such as website crashes or payment gateway failures, can disrupt a shopping experience.
4. E-commerce platforms face intense competition, making it challenging for new businesses to stand out.
5. Shipping delays and issues can lead to customer frustration and affect the overall shopping experience.
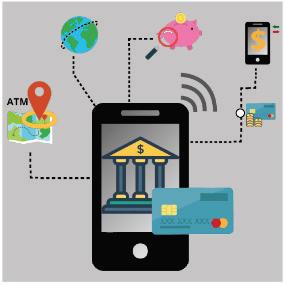
Modes of online payments are the one-of-a-kind methods through which you can pay for goods and services online. There are many modes of online payments available, each with its personal set of functions.
Examples of Modes of Online Payments
Credit Card: Customers can make online payments using their credit cards. The customers need to enter card details like card number, expiry date, and CVV code for transactions.
Debit Card: Debit cards are another popular option for making online payments. These cards allow users to pay online by entering debit card information, and the transaction amount is deducted directly from their bank account.
Net Banking: Net banking enables users to transfer money directly from their bank accounts to the recipient’s account through online banking services provided by their banks.
Mobile Wallet: Mobile wallets or digital wallets are apps that store payment information. Users can deposit money into the wallet and use it for various online transactions. Examples include PayPal, Amazon Pay, Google Pay, and Paytm.
Unified Payments Interface: A unified payments interface (UPI) is a real-time payment system in India that allows users to send and receive money using their smartphones. This system is widely used for online transactions and bill payments.
CVV stands for ‘Card Verification Value’. It is a three- or four-digit security code that is printed on the back of credit and debit cards. Did You Know?
A blog is a website where people can write about their thoughts, experiences, and interests. Blogs are updated according to the blog owner’s interest, and they may be regularly written in a conversational style. The creator of a blog is called a blogger, and the process of writing or creating a blog is called blogging.
1. Blogging provides a platform for individuals to express their thoughts, ideas, and creativity.
2. Bloggers can share their expertise and knowledge on specific topics, helping others to learn and gain insights.
3. Blogs can raise a sense of community and connection among like-minded individuals who share similar interests.
4. Blogging can enhance an individual’s or a business’s online presence, making it easier for others to discover them.
5. Bloggers often connect with others in their area of expertise or industry, leading to networking opportunities and collaborations.
6. Some bloggers can generate income through advertising, sponsored content, affiliate marketing, or product/service sales.
7. Successful bloggers may attract career opportunities in writing, speaking, consulting, or related fields.
8. Regular writing and engagement with an audience can lead to personal growth and improved communication skills.
Podcasting involves creating and sharing audio content. This content can include discussions, interviews, storytelling, music, and more.
The e-Podcasts can be updated and shared regularly, as they are usually released in episodes. Some of the features of podcasts are as follows:
1. Podcasts are mostly released in an episodic form, which means they are organised into episodes. Each episode focuses on a specific topic or theme.
2. Users can subscribe to their favourite podcasts, using podcast apps or platforms. Subscriptions ensure that they receive updates when new episodes are released.
3. Podcasts are accessible through various devices, including smartphones, tablets, computers, and dedicated podcast players. Podcasts cover a wide range of topics and genres, catering to various interests, such as news, entertainment, education, technology, and more.


4. Listeners have the flexibility to choose when and where they want to listen to podcasts. They can stream or download episodes to their devices for offline listening. Listeners can engage with podcasts by leaving reviews, comments, or ratings. They can also share episodes on social media.

5. Podcasts are hosted and produced by individuals or teams known as podcasters. They are responsible for creating and publishing audio content.
6. Podcasts are distributed through podcast platforms such as Apple Podcasts, Spotify, Google Podcasts, and others.
7. Some podcasters monetise their content through advertising, sponsorships, listener support, or premium content subscriptions.
8. Podcasts have a global audience, allowing creators to connect with listeners from around the world.
Using the internet poses various potential threats and risks, which are as follows:
Malicious Software: While using the internet, malicious software like viruses, ransomware, and spyware can get downloaded on your computer, which can infect your devices and steal or damage your data.
Phishing: Phishing is an offence where scammers use fake links to trick you to reveal sensitive information such as passwords and credit card details.
Financial Fraud: Cybercriminals can get access to debit and credit card details and use it to steal money from the card owner’s bank account.
Data Breach: Large organisations can also experience data breaches, exposing their sensitive and secret information to cybercriminals.
Digital Footprints: When you surf the internet, your history is stored on each website that you visit. This history leaves an online data trail called a digital footprint. Even if you sign out from the various services, your information remains there on the websites that you visited. This information can lead to privacy invasions and unwelcome targeted advertising.
Identity Theft: Identity theft happens when some cybercriminals steal your personal information or financial data and pretend to be you for conducting online transactions. It is dangerous as you may not know that or may come to know quite late that a crime has been committed in your name.
Cyberbullying: Cyberbullying is an act of harassing or threatening others online, often through social media or messaging platforms. If you receive an inappropriate message or comment from anyone known or unknown on the internet, immediately inform your guardians.
Internet Addiction: Excessive use of the internet, social media, or online gaming can lead to addiction and have a negative impact on mental health and well-being.
Netiquette refers to a set of rules and regulations for behaving politely and respectfully online. It is a combination of two terms ‘network’ and ‘etiquette’. While using the internet, you must follow these guidelines:
1. Treat others on the internet the way you want to be treated. Do not say or write mean or hurtful things.
2. Write in a way that is easy to understand, and avoid using all capital letters (LIKE THIS) or unnecessary punctuation (!!! or *!?*#), which can seem like shouting or being rude.
3. Do not share other people’s private information without their permission.
4. Before you send a message or post something, think if it is something you would say in person. If not, it may not be nice online either.
5. Do not be mean or make fun of others online. Cyberbullying hurts people, just like physical bullying.
6. Do not share your personal information such as your address or phone number with strangers. It is the same as not talking to strangers on the street.
7. If you use someone else’s work or idea, give them credit, as you do at school with poems or articles.
8. In online discussions, stick to the topic and avoid going off at unrelated tangents.
9. Emojis can help show emotions, but do not use too many. It can be confusing.
10. Sometimes, people on the internet may not respond right away. Be patient and give them time.
Identify which of the following are good internet practices. Write G for good and B for bad practices.
1 Sharing personal information with unknown persons online.
2 Using emojis.
3 Using capital letters while chatting.
4 Using someone else's work or ideas without their knowledge.
5 Write in a way that is easy to understand.
1 The internet is a global network of computers that are connected to each other.
2 The advantages of the internet are: access to information, communication, entertainment, etc.
3 The disadvantages of the internet are: addiction, cybercrime, privacy concerns, etc.
4 E-mail stands for electronic mail. It is convenient and free of charge.
5 Google Drive is a cloud storage where we can store any data or information.
6 E-commerce is the buying or selling of goods and services online.
7 We have various types of modes of online payment, such as credit cards, debit cards, and UPI.
8 A blog is a website where we can share our thoughts.
9 Podcasting is a way to create and distribute audio content.
10 Potential online threats are the risks that can impact on a system, process, or organisation.
11 Netiquette is a combination of two different words ‘network’ and ‘etiquette’.
A. Fill in the blanks.
1 The is a global network of computers that are connected to each other.
2 is a way to send and receive messages over the internet.
3 A is a website to share thoughts.
4 The internet was invented in the
5 E-commerce is used to buy and goods and services online.
B. Tick () the correct option.
1 Which of the following is not an internet service?
a Google Drive
c Chatting
2 What is a blog?
a A writer’s thoughts and opinions on a particular topic
b News and current events
c Product reviews
d All of these
3 What is a podcast?
b Email
d Television
a An audio or video recording that is published online and can be downloaded or streamed
b A live radio broadcast
c A short video clip that is shared online
d None of these
4 Which of the following is NOT a good netiquette practice?
a Be polite and respectful to others.
b Avoid using offensive language.
c Share personal information about yourself or others.
d Avoid using capital letters.
5 involves creating and sharing audio content.
a Podcasting
c E-commerce
C. Who am I?
1 I allow you to send and receive messages electronically.
2 I am a website where you can share your thoughts and ideas.
3 I am a type of digital audio recording that can be shared online.
4 I have a set of rules for online behaviour.
5 I allow you to make online payments.
D. Write T for True or F for False.
b Blogging
d None of these
1 The internet serves as a network connecting various computer systems.
2 There is no limit for file size while attaching with email on Gmail.
3 A blog is used to share thoughts.
4 A netiquette is a way to share thoughts in an audio form.
5 Online transactions can lead to security breaches, raising privacy concerns.
E. Answer the following questions.
1 What is the internet?
2 What is Email? What are the advantages of Email?
3 What is podcasting?
4 Mention any two netiquette you should follow while online.
5 Name and explain two online payment methods.
1 Nishi is working on a science project and needs additional information. What resource can she use on the internet to learn more?
2 Mihir was given a task by his computer teacher to list different ways people communicate online. Help him by giving the correct answer.
3 Anaya was using the internet when she received an email asking her for personal information. Should she share the information or not? What potential threats can she be exposed to?
4 Naman has a bent towards writing. He wants to share his personal thoughts and ideas with an audience over the internet through his articles. Which internet service can he use?
5 Lovey is chatting with her friend Sharvi on an online chat platform. Which netiquette should she keep in mind while sending messages?


Animation effects are like magic tricks for text, images, or other objects on a computer screen. They make objects move, change their size, or appear and disappear in a fun and interesting way. People use animation effects to make websites, games, and even educational videos more interesting and engaging. Animations are special visual effects that you add to text and different objects on a slide.
To apply animation effects in Google Slides:
1. Open Google Slides: In Google Slides, create a new presentation or open your existing one. (https://slides.google.com/)
2. Insert an object: Create or select the object (text, image, shape, etc.) to which you want to add an animation.
3. Motion pane: Click on the Insert menu from the menu bar. Select the Animation option from the drop-down list. The Motion pane will open on the right-hand side.

4. Choose an animation: In the Motion pane, go to the Object Animations section. Here, the first option is Animation type. Click on this option and select an animation from the drop-down list.
5. Start condition: The next option is the Start condition. Select one of the following options from the drop-down list:
On click: Animation starts when you click on the slide.
After previous: Animation starts after the previous animation ends.
With previous: Animation starts with the previous animation.
6. Applying animation to text: If the object is a placeholder or text box, the By paragraph checkbox will be displayed. If this checkbox is checked, each paragraph of text in the box will be displayed one-by-one. Otherwise, the entire box will be displayed at once.
7. Add more animations: Select an object and click on the Add animation option.
8. Preview the animation: Click on the Play button to check how that animation effect works on the selected object.


Google Slides allows you to add a “Spin” animation to objects, which can make them rotate like a spinning wheel. This animation can be a creative way to draw attention to specific elements in your presentation, and it’s a fun way to add a little extra flair to your slides. So, if you want to make an object in your presentation spin like magic, you can do it with Google Slides! Did You Know? Write T for True and F for False.
1 To animate text, first click on Slide and then Animation
2 Click on the Play button to check how that animation effect works on the selected object.
Transitions in presentations refer to the visual effects that occur when you move from one slide to another within a presentation. Using transitions in presentations enhances flow, engages the audience, and adds visual appeal.
The way one slide follows the other on the screen in a presentation is called transition.
To add transitions to your presentations:
1. Open Google Slides: In Google Slides, open a new presentation or an existing one.
2. Select a slide: Click on the Slide in the Slide Navigation on the left-hand side of the screen. This is the slide to which you want to add a transition.
3. Transition panel: In the menu bar, click on Slide and then select Transition. A sidebar on the right will appear with various transition options. Alternatively, you can right-click on the selected slide from the Slide Navigation pane and click on the Transition option.

4. Choose a transition: In the Transition sidebar, under “Transition,” you can select the type of transition effect you want from the drop-down menu. You can choose from options like “Dissolve”, “Fade”, “Cube” and more.
5. Set transition options (optional): Depending on the transition you choose, you may have additional options to customise the transition. For example, you might be able to select the duration of the transition by dragging the slider.
6. Apply the transition: If you want the transition to apply to all slides, click the “Apply to all slides” button. If you do not click this button, the transition will be applied to the current slide only.

7. Preview the transition: You can preview the transition by clicking the Play button in the Transition sidebar to see what it will look like when you move from one slide to another.
Whatever you do on Google Slides gets automatically saved. Did You Know?
To know how to apply transitions, scan this QR code.
When you make a presentation on Google Slides, what is the most common transition that you use and why is it your favourite?
Do It Yourself 3B


Google Slides offers advanced features to boost productivity and creativity. Some of these advanced features include using action buttons, importing data from various sources, using a dictionary to use content with good vocabulary, adding comments for collaborative feedback, using the ink annotation feature to mark or highlight important information in a presentation, etc.
Let us first create a presentation in Google slides on the topic Monuments of India to learn its advanced features.


After creating this presentation, let us now add some interesting elements in it to make it more interactive.
Action buttons are used to move from one slide to another and play media files. They help in opening external content, such as a website, another PowerPoint presentation, a document, a spreadsheet, and much more.
Follow the given steps to use action buttons:
1. Open your presentation in Google Slides.
2. Click on the slide where you want to add an action button. This is the slide where the button will appear.
3. Click on Insert in the menu bar.
4. Choose Shape from the drop-down menu.
5. Select a shape that you want to use as an action button. For example, you can use rectangles, circles, arrows, or any other shape you like. Here, we have chosen the Arrows shape.
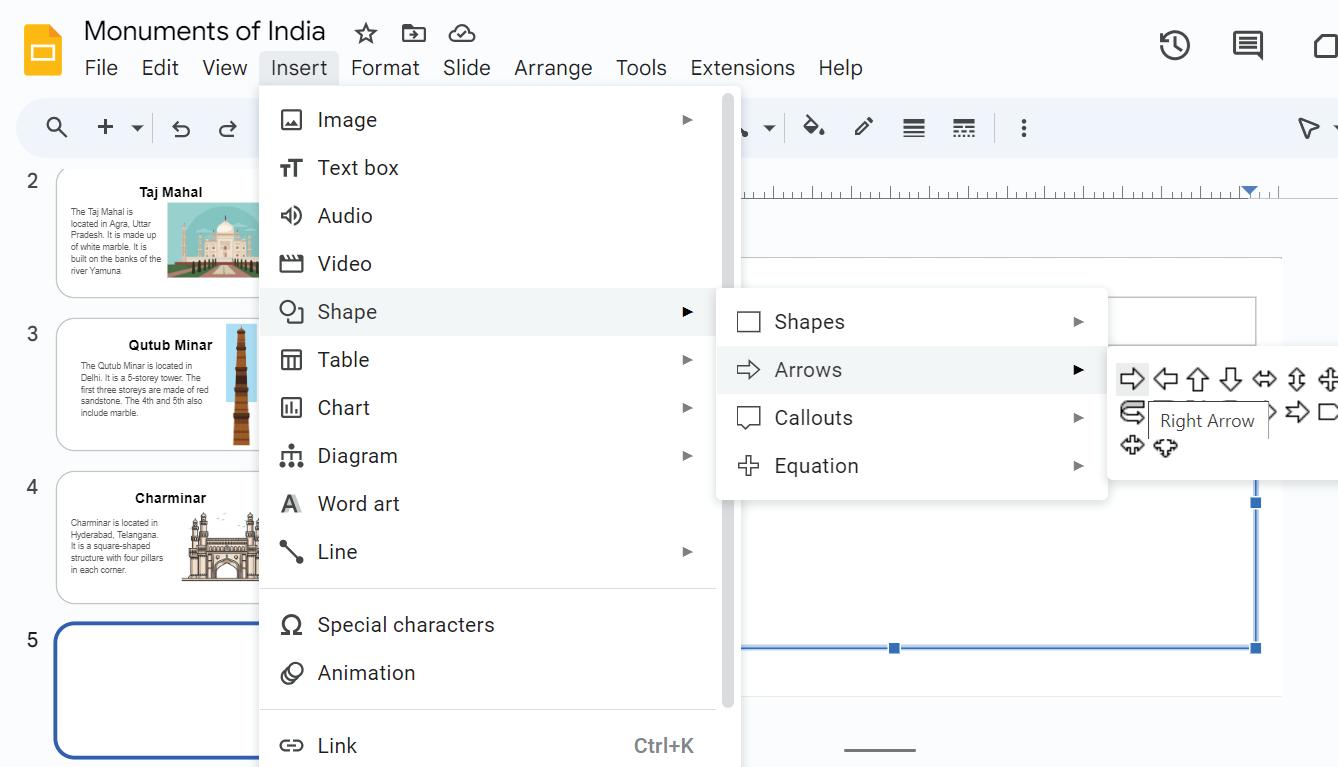
6. Click and drag on the slide to draw the shape. This will be the action button.

7. With the button selected, click on Insert in the menu bar. Choose Link from the drop-down menu. In the Link dialog box, you can add a link to a specific slide such as the Previous Slide or Slide 1 in your presentation. You can also add a link to websites by pasting its URL in the Search bar.
8. To test the action button, click on the Slideshow button at the top right-hand corner of Google Slides and go to the slide containing the action button that you have created. Click on this button to see it in action.

You can use action button in Google Slides not only for navigation but also to create interactive games and quizzes.
Do It Yourself 3C
1 Name the menu you click to select an action button.
2 What should you do in Google Slides to test if your action button works properly?
Importing data into a presentation is the process of bringing external content or data into your own presentation. Importing slides helps to add slides from another presentation to your current presentation. You can also import data from Google Sheets into your Google Slides presentation.
Follow the given steps to import data from Google Sheets:
1. Open the presentation where you want to import data from Google Sheets.
2. Open the Google Sheet from where you want to insert the data.
3. Copy the data you want to insert in your presentation from Google Sheets by selecting Copy option from the Edit menu.

4. Click on the slide where you want to import your data.
5. Click on Edit > Paste

6. A Paste table dialog box will appear on the screen. Click on the Link to spreadsheet radio button and then click on the Paste button. The data from the spreadsheet will be displayed on the selected slide.
7. A linked table appears on the slide as shown.


1 Importing slides helps to add slides from another presentation to your current presentation.
2 You cannot import data into Google Slides from any other data source other than Google Slides.
Adding comments is a helpful feature for collaboration and feedback. It allows you to annotate your presentation slides with notes, feedback, or explanations. Comments facilitate collaboration among multiple authors or reviewers working on the same presentation.
To add comments in a presentation:
1. Click on the slide where you want to add a comment.
2. Click on Insert in the menu bar.
3. Choose Comment from the drop-down menu.
4. A comment box will appear on the right-hand side of the slide. Type your comment in the box.
5. Click the Comment button to save your comment.
6. You can see all the comments on the right-hand side of the slide. To reply to a comment, click on it and type your response in the comment box. Click the Reply button.


In your opinion, what is more beneficial while giving feedback or taking notes, written comments or verbal comments?
Using the Dictionary feature in presentations can help you learn more about words or phrases used in your presentation. This allows you to quickly access definitions, explanations, and other relevant information about a word or phrase within your presentation.
Follow the given steps to access dictionary:
1. Click on the word or phrase in your slide that you want to look up.
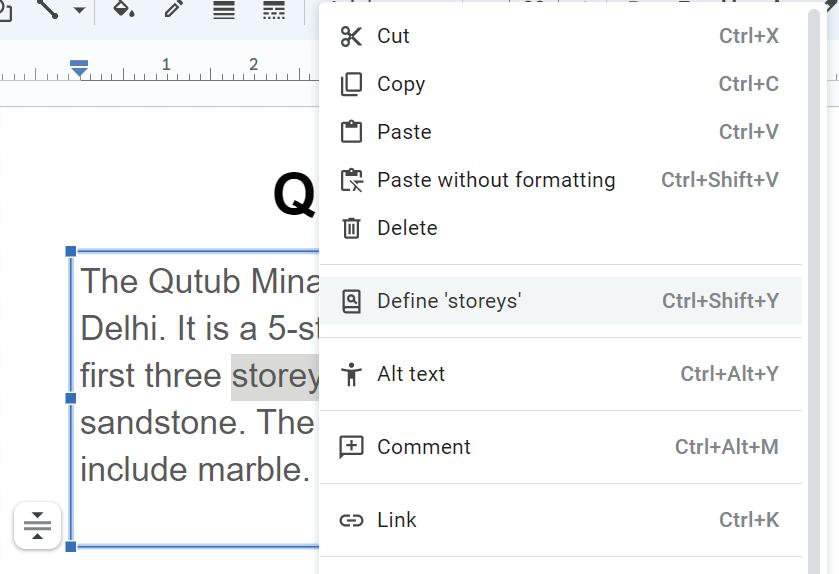
2. Right-click on the selected word or phrase. Choose Define from the context menu.
3. A sidebar on the right-hand side will open with search results from the web.
4. To close the Dictionary sidebar, click the “X” button in the top-right corner of the sidebar.

Write T for True and F for False.
1 To access the Dictionary feature, right click on the word and choose “Define” from the context menu.
2 To close the Dictionary sidebar, click the “-” in the top right-hand corner of the sidebar.
Ink annotation in presentations is like drawing or writing on the slides with colourful pens, just like we do on paper. It helps to make your presentation interactive and interesting because you can draw or highlight things to show everyone what is really important.
Follow the given steps to use the ink annotation:
1. Click on View in the menu bar. Choose Slideshow from the drop-down menu.
2. At the bottom left of the screen, click the three-dots menu and select the Turn on the pen option to activate the ink annotation tool.
3. Draw or write: (if you are using a computer) or use your finger or a stylus (if you are using a touch-enabled device) to draw or write directly on the slide.
4. You can erase annotations by selecting the tool in the bottom left viewer menu.


To learn how to use the Annotation tool, scan this QR code.
Slide zoom in presentation makes a small part of your slides look enlarged on the screen. It is like using a magnifying glass to show something important.
Follow the given steps to use the Slide Zoom feature:
1. Click on View in the menu bar. Choose Zoom menu from the drop-down menu.
2. Select zoom sizes:
Zoom In: To make the content on a slide appear larger, choose the Zoom in option. Or Press the “=” key again and again while you hold the “Ctrl” key. This action will increase the zoom in percentage.
Zoom Out: To make the content on a slide appear smaller, choose the Zoom out option. Or Press the “–” key again and again while you hold the “Ctrl” key. This action will increase the zoom out percentage.

Rearranging slides means changing the order of your slides in your presentation.
Follow the given steps to rearrange slides in a presentation.
To learn how to use zoom options, scan this QR code.

1. At the bottom left-hand corner of the screen, click on the Grid view icon. This is the Slide Sorter view.
2. Click on the slide you want to move. It will be outlined or highlighted when selected.

3. Click and hold the selected slide. Drag and drop it to the new position where you want it to be in the presentation.
You can rearrange your slides by selecting the slide in the Slide Navigation pane and using the keyboard shortcuts (Ctrl + Up/Down arrows) to rearrange slides in Google Slides. This makes it even faster and easier to organise your presentation. Did You Know?

Viewing a presentation means to watch the slides in action. It is when you sit and watch what is on the screen or the board while someone talks about it. The presenter might show pictures, talk about a topic, or share a story. You can pay attention, listen, and may ask questions if you are curious. It is an opportunity to learn, be entertained, or gain insights from what is being shared by the presenter. Follow the given steps to view a presentation:
1. Click on View in the menu bar. Choose Slideshow from the drop-down menu.

2. To move to the next slide, you can click anywhere on the slide, press the Spacebar key, or use the right arrow key on your keyboard.
3. To end the slideshow, press the Esc key on your keyboard or click the “X” button at the top of the screen.
4. When you are done with your presentation, you can close Google Slides by clicking the “X” button of the tab.
Arrange the following steps for viewing a presentation in the correct order.
Run a slideshow
Click on View.
Navigate through slides
Open your presentation in Google Slides
End the slideshow
1 Action buttons in a presentation are like magic buttons. You can set action buttons to open external content, such as a website, another PowerPoint presentation, a document, a spreadsheet, and much more.
2 Importing data into a presentation is the process of bringing external content or data into your presentation.
3 The Dictionary feature of Google Slides allows you to quickly access definitions, explanations, and other relevant information about a word or phrase within your presentation.
4 Ink annotation in presentations is like drawing or writing on the slides with colourful pens.
5 Viewing a presentation means to watch the slides in action.
A. Fill in the blanks.
1 To zoom in a slide, first click on in the menu bar and then choose the option from the drop-down menu.
2 The feature of Google Slides allows you to quickly access definitions, explanations, and other relevant information about a word or phrase.
3 To add a comment, click on the Insert menu and then choose
4 The Grid view icon at the bottom left corner of the screen enables the view.

D. Answer the following questions.
1 Explain the Dictionary feature of Google Slides.
2 What is the use of Action buttons?
3 How is the ink annotation feature helpful while presenting a presentation?
4 What do you mean by importing data in a presentation?
E. Apply your learning.
1 Mahima is presenting her slides in the classroom. She wants to write and highlight a few points with the mouse directly in her slide. Name the feature of Google Slides that can help her achieve this.
2 Keerat wants to zoom in on her presentation slide. What shortcut key must she use to do so?
3 Reena wants to give a presentation to her students. She gets caught on a word she does not understand while giving a presentation. Which feature of Google Slides will be helpful to her?
4 Tina has created a presentation in Google Slides. She then sends the presentation to her teacher for her to review. The teacher leaves comments on the slides for Tina. How can Tina respond to those comments?


Before the arrival of computers, people used to arrange information using pen and paper. In Google Sheets, we do it electronically, but the basic idea is the same.
Google Sheets is a web-based application program that helps you to manage information, do calculations, and display data graphically using charts. This program is like a digital notebook where data is organised neatly into rows and columns, which is called a worksheet. Google Sheets has its own tools to create, edit, and format.
A Google Sheets file is known as a spreadsheet, that contains multiple separate sheets. Within each sheet, data is structured in columns running vertically and rows running horizontally.
A letter identifies each column, and a number identifies each row.
The features of Google Sheets are:
Easy editing and formatting of data
Use of formulas and functions
To open Google Sheets on your computer:
Did You Know?
By default, the total number of rows and columns in Google Sheets is 1,000 and 26, respectively.
Printable sheets
Use of charts for data analysis
1. Ensure that your computer is connected to the internet.
2. Open a web browser such as Google Chrome, Microsoft Edge, or Mozilla Firefox.
3. Sign in to your Google account.
4. Type sheets.google.com and then press Enter, or click the Apps icon (represented by nine grid dots) in the top right corner and then select Sheets from the list.
5. To create a new sheet, click the Blank option.

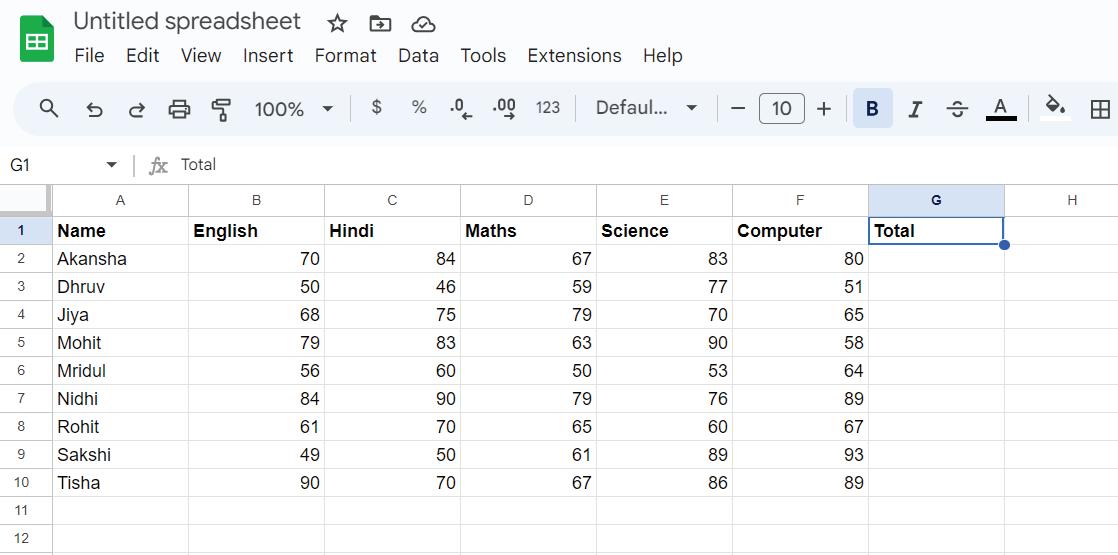
A blank Untitled spreadsheet is displayed. Let us learn about it various components.
Google Sheets has various components that make it an easy tool for creating, managing, and analysing data. Here are the main components of Google Sheets:

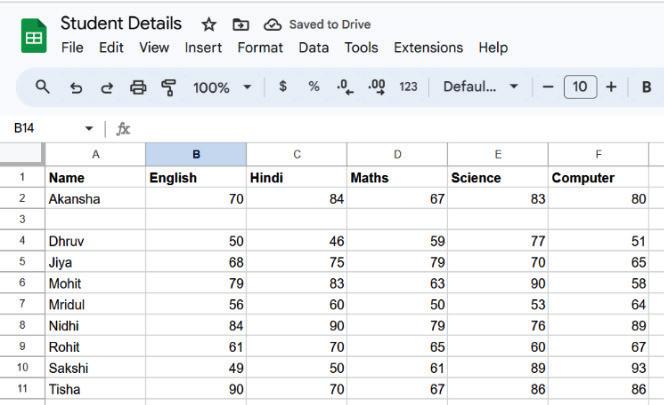
1. Spreadsheet title: The primary workspace in Google Sheets is the spreadsheet itself. The box with the spreadsheet name is in the top left-hand corner. The default name of the Google Sheets spreadsheet is Untitled spreadsheet. You can click on Untitled spreadsheet and assign a new name to your worksheet.
2. Menu bar: The menu bar contains a range of drop-down menus, including File, Edit, View, Insert, Format, Data, and more. These menus offer access to a wide variety of functions and tools for working with your spreadsheet.
3. Toolbar: The toolbar is located at the top of the Google Sheets interface and provides quick access to various commands and formatting options. The toolbar includes buttons for common actions like formatting, inserting, and editing.
4. Formula bar: Located just below the toolbar, the formula bar displays the contents of the currently selected cell. You can use it to input and edit cell contents, including formulas.
5. Cells: The intersection of a column and a row is called a cell. A cell is the basic unit of a sheet in which you can input data, formulas, and text to create and organise your information. A cell is identified as the intersection of a column and a row in which it is located. For example, the intersection of column B and row 5 is referred to as cell B5, which is called a cell address. Cells may contain three types of data: labels (text), values (numbers), and formulas (expressions).
6. Name box: It is a box that shows the cell address when a cell in a sheet is selected.
7. Sheets tab: Google Sheets supports multiple sheets within a single spreadsheet. You can use the sheet tabs at the bottom of the interface to switch between different sheets, making it easy to organise and categorise data.
The first task that you perform after making a spreadsheet is to enter data. You can enter numbers or text. To enter data in a cell, you can simply click inside it and start typing. As you enter data in cells, notice that the numbers are right aligned and the text is left aligned.
To enter data:
1. Open your Google Sheet.
2. Click the cell in which you want to enter data.
3. Type what you want to store. The information you typed is displayed in the cell and the formula bar.
4. Press Enter to move down to the next cell in the column and Tab key to move to the next cell in the row.
5. To move around and enter more data, use the Arrow keys.
6. Repeat steps 2 to 4 until you finish entering complete data.
Google Sheets allows you to select a cell, row, column, or an entire sheet. This program also allows you to select a row range or a column range. You can do this by using a mouse or a keyboard.
To select a cell
Click the cell you want to select or use the Arrow keys to move to the required cell. When a cell is selected, it becomes active and a dark border is displayed around it. Its address is shown in the Name box on the top left.

To select a row
Click the number of the row or the row heading you want to select or press Shift + Spacebar keys.

To select a column
Click the letter of the column or the column heading you want to select or press the Ctrl + Spacebar keys.

To select a group of cells
Place your mouse pointer over the first cell you want to select and then drag the mouse until you highlight all the desired cells.
To select multiple groups of cells, press and hold the Ctrl key and then repeat the above process.

Did You Know?
Multiple users can work on the same Google Sheets file simultaneously, making it easy to collaborate with other classmates or employees.
1 Match the following.
Column A
Ctrl + Spacebar key
Shift + Spacebar key
Enter key
Default Title
2 Define the following:
a Menu bar:
b Formula bar:
Column B
Untitled spreadsheet
Used to move down to the next cell
Used to select a row
Used to select a column
Editing means changing data values in your sheet. You can do this to fix mistakes or update information. For example, you may need to change numbers or add text to a cell.
To edit data:
1. Double-click the cell you want to change (or press F2). The cell becomes editable, and you see a blinking cursor where you can make changes.
2. Use the Arrow keys on your keyboard to move to the location where you want to add or remove data.
3. To erase what is to the left of the blinking line, press Backspace.
4. To add new data where the blinking line is, type it.
5. After making all the changes, press Enter.
In Sheets, you can use commands such as Cut, Copy, and Paste to duplicate or shift information and share it with others. For instance, you may want to move a row to another worksheet or make a copy of the data in one cell to another cell in the same worksheet. You can also move data within a worksheet by dragging and dropping it.
Moving data helps you rearrange information; and when you move it, it disappears from its original place.
Copying data lets you repeat information in your worksheet without retyping it. When you copy data, it shows up at both the original and new locations.
Here is how you do it:
1. Select the cell or cells that have the data you want to move or copy.
2. Click Edit menu and then select Cut or Copy
Cut (press Ctrl + X) to move data.
Copy (or press Ctrl + C) to duplicate data.
3. Click the cell where you want to put the data.
4. Select the Paste option after right-clicking the cell (or press Ctrl + V) to place the data at the new place. The data now appears in the new location.

You may need to make columns wider or rows taller in sheets to fit your data better. This is helpful when the information in the cells is too wide to fit within the regular column size.
To adjust a column’s width:
1. Bring your mouse over the right edge of the column heading.
2. Your mouse pointer turns into a double-sided arrow.
3. Drag the column’s edge until a grey line shows the width you want. The column will now be the new width you have set.
You can also change the height of rows, just like the column width, in your worksheet. This option provides various uses and can help improve what your sheet looks like. The default row height is 21 pixels and the default column width is 120 pixels.


Google Sheets remembers the last changes you made to the spreadsheet. If these changes were made by mistake, you can cancel them using the Undo feature. To undo the last performed action, click the Undo button on Toolbar or press Ctrl + Z. It cancels the last change you made to your spreadsheet.
To reverse the results of using the Undo feature, click the Redo button from Toolbar or press Ctrl + Y.
To insert cells:
1. Select the cell where you want to insert a new cell.
2. Right-click the cell and then select Insert cells. After clicking, you get two options:
Insert cells and shift right: This option inserts a new cell and shifts the currently selected cell to the right.
Insert cells and shift down: This option inserts a new cell and shifts the currently selected cell down.


To insert columns:
1. Select the column where you want to insert a new column.
2. Right-click the column. You get two options of inserting a column:
Insert 1 column left: This option inserts a new column to the left of the selected column.
Insert 1 column right: This option inserts a new column to the right of the selected column.

To insert rows:

1. Select the row where you want to insert a new row.
2. Right-click the row. You get two options of inserting a row:
Insert 1 row above: This option inserts a new row above the selected row.
Insert 1 row below: This option inserts a new row below the selected row.

To delete cells:
1. Select the cell that you want to delete.
2. Go to the Edit menu and then select Delete.
3. Select the Values option to remove the text of the cell or the Cells and shift up or Cells and shift left option to remove the cell.

Or you can right-click the cell, select Delete cells, and then select the desired option.
Delete cells and shift left: This option deletes the selected cell and shifts the next cell to the left.
Delete cells and shift up: This option deletes the selected cell and shifts the next cell to the up.
To delete columns:
1. Select the column which you want to delete.
2. Go to the Edit menu and then choose Column ‘Name’, where ‘Name’ is the column letter like ‘A’.

Or right-click the column and then select the Delete column option.
To delete rows:
1. Select the row which you want to delete.
2. Go to the Edit menu and then choose Row ‘Number’.

What happens if we press the Delete key after selecting a cell, row, or column?
Or right-click the row and then select the Delete row option.
1 Write the shortcut key used to perform the following operations.
a To make a cell editable
b To copy a cell
2 Write the use of the following two options.
a Insert 1 row above
b Insert 1 row below
Formatting in a Google Sheet refers to changing the appearance of cells, text, and data, such as adjusting fonts, colours, borders, and number styles to make the sheet more organised and easier to read.
You can apply various effects on the text in the cells. Let us learn how to apply text effects.
You can change the font in a Google sheet to improve the readability and appearance of your text.
To change the font:
1. Select the cells containing data.
2. Click the Font drop-down from Toolbar, to display a list of the available fonts.
3. Click the font you want to apply. Google Sheets immediately applies the new font.

You can change the font size and colour of data.
To change the font size:
1. Select the cells containing data.
2. Click the ‘+’ sign of Font size, to increase the font size or ‘–’ sign to decrease the font size. The selected size will be applied to the text. You can also type the number to set the font size.
To change the text colour:
1. Select the cells containing data that you want to change.
2. Click the Text color button on Toolbar, to display a list of the available colours.
3. Select the desired colour from the list. The selected colour will be applied to the data.

To apply the bold effect on the cell data:
1. Select the cells containing data you want to make bold.
2. Click the Bold button on Toolbar, or press Ctrl + B keys. The selected text is changed to bold.

To apply the italics effect on the cell data:
1. Select the cells containing data that you want to italicise.
2. Click the Italic button on Toolbar, or press the Ctrl + I keys. The selected text is italicised.

To add borders around cells:
1. Select the cells containing data where you want to put a border.
2. Click the Borders button from Toolbar.
3. Choose the type of border you want to apply. The selected cells will have border around them.

Freezing rows in Google Sheets allows you to pin data in place so that you can see it while scrolling.
To freeze a row/column:
1. Select the row/column you want to freeze.
2. Click the View menu.
3. Click the Freeze option.
4. Select the number of rows or columns you want to freeze.
You can also freeze multiple rows by moving the grey line further down the spreadsheet. When you hover over the grey line, the cursor turns to a hand icon.

1 Arrange the following steps in the correct sequence to apply border in Google Sheets. Click the Borders button from Toolbar
Select the cells containing data where you want to apply borders. Choose the type of border you want to apply.
2 Write the use of the following shortcut key combinations.
a Ctrl + B
b Ctrl + I
1 Google Sheets is a web-based application program that helps you to manage information, do calculations, and display data graphically using charts.
2 A spreadsheet is a file containing multiple sheets, each consisting of columns (identified by letters) and rows (identified by numbers).
3 Cells are the basic units where data is entered, identified by the coordinates of the intersecting column and row (cell addresses).
4 You can select a cell, row, column, or an entire sheet by using a mouse or a keyboard.
5 Editing means changing data values in your sheet.
6 Moving data helps you rearrange information; and when you move it, it disappears from its original place.
7 The Undo feature is used to cancel the last changes.
8 The Redo feature reverses the actions performed using the Undo feature.
9 You can delete a cell, row, or column from a sheet.
10 You can make your sheet more presentable by applying one or several formatting features.
11 Freezing rows in Google Sheets allows you to pin data in place so that you can see it while scrolling.
A. Fill in the blanks.
1 In Google Sheets, a spreadsheet file is known as a .
2 The intersection of a column and a row is called a
3 To undo the last action in Google Sheets, you can press the key.
4 To change the font of selected data in Google Sheets, you can click the down arrow of the option.
5 Freezing rows in Google Sheets allows you to pin data in place so you can see it while .
B. Tick () the correct option.
1 What is the primary purpose of Google Sheets?
a Sending emails
c Organising and analysing data
2 What identifies each column in Google Sheets?
b Creating digital art
d Playing video games
a Numbers b Symbols
c Letters d Colours
3 How can you reverse the action of undo in Google Sheets?
a By pressing Ctrl + Z
c By pressing Ctrl + C
b By pressing Ctrl + Y
d By pressing Ctrl + P
4 Which of the following is the basic unit in Google Sheets where data is entered?
a Cell b Row
c Column d Sheet
5 Which of the following shows the cell address when a cell is selected in a sheet?
a Formula bar
b Name box
c Toolbar d None of these
C. Who am I?
1 I am a web-based application program that helps you to manage information, do calculations, and display data graphically using charts.
2 You can find me at the intersection of a column and a row.
3 I am a component of Google Sheets that displays the contents of the currently selected cell.
4 I am a key that is used to select multiple groups of cells in Google Sheets.
5 I let you repeat information in your worksheet without retyping it.
D. Write T for True and F for False.
1 Google Sheets is a digital program used for organising, calculating, and visualising data in rows and columns.
2 Each column in Google Sheets is identified by a number, whereas each row is identified by a letter.
3 To undo the last action in Google Sheets, you can press Ctrl + Z.
4 You cannot move data in Google Sheets.
5 The Borders button on the Toolbar lets you apply a border in Google Sheets.
E. Answer the following questions.
1 What are the features of Google Sheets?
2 Identify the row and column in the cell address, H5.
3 What types of data can you type in a cell?
4 How do you select a row in Google Sheets?
5 What is the purpose of formatting in Google Sheets?
F. Apply your learning.
1 Your teacher has provided you with a list of 10 problems and their solutions. Create a simple Google Sheets spreadsheet to list these problems in one column and their corresponding solutions in another.
2 You are planning a small class event, and you need to keep track of the number of students attending it along with their food preferences (vegetarian or non-vegetarian). Use Google Sheets to create a registration form and record the responses from your classmates.
3 You collected data on the number of books read by each student in your class over the past month. Create a Google spreadsheet to display the names of the books read by all the students.
4 Type the information Names, Hobbies, Games, etc., of any four of your classmates using Google Sheets. Rename the sheet as Classmates. The details of each classmate should be in a different colour.


Have you ever made a sandwich for yourself? If you did, then you would have followed a step-by-step process for making it. Let us see the steps that you would have followed:
1. Collect the ingredients like two slices of bread, butter, chopped vegetables, cheese, and seasoning.
2. Apply butter on both the slices of bread.
3. Arrange the chopped vegetables on one slice of bread.
4. Sprinkle seasoning on the vegetables.
5. Keep a slice of cheese on top of the vegetables.
6. Keep the other slice of bread close to the sandwich.
7. Take an elder’s help to grill the sandwich.
8. Your sandwich is ready.

Observe that to create a sandwich, you have followed a step-by-step process. This process is known as an algorithm. Let us learn more about it.
An algorithm is a set of step-by-step instructions designed to perform a specific task or solve a particular problem.
Algorithms provide a systematic approach to problem-solving. They are not limited to computer science only; rather, they are prevalent in our daily lives, guiding various processes and decision-making. Note that the order of the steps in which the algorithms are executed is the most important as changing the order will not result in the expected output.
Let us write an algorithm to find the sum of two numbers.
Step 1: Start.
Step 2: Input the first number, num1.
Step 3: Input the second number, num2.
Step 4: Add the two numbers like sum=num1+num2.
Step 5: Display the sum.
Step 6: Stop.
Some real-life examples of algorithms are as follows: Getting ready for school: The steps you follow every morning to get ready for school—brushing your teeth, getting dressed, having breakfast—are the steps of the ‘Getting ready for school’ algorithm.
Packing your school bag: While packing your school bag, first you check your timetable and then pack the books and notebooks according to that timetable. You also pack the necessary stationery items, your school diary, etc. Thus, for packing your bag, you follow a step-by-step algorithm.
Organising books in the library: When you go to the library next time, observe the librarian organise the books. She looks at the genre and the number of the book. After that, she finds the shelf number, and then finally keeps the book at its place. The librarian needs to do this for every book. This is also an example of an algorithm.
Cooking a simple recipe: You read about the recipe for the sandwich at the beginning of this chapter. That was a step-by-step procedure to prepare a sandwich. Cooking by following a recipe is an example of an algorithm. Traffic lights on the road: Traffic lights follow a set pattern—red, yellow, green—to control traffic. This algorithm helps manage the flow of vehicles and keeps everyone safe.
1 Write a step-by-step algorithm for going on shopping with your mother.
[Hint: You need to prepare a list of items to be bought, to get ready, to carry a shopping bag, to walk or drive to the shopping store, etc.]
2 Write an algorithm to bake a cake.
[Hint: Gather all the ingredients... Prepare the baking tin... Mix the dry ingredients... and wet ingredients separately... Combine them... Pour the batter... Bake until...]
A flowchart is a pictorial representation of an algorithm.
A flowchart uses symbols and shapes to represent various elements such as inputs, outputs, and decisions.
These symbols are connected by arrows to show the logical flow of the process.
A flowchart helps us in various real-life situations.
Here are some of the most commonly used flowchart symbols:
Symbol Name
Purpose
Terminator To show the start or stop of the flowchart
Input/Output To show input or output.
Process
Decision

Flow line
To show a process step. For example, sum = a+b
To show a decision statement where the program can take one of the two paths based on the yes/no answer.
To show the direction in which the process flows.
Frank Gilbreth, an American engineer, and his wife Lillian were the first to introduce flowcharts.

There are many tools available for creating flowcharts. One such tool is Lucidchart. Scan the QR code to know more.
HANDS-ON
Let us create a flowchart to bake a cake.
Start
Gather the ingredients—flour, sugar, eggs, milk, and baking powder.
Sieve the flour to ensure a smooth texture.
Add and mix sugar, baking powder and milk to form a batter.
Pour the batter into a cake pan.
Put the pan in the oven. Cook it until it is golden brown.
Take the cake out of the oven and let it cool for a bit.
Spread a layer of frosting on top of the cake.
The cake is ready to be eaten.
Stop
Some real-life examples of flowcharts are as follows:
Customer Service: A customer service complaint resolution process. The flowchart would show steps like receiving the complaint, evaluating it, providing a solution, and following up with the customer.
Education: A student registration process. The flowchart could include steps like filling out registration forms, verifying information, paying fees, and receiving confirmation.
Medical Procedures: A patient diagnosis process. The flowchart would include steps from initial symptoms assessment to diagnostic tests, diagnosis, and treatment planning.
Manufacturing Process: A product delivering process. The flowchart would include steps like assembling parts, quality inspection, packaging, and shipping.
Project Management: A project planning process. The flowchart could include steps such as project initiation, planning, execution, monitoring, and closure.
Correct Flowchart
Find the mistake in the following flowchart. Draw the correct flowchart in the space provided. a Stop Start Read three numbers a, b and c average = (a + b + c) / 3 print average
Correct Flowchart
When driving a vehicle or walking on the street, it’s crucial to obey traffic light rules. With numerous vehicles on the road, not following these rules can cause accidents. Create an algorithm and flowchart based on this scenario. Algorithm
Flowchart
Complete this flowchart to check if a number is even or not. Write instructions in the empty boxes and draw appropriate shapes around the steps which are not inside a shape.
1 Algorithms are step-by-step instructions designed to perform a specific task or solve a particular problem.
2 Algorithms provide a systematic approach to problem-solving and are applicable in various real-life scenarios.
3 A flowchart is a pictorial representation of an algorithm, using standardised symbols.
4 Symbols in flowcharts represent elements like start/stop, process steps, input/output, and decisions, connected by flow lines.
A. Fill in the blanks.
1 Algorithms provide a systematic approach to
2 A flowchart is a representation of an algorithm.
3 are used to show the direction in which the process flows.
4 Terminators are used to show the or of the flowchart.
B. Tick () the correct option.
1 Which symbol is used to represent the start and end of a flowchart?
a Rectangle
c Oval
2 Flowcharts are the best representations for:
a Customer Service
c Education
3 What does a decision symbol in a flowchart typically represent?
a Processing step
c End of the flowchart
b Parallelogram
d Rhombus
b Manufacturing Process
d All of these
b Start of the flowchart
d Decision-making statement
4 What is the first step in the algorithm to find the sum of two numbers?
a Input the first number
c Start
b Add the two numbers
d Display the sum
C. Write T for True and F for False.
1 Flowcharts provide a visual representation of an algorithm.
2 Decision symbols in a flowchart are represented by a rectangle.
3 An algorithm is a set of step-by-step instructions designed to solve a particular problem.
D. Answer the following questions.
1 Define algorithm.
2 What is a flowchart?
3 Give an example of a real-life situation where algorithms can be applied.
4 How do flowcharts help in project management?
E. Apply your learning.
1 Myra wants to find the factorial of a number. Write an algorithm to find the factorial of a number.
2 Prerna had saved ₹2,000 in the bank for 5 years at the rate of 15% interest per year. Draw a flowchart to calculate the simple interest.
3 Dr. Mehta is treating a patient who has shown various symptoms. He needs to outline the steps from assessing these symptoms to conducting tests, diagnosing the condition, and planning the treatment. What tool can he use to organise this process clearly?
4 What is wrong with the following flowchart? Stop
Result = a * b Read a and b Print Result


Canva is a user-friendly online tool that allows you to create and edit images, design cards, and make various visual projects. You can use Canva to customise your designs using various tools and features.
Let us learn why Canva has become so popular with the designers and the beginners.
Here are some reasons why Canva is so popular:

Easy to Use: Canva is very easy to use. You can drag and drop pictures and shapes to create your design.
Lots of Choices: Canva has a huge library of pictures, shapes, and fonts to choose from. You can make your design look exactly how you want.
Fun and Creative: Canva makes designing fun! You can play around with different colours, fonts, and layouts to create something unique.
Canva lets you make a variety of designs. Here are a few examples:
Posters: Create posters for school projects or events.
Invitations: Design invitations for birthdays, parties, or any special occasion.
Social Media Posts: Make eye-catching posts for Instagram, Facebook, or other social media.
Photo Collages: Combine your favourite photos into a beautiful collage.
Cards: Create personalised greeting cards for holidays, birthdays, or just to say thank you.
Follow the given steps to start Canva.
1. Open your web browser like Google Chrome or Microsoft Edge.
2. Type www.canva.com in the Address bar and press Enter. Following screen will appear.

Did You Know?
Canva was co-founded by Melanie Perkins and Cliff Obrecht. They started Canva in 2012.
Imagine your school is hosting an event to highlight the value of learning beyond the classroom. Let us design an engaging poster to spread the word about this important event.
Follow the given steps to create a poster:
1. On the Home page of Canva, click on the Create a design button.

2. Select any design from suggested list. Here, we are selecting Poster. Again, click on create new design.


1. Canvas: This is the central workspace where you design your card. It is a blank or customisable area where you add and arrange card elements.
2. Design: There is a design tool having different types of templates and styles to make your card beautiful. It provides access to a wide range of professionally designed templates and style options.
3. Elements: The Elements section offers a wide range of design elements, including photos, videos, stickers, shapes, and icons. You can search and browse for elements to enhance the visual appeal of your project.
4. Text tools: These tools allow you to add and edit text on your card. You can change fonts, sizes, styles, colours, and alignment for your card’s text.
5. Zoom controls: You can use Zoom controls to get a closer look at your card design or to see the entire card at once.
6. Notes: You can add notes to your project to keep track of ideas, reminders, or specific instructions. Notes are useful for collaborating with others on your project.
7. Preview: The Preview option allows you to see how your design will appear after finishing. It is a useful tool for reviewing your design before finalising it, ensuring everything looks just right.
8. Draw tool: This tool allows you to create freehand drawings or sketches directly on your canvas. You can choose different brush sizes, colours, and opacities to customise your drawings.
Templates are the ready-made designs available in Canva to help you start your project. It is similar to colouring in a colouring book where the outlines are already there, and you add your colours and details. Follow the given steps to create a design using a template:
1. Click on the Design option in the left-hand side bar.
2. Click on the Templates tab.
3. Click on the category of templates. You can get more categories by clicking on the ‘>’ button. You can also search a particular category by typing the name in the Search templates box.
4. Click on a template that you like for your card. The template applies to the canvas with default text and design. Here, a template for Educational Poster has been selected.
5. You can make the changes to personalise the design following your requirements.


Styles provide a unique look to your project. Canva provides you with special colour combinations and font styles that you can use to make your project look appealing and special.
Follow the given steps to apply styles:
1. Click on a particular shape or text to which you want to apply the style.
2. Now, click on the Styles tab in the left-hand panel.
3. Select any colour combination from the Color palettes and font style from the Font sets sections, respectively.
4. The changes will be applied to your design as shown.

Match the component of Canva with its correct description.
1 Notes Different types of templates and styles
2 Design Wide range of design elements
3 Canvas Used to keep track of ideas, reminders, etc.
4 Elements Central workspace
By adding lines, shapes, and graphics in Canva, you can design and modify the template used in your design. These can be lines that go straight or curvy, shapes like circles or stars, and pictures or icons that make your work interesting.
Follow the given steps:
1. Click on the Elements tab on the left-hand side of the screen. You will find a variety of options, including lines, shapes, and graphics.
2. Click on the one you want to add.
3. Click on the desired element that you want to add in your design. The selected element will appear on the canvas. You can click on it and drag it to the desired place where you want to keep it.

4. Move and resize the element as needed to fit your design.
5. You can also change its colours and other details to match your project.
Imagine you are designing a Christmas card for your best friend. What elements would you include in the card, and how would you make it special?
Editing an image in Canva means making changes to a picture to make it look better or different. It includes editing the colour scheme and style, cropping, and flipping an image. Canva offers tools to help you enhance images for your card or project.
To make any changes to an image, you need to upload it to your canvas. The Uploads tab allows you to upload an image saved on your computer to the canvas. Follow the given steps to do so:
1. Click on the Uploads tab from the left-hand panel.
2. Click on the Upload files button. The Open dialog box will appear.
3. Select the image you want to edit in Canva and click on the Open button. Your image will appear below the Upload files button.
4. Click on the uploaded image. The image will appear on the Canvas.

5. Select the image on the Canvas to open the editing menu.
6. Click on the Edit image button on the editing menu. On the left-hand side, a pane will appear containing effects and filters.

8. A list of different filters and effects will appear. Click on the one you would like to apply to your image.
9. Experiment with different filters and effects until your image looks the way you want it.
Flipping an image means creating a mirrored or reversed version of the original image. Following are the steps to flip an image:
1. Select the image you want to flip.
2. Click on the Flip button.
3. Choose whether you want to flip the image horizontally or vertically by clicking on Flip horizontal or Flip vertical. The image will flip according to your choice.

There are many options that you can apply to your design to make it attractive. You can change the foreground and background of the image. Also, you can select the option to auto-adjust various aspects of your image. Let us apply these effects to the image that you have added in your design.
Steps to follow:
1. Select the image you want to edit.
2. Click on the Edit image button.
3. Click on the Adjust tab. You will find options like Auto-adjust, Foreground, Background, and more.
4. Click on the option you want to use.

5. Canva will automatically adjust the photo based on the option you selected.
6. You can finetune the adjustments if needed.
To adjust the brightness of the image, various options are available. Follow the given steps:
1. Select the photo you want to edit.
2. Click on the Edit photo option.
3. Click on the Adjust tab.
4. Look for the options like Whites, Blacks, Light and Colour. Click on the option you want to adjust.
5. Use the sliders or settings to change the white balance, brightness, colours, or texture of the photo.
Learn how to use texture and pattern in Canva.

You can also crop and rotate your image in Canva. Cropping means to remove the unwanted parts from your image so that you can focus on the important area of your image
Follow the given steps to crop the image:
1. Select the image you want to crop in Canva.
2. Click on the Edit image button to open the editing menu.
3. Click on the Crop tab. You will see handles or corners around the image.
4. Click and drag these handles to select the part of the image you want to keep.
5. Adjust the cropping area until it looks the way you want.
6. You can choose Smart Crop to automatically adjust the cropping for the best look. Or, you can pick an Aspect Ratio to crop the photo in a specific shape.
7. To rotate the photo, use the Rotate option and rotate the image according to your requirement.
Suppose you have taken a picture using your digital camera. How could you use Canva to enhance it or add a creative touch?

Note: In Canva, your design is automatically saved as you work on it. You don’t need to manually save it.
What is the difference between flip and crop operations in Canva?
1 Canva is a user-friendly online tool that allows you to create and edit images, design cards, and make various visual projects.
2 Canvas is the central workspace where you design your card.
3 The Preview option allows you to see how your design will appear after finishing.
4 Templates are the ready-made designs available in Canva to help you start your project.
5 Styles provide a unique look to your project in Canva.
6 By adding lines, shapes, and other graphics in Canva, you can design and modify the template used in your design.
7 Editing an image in Canva means making changes to a picture to make it look better or different.
8 Flipping an image means creating a mirrored or reversed version of the original image.
9 Cropping means to remove the unwanted parts from your image so that you can focus on the important area of your image.
A. Fill in the blanks.
5 an image means creating a mirrored or reversed version of the original image. Hints
1 In , you can drag and drop pictures to create engaging graphics.
2 tools allow you to add and edit text on your card.
3 The tab provides access to a wide range of professionally designed templates and style options.
4 You can use controls to get a closer look at your design.
B. Tick () the correct option.
1 What is Canva primarily used for?
a Creating and editing images
c Playing video games
2 What does cropping an image in Canva involve?
a Removing all parts of the image
c Changing the image’s size
3 What is canvas in Canva?
a It is a toolbar
c It is a set of elements
b Baking cakes
d Sending emails
b Selecting the part you want to keep
d Adding new elements to the image
b It is a sidebar
d It is the working area where you create your project
4 Which tab in Canva allows you to add lines, shapes, and graphics to your project?
a Draw
c Elements
b Text
d Design
5 Which tab allows you to upload an image from your computer to Canva?
a Uploads
c Templates
C. Who am I?
1 I am useful for collaborating with others on your project.
b Design
d None of these
2 I am a tool in Canva that allows you to create freehand drawings.
3 I allow you to create a mirror image of your design.
4 I am the space where you create your design.
5 I can automatically adjust the cropping for the best look.
D. Write T for True and F for False.
1 Canvas is not a part of the Canva editor window.
2 You cannot specify the dimensions of the canvas in Canva.
3 Templates are ready-made designs.
4 You can change colours and fonts in Canva templates to make your project unique.
5 Cropping an image means selecting the part you want to remove.
E. Answer the following questions.
1 What is Canva primarily used for?
2 What does editing an image mean?
3 Differentiate between flipping and cropping an image.
4 What is the purpose of applying templates in Canva?
5 What are the two flipping options in Canva?
F. Apply your learning.
1 Lisa is designing a birthday card for her friend using Canva. What steps should she follow to create a blank canvas?
2 Jake is adding a picture of his pet dog to his Canva project. Which option should he use to flip the image horizontally to create a mirrored effect?
3 Mike is editing a photo of his vacation in Canva. He wants to make the image brighter and adjust the colours. Which Canva tool should he use for this purpose?
4 James has designed a fantastic birthday card for his sister, but he wants to change the font style and colour of the text. Where can he find the options to achieve this in Canva?
5 Sofia wants to adjust the cropping of a picture in Canva. Explain the steps she should follow to crop the image to focus on a specific part.


Consider that your school is planning a day trip to a historical site. You know that before going on any trip, proper planning is required. Let us create a list of things that are required for this planning:
Idea: ‘Field Trip to a Historical Site’
1. Decide the destination: Name and location
2. Date and time: Proposed date and times
3. Transportation: Bus arrangements and seating assignments
4. Activities: Guided tour, exhibits, and programs
5. Lunch: Lunch packets
Noting down this information and reading it out is a cumbersome task. Instead of writing the steps, we can use mind maps to make it clearer.
Mind maps provide a creative way to visually organise and connect ideas using text, shapes, colours, and lines.
Let us draw a mind map for the above description:
Decide on the Destination
Date and Time Lunch
Field Trip to a Historical Site
Activities Transportation
Note that by looking at the mind map, the information is clear and planning for the trip can be done efficiently. You can use Canva to create mind maps. Let us learn how to do it.
Canva is an interesting tool to create mind maps. It helps in easy idea sharing, planning, and communicating. You can use Canva tools and templates for creating these visual mind maps.
Mind mapping in Canva is not limited to just text. You can also add images, icons, and charts to enhance the visual representation of your ideas.
Creating a blank canvas in Canva for mind mapping means starting a new, empty workspace where you can design your mind map from the start.
Follow the given steps to create a blank canvas:
1. Open Canva and type ‘mindmap’ in the Search box. A list of options appears.
2. Select the Mind Map option from the list.

3. Select the Create blank option from the Mindmap templates window, as shown in the figure.

4. A blank canvas appears.
Canva offers a wide range of predesigned mind map templates for various themes and purposes which makes it easy to kick-start your creativity.
Adding shapes to a mind map helps visually represent and categorise ideas. It enhances the organisation and clarity in the mind map.
Follow the given steps to add shapes in a mind map:
1. Click the Elements tab on the left menu.
2. Select the shape of your choice. For example, rectangle.
3. The shape appears on the canvas.
4. You can resize the shape by dragging the side handle of the shape, as shown in the figure.

5. You can also change the colour of the shape. Click on the Shape to select it and then click the Color icon at the top of the canvas. Select the desired colour to fill in the shape.

6. Add more shapes and make the changes, as required, for creating the mind map.

Adding text is an essential step while creating a mind map, as it allows you to convey your ideas clearly. Follow the given steps to add text:
1. Click the Text option in the left-hand menu.
2. Click Add a text box
3. A text box appears on the canvas. Drag and drop it at the place you want to write the text.

4. Click the text box that appears to select it and then type the text that you want to add. Add more text boxes for other shapes, as required.

Discuss the role of a background in a mind map. How does it contribute to the overall design?
Editing text means making changes to the text. Editing and formatting text in a mind map allows you to customise the appearance of your text for better clarity and visual appeal. Formatting includes moving and resizing the text box and applying the font style, font size, font colour, and other effects such as bold, italic, and underline. Let us discuss each of these one by one.
You can apply various font styles to your text that are available in Canva to change the overall appearance of the text in the mind map.
To change the font style, follow the steps:
1. Click the text box and look for the option of changing the font style at the top of the canvas.
2. Click it and then multiple font style options appear. Select any font type from these options.
3. You will note that the previous font style is changed to a new one that you just selected. You can apply the new font style to all the text by clicking on Change all option.

To increase or decrease the font size:
1. Click the text box and look for the font size option at the top of the canvas.
2. Click the font size and then select the appropriate size you want.
3. The size is changed, as shown in the figure.

To select a specific colour for your text to match your design’s colour scheme, follow the steps:
1. Click the text box. The Text colour option appears on the top bar.
2. Click it and then the colour palette appears in the left-hand side panel.
3. Select any colour of your choice by clicking it. The selected colour is applied to the text.

You can also apply bold (B), Italic (I), and underline (U) options (if they are available in the applied font style) for formatting your text.
Bold (B): The Bold option makes the text appear thicker and stand out from the rest. You can select the bold B icon from the top bar to apply the bold effect to regular text or remove the bold effect from already bold text.

Italic (I): The Italic (italicised) text is slanted to the right. Italicising text is often used to emphasise certain words or phrases. You can select the italic I icon to apply the italic effect to regular text or remove the italic effect from italicised text.

Underline (U): Underlined text has a horizontal line beneath it. Underlining is commonly used for headings or to emphasise specific points. If you cannot find the Underline option in the top bar, then click the More icon on the right side of the top bar. Select the underline U icon to apply the underline effect to the required text.

Strikethrough (S): When the Strikethrough formatting option is applied to a text, a horizontal line is shown passing through the middle of the text. It is used to indicate that a word or phrase is no longer valid or has been replaced. If you cannot find the Strikethrough option in the top bar, then click the More icon on the righthand side of the top bar. Select the Strikethrough S icon to apply the strikethrough effect to the text.

Change case (aA): The Change case option is used to make all the letters capital if they are small and vice versa. The capital letters can be used for headings or to convey a strong message in your mind map. Click the More icon on the right side of the top bar. Select the Change case aA icon to apply the desired text case.

Match the following.
Column A
Italic Text
Bold
Strikethrough Text
Underline Text
Adding branches to a mind map means creating links between the main topic and the subtopics. A branch connects the main idea of a mind map with other related aspects or its subtopics. Branching helps us understand the topic better. You can add various types of arrows and lines for creating branches.
To add branches, follow the given steps:
1. Click the Elements tab on the left menu.
2. Type ‘Arrow’ in the search bar and then press Enter.
3. All the shapes, graphics, photos, and videos related to the arrows appear.

4. You can choose any type of arrow according to your mind map, when you click on it, the arrow will appear on your canvas.
5. Add and place more arrows in your mind map to make it clearer.

6. You can change the colour of the arrows, by clicking on the arrow > Line color > selecting the color.

Using Canva, create a mind map to display your family tree.
1 Mind maps provide a creative way to visually organise and connect ideas using text, shapes, colours, and lines.
2 You can use Canva tools and templates for creating visual mind maps.
3 You can add shapes to your mind map by using the Elements tab from the side bar in Canva.
4 You can add text to the mind map by clicking the Text tab from the side bar.
5 Various editing and formatting effects can be applied to the text in Canva by selecting the text and then the required options from the top bar.
6 To connect the various components of a mind map, you can add arrows from the Elements tab.
A. Fill in the blanks.
Hints
1 Blank canvas means starting a new, empty where you can design your mind map from scratch.
2 text means making changes to the text.
3 You can add shapes by clicking on tab.
4 Text options in Canva allow you to make your text bold, italic, or underline it.
B. Tick () the correct option.
1 What is the purpose of adding shapes in a mind map in Canva?
a To add colours
c To add animations
b To enhance organisation and clarity
d To create sounds
2 Which tab in Canva allows you to add arrows and lines for creating branches in mind maps?
a Fonts
c Colours
3 What is the first step to create a blank mind map in Canva?
a Choose a pre-designed template
c Click the Elements tab
b Elements
d Layouts
b Type ‘mindmap’ in the Search box
d Select Create blank from Mind Map options
4 tab is used to add text to the mind map.
a Templates b Elements
c Text d Uploads
5 Adding to a mind map means creating links between the main topic and the subtopics.
a Templates b Branches
c Elements d Designs
C. Who am I?
1 I am an option in a text box that allows you to change the case of the text.
2 I am applied to text in mind maps to make them visually appealing.
3 I am a formatting option applied to text. I can make text appear thicker and stand out from the rest.
4 I help connect the main idea of a mind map with various aspects or subtopics.
D. Write T for True and F for False.
1 Mind mapping in Canva uses only text to represent ideas.
2 You can add only one shape in the mind map.
3 The Italic (italicised) text is slanted to the right.
4 Branching helps us understand the topic better.
E. Answer the following questions.
1 What do you mean by a mind map?
2 What is the use of Strikethrough feature?
3 Describe the significance of adding branches to mind map.
4 What is the underline effect?
F. Apply your learning.
1 Raj wants to make his mind map visually appealing. How can he change the font style and size of the text in the Canva mind-mapping tool?
2 Maya needs to add a shape to her mind map. Tell her how she can do this.
3 Sushmita wants to add text in the mind map. But dont know how to do that. Help her by mentioning the steps to do so.
4 Vaibhav wants to make the text italic in his mind map. Which option can he use to do so?


Robots are smart machines that behave like humans. They are programmed to do specialised tasks. Robots come in many shapes and sizes. They can be used in many fields, like medicine, space exploration, agriculture, and even in homes.
Robots generally consist of the following components:
1. Sensors: Sensors are used to detect information around the robot. They help the robot ‘see’ and ‘feel’ what’s around it. For example, cameras and temperature sensors.
2. Actuators: Actuators help the robots move and turn. They are used to enable the movement of a robot.
3. Controller: Controllers help robots make decision. It tells the robot what to do based on what the sensors ‘see’ and ‘feel’.
4. Power Supply: Robots need a source of energy, which could be batteries, a power cord, or other energy sources.
5. Frame or Structure: The physical body of the robot that holds all the components together and provides support.
6. Software: This includes the algorithms and programs that control the robot’s behaviour and tasks.
There are many robots that we can see around the world. Let us learn about the different types of robots.
A humanoid robot is a robot that looks like a human. It usually has a head, arms, and legs. Some might only have part of the body, like just the top half. Some also have faces with features like eyes and a mouth.


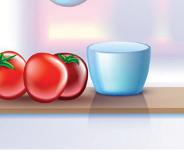


These robots help people with everyday tasks. At home, they assist with household chores. In restaurants, they help by serving food, taking orders, or cleaning tables. Delivery robots can bring groceries or packages to your door.
These robots are generally used for manufacturing purposes in factories. These robots are automated, programmable, and capable of doing movement in three or more axes. They help build things like cars by welding, painting, or assembling parts.
These robots help doctors in hospitals. Some can perform surgery with great precision, while others help with tasks like moving patients, delivering medicine, and making reports.


These robots go to places where humans can’t easily reach, like other planets or deep oceans. They help scientists learn new things about those places.


These robots are made for fun and play. For example, robotic pets that can move and respond to touch, or toys that can dance and sing.


The following are some of the famous Indian robots:
MITRA is a humanoid robot designed to assist with tasks like answering questions and engaging with visitors at various locations, such as museums, exhibitions, and educational institutions. MITRA’s primary goal is to improve human-robot interaction.
Robo-Buddy is a robot that assists with everyday tasks in homes and offices. It can provide information, perform simple functions, and help with routine chores. Robo-Buddy’s goal is to make daily life easier and more convenient by being a helpful companion.

MANAV is India’s first 3D-printed humanoid robot designed for research and education. It helps students and researchers understand robotics and human-robot interaction.
KIRAN is a robot designed for use in hospitals. It helps by transporting medical supplies, delivering medicines, and assisting healthcare staff with various tasks.
KIRAN’s main goal is to improve hospital efficiency and support patient care.
RASHMI is the world’s first Hindi-speaking and India’s first realistic lip-syncing humanoid robot. Rashmi is designed to assist in various tasks, including serving as a guide and providing information in public spaces.

1 Describe the role of following types of robots:
a Industrial robots:
2 Describe the role of Rashmi. Do It Yourself 8A
b Entertainment robots:

Robotics is the study and creation of robots—machines that can do tasks on their own. It involves designing robots, making their parts, and programming them to perform different jobs. Robotics combines knowledge from engineering (to build the robots), computer science (to develop their software), and electronics (to power and control them). The goal is to make robots that can help with tasks, work alongside people, or explore new places.


Artificial intelligence (AI) and robotics are fascinating and increasingly important areas of study that are shaping the future of technology and innovation.
AI enables machines to perform tasks that typically require human intelligence, such as understanding natural language, recognising patterns, and making decisions.
Robotics, on the other hand, focuses on the creation and operation of robots, which are machines designed to perform complex actions either autonomously or under human guidance. When AI and robotics are combined, they create intelligent robots capable of learning from their experiences and adapting to new situations.
This combination is leading to exciting developments in various fields, including manufacturing, healthcare, education, and even space exploration.
As AI and robotics continue to evolve, they hold the potential to revolutionise how we live and work, opening up new possibilities for innovation and progress.
1 Robots are smart machines that behave like humans.
2 Robots generally consist of sensors, actuators, controllers, power supply, frame, and software.
3 A humanoid robot is a robot that looks like a human. It usually has a head, arms, and legs.
4 Service robots help people with everyday tasks.
5 Industrial robots are generally used for manufacturing purposes in factories.
6 Medical robots help doctors in hospitals.
7 Exploration robots go to places where humans can’t easily reach.
8 Entertainment robots are made for fun and play.
9 Some famous Indian robots are: MITRA, KIRAN, MANAV, RASHMI and Robo-buddy.
10 Robotics is the study and creation of robots—machines that can do tasks on their own.
A. Fill in the blanks.
Hints robots sensors actuators hospitals
1 help robots to see and feel their surroundings, such as using cameras and temperature sensors.
2 are used to enable movement in robots.
3 KIRAN is a robot used in to help transport medical supplies and assist healthcare staff.
4 are smart machines that behave like humans and are programmed to do specialised tasks.
B. Tick () the correct option.
1 Which type of robot is designed to interact with people and provide information in places like museums and exhibitions?
a Humanoid Robot
c Service Robot
b Medical Robot
d Exploration Robot
2 Which robot helps with everyday tasks like serving food and cleaning tables in restaurants?
a Robo-Buddy
c MITRA
b KIRAN
d MANAV
3 What type of robot is used in factories for manufacturing tasks such as welding and assembling parts?
a Service Robot
c Industrial Robot
b Medical Robot
d Entertainment Robot
4 Which robot is known for being India’s first 3D-printed humanoid robot used for research and education?
a RASHMI
c Robo-Buddy
C. Write T for True and F for False.
b MITRA
d MANAV
1 Humanoid robots always have a full body with a head, arms, and legs.
2 Service robots can help with tasks in homes, offices, and restaurants.
3 RASHMI is known for being a Hindi-speaking humanoid robot.
4 KIRAN is used in space exploration to gather information about other planets.
D. Answer the following questions.
1 Name the different components of a robot.
2 What do exploration robots do?
3 Describe the role of MITRA.
4 What do you mean by robotics?
E. Apply your learning.
1 You have a wedding at your home, and you need help with serving drinks, taking orders, and cleaning tables. What type of robot could assist with these tasks?
2 Aarav needs robots to handle tasks like welding parts, painting, and assembling products for his factory. What type of robot would be suitable for this work?
3 Tanaya is a scientist and is researching about new planets. She needs a robot that can explore harsh environments. What type of robot would fit this role?
4 Niya is working on a school project about human-robot interaction and needs a robot that can demonstrate how robots can understand and respond to human commands. What type of robot would be ideal for this project?


Computer Vision (CV) is a domain of artificial intelligence that focuses on enabling computers and machines to interpret and understand visual information from the real world, typically through cameras. It involves the analysis of images or video streams to identify objects, detect patterns, track movement, and make sense of the visual data. CV is often used for applications like facial recognition, object detection, autonomous vehicles, and medical image analysis.
Just think about how we see things and recognise them. When we see things, our eyes capture visual information, which is then transmitted as signals through our optic nerves to the brain. The brain processes these signals, allowing us to recognise and interpret the images we see.
Similarly, in computer vision, cameras act as the “eyes” of AI systems. They capture visual data, which is converted into signals by sensors. These signals are then processed by AI algorithms or programs, enabling the system to identify objects or images.
The following image explains the workings of computer vision.


Computer vision has its applications in the fields of object recognition, face recognition, autonomous vehicles, medical imaging, robotics, and many more. These are some of the prominent applications of computer vision technology across various industries and fields.
Object Recognition: Computer vision helps identify and classify objects in images and videos for uses in security, manufacturing, and retail.


Face Recognition: It is used for to recognise individuals based on their facial features in applications, such as security and surveillance system.


Autonomous Vehicles: Computer vision enables self-driving cars and drones to navigate safely by recognising road signs, pedestrians, and other vehicles.


Robotics: Robots move because of computer vision. Computer vision allows robots to perceive their surroundings for tasks like object manipulation and navigation.

Medical Imaging: It is a boon for the medical industry as it assists doctors to analyse medical images to diagnose diseases and locate abnormalities.


Computer vision plays a crucial role in the working of two more impressive technologies these days: Augmented Reality (AR) and Virtual Reality (VR). Let us learn about them.


Augmented Reality (AR) is a technology that blends digital content with the real world in real-time. It enhances the user’s perception of reality by overlaying virtual elements on their view of the physical environment.
AR is commonly used in applications like mobile apps, smart glasses, and heads-up displays to provide additional information or interactive experiences related to the user’s surroundings.


Some examples of AR include Pokémon Go, where virtual creatures are superimposed on the real world through a smartphone camera, or AR navigation apps that display directions on the road ahead.


Virtual Reality (VR) can make you feel as if you are on a roller coaster, flying in space, or even standing on top of Mount Everest, all while you are actually just wearing a special headset in your own room!
Virtual Reality (VR) is a technology that immerses users in a completely digital or virtual environment. It often involves the use of a headset or goggles that block out the real world and replace it with a computergenerated world.
VR is used to create fully immersive experiences for gaming, training, simulations, education, and entertainment.
Users in VR can interact with and navigate through a computer-generated world, making them feel as if they are inside that environment.
Give a real-life example of a situation where computer vision is applied.

Let us perform the following experiment to understand how AI uses computer vision to translate text from one language to another.
Objective: Experience real-time translation between different languages using the Google Translate app thereby leveraging the power of computer vision.
Follow the given steps to explore how this application works.
1. Download the Google Translate app from the Google Play Store in your smartphone or your device’s app store.
2. Open the Google Translate app. The following screen appears.

3. Click on the Camera option in the bottom-right corner.
4. Select your preferred language, for example, ‘Hindi’.

5. Take a picture of the words to translate using your smartphone’s camera.
6. The translated text appears as follow.


1 Computer vision focuses on enabling computers and machines to interpret and understand visual information from the real world.
2 Computer vision has its applications in the fields of object recognition, face recognition, autonomous vehicles, medical imaging, robotics, and many more.
3 Augmented Reality (AR) blends digital content with the real world in real-time.
4 Virtual Reality (VR) immerses users in a completely digital or virtual environment.
5 Google Translate app helps you translate text from one language to another in real-time.
A. Fill in the blanks.
4 Virtual Reality creates a environment using a headset. Hints
1 Computer Vision analyses images to understand data.
2 Cameras act as the of AI systems in computer vision.
3 AR overlays elements on the real world.
B. Who am I?
1 I analyse images and videos to identify objects and patterns.
2 I overlay virtual elements on the real world.
3 I help diagnose diseases by analysing medical images.
4 I create a digital environment using a headset.
C. Write T for True and F for False.
1 VR overlays virtual elements on the real world.
2 AR replaces the physical world with a digital one.
3 Computer vision is used in autonomous vehicles.
4 Virtual Reality is used for gaming and training.
D. Answer the following questions.
1 What is computer vision?
2 What do you mean by virtual reality?
3 What do you mean by face recognition?
4 What are some applications of computer vision?
E. Apply your learning.
1 How should we tell Suhana the difference between AR and VR?
2 Naina wants to describe the workings of computer vision to her little brother. Help her to do so.


A. Fill in the blanks.
1 are superfast and the largest of all types of computers.
2 The is a network that connects computers all over the world.
3 Importing data into a presentation is the process of bringing external into your own presentation.
4 displays the contents of the currently selected cell.
B. Tick () the correct option.
1 are high-performance computers used for specialised tasks like professional photo and video editing.
a Mainframe computers
c Workstations
b Minicomputers
d Supercomputers
2 help people find addresses, get directions, and navigate unfamiliar places effortlessly.
a Online Shopping
c Maps and Navigation
b Online Payment
d Online Learning
3 Using the feature in presentations can help you learn more about the words or phrases used in your presentation.
a Dictionary
c Ink Annotation
b Comments
d Slide Zoom
4 The intersection of a column and a row is called a .
a Toolbar
c Sheets tab
C. Write T for True and F for False.
b Cell
d Formula bar
1 A computer language can be defined as a set of instructions that computers can understand and follow.
2 The internet has a lot of information that can kill people’s time while surfing the internet.
3 Ink annotation helps you watch the slides in action.
4 To select a row, press Ctrl + Spacebar keys.
D. Answer the following questions.
1 What are the advantages and disadvantages of fifth-generation languages?
2 What is a Google Drive?
3 What is the purpose of adding comments in a presentation?
4 Write the difference between Undo and Redo.
E. Apply your learning.
1 Nitin’s brother works at a large organisation that needs to process and manage massive amounts of data daily, with a focus on reliability and security. What type of computer is he most likely using?
2 Riya needs to manage her bank account, make transactions, and monitor her financial activities from her computer or smartphone. Which type of online service would she use for these activities?
3 Girdhari wants to keep the header row visible at the top of the screen while scrolling a spreadsheet. Which feature should you use to achieve this?
Test Paper 2 (Based on Chapters 5 to 9)
A. Fill in the blanks.
1 are step-by-step instructions designed to solve a particular problem.
2 is the central workspace where you can create your designs.
3 is a technology that blends digital content with the real world in real-time.
4 are smart machines that behave like humans.
B. Tick () the correct option.
1 The option allows you to see how your design will appear after finishing.
a Preview
c Design
b Notes
d Elements
2 helps identify and classify objects in images and videos for uses in security, manufacturing, and retail.
a Face Recognition
b Object Recognition
c Autonomous Vehicles d Medical Imaging
3 help robots make decisions.
a Actuators b Sensors
c Controllers d Software
C. Write T for True and F for False.
1 A flowchart is a pictorial representation of an algorithm using standardised symbols.
2 Templates are ready-made designs available in Canva to help you start your project.
3 Medical robots help doctors in hospitals.
4 Industrial robots can be an example of entertainment robots.
D. Answer the following questions.
1 Give an example of a real-life situation where flowcharts can be applied.
2 What do you mean by flipping an image in Canva?
3 What are mind maps?
4 Describe the famous Indian robot RASHMI. E. Apply your learning.


1 Observe the following statement: “Check if 6 is divisible by 2 or not.”
Which flowchart symbol should we use for the statement?
2 Seema wants to remove unwanted areas from her photo. Which option should she use in Canva to do so?
3 Manisha wants to underline some text in her mind map. Which option can he use to do so?
4 Neetu is searching for a robot designed specifically to help with household chores and provide assistance in daily activities. Which type of robot is she looking for?
This book embodies the principles outlined in the National Curriculum Framework (NCF) and the National Education Policy (NEP) 2020. It unveils the world of computer science through a unique and captivating pedagogical approach— seamlessly integrating curriculum content into the mesmerising adventures of Mel and Conji, fictional figures hailing from the enchanting world of Avora. Our aim is to prepare learners for the dynamic and technology-driven landscape of the 21st century, equipping them with the essential skills they need to thrive in an ever-evolving world.
• NEP Tags: To showcase alignment with NEP skills and values.

• Explore More: QR codes to explore an exciting application of the concept.
• Discuss: Questions to trigger engaging group discussions in the classroom.
• Think and Tell: Probing questions to stimulate thinking at an individual level.
• Did You Know? Interesting facts related to the application of a concept.
• Fun with AI: Engaging AI activities to explore and apply AI concepts in practical ways.
• Do It Yourself: Milestone exercises to practice specific concepts.
• Chapter Checkup: A pool of questions catering to all topics and skills covered in the chapter.
• Test Papers: Designed to evaluate understanding of core concepts and application of skills.
Uolo partners with K-12 schools to provide technology-enabled learning programs. We believe that pedagogy and technology must come together to deliver scalable learning experiences that generate measurable outcomes. Uolo is trusted by over 15,000+ schools across India, Southeast Asia, and the Middle East.
ISBN 978-81-978912-9-8

hello@uolo.com
Not to be sold separately