TEXAS SECTION OF THE AMERICAN SOCIETY OF CIVIL ENGINEERS
INFRASTRUCTURE ROADS GRID WATERWAYS HIGHWAYS
AVIATION DAMS DRINKING WATER WASTEWATER TRANSIT
STREETS NETWORK AQUEDUCTS AIR ENERGY SUSTAINABILITY
INFRASTRUCTURE ROADS HIGHWAYS BRIDGES AVIATION
WATER WASTEWATER TRANSIT RAIL MITIGATION STREETS
ENERGY SUSTAINABILITY RESILIENT INFRASTRUCTURE ROADS
BRIDGES AVIATION DAMS DRINKING WATER WASTEWATER
MITIGATION STREETS AQUADUCTS AIR ENERGY SUSTAINABILITY
INFRASTRUCTURE ROADS HIGHWAYS BRIDGES AVIATION
WATER WASTEWATER TRANSIT RAIL MITIGATION STREETS
ENERGY SUSTAINABILITY RESILIENT INFRASTRUCTURE ROADS
BRIDGES AVIATION DAMS DRINKING WATER WASTEWATER
RAIL MITIGATION STREETS AQUEDUCTS AIR ENERGY SUSTAINABILITY
RESILIENT INFRASTRUCTURE ROADS HIGHWAYS BRIDGES
DAMS DRINKING WATER WASTEWATER TRANSIT RAIL MITIGATION
AQUEDUCTS AIR MITIGATION ENERGY SUSTAINABILITY
INFRASTRUCTURE ROADS HIGHWAYS BRIDGES AVIATION
WATER WASTEWATER TRANSIT RAIL MITIGATION STREETS
ENERGY SUSTAINABILITY RESILIENT INFRASTRUCTURE ROADS
BRIDGES AVIATION DAMS DRINKING WATER WASTEWATER
MITIGATION STREETS AQUADUCTS AIR ENERGY SUSTAINABILITY
INFRASTRUCTURE ROADS HIGHWAYS BRIDGES AVIATION
WATER WASTEWATER TRANSIT RAIL MITIGATION STREETS
ENERGY SUSTAINABILITY RESILIENT INFRASTRUCTURE ROADS
BRIDGES AVIATION DAMS DRINKING WATER WASTEWATER
MITIGATION STREETS AQUADUCTS AIR ENERGY SUSTAINABILITY
INFRASTRUCTURE ROADS HIGHWAYS BRIDGES AVIATION
WATER WASTEWATER TRANSIT RAIL MITIGATION STREETS
AIR ENERGY SUSTAINABILITY TRANSIT SUSTAINABILITY
PREAMBLE
Assessing Texas’ infrastructure is a big task, so why do it? Since 2004, members of the Texas Section of American Society of Civil Engineers (ASCE Texas Section) began to ask questions about the state of infrastructure across Texas. How is it performing? Which areas need immediate attention? How do we prioritize our funding? How much funding is required? To answer these questions, civil engineers across the State perform studies, design, and evaluate various infrastructure systems. As experienced by Texas residents during the 2021 Twin Winter Storms Uri & Viola, answering these questions gives guidance on how to develop policy and where to invest to maximize infrastructure benefits and reliability.
Infrastructure is the foundation of our economy, safety, and quality of life, and this regularly updated Report Card aims to evaluate and grade these systems, providing a clear picture of the current state of vital infrastructure categories. This snapshot of our infrastructure systems also stands as a resource for policymakers, stakeholders, owners, and the general public to make informed decisions. The original 2004 Report Card was straightforward, with a few comments attached to each infrastructure grade. Since then, Texas has grown, and so too has our ASCE Texas Section membership, organizational resources, and volunteers. Capitalizing on this exponential growth, we have produced four more Report Cards, with the 2025 release being the 6th Texas Infrastructure Report Card (IRC). Each release has evolved in presentation and format, with each Report Card developing more categories and additional in-depth discussions. The 2025 Texas IRC follows the same Report Card format as its predecessors and was made possible by our 60-member committee of volunteers, whose efforts have led to meaningful, passionate, and informative assessments to develop grades and recommendations. We are thankful to all our committee members who have dedicated more than a year of their time and effort to produce this 2025 update.
The 2025 Texas IRC reviewed 16 infrastructure categories and recognized a steady State overall GPA with improvements and declines among multiple categories. Both the Aviation and Roads categories saw an improvement in their grade, which can be attributed to concentrated efforts across the State in these areas. It is also worth highlighting the Energy and Transit category grade changes. Within the Energy chapter, the generation, transmission, and distribution of both electrical systems and liquid fuels, as well as a market analysis of impacts, were all examined. The Energy
grade reflects a comprehensive integrated evaluation of energy to understand how the flip of a switch turns on the lights. Winter Storms Viola and Uri revealed an interdependency of systems and networks to assess the reliability. For Transit, the grade now considers data from across Texas, noting that although investments have been made in metropolitan areas, many local agencies still need support to meet the growing demands across all of Texas.
The ongoing evaluation of our infrastructure is essential for reviewing, informing, and prioritizing to ensure that Texas’ economy remains thriving as a place for Texans to live and prosper. This Report Card is a valuable tool for educating and advocating for necessary improvements and innovations across all infrastructure. Change, like the ones recommended in each chapter of this report, comes about when a group of like-minded people gather to share similar stories in different but personal ways. Armed with this Report Card and ASCE Key Policy Statements, ASCE members come together every legislative year to share their personal stories with policymakers, modeling the value of educating and advocating. Many recent State legislative sessions have focused strongly on infrastructure, whether it’s energy and power grid, stormwater and drinking water, or statewide broadband. There have been shifts in planning, standards, and funding across the State, but our target continues to move as more people make Texas their home or place of business. Our infrastructure feels this strain, while facing more frequent and intense weather events. Conversations and actions toward infrastructure advancement are vital as we continue to develop for the future of Texas.
Ultimately, we aim to ensure that Texas has a robust infrastructure supporting its growing population and future demands. Through our collective efforts, we strive to inspire positive change and build a brighter future for all Texans.
The Texas Section of the American Society of Civil Engineers (ASCE Texas Section) proudly presents the results of our 2025 Texas Infrastructure Report Card (TxIRC), a significant achievement made possible through the dedication and hard work of our committee, which spanned two presidential terms. Success was assured with the gentle oversight of 2024 ASCE Texas Section President Kimberly Cornett and 2025 ASCE Texas Section President Mark Boyd, with the strong, essential leadership of 2025 IRC Committee Co-Chairs Griselda Gonzales and Austin Messerli leading a team of more than 60 passionate volunteers, arduously crafting detailed chapters reflecting the current state of our infrastructure across Texas.
Subject matter expert teams collaborated across various infrastructure categories to ensure adherence to the ASCE TxIRC format. We deeply appreciate key government agencies for their invaluable stakeholder reviews, which significantly shaped this report. Infrastructure plays a vital role in our daily lives and directly impacts our economy, society, security, and sustainability. As representatives of more than 11,000 civil engineers statewide, we understand and passionately uphold our duty to inform the public and policymakers about the current condition of Texas infrastructure and where improvements are essential for that vital role to remain unfettered.
The Texas Infrastructure Report Card has evolved to become a critical tool that clearly communicates the current state of infrastructure to people of all knowledge levels. It supports advocacy for essential infrastructure funding from all levels of government, local to national. This document does not evaluate any government entity or individual; rather, it aims to help Texas residents, and their government representatives, understand our infrastructure’s condition. We commend the dedicated efforts of government agencies serving our great state. The staying power of our 2021 Texas Infrastructure Report Card was revealed to our legislative committee at the 2023 ASCE Texas Section Legislative Drive-In. After 2 years, our Report Card and hard work continued to be prominently displayed and discussed in our representatives' and senators’ offices. It was a testament to our collective volunteer
Continued on page 6
Continued from page 6
efforts to raise awareness about this vital document. Furthermore, the Report Card continues to pop up frequently in fictional Hollywood scenes and in the actual news where infrastructure deficiencies may have been the result of fictional and factual yet to be implemented improvements previously pointed out by the Report Card.
The release of the 2025 ASCE Texas Infrastructure Report Card highlights the incredible dedication of our co-chairs, Griselda and Austin and their committee, who worked tirelessly to surpass our previous achievements. With a record-breaking number of categories covered and an unprecedented depth of supporting research, the Texas Section has set a new national standard—educating the public and effectively communicating the critical need for infrastructure funding to our elected officials.
Join the ASCE Texas Section in championing increased infrastructure funding. Now is the time to grow build on the foundation of infrastructure investment to drive Texas’s economic prosperity, enhance public safety, promote environmental stewardship, and build with resilience.
We warmly invite everyone to support sustained investment in our critical infrastructure. Our heartfelt thanks go to the members and past & present leaders for their unwavering support of the IRC report card committee. Your dedication to building a better Texas is paving the way for real progress toward a safer, more sustainable quality of life for all Texans.
Kimberly K. Cornett PE, CFM, F. ASCE
Mark K. Boyd PhD, PE, M. ASCE
ASCE Texas Section 2024 President ASCE Texas Section 2025 President
PHOTO: BRIDGES OVER A DEEP GULLY IN VAL VERDE COUNTY IN SOUTHWEST TEXAS; CAROL M. HIGHSMITH
EXECUTIVE SUMMARY
Texas is growing. This is a recurrent theme among most sectors of infrastructure. While population growth is fuel for Texas’ economy, it places considerable strain on the State’s resources and infrastructure. Our continued investments thus far are noteworthy as more people and businesses move into the State, but the need for expanded utilities, transportation, energy, and waste processing facilities is increasing exponentially, placing substantial pressure on existing and aging systems. This rapid growth presents both challenges and opportunities for Texas.
The challenges Texas’ infrastructure faces are explained by analyzing eight key criteria: capacity, condition, funding, future need, operation & maintenance, public safety, resilience, and innovation. (See Methodology > Grading for more information on these key criteria.) The opportunities are presented as recommendations in each category of infrastructure. The Infrastructure Report Card (IRC) Committee, comprised of 60 civil engineer volunteers with varying specialties, developed these findings. More than a year was dedicated to planning, collecting available data, holding discussion meetings, conducting interviews, analyzing insights, and ultimately, developing this Report to summarize the findings. The 16 sectors of infrastructure evaluated included Aviation, Dams, Bridges, Broadband, Drinking Water, Energy, Hazardous Waste, Levees, Ports, Public Parks, Roads, Rail, Solid Waste, Stormwater, Transit, and Wastewater. Four first-time categories (bold) are introduced in this update.
A comparison of the 2021 Texas IRC with this 2025 release indicates limited grade improvements, several grade decreases, and the remaining holding steady. The grade changes are as follows:
• Two categories improved: Aviation and Roads
• Four categories remained unchanged: Bridges, Dams, Public Parks, and Stormwater
• Six categories declined: Drinking Water, Energy, Levees, Solid Waste, Transit, and Wastewater
Future reports will reveal how the four newly assessed categories—Broadband, Hazardous Waste, Ports, and Rails, will fair after this public assessment and active advocacy within government agencies and public awareness.
The 2025 Report Card revealed Texas remains at an overall GPA of a “C”. Aviation and Bridges received the highest grades which sustained the State average combined with eight infrastructure categories in the average “C” range. Six categories were in the “D” range. The lowest scores, held by Levees and Wastewater, declined since the last release, requiring substantial improvements.
Readers are encouraged to read the complete Report to obtain a full comprehension of the process, grading, and recommendations. This Report Card is a tool that all Texans can benefit from to better understand where our State’s infrastructure stands from a sustainability and safety perspective. Armed with these insights and technical analysis, Civil Engineers, their families, friends & neighbors, alongside State agencies and legislative representatives, can push for change where it’s needed most.
ASCE Texas Section members’ vision is to build a better quality of life across the street and around the world.
OVERALL GPA AND GRADES BY INFRASTRUCTURE CATEGORY
The 2025 Texas IRC grade of a “C” indicates improvements in categories where investments have been prioritized and highlights the urgent need to provide resources and address ongoing issues in underinvested infrastructure categories. One such category worthy of mention is Wastewater, which continues to pull down the State average grade. Other categories remained stagnant or fell to below average and continued to deteriorate. The inclusion of new categories provides a foundational understanding of the condition of our infrastructure and allows us to evaluate policy, funding, and standards needed to continue protecting the safety, public health, and environment, collaboratively for all Texans.
METHODOLOGY
INFRASTRUCTURE CATEGORY SELECTION
Texas ASCE civil engineers worked hard in 2024 to assess the state’s various infrastructure categories. The assessment follows the guidance and methodology established by ASCE, the national organization to grade our state infrastructure. ASCE releases a National Infrastructure Report Card assessing major infrastructure categories. Texas has strived to follow suit, adding infrastructure categories. The 2021 ASCE Texas Section’s Infrastructure Report Card examined 12 of the 17 categories. The 2025 Report Card adds 4 new infrastructure categories for a total of 16 of the now 18 categories (new categories highlighted below). This edition of the Report Card covers the following infrastructure categories: Aviation, Bridges, Broadband, Dams, Drinking Water, Energy, Hazardous Waste, Levees, Ports, Public Parks, Rail, Roads, Solid Waste, Stormwater, Transit, and Wastewater. The inclusion of these new categories reflects the evolving needs and priorities of Texas' infrastructure landscape. By expanding the scope of the report, engineers and policymakers are better equipped to address emerging challenges and leverage opportunities for improvement. The addition of Broadband demonstrates the growing reliance on digital access across the state while the focus on Ports emphasizes its economic significance. The Hazardous Waste category offers valuable insights into the impact of our thriving economy on human health and the environment.
Each category in the Report Card is thoroughly evaluated based on eight key criteria, including capacity, condition, funding, future need, operation and maintenance, public safety, resilience, and innovation. This comprehensive assessment provides a snapshot of the current state of infrastructure and helps to prioritize areas for investment and intervention.
GRADING METHODOLOGY
The grading methodology has remained consistent using a simple A to F school report card format. The Report Card examines current infrastructure conditions and needs, assigning grades, and makes recommendations to raise them.
The 60-member Texas Infrastructure Report Card Committee gathered data and prepared detailed summaries for each infrastructure category. The Committee coordinated with public agencies, private firms, and non-profit groups to gather the data and references presented herein. Summaries provided for each infrastructure category were peer-reviewed by members of ASCE’s Committee on America’s Infrastructure.
In addition, the summaries provided for each infrastructure category were reviewed by various stakeholders. ASCE Texas Section continued to work with past Infrastructure Report Card Committee Chairs and Section Past Presidents to liaise with stakeholders across the state, including public agencies, to confirm the most recently available data was considered for the Report Card.
The collaboration of public, private, and university volunteers, along with the peer and stakeholder review process, resulted in this comprehensive assessment of Texas infrastructure.
The Infrastructure Report Card Committee assessed all relevant and available data and references, consulted with other technical and industry experts, and assigned grades for each infrastructure category using the following criteria
• CAPACITY: Does the infrastructure’s capacity to meet current and future demands?
• CONDITION: What is the state of the infrastructure’s existing or near future physical condition?
• FUNDING: What is the current level of funding from all levels of government for the infrastructure category as compared to the estimated funding need?
• FUTURE NEED: What is the cost to improve the infrastructure compared with the future funding prospects to address the need?
• OPERATION AND MAINTENANCE: What is the owners’ ability to operate and maintain the infrastructure properly? Is the infrastructure in compliance with government regulations?
• PUBLIC SAFETY: To what extent is the public’s safety jeopardized by the condition of the infrastructure and what could be the consequences of failure?
• RESILIENCE: What is the infrastructure system’s capability to prevent or protect against significant multi-hazard threats and incidents? How able is it to quickly recover and reconstitute critical services with minimum consequences for public safety and health, the economy, and national security?
• INNOVATION: How does future technology integrate with today’s infrastructure?
GRADING SCALE
EXCEPTIONAL, FIT FOR THE FUTURE
The infrastructure in the system or network is generally in excellent condition, typically new or recently rehabilitated, and meets capacity needs for the future. A few elements show signs of general deterioration that require attention. Facilities meet modern standards for functionality and are resilient to withstand most disasters and severe weather events.
GOOD, ADEQUATE FOR NOW
The infrastructure in the system or network is in good to excellent condition; some elements show signs of general deterioration that require attention. A few elements exhibit significant deficiencies. Safe and reliable, with minimal capacity issues and minimal risk.
MEDIOCRE, REQUIRES ATTENTION
The infrastructure in the system or network is in fair to good condition; it shows general signs of deterioration and requires attention. Some elements exhibit significant deficiencies in conditions and functionality, with increasing vulnerability to risk.
POOR, AT RISK
The infrastructure is in poor to fair condition and mostly below standard, with many elements approaching the end of their service life. A large portion of the system exhibits significant deterioration. Condition and capacity are of serious concern with strong risk of failure.
FAILING/CRITICAL, UNFIT FOR PURPOSE
The infrastructure in the system is in unacceptable condition with widespread advanced signs of deterioration. Many of the components of the system exhibit signs of imminent failure.
AVIATION
EXECUTIVE SUMMARY
Texas remains a crucial geographic hub for domestic and international air passenger travel, as well as air freight, boarding 90 million passengers and reported moving three million tons of cargo in 2022. Texas has six of the top 50 busiest airports in the US. The airfield infrastructure condition remains good overall. As passenger traffic returns to or exceeds pre-pandemic levels, strains are placed on terminal facilities. Airports have used the Federal Aviation Administration (FAA), Infrastructure Investment and Jobs Act (IIJA), and local funds to increase terminal capacity over the last several years. General Aviation airports continue to grow, with 9,100 aircraft based throughout Texas and 5.7 million operations contributing approximately $2.5 billion to the State economy. Texas has made considerable progress in bridging the funding gap thanks to increased State funding alongside federal support, enabling a substantial rise in planned projects for the upcoming years.
CONDITION
Texas is home to 26 commercial-service and 266 General Aviation (GA) airports. There are 184 GA airports, and two heliports included in the current National Plan of Integrated Airport Systems (NPIAS). Texas GA airports are home to more than 26,000 registered aircraft and have 9,100 based aircraft. As of 2018, Texas commercial service and GA airports generated more than $94.3 billion in economic impact to the State and supported more than 778,000 jobs. Of that overall number, GA had an annual impact that exceeded $9.3 billion and was responsible for supporting 48,000 jobs and a labor income of $2.5 billion annually. Dallas Fort Worth International Airport
(DFW) ranked as the third busiest airport in the U.S. in 2023 while George Bush Intercontinental Airport (IAH) in Houston ranked 15th, Austin-Bergstrom International Airport (AUS) ranked 29th, and Dallas Love Field (DAL) ranked 32nd.
Texas’ current airfield infrastructure is satisfactory, (airport able to operate in normal conditions with maintenance), to good condition (airport operating at capacity with minimal maintenance). Airfield pavement rehabilitation has occurred at commercial service and GA airports through continued investments from the FAA’s Airport Improvement Program (AIP), the IIJA, airport sponsors such as city, county, or airport boards, and the Texas Department of Transportation’s (TxDOT) Aviation Block Grant. As of 2023, the NPIAS report shows that 98% of commercial airports have airfield pavement in fair condition or better. TxDOT has reported that, as of April 2020, GA airports are reporting runways and taxiways in satisfactory condition with a pavement condition index (PCI) rating of 75 (out of 100). Although runway and taxiway conditions can be an easy and convenient representation of our current infrastructure, the pavement is only one of many components.
In the top 20 North American passenger growth (2022 Q2 to 2023 Q2), IAH was +12.0% while DFW was +9.6%. Passenger traffic through commercial airport facilities has recovered to pre-pandemic numbers. DFW served more than 81 million passengers in 2023, which is an 11.4% increase from 2022 and an 8.9% increase from 2019. IAH had 46.1 million passengers in 2023, while HOU saw 14 million total passengers in 2023. All are at or above 2019 numbers. The increase in passengers has strained the facilities at many of the commercial service airports.
More than one quarter (26%) of U.S. airports are hampered by insufficient terminal space, preventing the addition of more airlines and posing a threat to their expansion and growth. Texas commercial service is also feeling this pinch. Many Texas airports are constrained by outdated aviation infrastructure in terminals, support facilities, baggage handling, and other areas. Texas commercial service airports are overcrowded and cramped, leading to inefficiencies during peak demand times. In addition, parking and ground transportation structures, plus their connections to other facilities, need rehabilitation. While the IIJA funding has helped alleviate some congestion, there are many terminal and landside projects in progress at various airports around Texas.
CAPACITY
Commercial service airports are public facilities with scheduled passenger service and 2,500 or more enplaned passengers boarding per year. Texas has 26 commercial service airports, which together received 90 million enplanements in 2022. Currently, more than one million jobs are sustained by commercial service airports, contributing more than $40 billion to local payrolls while providing an overall economic impact of $140 billion to the Texas economy.
FAA’s NPIAS continues to forecast a 2% long-term commercial passenger demand growth. The State’s airport airfield capacity is largely sufficient because runways and taxiways can accommodate most air traffic demand. Some needed capacity improvements include airfield geometry updates to accommodate larger aircraft for longer haul routes. Capacity constraints are related to cargo sorting facilities, terminal gates, Federal Inspection Facilities (FIS), aircraft parking aprons for Remain Over Nights (RONs), Ground Support Equipment (GSE) areas, and terminal garage parking.
Texas aviation activity continues to grow at a slightly higher rate than the U.S. average. Currently, Texas GA airports handle approximately six million operations (take-off or landing) annually. Texas has more than 26,000 registered aircraft making up 9% of the total U.S. registered aircraft fleet. Most Texas GA airports continue to have enough capacity for the near term. The larger GA airports’ designated relievers continue to program projects to increase capacity and safety, enhance service at major commercial service airports, and meet the recent changes to the FAA’s primary airport design standard the FAA Airport Design Advisory Circular 150/5300 -13 (latest edition).
INNOVATION
Next Generation Air Transportation System (NextGen) programs continue and are being completed at many commercial service airports around the country. The NextGen program will be phased out and rolled into the Airspace Modernization Office. This and future programs are used to improve data communication between pilots and air traffic controllers and communicate more efficiently, with less risk of miscommunication than radio communications. The switch to a primarily satellite-enabled navigation system is more precise than traditional ground-based navigation. Satellites enable the FAA to create optimal flight paths in the national airspace, from departure to cruising altitude to landing. These procedures have increased flight safety and efficiency and helped to improve the environmental performance of aircraft.
DFW broke ground on an electric Central Utility Plant (eCUP), which will be powered by 100% renewable sources. This plant is part of DFW’s Net Zero Carbon by 2030. AUS is installing a new more efficient baggage handling conveyor system that will process 4,000 bags per hour, increasing reliability and reducing delays.
Other areas of airport innovation include the study of battery powered autonomous shuttles using vertiports, clean energy vehicles such as electric shuttle buses, and the use of touchless technology, which are also increasing to improve customer service experience. DFW Airport has begun to introduce programs to foster an innovative culture among its employees, improving workflow and processes. DFW, IAH, and HOU have also introduced more biometric scanning tools to increase efficiency and improve passenger experience.
FUNDING AND FUTURE NEEDS
Commercial service airports in Texas utilize FAA AIP entitlement, discretionary funds, and Passenger Facility Charges (PFC) for airfield infrastructure improvements. Commercial service entitlement and discretionary grant funding over the last five years was $1 billion. IIJA funding is expected to total approximately $1.04 billion from Fiscal Year (FY) 2022-2024 for the FAA’s Southwest Region, which includes Arkansas, Louisiana, New Mexico, Oklahoma, and Texas. FAA AIP grant funding is expected to continue at an average of approximately $200 million annually. PFCs vary by the number of enplaned passengers that fly from the airport. This fee has been capped at $4.50 per passenger for over two decades and should be raised to cope with growing demand. Depending on the airport, economy, and other outside factors, the amount a commercial service airport receives can fluctuate significantly from year to year. The most recent passage of the FAA Reauthorization Act of 2024 will aid in securing funding for airport infrastructure in Texas through 2028.
Terminal projects account for the largest share of airport infrastructure needs. Terminal expansion and/or renovations are currently taking place at AUS, DFW, IAH, and HOU. Such projects are needed to accommodate more passengers and implement new security requirements, facilitate increased competition among airlines, and enhance the passenger experience. Legacy carriers such as United and American are shifting to larger aircraft for international services, while low- and ultra-low-cost carriers such as Spirit and Avelo continue to initiate service at Texas airports, creating a demand for new and wider gates.
According to Airports Council International (ACI), Texas airport infrastructure needs totaled $11.3 billion from 2013-2023. The current NPIAS identified over $4 billion from 2023-2027 will be needed for maintenance and development of existing Texas airports. Additional investments and funding sources from the IIJA and state airport development grants, such as the Texas Aviation Development Program and the RAMP grants also aid in airport improvement here in Texas.
Capital improvements at Texas GA airports are funded through a combination of FAA AIP grant funds which are administrated by TxDOT’s Aviation Division, state funding, and local funds. Texas GA airport’s funding levels over the three-year period from FY 2025 to 2027 are anticipated to increase due to the IIJA and State Airport Development Fund. The most current Texas Aviation Capital Improvement Program (CIP) has $472 million programmed for fiscal years 2025 to 2027, representing $242 million in federal funding, $89 million in state funding, and $140 million in local sponsor funding. This is a significant increase in funding over normal funding levels, which are around $200 million over three to five years. These additional planned funds will boost GA airport development and set them up for success over the next several years. The objectives for this funding are to enhance safety, preserve existing facilities, respond to present needs, and provide for anticipated needs.
Additional funding from TxDOT’s Routine Airport Maintenance Program (RAMP) continues to allow GA airport sponsors to use TxDOT district staff or bid prices from their own contracts to perform a variety of maintenance work on their airports.
PUBLIC SAFETY, OPERATION, MAINTENANCE, AND RESILIENCE
The FAA continues to improve the national airspace to make it safer and more efficient for the flying public. GA aircraft continue to be updated with global positioning system (GPS) equipment, while more GA airports are requesting GPS and lateral navigation (LNAV)) approaches into their airports to improve location accuracy on approach.
Another stress on airport development is the changing climate and our ever-evolving understanding of Texas weather. Drainage continues to be critical for airport operations. Texas is experiencing larger and more intense storms than ever, making severe flooding more likely. Airfield operations can be compromised by flooded runways and taxiways. Passenger access to and from the airport can also be impaired by inadequate storm water management on the landside portions of the airport as well. An example of this can be seen when heavy rain hits Bush Intercontinental Airport in Houston (IAH). There have been some weather incidents at IAH where access to the terminal was prevented due to flooding along JFK Boulevard. This has prevented passengers from making their flights on time. For Texas airports to remain resilient and operational when faced with increased stormwater pressures, new and improved drainage master plans must continue to be developed. Routine maintenance and management of stormwater systems must be performed to minimize preventable instances of flooding.
Providing alternative energy sources for airports would improve resilience. Many airports across the country are collaborating with their local utilities and investing in microgrids for their operations. These grids use solar, wind, and geothermal fuel sources. Some Texas airports are in the initial phases of creating microgrids. However, this process should be expedited to ensure critical air service can be maintained during state or national emergencies.
PHOTO: DFW AIRPORT FOUNDERS PLAZA; FRANCISCO JOSÉ ZANGEROLAME
AVIATION
RECOMMENDATIONS TO RAISE THE GRADE
• Increase the cap on the Passenger Facility Charge (PFC) so Texas airports may access the capital needed to make the needed improvements to the state’s aviation infrastructure.
• Continue the increased state funding for GA airports.
• Continue NextGen and GPS systems for improving the safe and efficient movement of air traffic.
• Continue to plan and expand the use of alternative energy sources at airports.
• Invest in modernization and expansion of existing airport landside and airside facilities to ensure resiliency and sustainability and to accommodate future airline growth.
• Invest in stormwater capacity improvements to accommodate rainfall patterns within the state.
• Invest in intermodal and multimodal airport connections for passenger movements and ‘nearshoring’ for cargo logistics. This will require coordination and collaboration with state and local governments and transportation systems.
Sources
• National Plan of Integrated Airport Systems (NPIAS): https://www.faa.gov/airports/ planning_capacity/npias/
• FAA Grant History - https://www.faa.gov/airports/aip/grant_histories/lookup/
• www.faa.gov/nextgen
• US DOT - Small Community Air Service Development Program (SCASDP) - https:// www.transportation.gov/policy/aviation-policy/small-community-rural-air-service/ SCASDP
• DRAFT TxDOT Aviation Capital Improvement Plan 2025-2027
• Texas Aviation 2018 Economic Impact Study
• ACI Report – Texas Airports are Terminally Challenged
• Airports, News & Analysis, North Amer8ca March 23, 2023
• Airport Improvement Nov 28, 2023
BRIDGES
BRIDGES
EXECUTIVE SUMMARY
Texas’ transportation network includes more than 56,000 bridges and bridge-class culverts¹, which support 616 million vehicles daily. Ongoing investment and maintenance are critical to support Texas’ growing economy and its population, currently at 30.98 million, is projected to increase by 34% by 2050. Despite significant efforts, including an annual investment of $1.1 billion to expand bridge capacity and $736.4 million for preservation, funding remains insufficient to meet future demands. One challenge is aging infrastructure, with more than 42% of bridges built before 1974, and innovative technologies and resilient design can help address this challenge. The State’s proactive measures in public safety and bridge inspection programs have successfully reduced the percentage of bridges in poor condition to 1.23% from 1.26% a year ago. However, the need for substantial future investment, estimated at $2 billion annually for expansion and $1.8 billion annually for maintenance, is critical to ensure the longevity and safety of Texas’ bridge infrastructure network.
INTRODUCTION
The 2024 National Bridge Inventory (NBI) data indicates that Texas has more than 56,000 bridges that carry traffic, more than twice the number of bridges in any other state. To give perspective, Texas has nearly 30,000 more bridges than any other state in the nation and more bridges than 18 states combined. With an overall deck area of about 606 million square feet and a total estimated bridge asset of $55.1 billion*, these bridges and bridge-class culverts are responsible for carrying 616 million vehicles per day. Texas’ inventory can be grouped into two categories: on-system bridges and off-system bridges.
On-system bridges are on state highway systems and are funded by a combination of state and federal sources. Texas has more than 18,000 on-system bridges which also includes bridge-class culverts. Together, they represent about 387 million square feet of deck area. Off-system bridges are not on the state highway system, and are owned and maintained by a county, city, or other local or regional governmental unit.
CAPACITY
With the second largest economy in the nation, Texas must continue to develop and maintain its bridge inventory to support vehicle and freight demand. Bridges that are not maintained in a State of Good Repair (SOGR) will increase transportation costs and adversely impact the economy. In short, ill-maintained bridges will lead to more expensive repairs, potential weight restrictions, or closures. To keep up with this demand, the Texas Department of Transportation (TxDOT) and the off-system jurisdictions have added nearly 10.4 million square feet of bridge deck area per year by investing an average estimated amount of $1.1 billion* annually.
Based on a 10-year analysis of the NBI data (from 2015 to 2024), Texas has increased its deck area by 2.27%. However, Texas’ population is estimated to grow by 34% to 40.6 million people by 2050 as reported by the Texas Demographic Center (TDC). In other words, population increases demands more transportation, particularly the number of heavy trucks needed to deliver goods to keep the Texas economy running. Heavy trucks also mean accelerated deterioration of Texas bridges and bridge-class culverts. Texas must look at different strategies to increase its capacity while efficiently deploying them.
CONDITION
Despite the large number of bridges, over the past five years, Texas has consistently managed to reduce the percentage of bridges in poor condition to 1.23% (down from 1.26% in 2023). This puts Texas in third place behind only Nevada (1.14%) and Arizona (1.16%) with the least bridge percentage in poor condition. Based on a 10-year analysis of the NBI data (from 2015 to 2024), Texas has shown for the second consecutive year a reduction of the number of bridges classified as “fair.”
Currently, more than 18,000 bridges in Texas are on the National Highway System (NHS). Of those, TxDOT is responsible for maintaining nearly 90% of bridges on the NHS. As stated in the latest TxDOT Transportation Asset Management Plan (TAMP 2022), the agency plans to invest $736.4 million in bridge preservation annually. However, even with the extra investment, the condition of bridges on the NHS is forecasted to slightly decline over the 10-year period (TAMP 2022).
FUNDING AND FUTURE NEEDS
Federal and state government agencies primarily fund bridge projects. Congress appropriates funds through the Highway Trust Fund (HTF) and notably authorized a $90 billion transfer in 2021 as part of the Infrastructure Investment and Jobs Act (IIJA) from the General Fund to the HTF to subsidize the federal transportation program. These funds are split into four programs, one of which is the Bridge Formula Program. This program will provide an estimated $537 million between Fiscal Years (FY) 2022 to 2026 to address bridge infrastructure and help Texas repair and upgrade bridges that need improvements and replacement.
Concurrently, the state leverages a variety of funding sources for transportation: motor fuel taxes, vehicle registration fees, sales tax, and oil and gas production taxes. The sales tax component stems from Proposition 7, which allows the state legislature to either extend or retain fund transfers to the State Highway Fund (SHF) from the state Sales and Use Tax and from the Motor Vehicle Sales and Rental Tax. Meanwhile, the oil and gas production tax component from Proposition 1 directs 50% of existing oil and natural gas severance taxes to the SHF. Based on the TxDOT Unified Transportation Program (UTP) 2024 projections, Propositions 1 and 7 allocate a combined approximate $4.7 billion for non-tolled highway construction, maintenance, and rehabilitation projects per year. Unfortunately, only a small percentage of these funds are utilized specifically for bridge projects. For instance, 2024 UTP only allocated just over $468 million per year for bridge replacement and rehabilitation. Funding for new bridges is included in other categories of the UTP based on the type of project. However, the TxDOT projected letting for FY 2024 is only $760 million with less than $300 million available for new bridge projects.
This lack of investment is concerning for the future. Texas’ increasing population, as mentioned previously, will require an estimated $2 billion per year of investment for bridge expansions. An additional estimated $1.8 billion per year is needed to erase the backlog of deficient bridges for the next 10 years. Despite the contributions of the IIJA, there is simply not enough funding to address both expansion and appropriately repair and rehabilitate Texas’ existing bridge network.
Furthermore, the number of full-time employees available to work on these projects is not increasing at the necessary pace to match the growing size and number of required projects. TxDOT recently provided sizable raises to incentivize their staff and competitively hire; however, as you can see from the figure below, a substantial investment to hire approximately 3,000 more full-time employees is still required to meet the demand.
OPERATION AND MAINTENANCE
The average service life of a bridge is 50-75 years. As reported by latest NBI data from 2024, more than 42% of the state’s bridges were built in or before 1974. This indicates they have reached the 50-year benchmark and are potentially approaching the end of their service life. As the bridges continue to age, they require meticulous maintenance, load management, and consideration for replacement or rehabilitation. To ensure the traveling public can safely and efficiently reach their destinations, appropriate operation and maintenance efforts must be made throughout the state. TxDOT uses the Highway Bridge Program (HBP), the Bridge Maintenance and Improvement Program (BMIP), and the Bridge System Safety Program (BSSP), among other initiatives, to maintain and improve the condition of bridges across Texas. These programs help identify and fund bridges that need replacement, preservation, or upgraded safety features.
Through these asset management tools and organized procedures, TxDOT maintains a bridge inspection program that requires each bridge to undergo an inspection every two years. Bridges with ongoing issues may require more frequent inspections, and complex structures, such as fracture-critical steel structures, require even more inspection and testing throughout the bridge’s life. TxDOT takes advantage of the consulting community for much of its bridge inspection work, expanding its resources and allowing its huge inventory of bridges to be inspected in a timely manner. Certified inspectors carry out inspections, following the NBI rating (1-9, poor to good) system, which is given to the Federal Highway Administration (FHWA). Issues can, on the recommendation of the inspector, be advanced into a formalized Follow-Up Action (FUA) report, which can be sent to local maintenance crews for repair or incorporated into repair contracts. These programs and initiatives have shown to be effective, as the number of bridges needing some type of rehabilitation work or some structural work has been reduced from 38%, 25 years ago, to currently 18.4%. However, the number of aging bridges has still nearly doubled.
The state is committed to continuing this course and plans on spending $736.4 million on bridge maintenance annually through 2031 (TAMP 2022). To minimize future maintenance and operation issues, new and replacement bridges are designed and constructed to be as durable as economically feasible. TxDOT has gathered and shared its wealth of knowledge and experience via manuals, recommendations, and design requirements that ensure new bridges are designed to the latest standards.
PUBLIC SAFETY
According to the data reported in the 2021 Infrastructure Report Card, the State of Texas averages about 3,500 crashes annually (20112021). After analyzing TxDOT’s Crash Records Information System (CRIS), an upward trend is apparent from 2021-2024, with 14% higher average crashes (about 4,000 crashes annually with 4,400 fatalities). However, no reports of crashes were due to poor bridge conditions.
On March 26, 2024, the Francis Scott Key Bridge in Baltimore collapsed due to the Singaporean cargo ship, the Dali, hitting a column supporting the bridge. The bridge, constructed in the 1970s, predated the introduction of redundant design requirements aimed at protecting critical bridge substructures from ship impacts. Additionally, the scale of vessels today, such as the Dali, was not anticipated during the bridge’s original design. According to the National Transportation Safety Board (NTSB), these outdated design standards played a role in the collapse.
This incident serves as a sobering reminder for Texas civil engineers about the critical importance of continuously updating design standards and implementing redundancy in infrastructure projects. Furthermore, it highlights the need to proactively assess and retrofit aging infrastructures, particularly those near key waterways, to withstand modern demands. While Texas has not faced a catastrophe of this scale, the state’s growing infrastructure demands, increasing size of freight ships entering ports like Houston and Corpus Christi, and extreme weather conditions such as hurricanes make it more essential than ever to design safe and resilient infrastructure.
Texas’ recent investments in port infrastructure, particularly the expansion of the Port of Houston, have been accompanied by evaluations of adjacent bridges to ensure they meet modern standards and can handle the larger vessels passing beneath them. Future projects focus not just on current needs, but also on accounting for Texas’ projected population growth and economic expansion over the next few decades. As Texas continues to grow, maintaining the safety and resilience of its bridge infrastructure must remain a top priority to avoid tragedies like the one in Baltimore. Texas is committed to ensuring that all necessary steps are taken to protect the public and keep its vital infrastructure strong and secure.
RESILIENCE
Resilience is a vital aspect of planning and designing bridges. In addition to the challenges posed by aging bridges, recent natural disasters have brought to light a pressing issue concerning Texas bridges: their lack of resilience. The solution is not merely addressing existing bridges, but making sure new bridges are engineered with resilience as a fundamental criterion and are capable of enduring future catastrophes. While past experiences influence how new bridges are designed, it is important to factor in emerging and potential threats.
A scour critical bridge is classified as such when the bridge abutment or pier foundations is determined to be unstable for assessed or calculated scour. Based on the NBI data analysis, the number of scour critical bridges reached its lowest value of 0.71% (403 bridges) in 2024, down from 1.3% in 2015 (10 years ago) and from 1.43% in 2000 (25 years ago), thus showing improvements with ongoing effort by bridge owners to enhance bridge safety and resilience.
Failing to anticipate future risks could result in costly repairs or even catastrophic collapses, diminishing bridges’ expected lifespan. When rebuilding or replacing damaged bridges, the designs should be enhanced beyond existing standards to incorporate future potential threats.
While this approach may seem costly upfront, every dollar invested in resilience today saves six dollars in future expenditures, according to the Federal Emergency Management Agency (FEMA) Natural Hazard Report.
This does not imply an immediate overhaul of all bridges, but rather an adoption of a resilient framework in future bridge design and construction.
INNOVATION
As part of the State Planning and Research Program (SPR), the Research and Technology Implementation Division (RTI) of TxDOT has budgeted over $30 million in funds (80% federal, 20% state) for continuing projects in FY 2025. These research projects focus on six functional areas to improve the efficiency and speed of bridge construction in a reliable manner. As a result, Texas has the lowest bridge replacement unit cost in the nation (FHWA), which can be attributed to its investment in innovative technology.
According to TxDOT’s article “Innovation a Primary Focus at TxDOT”, at any given time, TxDOT has more than 100 active research projects, studying new technologies and methods aimed at improving safety and efficiency on Texas bridges. Through TxDOT’s continuous research efforts, new technologies are being adopted to inspect, monitor, and enhance the structural integrity of bridges across the state. Modern sensors, drone technology, and advanced materials are increasingly being utilized to ensure the safety of bridge infrastructure, particularly in areas vulnerable to high traffic or environmental stressors.
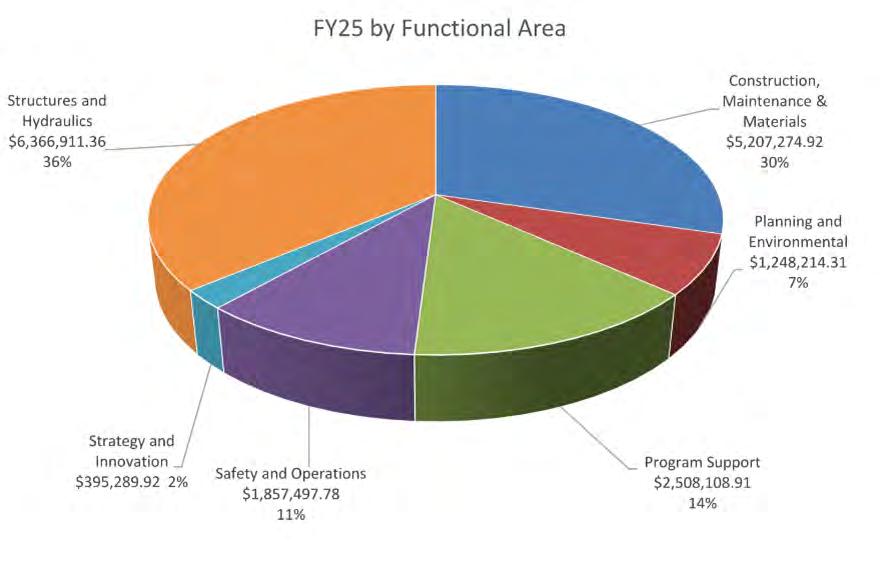
FIGURE 3. Distribution of continuing TxDOT research projects per function area (source: Texas SPR report)
Research in this area in recent years includes the development of partial-depth precast bridge deck panels which eliminate the need for concrete formwork, and precast column solutions in addition to the bent caps, thus, improving construction speed. Research efforts to improve constructability and durability include evaluating the use of 300 ksi (thousand pounds per square inch) (typically 270 ksi) strands for prestressed girders and performance-based concrete overlay mix design.
Another research effort is in using machine learning and image processing for non-destructive evaluation of the bridge's condition. These efforts include using artificial intelligence (AI) to evaluate the condition of the pavement from 2D and 3D images of the surface. Another research project evaluated using digital image correlation (DIC) technology for rapid bridge behavior measurement.
Finally, efforts are underway to develop digital twins (a virtual model that uses real-time data to simulate their behavior and performance) for Texas bridges. With TxDOT bridge modeling transitioning to OpenBridge Designer®, the department intends to utilize 3D models of bridges further. The research aims to combine emerging technologies like 3D mapping, georeferenced non-destructive evaluation, and unmanned aerial systems (UAS) with digital cameras and structure-from-motion photogrammetry technologies to update the 3D models of existing bridges in the inventory.
The research efforts currently underway by TxDOT strive to improve the efficiency of new construction, improve the durability of construction materials, and document the condition of the existing bridges in a fast, reliable manner.
FOOTNOTES
1. Any culvert with a clear opening of more than 20-feet.
* Considering 2023 Replacement Unit Cost of $91/square foot (SF) as published by Federal Highway Administration (FHWA).
PHOTO: SEVENTH STREET BRIDGE FORT WORTH AT NIGHT; TXDOT
BRIDGES
RECOMMENDATIONS TO RAISE THE GRADE
• Increase investment in bridge infrastructure. Allocate an estimated $2 billion annually for bridge expansions and $1.8 billion annually to address the backlog of deficient bridges over the next 10 years to meet future capacity demands and maintain the existing network.
• Incorporate resilience as a fundamental criterion in the design of new bridges to withstand future natural disasters and emerging threats to ensure longterm durability and safety.
• Increase the number of full-time equivalents (FTEs) available for bridge projects to match the growing size and complexity of required projects.
• Invest in research and implementation of advanced technologies such as AI, machine learning, and digital twins for non-destructive evaluation and efficient management of bridge conditions.
• Continue to focus on public safety by analyzing crash data, conducting regular inspections, and implementing new technologies and methods to enhance the safety and efficiency of Texas roads and bridges.
• American Road & Transportation Builders Association (ARTBA) dashboard
• American Society of Civil Engineers (ASCE) Toolkit for Resilient Infrastructure
• Federal Highway Administration, National Bridge Inventory Data
• TAMU TTI report on Establish TxDOT Transportation Resilience Planning Scorecard and Best Practices: Technical Report
• UT-Austin CTR Report on Streamflow Measurement at TxDOT Bridge: Final Report
• TxDOT 2020 Report on Texas Bridges
• TxDOT 2022 Transportation Asset Management Plan
• TxDOT 2023 Bridge and Roadway Design Conference - Intro to Resilience Planning and Design
• TxDOT 2024 Unified Transportation Program
• TxDOT Crash Records Information System
• TxDOT InspectTech Detailed Data Collection
• TxDOT Highway Bridge Program (HBP)
• TxDOT Statewide Long-Range Transportation Plan 2050
• TxDOT Texas Annual Grant Application Fiscal Year 2024
• TxDOT Transportation Program Expenditures - Fiscal Year 2023
• TxDOT Webpage on Proposition 1 funding
• TxDOT Webpage on Proposition 7 funding
• TxDOT FY2024 State Planning & Research Work Program Part II
• USDOT Framework for Improving Resilience of Bridge Design
• USDOT Promoting Resilient Operations for Transformative, Efficient, and Cost-saving Transportation Program (PROTECT)
BROADBAND
EXECUTIVE SUMMARY
Broadband refers to a high-speed internet connection that allows users to access digital content, communicate with others and perform online activities efficiently. Engineers design, install, and maintain broadband networks comprised of various technologies such as fiber optics, cable, DSL (Digital Subscriber Line), satellite, and wireless systems. These networks enable seamless internet access for homes, businesses, and institutions
Broadband technology serves as the backbone of a digitally connected “smart” city. In smart cities, fiber technology enables the collection, analysis, and transmission of data for various purposes, including Supervisory Control and Data Acquisition (SCADA) system integrations, traffic management and autonomous vehicles, public safety, and emergency services. Real-time monitoring and control become possible through this technology.
Texas is actively working to improve broadband access through a combination of federal appropriations and state-level initiatives. The digital divide in Texas persists, due in part to infrastructure limitations, cost of deployment, service affordability challenges and digital literacy gaps. This digital divide affects nearly one-quarter of the state’s population, primarily those in rural and remote areas of the state. Access to broadband is crucial for virtual learning, telehealth, online commerce, and overall economic opportunity. Closing the digital divide remains essential to ensure equitable access for all Texans.
Expanding Texas’ broadband infrastructure can be challenging due to its size, but with strategic investments, cross-functional collaboration, and a proper process for potential subrecipients to apply for funding, the state can bridge the digital divide and ensure that all Texans benefit from fiber-broadband access.
INTRODUCTION
Broadband enables data transmission through a wide range of frequencies using technologies such as fiber optics, cable, DSL, satellite, and wireless systems. Municipalities across the State are connected with fiber broadband to provide high-capacity and low-latency internet access for homes, businesses, and institutions. In smart cities, the same fiber technology supports data collection, analysis, and transmission for purposes such as traffic management, public safety, and emergency services.
Texas is actively working to enhance broadband access through federal and state grant programs. However, due to infrastructure limitations and affordability challenges, the digital divide persists. Broadband network expansion is crucial for resiliency, education, telehealth, and transportation safety services, fostering economic growth. Strategic investments and collaboration with Internet Service Providers (ISPs), municipalities, the Texas Broadband Development Office, engineers, grant writers, non-profits, and respective pole owners are required to deploy broadband throughout the State.
CONDITION AND CAPACITY
Broadband infrastructure demonstrated its essential value during the COVID-19 pandemic, where business continuity, communications, online learning, and commerce were facilitated. As daily activities shifted online, the critical need for reliable internet access was underscored. However, as shown in the following January 2022 graphic1, many Texas rural areas are still not served with high-speed internet access. The State’s 93.55% availability is less than the national average23 of 95.6% respectively.
In March 2024, the FCC—the U.S. government agency that regulates interstate and international communications via radio, television, wire, satellite, and cable—increased the benchmark for broadband speeds to 100 Mbps download and 20 Mbps upload.4 This update reflects the significant advancements in consumer broadband usage and the growing demand for higher speeds. The new standard replaces the previous measure of 25/3 Mbps set in 2015 and aligns with federal programs such as the Broadband Equity, Access, and Deployment (BEAD) initiative. This change aims to address the digital divide, especially in rural and low-income areas, and supports the long-term goal of achieving higher speeds needed for the future.
The BEAD program is a federal initiative established under the Infrastructure Investment and Jobs Act (IIJA) to provide funding that will expand high-speed internet access across the United States. The program is managed by the National Telecommunications and Information Administration (NTIA) and aims to ensure that all Americans, especially those in underserved and unserved areas, have access to reliable, high-speed broadband. The BEAD program encourages collaboration between federal and state governments, ensuring that funding is efficiently allocated, and projects are tailored to meet the specific needs of different regions. The BEAD program will continue to use the original definition of unserved (25/3 Mbps) and underserved (100/20 Mbps), as those definitions are codified in the IIJA.
FIGURE 1. Texas Service Availability Map, 2022
Internet can be provided by satellite, digital subscriber line (DSL; telephone line), dedicated cable, microwave, or fiber optic. Common infrastructure includes tower-supported antennas/repeaters (wireless), fiber optic, telephone, or copper wire (wired) principally in underground circuiting. Presently, the FCC does not consider wireless connections (e.g., smartphones and tablets or unlicensed fixed wireless) in its assessment of broadband access.5 However, lower-income residents, younger households6 and those occupied by racial minority groups are more likely to use wireless data connections on mobile devices as their primary connectivity method.
As shown in the graphic above, the Pew Research Center found in 2021 that only 57% of Americans earning annual income below $30K had wireline broadband at home, and only 59% a home computer, while 76% of them had smartphones — a 27% gap.7 Only 11% of
Americans between $30K and $100K rely on smartphones for internet connectivity and 6% of those earning six-figures. Modern mobile devices feature a “hotspot” mode, allowing computers to piggy-back on smartphone data, but these are unreliable, expensive and powerintensive connections.
The Broadband Development Office (BDO) is actively working to improve broadband conditions across the State. Established by the Texas Legislature in 2021, the BDO provides grants, low-interest loans and other financial incentives to expand broadband access and adoption in underserved areas. Key initiatives include the Texas Broadband Pole Replacement Program, which aims to accelerate rural broadband deployment by reimbursing a portion of eligible pole replacement costs, and the Broadband Infrastructure Fund (BIF), which supports a variety of broadband expansion projects with an initial investment of $1.5 billion in state funding.
Given the importance of engaging the public, the BDO established 10 Statewide Working Groups (SWGs) to address and improve broadband conditions throughout Texas. These groups, which include regional and local entities, collaborate with the BDO to identify broadband needs, gather data and provide feedback. SWGs coordinate events and engage in public meetings and roundtables to ensure comprehensive planning and implementation of broadband initiatives. This collaborative approach supports the development of the Texas Digital Opportunity Plan (TDOP). The BDO invited all tribal leaders to participate in the SWGs. In Texas, there are three federally recognized tribes: the Alabama-Coushatta Tribe of Texas in Livingston, the Kickapoo Traditional Tribe of Texas in Eagle Pass, and the Ysleta del Sur Pueblo in El Paso. The Kickapoo Traditional Tribe of Texas and the Alabama-Coushatta Tribe of Texas were represented in SWGs.8
In 2021, the Technical Assistance Program (TAP) in Texas was established by the BDO. The TAP provides resources to counties addressing the condition and capacity of broadband infrastructure. It offers services such as stakeholder identification, gap analysis, workforce development strategies, and network design assessments to enhance broadband planning and connectivity to close the digital divide in Texas communities.9
The Texas Digital Opportunity Plan (TDOP) is funded by the Digital Equity Act of 2021 as part of the IIJA. The TDOP serves as a roadmap for expanding the use of reliable and affordable broadband, device deployment programs, digital skills training, and cybersecurity awareness for all Texans. TDOP will inform a grantmaking strategy for implementation of funds received through the Digital Equity Act Capacity Grant. The final TDOP draft was submitted to the National Telecommunications and Information Administration (NTIA) on February 28, 2024, and accepted on March 28, 2024.10 The following graphic outlines Texas’s goals based on the NTIA’s measurable objectives.
FUNDING
Texas11 is actively working to improve broadband access through a combination of federal appropriations and state-level initiatives. The IIJA allocates significant funds to provide affordable high-speed internet across the country. From this bill, Texas is receiving $3.3 billion in grant funding through the BEAD program12, authorized by the IIJA.
Using a data-driven method, subscriber rate controls for broadband connectivity can be determined. The Extremely High Cost Per Location Threshold (EHCPLT) is the BEAD subsidy per location upper echelon that determines when the BDO may select a less expensive technology over fiber13. The EHCPLT is a key activator for universal access and may best be developed at the state or regional level. Universal broadband access may be achieved through efficient use of subsidy and technology selection. Setting the EHCPLT too low could lead to fewer projects being completed, while setting the EHCPLT too high would exhaust funds quickly. A medium threshold is preferred, and could fund fiber, licensed fixed wireless, and other technologies.14
In 2023, the U.S. Department of the Treasury awarded the Texas Comptroller’s office $363 million in federal funding to initiate the Bringing Online Opportunities to Texas (BOOT) Program. Administered by the BDO, BOOT aims to increase access to affordable, reliable high-speed internet through a competitive grant application process15. In November 2023, Texans voted to approve Proposition 9 (Prop 9), creating the $1.5 billion Broadband Infrastructure Fund (BIF). Prop 9 provides one-time transfers of $155.2 million to the Next Generation 9-1-1 Fund, to be managed by the Commission on State Emergency Communications, and $75 million to the Texas Pole Replacement Program. Additionally, the federal government allocated $500.5 million to Texas for Broadband Expansion under the American Rescue Plan Act (ARPA ).
FIGURE 2. TDOP strategies to address barriers to digital opportunity in Texas
OPERATION AND MAINTENANCE
Broadband infrastructure deployment and upkeep requires strategic planning and engineering, skilled technical labor, regular maintenance, and robust security measures to keep it operational. In addition to cyber/physical threats, other challenges include broadband frequency impacts (e.g., 5G threats to aviation/airport communications), aging and safety management of broadband appurtenances (poles, towers, structures, and other infrastructure), and determining a subscriber rate control.
Improving broadband conditions across the State emphasizes the need for public data exchange. Many other infrastructure sectors are depending on telecommunication capabilities, like autonomous vehicles reading road signs, smart grid operations reducing outages, water pipes embedded with leak detection sensors, and many other innovations.
The digital divide is a nationwide matter that is addressed through statewide approaches from federal funding. To maximize funds, Texas should evaluate operational efficiencies in permitting practices that cause long-lead permit delays in the deployment of broadband services.
FUTURE NEED
The digital divide in Texas persists, due in part to infrastructure limitations, cost of deployment, service affordability challenges, and digital literacy gaps. The digital divide affects nearly one-quarter of the state’s population. Access to broadband is crucial for virtual learning, telehealth, online commerce, and overall economic opportunity. Closing the digital divide remains essential to ensure equitable access throughout the State of Texas.
While broadband is a billion-dollar industry in Texas, there are disagreements over state broadband coverage maps. Public data on the condition, capacity, operations and maintenance of broadband infrastructure are limited. To ensure the latest broadband service data are used, in spring 2024, the Texas BDO adopted the FCC’s National Broadband Map data. Decision-makers should advocate for more comprehensive reporting requirements from telecommunications companies that receive public funding. To reach low-access areas, Texas should explore innovative deployment methods, such as microtrenching for fiber broadband. Expanding Texas’s broadband infrastructure can be challenging due to the size of the state and its low population densities in rural and remote sections of the State. However, with strategic investments, cross-functional collaboration, and a proper process for potential subrecipients to apply for funding, the state can bridge the digital divide to ensure that all Texans benefit from fiber-broadband access.
It is prudent for Texas to consider infrastructure that will address barriers for future expansion efforts (e.g., full 5G deployment, “internet of things” integration for a smart city). Such considerations need to be addressed during planning to avoid obsolescence. Texas must focus on resilience, as telecommunications are exposed to both cybersecurity and physical threats, such as weather damage to infrastructure. Both new infrastructure construction and resilience are part of engineering solutions. Expanding and maintaining broadband infrastructure typically involves right-of-way issues, “dig once” policies, and the co-location of electric infrastructure with a telecommunications backbone. More public data is necessary as greater investments fund hardware (receptors, transmitters, receivers, antennae) and require proper coordination with other infrastructure implements (towers, poles, buildings, and underground conduits).
Texas Department of Transportation (TxDOT) has implemented "dig once" policies, which aim to reduce the costs and disruption associated with deploying broadband infrastructure. These policies involve coordinating the installation of broadband infrastructure with other public works projects, such as road construction, to ensure that the necessary conduits and fiber optic cables are laid down simultaneously. This approach minimizes the need for repetitive excavation and reduces overall project costs.
As part of these efforts, TxDOT collaborates with various stakeholders to integrate broadband infrastructure planning into transportation projects. This coordination supports the expansion of high-speed internet access across the State and enhances the efficiency and costeffectiveness of infrastructure development.
Through apprenticeship programs, Texans can engage partnerships between telecommunications companies and educational systems to attract, train, and deliver the next generation of talent. Training locally creates local opportunities. As broadband network expansion continues, the demand for skilled cybersecurity experts, technology coordinators, and fiber splice technicians grows, creating a special skilled workforce. Proactive investment in workforce development is critical to avoid bottlenecks in network deployment and to maintain high-quality network performance. It’s encouraged to publicize successes as they occur within communities.
PUBLIC SAFETY
Broadband supports public safety through the engineering of fiber broadband networks, which enable high-speed internet necessary for smart transportation systems. These systems improve traffic management and reduce the risk of accidents, thus enhancing overall public safety. Enhanced 911 (e911) services rely on broadband to accurately locate emergency callers for swift responses. In addition, broadband powers video surveillance in public spaces, transportation hubs, and critical infrastructure, enhancing security and incident prevention. Broadband technology also supports remote health services, bridging gaps in access to medical care, especially in rural areas. Overall, broadband is essential for maintaining public safety, enabling efficient emergency response, and ensuring community resilience.
RESILIENCE AND INNOVATION
Broadband technology serves local businesses and residents by providing high-speed internet access. It forms the backbone of a digitally connected smart city. In smart cities, fiber-broadband technology enables the collection, analysis, and transmission of data for various purposes, including SCADA system integrations, traffic management, public safety, and emergency services. Real-time monitoring and control become possible through this technology. During the COVID-19 pandemic, broadband infrastructure demonstrated critical value. It facilitated business continuity, communications, online learning, and commerce. Fiber-broadband stands as a critical component of our modern infrastructure and its importance extends to public safety, health, economic opportunity, and community development.
The Texas Telephone Association (TTA) collaborates with organizations to advance telecommunications and broadband infrastructure in Texas. The TTA provides oversight authority on traditional wireline (landline) phone service, although such often crosses over into wireless and internet protocol (IP) services. The Texas BDO orchestrated a stakeholder engagement process known as the Public Engagement Plan (PEP). This comprehensive plan involved the creation of processes and strategies to facilitate participation from various groups, including residents, rural and urban communities, industry representatives, and other stakeholders. The PEP serves as a road map, guiding efforts to foster a collaborative and integrated community engagement process.
The vast geographic size of Texas highlights its unique climate vulnerabilities. The State faces threats from hurricanes, tornadoes, flooding from heavy rainfall, coastal storm surges, high winds, and severe cold snaps. These diverse challenges necessitate resilient network design and comprehensive mitigation strategies to safeguard broadband infrastructure funded by state and federal programs.16
To address program concerns, the BDO engaged in extensive consultations with the broadband industry in preparation for the BEAD Program launch, ensuring stakeholder insights shaped the approach. The following graphics illustrate key application considerations.
FIGURE 3 Texas Broadband BEAD Proposal Volume II to NTIA
As technology evolves, broadband’s adaptability and scalability enable users to meet growing data demands, thus making broadband technology a foundational component for future innovations and developments. The technology provides reliable high-speed internet access that is essential for communication, remote work, and digital learning. The infrastructure can withstand various environmental and man-made disruptions, ensuring continuous connectivity. Broadband additionally supports critical services such as telehealth, emergency response, and smart infrastructure, enhancing overall societal resilience.
ESTABLISH THE GRADE FOR TEXAS
Texas has made significant strides in expanding broadband access over the last few years, improving infrastructure and availability in many areas. However, the State's broadband remains somewhat fluid, with inconsistent coverage and speeds across urban and rural regions. While progress is evident, the current state of broadband in Texas can be graded as a D+ reflecting the need for further improvements in accessibility and reliability statewide. Continued efforts are necessary to bridge the digital divide.
Texas could enhance the lives of its residents and communities by enabling fast, reliable, and affordable broadband connectivity for all. Texas can foster greater equity and access by amplifying adaptation, participation, and benefits from the digital world, especially in historically underserved regions.17
Municipalities in Texas are encouraged to create, implement and/or revise broadband strategic plans for the community. Setting a grade for Texas’s broadband infrastructure and improving its performance requires careful planning of wireline broadband deployment and much greater public data disclosure from productive partnerships between all levels of public/government and the private sector.
A successful model would include co-location and co-building of broadband alongside new infrastructure with private and public asset ownership. This includes managing below- and above-ground infrastructure, codification of “dig once” policies for infrastructure in right-of-way areas, and improvement in planning, permitting, and taxing policies and processes. Local regulations should consider and pursue broadband infrastructure options that maximize the value of public investment. In addition, public private partnerships (P3s) could strengthen local stakeholder presence alongside local workforce development efforts. These actions will help provide the critical foundation needed to close digital literacy gaps, ensure equitable access for all communities, and step into a stronger, broadband-driven future.
FIGURE 4 Permitting Concerns, Texas Broadband BEAD Proposal Volume II
ACCESS and AVAILABILITY: Access refers to the ability of a residence or business to reach a Broadband source, whereas Availability refers to physical presence in a specific geographic region.
BROADBAND: Wired or wireless data streaming technology operating at speeds of at least 25 megabits per second downstream, 3 megabits per second upstream allowing high-speed internet access.
4G (MOBILE WIRELESS): 4G data streaming at approximate speeds between 12 and 36 megabytes per second. This equates to a roughly six-minute download time for a feature-length movie.
5G (MOBILE WIRELESS): 5G data streaming as supporting up to 300 Mbps or greater. A feature-length movie can be downloaded in as little as 15 seconds. Designed for urban areas.
FIBER OPTIC BROADBAND: Wired technology that converts data-carrying electric signals to light, which can then be transmitted through glass fibers approximately the diameter of human hair. According to the FCC, fiber transmits data at speeds far exceeding current DSL or cable modem speeds, typically by tens or even hundreds of Mbps.
• Setting the Extremely High Cost Per Location Threshold for BEAD | Benton Institute for Broadband & Society
DAMS
EXECUTIVE SUMMARY
Dams in Texas serve many purposes including recreation, flood risk mitigation, irrigation, water supply, and fire protection, among other functions. About 1 in 3 of the State’s dams are for flood risk mitigation and one in seven dams are for irrigation or water supply. Dams have great value and great consequences. The consequences of a dam failure far exceed the loss of water supply for our favorite fishing hole. When a dam fails, the area downstream faces loss of life or property, or both. Among the approximately 7,378 non-federal dams in our State, around 25% could result in loss of life should they fail. Furthermore, underfunded and understaffed regulatory agencies impact dam safety and increase risk. More than 3,200 Texas dams are exempt from dam safety requirements by State legislation. In 2023, the Association of State Dam Safety Officials (ASDSO) estimated the cost to rehabilitate all non-federal dams in Texas at around $13.6 billion. The Texas State Soil and Water Conservation Board (TSSWCB) estimates about $2.1 billion is needed to repair or rehabilitate dams included in the Small Watershed Programs.
TABLE 1. Dams Subject to State Dam Safety Regulations (TCEQ, 2024)
CONDITION AND CAPACITY
Dams are classified as high hazard potential (HHP, probable loss of life if dam fails), significant hazard potential (SHP, possible loss of life) or low hazard potential (LHP, no loss of life expected). There are currently 7,390 (7378 state + 112 federal) dams in Texas with the oldest over 170 years old, according to the National Inventory of Dams (NID). One hundred-twelve federal dams are included in that total with about 53% of those classified as significant or high hazard potential. 97% of the dams in Texas were built prior to 1996 and over 73% of HHP dams were constructed before 1975.
In 2013, House Bill 677 Legislation amended the Texas Water Code to exempt an owner of a dam located on private property from meeting the requirements related to dam safety if the dam meets all the following criteria:
1) impounds less than 500 acre-feet (top of dam capacity) at maximum capacity;
2) has a hazard classification of low or significant;
3) is located in a county with a population of less than 350,000;
4) is not located within the corporate limits of a municipality; and
5) is privately owned.
According to the Texas Commission on Environmental Quality (TCEQ), 3,254 dams are exempt from dam safety requirements by this legislation. That leaves 4,124 dams in Texas that must comply with dam safety regulations. According to the 2023 Texas State Soil and Water Conservation Board Progress Report, the existing count of high hazard dams in need of repair is 536 to meet the current safety criteria. There is a total of 659 HHP dams in Texas.
OPERATION AND MAINTENANCE
TX Dams in the NID Total NID Dams
State Regulated Dams
State Regulated High-Hazard Potential Dams 1,537
TABLE 2. Texas Dams in the NID (TCEQ,2023)
With aging dams and rapid urbanization in many parts of Texas, the need for dam maintenance, repair, and rehabilitation continues to grow each year. According to TCEQ, a high percentage of the HHP dams do not have a maintenance and inspection program in place. The dam safety program administered by TCEQ monitors and regulates private and public dams in Texas. The program periodically inspects dams that pose a high or significant hazard, meaning there is a potential loss of life if the dam fails; and makes recommendations and reports to dam owners to help them maintain safe facilities. The financial responsibility for maintenance and repair falls on the owner of the dam. Many owners, both private and public, do not have the financial capacity to properly maintain and upgrade the aging structures.
FIGURE 1. Dams in Texas
The largest impediment to implementing adequate maintenance and inspection program as well as EAPs is funding. Many of the private and municipal owned dams have a lack of available funds. The State inspection program makes maintenance and repair recommendations for all dams that are inspected; however, of all the non-exempt and high hazard state-regulated dams, 78% have been inspected in the last 5 years.
Many dam owners and operators do not receive appropriate training in their responsibilities for dam safety. However, since 2016, the Texas Dam Safety Program has made efforts and conducted 12 workshops for owners with 1,222 people registered. In the last 5 years (2021 –2024), twelve workshops were conducted with 810 total registrants.
PUBLIC SAFETY
Data from the Association of State Dam Safety Officials (ASDSO) lists a total of 286 incidents related to dams in Texas since 1900. Twenty-eight of those incidents were classified as failures. However, it should be noted that 89 incidents, including three failures, occurred prior to 2000. Since 2000, there have been 197 reported incidents, more than double what occurred between 1900 and 2000. Of those incidents, the number of failures has increased to 25. It should be noted that the ASDSO began compiling data in 2010 and prior data was supplied by the State. Therefore, the information may not be comprehensive. Additionally, there may have been failures and incidents that were not reported. The increase in dam incidents and failures can be traced to a combination of factors including age, an increase in severe weather events and the need for rehabilitation. For example, all 20 incidents in 2017, including 4 dam failures, were attributed to Hurricane Harvey.
Emergency Action Plans (EAP’s) and inundation maps have been required for many years. EAPs improve dam safety by identifying potential emergency conditions at dams and outlining a preplanned set of actions to help prevent loss of life and minimize property and environmental damage. In 2022, there were 7,390 total dams in Texas, 1,559 (21%) of which were HHP dams. Of the 1,559 total HHP dams, 80% had EAPs. Many private and municipal-owned dams have no EAP due to lack of available funds. To compound the EAP safety concern, formerly classified LHP dams are now being transformed into HHP dams because there are no statewide restrictions on downstream development of a dam.
As the Texas population continues to grow, areas developed downstream of existing LHP dams will possibly change to HHP dams. Many of these dams were originally constructed as farm ponds and were not designed to meet current dam safety requirements.
Some local governments have taken their own steps to address this issue. In the April 1, 2019 Texas Observer article, Dammed to Fail, the City of McKinney is cited as one example:
In 1999, the city passed a stormwater management ordinance that restricts development downstream of dams in the breach zone. It also requires upstream developers planning to pave over prairies and increase impervious cover to contribute to the cost of dam rehabilitation. Michael Hebert, the assistant director of engineering for the city, estimated that builders are typically pitching in between $500 and $1,000 per acre.
FIGURE 2. 2022 Emergency Action Plan (EAP) for State Regulated High-Hazard Potential Dams
FUNDING AND FUTURE NEED
In 2023, ASDSO estimated that nation’s dam rehabilitation costs are $157.48 billion dollars for all non- federal dams. The cost to rehabilitate all non-federal dams in Texas is estimated to be about $13.6 billion. The Texas State Soil and Water Conservation Board (TSSWCB) states that 188 of the flood control dams that have exceeded their life expectancy need repair at a cost of $139 million. Currently 25 of the 188 flood control dams are under contract for repair at a construction cost of about $15 million and 29 dams are in the design stage for repairs to be completed in the next two years. It is estimated that rehabilitation of 516 HHP flood control dams will cost an estimated $2 billion. Of these 516 HHP flood control dams, state funds will be used to upgrade 20 dams while eight dams will be upgraded using federal funds.The Texas Soil and Water Conservation Board states that 188 of the dams that have exceeded their life expectancy need repair at a cost of $139 million. Currently 25 of the 188 dams are under contract for repair at a construction cost of about $15 million and 29 dams are in the design stage for repairs to be completed in the next two years. It is estimated that rehabilitation of 516 HHP dams will cost an estimated $2 billion. Of these 516 HHP dams, state funds will be used to upgrade 20 dams while 8 dams will be upgraded using federal funds.
The 2024 Texas dam safety budget, administered by 36 full time employees, is about $3.3 million, with $1.8 million in the State budget and about $300,553 FEMA grant plus $1,264,239 from Bipartisan Infrastructure Law (BIL). BIL funds are going to be used for EAP development, updated LIDAR data, and contract staff to help with grant contracts. Texas lags significantly in regard to the dam safety budget per HHP dam when compared to the national average. There have been two significant legislative events in 2019 that would improve the safety of flood control dams in Texas. First, a $150 million appropriations bill was passed and signed into law on June 6, 2019, and then Senate Bill No. 8 (SB8) became an act on June 10, 2019.
SB8 created the framework for the first state flood plain in Texas. SB8 Sec 201.0227 specifically requires the state board prepare and adopt a plan describing the repair and maintenance needs of flood control dams that are 1) not licensed by the Federal Energy Regulatory Commission, 2) do not have flood storage, 3) are required to pass floodwaters, and 4) have failed. Additionally, the TSSWCB is required to prepare and adopt a new plan before the end of the 10th year following adoption of a plan. Implementing SB8 will require about $7 million in funding in 2020 and greater than $35 million per year beginning in 2021. A portion of the funding will be spent on meeting SB8 Sec 201.027 requirements. The State also appropriated $150 million in funds during the 86th Legislative Session to TSSWCB to administer through grants to local Flood Control Dam sponsors, including soil and water conservation districts. The funding will be spent on dams needing rehabilitation based on a priority list developed by TSSWCB.
Dams with a revenue stream usually have adequate funds for rehabilitation. Recent impacts of Hurricane Harvey and the devastating 2015 and 2016 floods resulted in an increased focus by the Texas legislature on flood control infrastructure, including dams. The resulting SB8 and appropriations will help improve assessment and rehabilitation efforts. In addition to the impact of Hurricane Harvey on dams in the Houston area in 2017, the failure of the Lake Dunlap Dam spillway gate, likely due to the age of the structure as stated by the Guadalupe Blanco River Authority, further illustrates the need for adequate inspection, maintenance, and upgrades to our dams. A collaborative effort will be needed to assess and support the rehabilitation needs of dams that are maintained by private owners and operators and are exempt from dam safety requirements. Efforts may include technical expertise, financial assistance and community engagement or awareness.
FIGURE 3. State Budgeting for Dam Safety: (a) State Budget per Regulated Dam (b) State Budget per High-Hazard Potential Dam (blue) and National Average (red)
INNOVATION AND RESILIENCE
There is an opportunity to apply innovative and resilient design and construction methods, and operational and maintenance best practices to Texas dams. Innovation within the dam's infrastructure category is limited but the availability of online documents for the Dam Safety Program and access to workshops is important. Texas dam rehabilitation plans do not currently take climate change into consideration, a necessary factor to ensure resiliency as more extreme precipitation events are anticipated in the future.
• Revise the current legislative exemptions for dams to reduce the number of dams exempt from dam safety regulations.
• Increase funding for the Dam Safety Program to perform inspections and identify hazardous conditions as quickly as possible.
• Develop a mechanism to enforce the requirement for maintenance, rehabilitation, and inspection programs for all high hazard dams in the State.
• Develop emergency action plans for the remaining 20% of significant and high hazard potential dams, including those dams subject to reclassification as high hazard potential due to population growth in rural areas.
• Create a state loan or grant funding program for dam rehabilitation, repair, abandonment, or removal.
• The State of Texas, local political offices, and zoning boards should pursue regulating the development in breach inundation zones by establishing or acquiring easements in these areas.
Sources
• U.S. Army Corps of Engineers; National Inventory of Dams.
• TSSWCB Flood Control Program and USDA_NRCS Watershed Program Maintenance, Repair and Rehabilitation.
• PROGRESS REPORT FOR FISCAL YEAR 2023 TSSWCB FLOOD CONTROL PROGRAM TEN-YEAR DAM REPAIR, REHABILITATION, AND MAINTENANCE PLAN August 1, 2023
• Association of State Dam Safety Officials; www.damsafety.org.
• Texas Commission on Environmental Quality; Dam Safety Program.
• Texas Observer; Sadasivam, Naveena; 2019 April 1; Dammed to Fail.
• Texas Commission on Environmental Quality; 2020 May; Interviews and data from the Dam Safety Program; www.tceq.texas.gov.
• Texas Legislature; 2013 September; House Bill 677.
• San Antonio Express-News; O’Hare, Peggy; 2019 May 17; Aging steel suspected in dam failure at Lake Dunlap
DRINKING WATER
EXECUTIVE SUMMARY
Funding safe and adequate drinking water supplies is critically important to continue fostering growth and prosperity as Texas moves through the 21st century. Meeting the water demands of Texas is imperative to the State’s future economy. Texas’ population is projected to grow from 32.9 million in 2030 to approximately 53.2 million by 2080.
The recognition of the importance of planning for adequate water supplies is demonstrated by Texas’ legislation that requires the Texas Water Development Board to develop a State Water Plan (SWP). Updated every five years and incorporating sixteen regional water plans, the state water plan serves as a guide to the state water policy.
Also important is the number of boil-water advisories that have doubled from 2020 to 2023. This clearly shows aging infrastructure and the need for additional funding for water infrastructure operation and maintenance.
The number of Public Water Systems that have limited water use to avoid shortages has increased from 46 in 2019 to 571 systems in 2023 representing a population of approximately 6.4 million people.
CONDITION AND CAPACITY
As of July 1, 2023, the State of Texas regulates 7,122 public water systems (PWS), covering 4,500 service areas as shown in Figure 1, and providing drinking water to more than 30.6 million customers.1
The majority of PWS are “Community” systems corresponding to the town and communities where people live. These Community systems represent approximately 97% of the population served, as shown in Table 1.
One metric that can be used to assess the condition of Texas PWS is the number of boil water advisories issued. As shown in Table 2, the number of boil water advisories issued in the state in 2023 is more than double the number issued in 2020. The increasing number of advisories reflects aging infrastructure. When system pressure drops below 20 pounds per square inch, a boil water notice must be issued. This pressure drop can be due to equipment failures or pipeline breaks. The highest occurrence of boil water advisories for this 4-year period occurred in 2021, due to the high number of them issued during winter storms Uri and Viola (February 2021).
Another indicator of the condition of a water distribution system is the frequency of water main breaks. While the specific number of water main breaks in drinking water systems is not available for the State, the overall water loss for the State is available. The data collected by the Texas Water Development Board (TWDB) includes apparent and real losses. The apparent losses include assumptions for metering inaccuracies, unauthorized consumption and data inaccuracies. After removing these apparent losses, the result is the ‘real loss’ representing water actually leaving the pipes via leaks or breaks. These real losses are shown by year in Table 3 below. The Median Real Water Loss for gallons per connection per day increased from 31.83 in 2021 to 34.30 in 2022.
*Other includes BWN events such as a planned interruption in service i.e., maintenance and repairs or other nontypical reason for issuance
Note: The TCEQ provided the number of boil-water notices by reason and year shown in Table 2. The boil water notice information is self-reporting and the specific reason for the notice is not consistently reported.
TABLE 1. Public Water System Population by Type3
FIGURE 1 Public Water System Service Area Location and Distribution2
TABLE 2. Boil Water Notice by Reason and Year
3. Water Loss Statistics by Year (in gallons)4
From 2019 through 2022 there were 358 public water systems that service a population of 3,300 or more with an Infrastructure Leakage Index (ILI) calculated for each system. The ILI is defined as the ratio of current real losses to unavoidable real losses. Table 4 below shows the average ILI for Medium, Large, and Very Large systems in Texas. This data illustrates that the statewide ILI from 2018 to 2022 is increasing slightly, reflecting no real improvement in the water loss in the PWS infrastructure. A higher ILI indicates more leakage in the system.
Another factor in defining the condition of Public Water Systems is the ability to meet federal mandates. The Lead and Copper Rule (LCR) is the National Primary Drinking Water Regulation first promulgated in 1991 that requires actions by public water systems to reduce levels of lead and copper in drinking water. On January 15, 2021, the EPA promulgated the Lead and Copper Rule Revisions (LCRR), and the deadline for water systems to comply with these revised requirements was October 16, 2024. On December 6, 2023, EPA published the proposed Lead and Copper Rule Improvements (LCRI) which, when finalized, will significantly reduce exposure to lead through drinking water6. The Lead and Copper Rule Revisions (LCRR) requires public water systems to perform a Lead Service Line Inventory. This is an inventory of every service line, including both the utility owned and customer owned service lines in the distribution system. The inventory requires the categorization of each line by October 16, 2024. A lead ban law in Texas went into effect on July 1, 1988. Based on the US Census Bureau, the number of housing units in Texas was 11,589,3247 as of August 5, 2020. The Federal Reserve Bank of Saint Louis identified 4,131,905 new housing units authorized between July 1988 to December 2019 in Texas8. This equates to 35.7% of housing units in Texas being constructed after the Texas Lead Ban, which is likely having lead service lines that will need to be replaced.
TABLE 5. Public Water Systems Reporting Limiting Water Use to Avoid Shortages9
TABLE
TABLE 4 Average Infrastructure Leakage Index by System Size (2018-2022)5
The 2022 State Water Plan identified needs (potential shortages) for municipal water usage as 214,623 acre-feet per year for 2020 and 802,045 acre-feet per year for 2030, based on currently connected supplies. According to the statistics in the 2022 State Water Plan, the 2030 municipal water demand is estimated to be approximately 16% higher than the projected 2030 water supply.
The Texas Commission on Environmental Quality (TCEQ) requires public water systems to report when its system is limiting water use to avoid shortages. The number of Public Water Systems that have limited water use to avoid shortages as shown in Table 5 has increased since 2019 to 571 systems in 2023 representing a population of approximately 6.4 million people.
Table 6 outlines the number of PWSs Limiting Water Use to Avoid Shortages by system size. The data reflects a significant increase year over year.
The 2022 State Water Plan for Texas sums up the outlook for municipal water through 2070. “If no recommended municipal water management strategies are implemented by the onset of another drought of record:
• Approximately 78 percent (40.4 million) of all Texans in 2070 would face at least a 10 percent water shortage in their cities and residences;
• Approximately 26 percent (13.3 million) of all Texans in 2070 would have less than half of the municipal water supplies they require; and
• The estimated population who might have less than 10 percent of the water supplies they require increases from 166,000 in 2020 to nearly 550,000 in 2070.
OPERATIONS AND MAINTENANCE
High and increasing water losses within a drinking water utility’s system can be an indicator of leaking pipes that need replacement. As mentioned above, a way to estimate water losses and estimate adequacy of water system maintenance funding is the ILI. A lower index suggests losses are controlled and most water losses are unavoidable due to normal operational factors. A higher index suggests the system is losing water due to factors that can be addressed or avoided through best management practices, maintenance and modernization. The graphic below shows that medium (50,000-99,000 population) and large (>100,000 population) systems have the highest water loss based on their ILI scores.
In 2022, the ILI for water systems ranged between 2.7 and 3.08. Statewide ILI has increased slightly between 2018 and 2022 from 2.69 to 2.85. Continued infrastructure renewal and operational oversight of leakage management controls are necessary to reduce the ILI. The TWDB offers a program called the Asset Management Plans for Small Systems (AMPSS) to assist small water and wastewater systems by creating a comprehensive plan for managing the systems in a financially and technically sustainable manner. The TWDB is reserving a total of $2M to continue to contract for services to assist small systems develop asset management tools. The AMPSS initiative scope of work in SFY 2023 will require a section on emergency preparedness, weatherization and resiliency10. In addition, beginning with the state fiscal year 2021 Intended Use Plan (IUP), an entity that has adopted an Asset Management and Financial Planning tool within the past 5 years will receive additional points towards loan consideration if the tool contains AMPSS initiative product deliverables11. These efforts by the TWDB emphasize the importance of using asset management for planning maintenance.
TABLE 6. Population Affected by Public Water Systems limiting Water Use to Avoid Shortage by System Size
RESILIENCE
Resilience according to the National Research Council’s Disaster Resilience: A National Imperative12 defines resilience as “the ability to plan for, absorb, recover from or more successfully adapt to actual or potential adverse effects.”
A mandate that is intended to enhance the PWS resilience was the requirement in the America’s Water Infrastructure Act (AWIA) signed into law on October 23, 2018, which requires drinking water systems to develop or update risk and resilience assessments and emergency response plans.
In February 2021, Texas’ Drinking Water systems were put to the test as two Winter Storms (Uri and Viola) struck back-to-back. These winter storms exposed weaknesses in the public water supplier's ability to provide drinking water13. Numerous water system interruptions were caused by widespread and extended power outages. According to TCEQ, nearly 40% of Texas Water Utilities had to issue boil water notices during the storm.
Since 2021, there have been State and Federal initiatives that require Water Utilities to strengthen the operation and maintenance of their water systems. Texas Senate Bill 3 was crafted after Winter storms Uri and Viola impacted Texas. The Texas Legislature passed Senate Bill 3, which requires Water Utilities to prepare for, prevent and respond to extreme weather emergencies and extended power outages. All drinking water and raw water utilities were required to submit an emergency preparedness plan to TCEQ with options to demonstrate that the utility can maintain 20 psi water pressure during a power outage lasting 24 hours or more by March 1, 2022. While utilities have been hard at work on this matter, there is still a lot more that needs to be done. Of the 3,865 utilities that TCEQ has determined to be “affected utilities,” 3,516 systems have submitted an Emergency Preparedness Plan (EPP).
In a post disaster report14, approximately one year after the winter storms, interviews were conducted with 20 water utilities, that consisted of 16 very large utilities, two large utilities and two regional water providers. The findings one year after the 2021 winter storms was that these surveyed utilities “have made substantial progress in improving resilience since Winter Storm Uri, especially in the governance and infrastructure arenas.” Governance improvements include the passage of Senate Bill 3 exploring policy changes concerning conservation mandates and allocating funding for improvements, commissioning after action reports and increasing staffing during events. Utilities have focused on infrastructure improvements such as backup power, weatherization of equipment and facilities, investment in cold tolerant instrumentation, fuel storage, anti-gelling fuel additives, chemical inventories, vehicle improvements, and revising winter maintenance schedules.
The overwhelming majority of systems surveyed identified economic factors such rate increases, funding for infrastructure upgrades, and costs associated with installation of new generators as an ongoing challenge.
Significant weather events continue to pose challenges to PWS’s. When Hurricane Beryl hit southeast Texas (Houston and surrounding areas) in July 2024, the TCEQ estimated that about 400 boil water notices were reported in the counties impacted by the storm.
FIGURE 2. Average Infrastructure Leakage Index (2018-2022)
FUNDING AND FUTURE NEED
There are several funding sources to support drinking water infrastructure needs in the state. Texas depends upon the Drinking Water State Revolving Fund (DWSRF), established by the federal Safe Drinking Water Act. The DWSRF is intended to protect public health by offering low-cost financing for designing, building, and improving public drinking water facilities. The need for funding has exceeded the DWSRF funding.
Federal state revolving fund (SRF) allocations are decreasing as needs are increasing. Since 2021, Texas has experienced a net loss of more than $94.2 million in federal funding for water infrastructure (SRFs plus earmarks). The decrease in Texas Drinking Water Infrastructure can be seen in Figure 3.
The Texas Water Conservation Association 2024 Federal Issue Paper entitled “Investment in Water Infrastructure”, states that SRF programs in Texas are more than 7 times oversubscribed, making the on-the-ground impact on Texas utilities even greater.
The TWDB Agenda Item Memo for board meeting date July 23, 2024, includes information on the DWSRF capacity and actual funding requested as shown in Table 7. The DWSRF, which is designed to meet regulatory compliance objectives, has been oversubscribed for the last several years. The demand exceeds the available program capacity.
Additionally, most of the regional plans in the State Water Plan (SWP) emphasized the need for an expanded State role in financing infrastructure and water supply improvements. In 2013, Texas voters approved a constitutional amendment creating the State Water
FIGURE 3. SRF Funding for Texas 2021-20215
Drinking Water State Revolving Fund
TABLE 7 Drinking Water State Revolving Fund Capacity and Requests16
Implementation Fund for Texas (SWIFT) and the State Water Implementation Revenue Fund for Texas (SWIRFT) to finance projects approved by one or more of the state’s 16 regional water planning groups and included in the State Water Plan. At inception, the Legislature’s goal for the funds was to provide an estimated $27 billion in loans for SWP projects over 50 years. More recently, On November 7, 2023, Texas voters approved a $1 billion allocation to a new Texas Water Fund through Texas Proposition 6. The Federal Infrastructure Investment and Jobs Act (IIJA) authorized five years of supplemental funding to the DWSRF to be used to address emerging contaminants and lead service line replacements.
A history of the State of Texas funding can be seen in the table below.
TABLE 8. Funds* Available for Intended Use Plans including State and Federal Funding17
*The TWDB will use grants, along with other available sources of funds, to make available up to $435,066,830 for projects in SFY 2024 IUP. The sources of funds include the FFY 2023 and reallotted FFY 2021 annual appropriations and IIJA capitalization grants, state match, principal
The creation of new state funding sources demonstrates an increased commitment by the Federal Government and Texas Legislature to prioritize funding for drinking water supply and infrastructure. However, more federal and state funding is needed to address all needs for improving supply and reliability.
The TWDB, as part of the regional water planning process, performs a socioeconomic study for each of the 16 regional water planning areas. The 2022 State Water Plan indicates that not meeting the identified water needs would result in an estimated annually combined lost income impact to the State of approximately $110 billion in 2020 and $153 billion in 2070. It is also estimated that the State would lose approximately 615,000 jobs in 2020 and increase to 1.37 million jobs in 2070.
PUBLIC SAFETY
TCEQ serves as the principal regulatory body in Texas and is responsible for upholding the Federal Safe Drinking Water Act and state standards to safeguard public health by overseeing PWS. TCEQ sets and implements health-based standards to improve and maintain the quality of water in the state. These standards are part of the Texas Surface Water Quality Standards, which include regulations for various water quality parameters to ensure public health and environmental protection. In 2022, TCEQ Annual Compliance Report for the Public Drinking Water Program reports that health-based standards were met by 96% of the public water systems. Ninety-nine percent (99%) of the population were served by public water systems meeting health-based standards.
Moreover, 87% of PWS, serving 95% of the population, demonstrated compliance with monitoring and reporting requirements. The most frequent violations among PWS included issues related to public notice, disinfectant residuals, and the revised total coliform rule.
Public safety concerns and challenges stem from a range of factors, most notably unforeseen weather events, vulnerabilities in web safety management and addressing emerging contaminants such as per- and polyfluoroalkyl substances (PFAS). Major public health challenges arise from severe weather events. Based on National Centers for Environmental Information, the unprecedented winter storm spanning February 11-20, 2021, caused water pipes to burst and boil water advisories to be issued in many counties18. Challenges from cyber security vulnerabilities stem from inadequate internet security management, limited cybersecurity measures, limited budget, inexperienced staff and third part dependencies. The North Texas Municipal Water District, for example, serving 2 million people, fell prey to a ransomware attack in November 202319.
Another challenge for water utilities will be addressing PFAS and their associated health and safety risks. The EPA issued the first-ever national, legally enforceable drinking water standard (shown in Table 2) with EPA in April 2024 to protect communities from exposure to harmful PFAS, also known as ‘forever chemicals’. Exposure to PFAS has been linked to deadly cancers, impacts to the liver and heart, and immune and developmental damage to infants and children20
Additionally, for public safety, water utilities will also need to comply with the lead and copper rule.
4. Changing trend of maximum contaminant level (MCL) violations during 2019-2022
INNOVATION
According to the 2022 Texas State Water Plan, many innovative strategies are projected to fulfill the estimated 2.5 million acre-feet of water needs in the state by 2070. Among a list of several strategies identified in the plan, the primary strategies implemented to innovatively manage Texas drinking water resources include reuse (14.4%), desalination (4.5%), and aquifer storage and recovery (ASR) (2.5%).
According to TWDB’s 2022 biennial report on seawater and brackish groundwater desalination, the number of municipal desalination facilities in Texas has increased from 12 in 1999 to 53 in 2020 with the total capacity having increased from 22 MGD to 157 MGD. The source water for these facilities is brackish groundwater (36), brackish surface water (16) and reclaimed water (1) and the location of these facilities is shown on the map from TWDB. The current status of the BRACS studies is presented in the figure below from the TWDB.
There are three operating ASR systems in Texas operated by El Paso Water Utilities (1995), City of Kerrville (1998), and San Antonio Water System (2004). Another technology similar to ASR is the managed aquifer recharge (MAR). Since 2002 TWDB has completed ten ASR studies, and two studies are currently underway.
Water reuse is the practice of using treated wastewater for a beneficial purpose. Texas was home to the first direct potable reuse facility in the nation. The Colorado River Municipal Water District has operated a direct potable reuse facility in Big Spring
5 Distribution, size and source water of municipal brackish desalination facilities in Texas with a design capacity of more than 0.025 million gallons per day, 202021
FIGURE
FIGURE
since 2013. In 2014-2015 there was a temporary direct potable reuse facility in Wichita Falls and The Cities of El Paso and Liberty Hill are currently in the works. Currently there are five indirect potable reuse operating facilities in Texas. The 2022 State Water Plan indicates reuse will account for 14.4% (1,106,000 acre-feet) of all new water supplies in 2070 if the recommended reuse strategies are implemented.
FIGURE 6. Brackish Groundwater Production Zone Designation Status.
PHOTO: BLUE PIPES,PFLUGERVILLE PROJECT; TWDB
RECOMMENDATIONS TO RAISE THE GRADE
• Increase funding for water infrastructure operation and maintenance.
• Encourage utilities to adopt rate models that will fund adequate operations, maintenance and capital needs for water infrastructure.
• Encourage utilities to implement asset management plans to plan and project. appropriate infrastructure maintenance and replacement and avoid deferring necessary maintenance.
• Provide State and/or Federal financial assistance for mitigating costs of compliance with new drinking water treatment standards through legislation.
• Provide State and/or Federal financial assistance for water supply projects.
• Continue expanding alternative (innovative) water supply options.
• Increase accuracy of self-reported data
Sources
1. State of Texas Public Drinking Water Program 2022 Annual Compliance Report dated July 1, 2023.
2. Data Source: Texas Water Development Board, Texas Water Service Boundary Viewer, retrieved March 5, 2024
3. Data Source: Texas Commission on Environmental Quality (TCEQ) Office of Water, Water Supply Division, July 01, 2023 State of Texas Public Drinking Water Program 2022 Annual Compliance Report
4. Texas Water Development Board Water Balance Data for Statewide Totals as of 3/22/2024 for 2021 and 2022, and Summary of Water Balance Data by Population as of 5/3/2024 for 2020. Historical Water Loss Audit and Conservation Annual Report Data | Texas Water Development Board
5. Texas Water Development Board Water Loss Audit database download for 2019-2022 as of 5/24/2024
6. 2021 LCRR Implementation Fact Sheet, April 2024
9. Texas Commission on Environmental Quality, PWSs Limiting Water Use to Avoid Shortages.
10. Source: TWDB State of Texas Intended Use Plan Drinking Water State Revolving Fund SFY2023
11. Source: TWDB State of Texas Intended Use Plan Drinking Water State Revolving Fund SFY2023
12. National Research Council, Disaster Resilience: A National Imperative, Washington DC: The National Academies Press; 2012
13. Texas Section of the American Society of Civil Engineers, (2022) Reliability and Resilience in the Balance: Building sustainable Infrastructure for a Reliable Future, A Vision Beyond Winter Storm Uri and Viola
14. Tiedman, H.R., Spearing, L.A., Castellanos, S., Stephens, K.K., Sela, L., Faust, K.M. Tracking the Post-Disaster Evolution of Water Infrastructure Resilience: A Study of the 2021 Texas Winter Storm; Sustainable Cities and Society, Volume 91, April 2023, 104417
15. https://www.savethesrfs.org/_files/ugd/ce9ad4_a20781c2f60f4382a86b512da014731d.pdf 22, downloaded July 22, 2024
17. State of Texas Intended Use Plan, Drinking Water State Revolving Fund Reports for State Fiscal Years 2020, 2021, 2022, 2023, and 2024.
18. Source: The Great Texas Freeze: February 11-20, 2021 | News | National Centers for Environmental Information (NCEI) (noaa.gov)
19. Source: North Texas water utility serving 2 million hit with cyberattack (therecord.media)
20. Source: Biden-Harris Administration Finalizes First-Ever National Drinking Water Standard to Protect 100M People from PFAS Pollution | US EPA
21. The Future of Desalination in Texas, 2022 Biennial Report of Seawater and Brackish Groundwater in Texas, 88th Legislative Session, TWDB, December 1, 2022
• https://2017.texasstatewaterplan.org/statewide
• Texas Water Development Board, Texas Water Service Boundary Viewer, retrieved March 5, 2024
• Texas Commission on Environmental Quality (TCEQ) Office of Water, Water Supply Division, July 01, 2023, State of Texas Public Drinking Water Program 2022 Annual Compliance Report.
• Texas Water Development Board Water Balance Data for Statewide Totals as of 3/22/2024 for 2021 and 2022, and Summary of Water Balance Data by Population as of 5/3/2024 for 2020. Historical Water Loss Audit and Conservation Annual Report Data | Texas Water Development Board
• Data Source2022 as on 5/24/2024
• Texas Commission on Environmental Quality, PWSs Limiting Water Use to Avoid Shortages
• Dallas Morning News, Jan 22, 2023 “Boil Water Notices are increasing in Texas, and we should be worried.”
ENERGY
EXECUTIVE SUMMARY
In 2025, Texas, with a population just over 30 million people, is the engine at the heart of our national energy infrastructure, producing, transporting, and delivering approximately 25% of the energy needs of the United States1. This infrastructure was built over the past century through hard work, ceaseless technological innovation, and a bias to embrace market forces to drive investment decisions. The outcome produced a remarkably dynamic, reliable and resilient infrastructure at a global scale. This energy network supports and enables industries and essential infrastructure, like water, wastewater, transportation, and telecommunications that increasingly rely upon this dependable energy network to deliver essential services.
Since 2021, the Texas energy industry has been challenged by impacts from major external events including the COVID-19 pandemic, unprecedented price shocks, and extreme weather events including the derecho storm, Hurricane Beryl, and twin Winter Storms Uri and Viola that uncovered previously unrecognized, systemic, physical and regulatory driven reliability and resilience weaknesses. Simultaneously, the energy industry has been going through an evolutionary change of increasing electrification, energy transition, swelling regulatory burden, and extraordinary demand increases. These forces have produced a precarious imbalance between dispatchable, and intermittent power generation resources complicated by regulatory and market uncertainty and unprecedented demand growth.
PHOTO:
Consequently, this essential infrastructure engine is being dramatically reconfigured in a highly balkanized fashion across the US and beyond in response to regulatory, social, and business drivers. On a national basis, this evolutionary process represents the equivalent of redesigning and rebuilding an entire airport and the airplanes that use it, engaging teams that struggle to effectively coordinate, while continuing to dispatch and receive aircraft in a timely and safe manner. The risks incumbent in simultaneously rebuilding runways, redesigning aircraft, and expanding terminals, while planes are on the runway and in the air waiting to land are significant, bordering on insurmountable. Sustaining reliability and resilience of the electric grid under this reality is highly uncertain. Different Texas regulatory and legislative bodies have worked together to develop and implement strategies to address these complex challenges. Similar to most complex problems, there is seldom a single, silver-bullet, answer. Some solutions work, some fall short on the desired outcome, some remain untested under stress and some solutions create unintended new problems.
The ASCE Texas Infrastructure Report Card Energy Subcommittee determined that the complexity of the Texas energy sector demanded the necessity to separate the analysis into two primary sectors, the electric energy sector, and the non-electric energy sector, and then combine the analytical components into this integrated energy assessment. Prior analysis confirmed that any assessment is incomplete without examining the critical reliability and resilience issues created by interdependence between infrastructure sectors, where the reliability of one sector is dependent upon the reliability of another sector.
The Texas energy industry introduces two unique characteristics that are fundamentally different from other infrastructure that is predominantly owned and operated in the public sector. The first characteristic is that market forces, influenced by regulations, drive investments in expansion, reliability, and resilience. Legislation and regulations can create conflicting requirements and distort markets, creating consequences that negatively affect reliability and resilience like revenue insufficiency in the energy-only Electric Reliability Council of Texas (ERCOT) market. The second characteristic is that investments are predominantly underwritten by private markets. The recent derecho and category 1 Beryl storms exposed underinvestment problems in the transmission & distribution network. Execution shortcomings in storm response reflect electricity infrastructure problems that extend well beyond power generation.
This report highlights both new emerging issues as well as lingering issues that were previously unresolved that materially impact the 2025 Texas Infrastructure Report Card (TxIRC) for energy.
Integrated Energy network Infrastructure Report Card
INTEGRATED ENERGY WITHIN THE INFRASTRUCTURE REPORT CARD
CAPACITY
CAPACITY>UPSTREAM: PRODUCTION, SUPPLY, AND GENERATION
This report focuses on the ERCOT portion of the electric energy sector which serves ~26 million Texans in 214 of 254 counties and accounts for ~90% of Texas electricity demand. ERCOT is the largest electricity market of any state, and it leads the nation in renewable generation. The generation mix in ERCOT is diverse. Intermittent supply from wind and solar, as the second and third largest sources of generation capacity in ERCOT together provide 39% of the installed capacity (Tables 1a). Increased intermittent generation in the generation mix creates operational challenges for ERCOT. Texas is the largest wind producer and the second largest solar producer in the US.
Non-electric energy production dramatically exceeded consumption. Domestic energy and export markets helped to propel Texas to the equivalent of the 8th largest economy in the world3. This unprecedented oil and natural gas production growth, coupled with Liquefied Natural Gas (LNG), petrochemical, and oil export expansions during the last decade firmly established Texas as the leading innovation hub for energy in the world. Texas dominates domestic non-electric energy production (Table 1b4).
1B . Non-electric Energy sector: Key production, and supply
This achievement would have been impossible without
investments in
and expanding infrastructure to reliably serve both domestic and global energy markets.
CAPACITY>MIDSTREAM: PIPES, WIRES, RAIL, TERMINALS, AND RELATED INFRASTRUCTURE
Established in 1970, ERCOT is an independent, not-for-profit organization, regulated by the PUCT responsible for overseeing the reliable and safe transmission of electricity over the power grid serving most of Texas. Since 1996, ERCOT has also been the Independent System Operator (ISO), serving as the broker between the competitive wholesale power buyers and sellers and manages the transmission system (Table 2a).
TABLE 2A. KEY midstream energy sector: electric transmission (wires)
Texas has the most complex and largest pipeline network in the country with over 489,657 miles of gathering, intrastate, interstate, and distribution pipelines (see Table 2b). This is the equivalent of 17% of all pipeline miles in the US5 and global country equivalent to #2, after the US.
TABLE 2B. KEY midstream energy sector: pipes and related infrastructure (2023)
Complementing the pipeline system is an equally extensive network (summarized in Table 2c) of roads6, ports, rail, liquid and bulk storage facilities, refineries, petrochemical and processing plants and an inland waterway, all of which have been expanding to increase access to both domestic and international energy markets.
TABLE 2C. KEY midstream energy sector: rail, ports, and waterways
CAPACITY>DOWNSTREAM OR MARKET
ERCOT has over 1,873 active market participants that generate, move, buy, sell or use wholesale energy electricity. Expanded electrification of the Texas economy is increasing the direct reliance on the electric market. Most downstream energy infrastructure is owned and operated by private entities. Some exceptions exist, such as the natural gas distribution that is served by ~241 investor-owned gas utilities and ~75 municipal gas utility systems7, and governmentally controlled ports and waterways. Interstate pipelines carry energy products for consumption outside of Texas.
Texas water ports are publicly and privately owned, while most energy facilities (storage and LNG terminals, processing plants, etc.) built at ports are privately owned. In 2023, Texas generated more than $200 billion in trade dollar value and accounted for 65% of US energy exports8, most of which transits Texas ports or through pipeline connections into Mexico. The Houston ship channel is the nation’s busiest waterway managing 22,000 ships and over 200,000 barge commercial craft in a typical year9. The US is now the largest LNG exporter in the world. New LNG expansion projects have been interrupted by a permitting “pause” by the current 2024 Federal administration, creating regulatory uncertainty for those expected LNG expansions, and negatively impacting the investment efforts to enhance the entire supply chain.
CONDITION
State metrics have been prioritized, and independent inspections of infrastructure have been gradually increasing over the past decade10
The 2021 Winter Storms Uri and Viola consequences increased inspection of critical electric and non-electric energy infrastructure for weatherization and hardening against weather extremes. There have been improvements to inspection frequency and performance requirements that have improved maintenance and investment levels. However, despite an ongoing focus to reduce leaks and spills, gathering systems have been highlighted by the Pipeline and Safety Administration (PHMSA) for inclusion in recently adopted regulations due to historical operating issues, including leaks and spills. This remains an ongoing challenge, not unlike the automobile safety journey seeking to achieve zero accidents11. Market prices provide a unique metric for validating the condition and capabilities of energy infrastructure to meet the needs of supply and demand. Sometimes those market signals have been brutal. The challenge is that the issue of reliability and resilience can be considered from multiple perspectives.
The Baker Institute released a future reliability study of ERCOT, including testimony to the Texas Senate, that highlighted the growing number of demand hours exceeding installed dispatchable capacity12 providing a negative indicator for reliability and resilience. The increased electrification of the upstream non-electric energy sector confirms an increasing interdependence risk and the derecho and
Beryl storms, and the industry response uncovered underinvestment in Transmission & Distribution (T&D) hardening and resilience efforts, degrading condition views. The Texas Energy Fund (TEF) is underwriting investment in dispatchable natural gas capacity that may largely replace expected coal and natural gas capacity planned for retirement. In parallel, an unprecedented forecast demand growth is anticipated to outstrip the dispatchable capacity investment, net of retirements, resulting in a growing imbalance between demand and dispatchable supply and consequently declining reliability.
The reliability issue is not unique to Texas. Shorter term metrics of operational reliability include System Average Interruption Duration Index (SAIDI), System Aerage Interruption Frequency Index (SAIFI) and Customer Average Interruption Duration Index (CAIDI). The non-momentary (< 5 minutes) interruption indexes are increasing (longer service outages) as well as the events frequency of the nationwide Energy Emergency Alert (EEA), indicating declining reliability.
Regulatory responsiveness to address these issues consistently lags market signals by months or years. For example, in response to the 2021 Winter Storms Uri and Viola, Texas SB3 mandated that ERCOT create its first Reliability Standard metric13. ERCOT’s solution is based upon a multi-metric approach, using Monte Carlo simulation that includes a) the magnitude of a single loss of load event, b) the frequency of loss of load events, and c) the duration of any single loss of load event. This Standard extends beyond the traditional methodology relied upon by other states. However, the model is not the solution to reliability problems. It is a predictive tool used for informed input to regulatory decision making that remains untested under stress.
OPERATIONS AND MAINTENANCE
Markets can negatively impact operations and maintenance (O&M). The failure of 74% of gas fired dispatchable generation facilities during twin Winter Storms Uri and Viola was due to a reliance on interruptible gas supply and/or gas transportation. This failure was directly driven by a lack of revenue sufficiency in the ERCOT energy-only marketplace that structurally failed to value reliability and resilience14. The costs of delays and other congestion indicators identify the need for continued investment in Ports15. Transmission and Distribution (T&D) hardening underinvestment exposed by recent storms highlight previously unknown reliability issues. The lagging response to these storms highlights increased resilience challenges in addition to reliability concerns.
PUBLIC SAFETY
The Railroad Commission of Texas’ (Texas RRC) 2024 fiscal year (FY) performed 461,852 inspections of wells and facilities16. Pipeline reported damages declined from 11,080 in FY 2023 to 10,590 in FY 2024. Gas flaring, which is driven by low prices and constrained downstream capacity identified in the previous 2021 TxIRC, has been reduced 63% from June 2019 to September 202417. Extensive vehicular citations in the Permian Basin indicate a safety challenge. Increased reliability interdependence combined with growing electrification of other infrastructure sectors, including the upstream and midstream non-electric energy, create potential consequences and cascading impacts in stress events that create a material public safety risk.
FUNDING
Most energy infrastructure is privately funded. Notably, the electricity market continues to be heavily influenced by regulatory subsidies, most notably for renewable energy generation at the Federal level and discounted financing for dispatchable generation at the State level (Texas Energy Fund). Other investments may be operational and regulatory driven, like the Permian Reliability plan, but are ultimately paid for privately by the energy market consumers.
Regulatory uncertainty also increases associated funding costs and negatively impacts long-term energy investments, including T&D investments. Market uncertainty has been a historical risk for the Texas energy market which led to cyclical investments by the private sector. This will be an ongoing challenge for encouraging future investment. Natural gas periodically experiences negative marginal pricing, indicating that infrastructure capability is mismatched to demand or delayed by regulations and/or permitting.
REGULATIONS AND INNOVATION
Regulations are not inherently good or bad but should be judged by how effectively they produce the intended outcomes. Regulations that produce inefficient or negative outcomes need to be adjusted, corrected, or changed to reflect changing circumstances or changes in desired outcomes. In an energy only market structure, regulatory distortions create conflicting market signals and lead to inefficient investment or unnecessary increased costs. Competitive forces and market driven environments in the energy industry require continuous innovation. Regulatory innovation is needed to consistently ensure that rules and regulations support reliability and resilience considerations while simultaneously establishing a stewardship perspective to ensure that money is invested prudently. For example, the political unwillingness to consider a capacity-based market approach has led to inefficient solutions coming out of Senate Bill 3 (SB3) in the aftermath of the 2021 winter storms Uri and Viola. ASCE Texas Section’s Beyond Storms Report estimated that a reliability focused capacity market would increase costs by < 5%. A complex mix of less efficient incentives, like ECRS, which appears to be > 4 times more costly despite being masked by a large drop in natural gas prices16, and subsidized capital for new dispatchable generation through the TEF are examples. The TEF appears to be achieving the outcome of attracting new dispatchable generation investment in Texas, but the inability to resolve the root causes of the problems, like revenue sufficiency, indicates that Texas will likely revisit these same issues in the future.
FUTURE NEED
The population in Texas is growing by approximately 1,300 residents/day17. While the interconnection queue to ERCOT indicates ~350,000 MW of new generation request in various stages, the amount of dispatchable generation accounts for < 5% of the generation additions, in the interconnect queue. Tripling the installed capacity (currently ~150,000 MW) in 5 years is unprecedented in utility history. The current load forecasts indicate unprecedented growth of demand (~50,000 MW higher than 1 year ago) from crypto mining, hydrogen, data centers, direct air capture18. Meeting this anticipated load with a balanced supply mix is uncertain. New loads can be added in 6-12 months, while ERCOT estimates that the grid requires a minimum of 3.5 - 6 years. This is better than non-ERCOT markets which require ~7.5 to 13 years. It remains a fundamental mismatch. SB2627 provides low-cost funding of $7.2 billion for new dispatchable generation, but this funding solution was created by the inability to create a reliable and predictable revenue sufficiency mechanism in the energy only market by the regulatory and legislative bodies. Recent reports indicate 42,000 MW of prospective new generation has applied for these funds and 16 applications totaling 8,489 MWs of capacity have now moved into the next phase of due diligence for potential funding.
RESILIENCE
Resilience of infrastructure considers the sector’s capability to withstand random events, manage and mitigate the impact of an event, and rapidly recover from the event. For electricity, the usual metric captures an outage event (number of customers and load impacted) and the pace of restoration or the outage duration. Unique event circumstances, like storm intensity, and local issues make comparisons of metrics challenging to apply broadly. Quantifying interdependence risk, which impacts both reliability and resilience, is more difficult to quantify despite its direct impact on both the energy infrastructure and every other sector on infrastructure. Following Winter Storms Uri and Viola, seasonal inspections of electric and non-electrical energy infrastructure were formalized through State legislative and regulatory actions. Texas RRC created a critical infrastructure division and inspected 7,294 sites in 2023 for extreme cold and heat cycles preparedness19. ERCOT weatherization inspections initially included 324 site inspections and a review of 847 generators and 54 transmission self-inspections, follow-up and enforcement recommendations20. Black Start Generator dual fuel inspections and storage requirements were implemented but remain unconfirmed for security reasons. Shortcomings in hardening investments in T&D infrastructure and storm recovery response highlight a new reliability and resilience problem area. Mitigation efforts from other infrastructure interdependent on the energy sector was beyond the scope of this report.
GRADING NOTE
This grading effort reflects the electric energy, non-electric energy, and integrated energy assessment on a system-wide basis. This tends to dampen regional performance differences that may present better or worse performance metrics than system metrics.
CONCLUSION
The Energy infrastructure of Texas is experiencing increased stress and declining reliability and resilience, despite several notable improvements. The current regulatory environment, involving permitting delays and conflicting federal and state regulatory and legislative responses to changing market conditions, accounts for a full letter grade drop in the overall grading. Based upon the analysis of the electric sector (C- grade) and non-electric energy sector (C grade), the TxIRC grade for the combined—or Integrated Energy Infrastructure, is a C.
PHOTO: ELECTRIC HIGH VOLTAGE CONSTRUCTION AUSTIN
ENERGY
RECOMMENDATIONS TO RAISE THE GRADE
• Expedite permitting and regulatory reviews and ensure transparent and predictable regulatory outcomes, to overcome those issues that currently impair the ability of the energy industry to timely achieve the reliability, and resilience needs stemming from hyper growth market demand.
• Ensure regulations and market rules include explicit considerations, as well as transparent and actionable performance metrics to ensure reliability and resilience of the network.
• Address the ongoing failures to ensure predictable revenue sufficiency for dispatchable generation in ERCOT required to support maintenance, reliability and resilience investments required for a reliable energy grid. Ensure the proposed ERCOT reliability standards include predictable revenue sufficiency outcomes that support the standards. Ensure revenue sufficiency for T&D investment in hardening infrastructure in effective post storm recovery capabilities.
• Ensure that Black Start Generation can perform in the top decile of availability with satisfactory reliability performance and dependable fuel optionality.
• Continue implementing inspections and standards to address independence risk issues within energy infrastructure and between energy infrastructure and other essential infrastructure sectors.
• Balance the mix of intermittent and dispatchable generation resources and ensure sources of revenue sufficiency to make ongoing reliability investments in the grid and in existing generation resources that lack support in an “Energy Only” market.
• Make substantive changes to the regulatory and permitting processes to facilitate a transparent, predictable, and timely outcome supporting the alignment of energy industry response to new and changing demand.
• Enhance regulatory support for targeted increased investment in T&D hardening for reliability and storm response plans and execution to improve resilience.
• Match dispatchable generation retirements with replacement dispatchable generation and implement solutions for improved reliability (generation and transmission resource adequacy), including demand side resources.
• Reconfigure current regulatory processes that allow large end-users to arbitrage and transfer transmission system costs, including expansion projects, to smaller captive customers, especially residential customers.
ENERGY
Sources
1. EIA Texas Profile 2023
2. Table 1.a: ERCOT 5-24 monthly fact sheet and NREL annual wind and solar reports
3. Texas Economic Development 2023
4. Table 1.b: Texas RRC 2023 annual report
5. Texas RRC and PHMSA pipeline mileage 2023
6. Road transport is outside the scope.
7. McFadden consulting group 2019
8. Foreign trade statistics- US Bureau of labor 2023
9. Texas comptroller of Public Accounts 2023
10. Interstate regulated by USDOT. Intrastate regulated by Texas RRC
11. US DOT & TXDOT reporting through 2019. Kinder Morgan 2020
12. Baker Institute 2024 ERCOT future of electric reliability in Texas and testimony to TX legislature 6/2024.
13. Texas Senate Bill #3, ERCOT filings and sources
14. ASCE Texas Section Beyond Storms and Refresh reports.
15. Texas A&M survey of funding practices (2015); Texas Ports and TX exports (2017);
16. Potomac Economics, ERCOT independent market monitor, 2023 State of the market, 5/24
17. Texas Tribune, 12-19-2023, Texas led the US in population growth in 2023, W Melhado
18. ERCOT public 4-23-2024 CEO Board update
19. Texas RRC – various reports
20. Various ERCOT reports & presentations to PUCT 1/17-18/22 updates.
HAZARDOUS WASTE
EXECUTIVE SUMMARY
Over the past four decades, the Texas Commission on Environmental Quality (TCEQ) has effectively managed state regulations that align with federal standards for hazardous waste infrastructure. Since the federal promulgation of the Resource Conservation and Recovery Act (RCRA) and other federal regulations over 40 years ago, Texas programs have improved quality and complexity, supported by public and private funding, to meet the demands of increasing hazardous waste generation from a booming economy.
Compared to the early days of RCRA and federal Environmental Protection Agency (EPA) Superfund programs, Texas's hazardous waste infrastructure has improved. However, limited TCEQ staffing hampers the agency's ability to address challenges such as the increasing number of Electric Vehicles (EV) and the potential surge in large waste batteries, emerging contaminants like poly-fluoroalkyl substances (PFAS), and rising sea level threats to contaminated sites and future needs. Texas must tackle these unknown and unquantified challenges. Over the next 20 years, a dedicated focus must be on recycling, reuse, waste diversion, pollution prevention, industrial process minimization, reducing air pollution emissions from hazardous wastes, and managing new hazardous waste influxes from EVs and new renewable energy products.
TCEQ must hire a dedicated staff and develop new policies and guidance to address emerging issues. Without this, hazardous waste infrastructure will deteriorate. Funding is needed for further studies by TCEQ staff, ideally in partnership with academic institutions, and regulations should be reevaluated to
address future concerns. Due to hazardous waste management and remediation costs, the private sector must continue funding most improvements. New or revised regulations and policies are needed to create market incentives, ensuring changes are commercially driven, building on existing private sector growth and investments.
INTRODUCTION
The Texas economy continues to experience robust growth and ranks as the 8th largest economy in the world, valued at $2.4 trillion, according to a 2022 International Monetary Fund Gross Domestic Products Report1. Major industry sectors include advanced manufacturing, aerospace, aviation and defense, biotechnology, energy development, and petrochemical production2. In 2023, the Texas oil and gas industry paid $26.3 billion in taxes and royalties to state and local governments3. With 40 percent of the US crude oil reserve and one-fourth of the US natural gas reserves, Texas leads the nation in chemical manufacturing with shipments valued at $117.5 billion4 Texas also leads the nation in hazardous waste generation. As reported by the U.S. Environmental Protection Agency’s (EPA) Biennial Hazardous Waste Report, Texas generated 17.5 million tons of hazardous waste in 20195. Hazardous waste encompasses any waste that threatens human health or the environment due to its toxic, flammable, corrosive, or reactive properties. Examples include industrial, medical, electronic, and household hazardous waste. Historically, hazardous wastes were disposed of through open dumping and burning methods6. Based on current TCEQ reporting, 83 percent of industrial and hazardous waste handling methods include deep-well or underground injection, landfill, land treatment/application, and incineration. The other 17 percent of waste is handled with biological treatment, reclamation or reuse, fuel blending, and wastewater treatment processes7
CAPACITY
This section focuses on the capacity of Treatment, Storage, and Disposal Facilities (TSDFs) to manage hazardous waste, excluding municipal solid waste and non-hazardous industrial waste, to avoid overlap. Strict regulations prohibit TCEQ-permitted municipal solid waste landfills from processing hazardous waste, though they may accept certain non-hazardous wastes. Successful local programs divert household hazardous waste from municipal landfills, increasing demand for hazardous waste facilities.
According to the EPA’s 2019 “Superfund Task Force Final Report” and the ASCE 2021 National Report Card on America’s Infrastructure on Hazardous Waste, Texas generates more than half of the nation’s hazardous waste. The EPA’s 2021 Biennial Report for Texas reveals that 1,339 generators produced nearly 17.9 million tons of hazardous waste that year. Although national hazardous waste generation has generally declined due to recycling and reuse efforts, Texas’s hazardous waste tonnage rose slightly from 17.54 million tons in 2017 to 17.9 million tons in 2021, despite a reduction in active generators from 1,534 to 1,339 over the same period. This follows a slight increase in hazardous waste generation from 2015 to 2017 by about 1 million tons, but since then, the trend has seen a steady or slowly increasing tonnage with fewer facilities. The EPA’s 2023 Biennial Report has yet to be released and may clarify if the trend toward fewer generators and a slower rate of tonnage growth will continue.
The private commercial sector predominantly owns and operates TCEQ-permitted hazardous waste facilities in Texas. TCEQ oversees regulations for hazardous waste transportation, disposal, treatment, remediation, and pollution cleanup to ensure public health and environmental protection. The hazardous waste infrastructure includes managing waste at TSDFs and cleaning contaminated sites with proper waste disposal.
Commercial hazardous waste facilities vary by type and the waste they accept, including waste oil, chemicals, spent solvents, metals, and other regulated substances. Facility types include injection wells, incinerators, storage, processing, and recycling. Each facility selects appropriate services based on process needs, location, and cost-effectiveness.
TCEQ supports hazardous waste control through 15 regional offices across Texas, with permitted commercial facilities in 10 of the 16 regions. Within TCEQ’s General Information (GI) publication GI-225 (October 2022), the regions without permitted commercial facilities for hazardous industrial solid waste are Amarillo (Region 1), Lubbock (Region 2), El Paso (Region 6), San Angelo (Region 8), Austin (Region 11), and Laredo (Region 16).
Texas’ hazardous waste capacity can be contextualized by comparing it to nationally reported data. In December 2019, EPA published its National Capacity Assessment Report, which evaluates the nation's long-term capacity for hazardous waste recovery, treatment, and landfilling at RCRA-permitted commercial TSDFs. According to this report, the U.S. has sufficient capacity to manage all hazardous waste through 2044. For Texas, the report lists US Ecology Texas with a permitted landfilling capacity of nearly 10 million tons, over 10%
of the nation's total landfilling capacity of 87 million tons. Other Texas facilities also have substantial capacity for various waste treatments and disposal methods.
The EPA report highlights national trends of consolidation and restructuring in the commercial hazardous waste industry, leading to fewer energy recovery facilities, incinerators, and landfills. Additionally, new federal regulations, permit denials, statutory limits, changes in fire codes, disposal methods, and market conditions could disrupt TSDF operations and capacity in Texas. Despite these challenges, TCEQ is actively addressing private sector permitting needs. As stated in TCEQ FY22 performance report, 219 industrial and hazardous waste permits were issued, exceeding their goal and indicating strong efforts to manage applications.
The TCEQ FY21 report shows similar trends, but there is no specific estimate of Texas' hazardous waste landfilling capacity compared to the national projections. Texas commercial facilities have significant capacity to landfill hazardous waste when recycling, reuse, or incineration are not viable options. Recognizing the limitations of landfilling, TCEQ promotes statewide campaigns for waste minimization, diversion, recycling, and reuse.
With substantial capacity and additional permits, Texas’ hazardous waste landfill capacity will likely align with national estimates through 2044. However, exact capacity in terms of years is difficult to quantify and involves inherent uncertainties.
According to the FY22 TCEQ performance report, almost 11,000 tons of hazardous waste were diverted from landfills through household hazardous waste programs making non-hazardous landfills safer from the risk of hazardous waste leaching potential, while not adding significant demand to the millions of tons typically generated in a year. Over 280,000 tons were reduced through pollution prevention planning. Additionally, about 66 million quarts of used oil were diverted from improper disposal, thereby preventing illicit discharges to surface waters, while also properly diverting to recyclers rather than landfills. Continued progress in waste diversion, pollution prevention, and waste minimization should ideally lead to a decreasing demand for hazardous waste infrastructure capacity.
CONDITION
Texas's hazardous waste infrastructure manages hazardous waste at treatment, storage, and TSDFs and cleans up contaminated sites. Government regulations primarily shape this infrastructure, with increased public awareness over the past two decades also playing a role. TCEQ oversees these activities, working with the EPA to enforce federal regulations under the Resource Conservation and Recovery Act (RCRA).
Within the 2021 EPA Biennial Report, Texas managed over 19 million tons of hazardous waste from approximately 1,300 generators and diverted over 89,000 tons to recycling. Hazardous waste generators in Texas are classified as Large Quantity Generators (LQGs) or Small Quantity Generators (SQGs), with varying regulatory requirements.
TCEQ manages several cleanup programs, including the following (not all-inclusive):
• Voluntary Cleanup Program (VCP): Encourages property owners to clean up contaminated sites with regulatory oversight and liability protection. As of September 2023, nearly 3,200 sites have been registered, with about 2,000 receiving unconditional completion.
• State Superfund Program: This program addresses sites with hazardous substances that pose significant risks, requiring complex, long-term cleanups. As of November 1, 2024 (Texas Register, 49 TexReg 8773-8775), there were 29 active sites on the State Superfund list, with 14 proposed for listing and nearly 60 removed since October 2023. The count of active sites fluctuates as new cases are added and others are removed following successful remediation. TCEQ regularly updates this data in its registry, providing both current listings and historical data for reference.
• Brownfields Program: This program focuses on redeveloping underutilized properties complicated by hazardous substances. In FY22, 66 cleanups were completed, exceeding targets and returning properties to safe use.
• Dry Cleaner Remediation Program (DCRP): This program administers cleanups for contamination caused by dry cleaning solvents. Since 2003, it has cleaned up nearly 120 sites, with over 130 more in progress. In FY22, the program completed four cleanups.
• Leaking Petroleum Storage Tanks (LPST): TCEQ manages and remediates contaminated sites, with over 25,000 cases closed since 1987. It also operates a State Lead Program for high-priority sites (the State Lead Program involves cases where the TCEQ manages, leads and pays for cleanups directly, when responsible parties can’t be found or don’t have the financial resources to pay for priority cleanup).
• Innocent Owner/Operator Program (IOP): This program provides legal protection to property owners and operators who are not
responsible for pre-existing contamination, facilitating redevelopment. Nearly 1,300 sites have been accepted since 2004.
• Environmental Audit Privilege Act: This act encourages businesses to conduct internal audits and self-disclose violations, promoting compliance and reducing hazardous waste incidents. TCEQ has reported significant participation, with an estimated 5,000 Notices of Audit (NOAs) submitted by 2018.
The Texas Department of State Health Services (DSHS) regulates hazardous materials like lead-based paint and asbestos, ensuring their safe handling and disposal. However, most asbestos-containing and lead paint abatement waste is sent to specially permitted nonhazardous waste disposal facilities, which does not impact hazardous waste capacity and condition.
Overall, Texas's hazardous waste infrastructure, supported by TCEQ and other agencies, ensures safe management, treatment, storage, disposal, and remediation of hazardous waste through a robust regulatory framework and comprehensive cleanup programs.
FUNDING
According to Statista's market research based on US Census Bureau data, US waste management and remediation services grew from $78 billion to over $140 billion annually from 2010 to 2022. Hazardous waste management costs increased from $5.8 billion to $8.5 billion between 2008 and 2020. The ASCE 2021 National Report Card on Hazardous Waste notes that Texas generates over half the nation’s hazardous waste, implying the market in Texas may exceed $4 billion. With TCEQ’s FY 22 annual operating budget at $345 million and $50 million allocated for petroleum storage tanks (PST) and hazardous materials cleanup, Texas's hazardous waste infrastructure relies heavily on funding from private businesses, residents, and public entities.
Enhanced public funding is crucial for maintaining regulatory oversight and supporting fee-funded programs like VCP, LPST State Lead, and DCRP, ensuring the protection of human health and the environment. Liability laws allow the state to compel responsible parties to clean up hazardous releases. Still, when financially incapable, the state prioritizes sites posing the most significant public health risks. State funding for cleanup is limited compared to the costs of restoring contaminated sites. Government funds focus on high-risk sites and pollution prevention programs. Programs like VCP and Brownfields have reduced the time of low to medium-risk sites remining undeveloped. Studies show Brownfields cleanups improve local quality of life and property values.
The success of TCEQ programs such as VCP, DCRP, IOP, and the Audit Privilege Act demonstrates the need for continued and increased funding for staff support in all hazardous waste-related TCEQ programs.
The following section further discusses funding, cost, and TCEQ staff considerations.
FUTURE NEED AND OPERATIONAL CONSIDERATIONS
To firmly push for improvement and change, future needs should be linked with operational considerations for managing hazardous waste. Workforce planning is critical to support the mission and goals of regulatory agencies such as the TCEQ. Factors affecting the agency’s operational effectiveness include staff eligible for retirement, retaining highly skilled employees, and reducing high turnover in critical positions. Through 2027, up to 36% of TCEQ’s workforce will be eligible to retire. Salary and benefits need adjustment to remain competitive with other state and local governments and the private sector. Average wages at the TCEQ have only increased by 3.9% since 2016 and lag by more than 30% with comparable state agencies8. Almost 80% of staff salaries remain below the midpoint of similar positions at other agencies9
“The ability to compete for highly skilled applicants, particularly in STEM and high-demand occupations, will continue to prove critical in our efforts to maintain a diverse and qualified workforce necessary for the agency to carry out its mission.”
-TCEQ Strategic Plan, Fiscal Years 2023-2027
Improvements in regulatory review and approval processes should benefit from staff retention. TCEQ has targeted initiatives in waste permitting, including pre-application meetings, improving checklists, forms, and guidance documents to facilitate more consistent and complete applications, consolidating processes for reviewing applications to improve turnaround times, and implementing a Lean Management System to improve processes10
Technical assistance provided by TCEQ to regulated entities should receive continued support. During the Fiscal Year 2021-2022 biennium, technical assistance to improve environmental performance and pollution prevention planning resulted in reduced hazardous wastes by more than 390,000 tons and toxic chemicals by more than 140,000 tons11. Emerging hazardous waste issues include the disposition of electric vehicle batteries once the vehicle reaches the end of its useful life and managing per- and poly-fluoroalkyl substances (PFAS). The
EPA generally supports processes that eliminate waste at its source (source reduction). State agencies such as the Texas Department of Transportation have adopted source reduction strategies that include engineering design and administrative controls to avoid and minimize the generation of hazardous wastes in transportation projects12.
Preferred management methods for generated waste start with recycling, followed by energy recovery, treatment, and disposal13. Repurposing can be another method for hazardous waste management. Old batteries from electric vehicles can be used for energy storage applications such as fast-charging stations or microgrid storage systems. These alternatives can extend the useful life of EV batteries, delaying the need for recycling or disposal14.
PFAS are synthetic chemicals used by businesses and industries to manufacture consumer products worldwide since the 1940s15. PFAS keeps food from sticking to packaging or cookware, makes waterproof clothes and carpets resistant to stains, and creates more effective firefighting foam16. Exposure to certain levels of PFAS can cause adverse health effects, including cancer17. Examples of how PFAS can enter the environment include industrial discharges and land application of biosolids containing PFAS18. These chemicals break down slowly and can build up in people, animals, and the environment over time19. In April 2024, the U.S. EPA released the final regulation requiring PFAS reductions in drinking water that will ultimately impact water and wastewater treatment systems20
Drinking Water and Packaging may contain PFAS.
Technologies like granular activated carbon filters can remove most PFAS from drinking water, but how to manage the resulting waste is unclear21. Wastewater treatment systems will also see significant operation, maintenance, and management impacts with increased regulatory limits intended to reduce PFAS in effluent (liquid waste or sewage discharged into a river or the sea), affecting the engineering design and construction costs of new plants and driving expenses to retrofit existing plants. PFAS presence in biosolids results from the widespread continued manufacture, use, and release of PFAS chemicals from upstream sources and will impact management and disposal cost22.
Compliance with the PFAS regulatory limits will be expensive, with costs externalized on ratepayers. It will also create challenges for wastewater infrastructure investments because drinking water and wastewater systems have the same ratepayers. Industries and businesses that produce PFAS need to bear the PFAS clean-up cost and work with clean water agencies to protect public health23. Industrial pretreatment programs at the manufacturing source will be critical to proactively reducing PFAS pollution entering potable water and wastewater treatment systems24.
The Texas Electric Vehicle (EV) Registration Tool produced by the Dallas Fort-Worth Clean Cities Coalition and the North Central Texas Council of Governments summarizes EV ownership by regions throughout Texas. As of April 9, 2024, 24.9 million vehicles were registered in Texas. Of that total, almost 270,000 registered vehicles are electric. The following table summarizes EV VIN counts by
region in Texas25 . Analysis compiled by the Alliance for Automotive Innovation projects that the EV market will grow by 500% nationwide through 202726
Lithium-ion batteries are the dominant type of rechargeable batteries used in EVs and have an estimated 8-10 years of useful life27 Common materials used in EV batteries include heavy metals such as lithium, nickel, cobalt, manganese, graphite, iron, copper, and aluminum foils, as well as frequently flammable electrolyte and RCRA ignitable28. Most EV batteries are considered hazardous waste due to ignitability (D001) or reactivity (D003) characteristics and can be managed as Universal Waste29
With 270,000 EVs currently registered in Texas and expected growth in the EV market, plans to recycle, repurpose, and safely dispose of EV batteries will be needed by 203030. As of May 2023, only one EV battery recycler was registered in Texas per the TCEQ. Stakeholderdriven processes to create practical and viable solutions are needed to optimize EV battery recycling, promote waste minimization, and identify opportunities to repurpose batteries that can extend their useful life31.
PUBLIC SAFETY, RESILIENCE, AND INNOVATION
Climate change may increase the frequency and intensity of natural disasters like wildfires and flooding, potentially damaging State and Federal Superfund sites, the US's most contaminated hazardous waste locations. Texas has 64 Superfund sites, representing 4.07% of the national total, all vulnerable to such disasters.
In 2017, Hurricane Harvey's unprecedented rainfall damaged several Superfund sites in the greater Houston area. Floodwaters eroded the structure of the San Jacinto River site in Texas, releasing toxic dioxins that can cause cancer and liver and nerve damage.
An EPA report on the 2017 hurricanes' effects on Superfund sites noted that a sample from the San Jacinto River Waste Pits after Hurricane Harvey showed a dioxin concentration above 70,000 nanograms per kilogram, far exceeding the site's risk-based cleanup level of 30 nanograms per kilogram.
The Fourth National Climate Assessment (NCA) in 2017 stated that temperature and precipitation extremes have become more frequent, intense, and longer-lasting. Climate models suggest these trends will continue, potentially increasing the frequency and intensity of natural disasters. The NCA also reported that effects like sea level rise and increased coastal flooding could disperse pollutants, posing a risk to public health.
The Central Texas Coastal Area Contingency Plan (Sector Houston-Galveston) identifies oil disposal as a potential hazardous waste release regulated by the Texas General Land Office (GLO). Shown within GLO's online data, almost all Gulf of Mexico shorelines are sensitive to potential oil and gas contamination. With oil and gas platforms and wells located near or within these shorelines, any accidental oil disposal can threaten public health and the environment.
Hazardous waste significantly contributes to air pollution. In 2021, TCEQ estimated that Texas emitted 873.1 million metric tons (MMT) of greenhouse gases (GGH), far exceeding the Department of Energy Information Administration's EIA estimate of 663 MMT. The following graph presents 2021 GGH emissions as reported by EIA.
In contrast, TCEQ reports greater 2021 emissions than those presented in the pie chart from the EIA. Industry is the most significant contributor to these emissions at 364 MMT (42%), followed by transportation at 210 MMT (24%) and electric power at 183 MMT (21%). Other contributors include agriculture at 62 MMT (7%), commercial sources at 36 MMT (4%), and residential sources at 18 MMT (2%). The EIA’s estimation did not consider agriculture, but both TCEQ and EIA agreed that the industrial sources contribute the most pollutant discharges into the atmosphere.
TCEQ proposed several strategies to reduce pollution, including increasing the use of electric cars, trucks, and buses, decarbonizing cement, and investing in battery storage. TCEQ estimates these measures will reduce GHG emissions in Texas by 174 MMT from 2025
through 2030 and 592 MMT from 2025 through 2050. Additionally, co-pollutants are expected to decrease by 0.6 MMT from 2025 through 2030 and 3.0 MMT from 2025 through 2050.
The EPA’s Toxics Release Inventory (TRI) program tracks the management of certain toxic chemicals that may threaten human health and the environment. U.S. industrial facilities must report annually on how much of each chemical is released into the air, water, or land or managed through recycling, energy recovery, and treatment.
In accordance with EPA’s TRI Factsheet, in 2020, Texas had 1,791 TRI facilities, making up 8.3% of the U.S. Texas managed 4.1 billion pounds of waste, 14.1% of the national total, and had 184.5 million pounds of onsite and offsite disposal, accounting for 6% of the U.S. total. The EPA notes that the toxic chemicals covered by TRI can cause cancer or other chronic health effects and have significant adverse impacts on human health and the environment.
The top five chemical release facilities in Texas—Ascend Performance Materials-Chocolate Bayou, INEOS Nitriles USA LLC Green Lake Plant, TM Deer Park Services LP, US Ecology Texas Inc., and Lyondell Chemical Co.—are located near the Gulf of Mexico, posing significant environmental and health risks. Hazardous waste infrastructure’s primary goal is to protect public safety by preventing the release of toxic substances. However, the resilience of this infrastructure in Texas is uncertain, particularly with respect to climate change, economic shifts, and sea level rise. For instance, during Hurricane Harvey in 2017, heavy rainfall damaged several Superfund sites, including the San Jacinto River Waste Pits, which released toxic dioxins into the river. The top facilities listed above are prone to the same risks.
Electronic waste, or e-waste, represents a significant loss of resources globally. Texas can enhance resilience by expanding TCEQ and local programs to streamline permitting and recordkeeping for waste recycling facilities, set protective waste management standards, and provide tax incentives for technology development in e-waste reclamation. This would reduce the transport of waste materials to other states, conserving resources and minimizing greenhouse gas emissions. Over the next 20 years, Texas must focus on innovative strategies for recycling, reuse, waste diversion, pollution prevention, and managing new hazardous waste from emerging industries like electric vehicles and renewable energy. The Railroad Commission of Texas’s Geographic Information System (GIS) viewer shows numerous cleanup sites near coastal areas at risk from sea level rise, potentially destabilizing hazardous material plumes and causing long-term harm to nearby communities and the environment. Resilience to sea level rise is not a priority in closing hazardous material release cleanups.
Remediation technologies are improving, with the EPA, other federal entities, and the private sector emphasizing adaptive management and treatment system optimization. Some hazardous waste disposal wells have been linked to induced earthquakes, but no current methods exist to predict these events. Texas should encourage the hazardous waste disposal industry to invest in better preventative measures.
Private companies, including large battery manufacturers like BYD, CATL, LG Chem, Panasonic, and Samsung, are investing in battery recycling for electric vehicles, but not in Texas. This could be a missed economic opportunity as the electric vehicle market grows.
PHOTO: OIL DRUM FOUND IN TEXAS DESERT
RECOMMENDATIONS TO RAISE THE GRADE
• TCEQ must urgently resolve its staffing deficiencies by recruiting and developing a forward-thinking team dedicated to crafting policies and guidance that address emerging issues. Failure to do so will accelerate the deterioration of hazardous waste infrastructure.
• Immediate funding is essential for TCEQ to conduct further studies, ideally in collaboration with academic institutions. Additionally, regulations must be reevaluated to proactively address future environmental challenges.
• Given the rising costs of hazardous waste management and remediation, the private sector must continue to lead in funding improvements. Updated regulations and policies are critical to create market incentives that drive commercially sustainable solutions, leveraging current private sector investments and growth.
• TCEQ must intensify its implementation of pollution reduction strategies, including expanding the adoption of electric vehicles, decarbonizing cement production, and investing in battery storage. These measures are projected to significantly cut GHG emissions across Texas.
• TCEQ must bolster its contingency planning to mitigate the risks of hazardous material releases in climate-vulnerable coastal areas. Enhanced preparedness is crucial as climate change increasingly threatens these regions.
• TCEQ must reassess and update hazardous material cleanup regulations, focusing on enhancing the resilience of sites in coastal areas vulnerable to sea level rise.
24. Biosolids and PFAS: Maintaining Management Options is Critical to Communities and Sustainability | June 2022
25. https://www.dfwcleancities.org/evsintexas
26. TCEQ EV Reuse and Recycling Advisory Group, August 31, 2022.
27. Critical Minerals in Electric Vehicle Batteries August 29, 2022 Congressional Research Service
28. 14957.pdf (epa.gov)
29. December 20, 2023 TCEQ Email
30. A DEAD BATTERY DILEMMA With millions of electric vehicles set to hit the road, scientists are seeking better battery recycling methods 20 MAY 2021 • 12:44 PM ET • BY IAN MORSE
The State of Texas relies on a system of levees to protect communities from hurricanes, storms, and floods. Two hundred and thirty-four (234) levee systems exist within the State. This equates to 1,342 miles of protection for approximately 1.5 million Texans.
The impacts of the levee systems also extend into safeguarding 431,478 properties on approximately 208,382 acres of agricultural land, collectively valued at $248 billion; further highlighting the importance of the critical role these levee systems play in Texas’s infrastructure in mitigating the effects of “design floods” (hypothetical flood that engineers use to design structures like dams and drainage systems).
While rare, failures can occur. The system continually faces tests of increasingly frequent and intense storms. A significant challenge which still exists is the lack of a comprehensive understanding of the state’s existing levee infrastructure and the need for funding to support the owners of the levee system. Without a way to coherently direct funds to necessary entities, the levee systems within Texas will continue to operate under presumed deficiencies, making it difficult to accurately estimate necessary funding.
BACKGROUND
A levee is a man-made earthen structure designed and constructed for the primary purpose to provide protection related to seasonal high flood water, storm surges, hurricanes, significant precipitation, and other weather events. They are normally subjected to temporary high water which can last from a few hours up to weeks during a year. A levee system usually consists of one or more levees and associated structures, such as floodwalls, closures, and drainage devices. These associated structures are constructed and operated in accordance with standard engineering practices. Privately owned levees sometimes have multiple owners, which can extend for miles. In this report, both levees and levee systems will be referred to as levees
Levees have been built and used across Texas for more than 100 years by various entities, often in response to catastrophic flood events. Texas currently has no state levee program overseeing levee infrastructure safety and quality. Levees are generally designed and constructed to reduce risk by controlling water up to a specific elevation. Levee systems only reduce risk and do not eliminate it, since storm events larger than their design capacity can still occur. Lately, private developers have constructed levees to protect developments from base floods through Levee Improvements Districts (LIDs).
The Federal Emergency Management Agency’s (FEMA) National Flood Insurance Program (NFIP) plays a key role in the design capacity of levees by requiring 100-year flood level of protection (1 in 100 annual chance) to avoid high flood insurance rates. Any community seeking recognition or continued recognition of a levee system on a Flood Insurance Rate Map (FIRM) must provide FEMA with data and documentation, certified by a registered professional engineer, showing that the levee system is expected to provide 1% annual flood risk reduction (as compared to baseline). An accredited levee system is a system that FEMA has verified to meet the design, data, and documentation requirements listed within the Code of Federal Regulations (44 CFR 65.10) and can therefore be shown on a FIRM as reducing the base flood hazard.
CONDITION AND CAPACITY
Per the National Levee Database (NLD), there has been an increase in the number of levee systems over the years from 220 in 2017 to 234 in 2024 within Texas. The total miles of levee systems have also slightly increased from 1,300 in 2017 to approximately 1,342 levee miles in 2024. These levee systems protect a population of approximately 1.5 million, 431,478 properties and approximately 208,382 acres of agricultural land, valuing nearly $248 billion dollars’ worth of property protected by levees. Figure 1 identifies the location of levees from the NLD. A small percentage of levee systems in Texas are built and/or maintained, by the U.S. Army Corps of Engineers (USACE). The remaining levees are locally owned and operated through Levee Improvement Districts and other private owners.
The USACE Levee Safety Action Classification (LSAC) is one of the resources available to better inform all stakeholders. LSAC is a system developed by USACE to assess and communicate risks associated with levee systems. LSAC considers various factors including the probability of the levee being loaded (hazard), current and future maintenance of the levee (performance), and potential impacts due to failure or overtopping (consequences). The LSAC system emphasizes consequences with risk categories ranging from 1 (very high) to 5 (very low). Five levee systems, totaling about 100 miles of levees, out of the 41 levee systems screened to date are classified as high to very high risk based on consequences of failure and condition, as shown in Table 1.
FIGURE 1. National Levee Database
Note: More than 75% of Texas levee systems have not been screened for LSAC risk classification
OPERATIONS AND MAINTENANCE
Ongoing operations and maintenance are crucial for maintaining the functionality and integrity of levee systems according to their original design specifications. To ensure proper maintenance, inspection checklists are commonly utilized to record operational status and future upkeep activities. These procedures help maintain the levee's condition and address any identified issues. Natural processes, such as the consolidation and erosion of the levee, can lead to a gradual decrease in its height. Additionally, when levee slopes become waterlogged, there's a risk they may erode or collapse. Tall grass can conceal surface flaws, necessitating regular mowing and inspection. Water can also infiltrate levees via utility lines that pass through or beneath them, or through porous layers under the levee. Concrete components of the levee may show signs of wear, such as spalling, cracking, or shifting, which can create gaps.
To finance operations and maintenance, it's common to establish a special tax district that charges properties benefiting from the levee's protection. These districts are variously named—such as "Levee District," "Levee Improvement District," "Flood Control District," or "Municipal Utility District", depending on the scope of their infrastructure. Alternatively, city or county governments may assume responsibility for the levee's upkeep and maintenance. The annual budget set for these purposes generally covers routine operations and maintenance expenses but falls short of providing for major capital projects.
FUNDING AND FUTURE NEED
The Rehabilitation and Inspection Program (RIP), administered by the U.S. Army Corps of Engineers (USACE), is designed to assist with the inspection and repair of non-federal levees and other flood control structures damaged by floods or natural disasters. RIP offers repair assistance without necessitating a Federal Disaster Declaration. This law also supports the continuous maintenance of levees initially designed and built by federal efforts. Local government entities capable of conducting maintenance assessments may request a USACE inspection to establish their levee systems' eligibility for the program, with the stipulation that these levees are maintained according to the RIP's minimum standards.
Following Hurricane Katrina, the National Levee Safety Program (NLSP) was established by the USACE to introduce stricter inspection standards and promote shared responsibility in levee management. Authorized at $79 million annually, the program has historically received only about $5 million each year for its national inventory efforts, although it saw an increase to $15 million in FY20. In Texas, about 0.6% of levee systems are constructed, inspected, and maintained directly by the USACE, with another 9.5% built by the USACE but managed by public agencies, and the vast majority, approximately 89.8%, are under local governance. A critical aspect of these inspections is the development of local asset management plans to identify repair needs accurately.
Hurricane Harvey's impact in August 2017, which brought more than 60 inches of rain over Houston and Beaumont, led to significant federal funding proposals aimed at enhancing storm surge protections. One major project is in Orange County, where a nearly $2 billion levee project is being proposed to protect the area from hurricane storm surges. The state of Texas is being asked to fund the non-federal portion of this project, amounting to $800 million. However, the project's completion could take several years, with discussions ongoing about its design and funding.
Additionally, the Colorado River Levee Project Phase 1 in Wharton, Texas, has kicked off, with a focus on addressing significant flooding issues in the area. This project, celebrated with a groundbreaking ceremony in November 2023, includes constructing levees, floodwalls, a storm drainage relief system, and other flood risk reduction measures. The project aims to mitigate the flooding risks associated with the city's proximity to the Colorado River and other water bodies, considering Wharton's location within a high flood-risk area. Dallas has also seen investment in its floodway projects, including the new Cadillac Heights Levee, with more than $450 million in funding.
PUBLIC SAFETY, RESILIENCE, AND INNOVATION
Levees play a critical role in protecting Texas communities from dangerous flooding. Approximately 209 acres of land, over 1.5 million residents, and more than $248 billion in property value are protected from flooding by Texas levees. The areas protected by the levees contain various economic assets such as homes, businesses, schools, and event centers, as well as major downtown areas.
The owner/operators of each levee system should have a levee safety program which includes an Emergency Action Plan (EAP) for breaches and instabilities. Not all owners/operators have a plan in place or funding to implement such an EAP. In such cases where there is an absence in a qualified safety program, it is recommended for the NLSP to support the development of an EAP for safety and welfare of the public. Areas such as the Dallas Floodway levee system have an EAP which includes evacuation and repair.
Levee systems in Texas are annually assessed and have performed admirably, with rare occasions of failures. Numerous levees in southeast Texas were tested beyond their design capacity in 2017 during Hurricane Harvey, resulting in several levee failures including the Port Arthur levee system and the Columbia Lakes Levee in Brazoria County. Due to the large volume of floodwater conveyed by a levee, when a levee breaches the sudden release of water can quickly inundate the protected area by several feet of water, with little time for residents to evacuate. Heavy rainfall can overwhelm pumping stations that pump stormwater runoff from protected areas into the river, resulting in flooding of protected areas even when the levees do not breach.
PHOTO: FLOODED LEVEE IN EAST TEXAS
LE VEES
RECOMMENDATIONS TO RAISE THE GRADE
• Urge Congress to fully fund the National Levee Safety Program and urge the Texas State Legislature to establish a state Levee Safety Program within and monitored by TCEQ, modeled after the Dam Safety Program, to identify and track the status of Texas’ levee systems.
• Lead efforts to develop partnership with levee system owners and provide more funding to the USACE for LSAC screening of more levee systems to identify problems earlier.
• TCEQ should raise awareness of its workshops as part of its Levee Safety Program for owners to have training on the best practices for levee operations and inspections.
• Educate the public living in areas protected by levees about their residual risk through public outreach to help them understand which levee protects them, how they protect their property, and who operates and maintains it.
• Urge the public to get more involved with plans focused on identifying potential problems with levees in their areas.
• Provide information to the public and raise awareness of impacts during an emergency and who all may be affected
• Public domain inclusive of helpful links to inform people with information (nearest levee owner(s) contacts, step-by-step instructions of what to do, etc.).
• Signs near levee access points with QR Codes provided by the levee system owners.
• Town Hall meetings with levee system owners as guests to present relevant information to the public.
• TCEQ should require Emergency Action Plans for all High- and Very High-risk levees in Texas.
LE VEES
Sources
• Texas A&M University System; Rebuild Texas Commission; Eye f the Storm, Report of the Governor’s Commission to Rebuild Texas; 2018 November; https://www.rebuildtexas.today/ legislative-report-on-hurricane-harvey/.
• Levees and National Flood Insurance Program Summary; https://www.fema.gov/floodinsurance.
• U.S. Army Corps of Engineers (USACE); National Levee Database (2006-Present); https:// levees.sec.usace.army.mil/.
• ASCE Inter-Institute Levee Committee; So, You Live Behind a Levee! What You Should Know to Protect Your Home and Loved Ones from Floods; 2009; https://ascelibrary.org/doi/ book/10.1061/9780784410837.
• Texas General Land Office; State of Texas CDBG Mitigation (CDBG-MIT) Action Plan: Building Stronger for a Resilient Future; 2021 September 1; https://www.recovery.texas. gov/files/resources/mitigation/cdbg-mit-summary.pdf
PORTS
EXECUTIVE SUMMARY
Texas ports handle more than 600 million tons of cargo annually and are the nation’s top exporter by tonnage. Ports in Texas are essential to the State and generate $450 billion in total economic value, according to the Texas Ports Association (TPA). As waterborne tonnage continues to expand due to economic activity, several factors are impacting port operations.
These factors include increased ship sizes and traffic through ship channels, resilience in the face of more frequent storm events, increased demand for cybersecurity, and rising construction and equipment costs. The overall condition of Texas ports is good, but significant improvements and expansions are required to mitigate the factors affecting operations. Texas’ population has increased by 19% since 2010, roughly 5 million people (U.S. Census Bureau), and Texas ports will require increased funding to maintain this growth and economic prosperity for the State.
CAPACITY
Texas seaports include 20 port authorities that range in size, with three ranked in the top five by tonnage in the U.S., according to the TPA. These port authorities include Port Houston, Port of Beaumont, and Port of Corpus Christi. Texas Ports handle various operations, including cruise ships, containers, bulk cargo, commercial fishing, military, oil, and gas. Texas ports will need to expand to keep pace with the cargo throughput required to support a 1.5% on average population growth in the State with a 2.9% future yearly population growth. Additionally, future population growth within the State will increase the demand for imported goods, which in turn will increase the demand for expanded capacity at ports.
Increased funding for port infrastructure and ship channel expansion is required to maintain growth and stability for the Texas economy. If Texas ports do not expand capacity, the State risks lost revenues and commercial opportunities. Dwindling shoreline acreage places a strain on capacity needs, such as terminal transportation links from wharves to roads and channel expansion for larger ships. While Texas ports are meeting current capacity demands, increased funding for ports will help them prepare for future population growth and associated needs within the State.
FIGURE 1. Map of Texas Ports
CONDITION
Texas ports require routine maintenance and rehabilitation to continue operations due to a variety of reasons. As ports continue to grow with the population in Texas over time, this expansion will deteriorate the port infrastructure. Ports operate in corrosive environments, and Texas ports struggle to keep up with maintenance due to limited funding. Some 25% or more of the marine assets at Texas ports require rehabilitation. Ports have established asset management programs to develop routine maintenance plans. For example, Port Houston established an asset management program to evaluate, monitor, and prioritize repairs. However, as cargo demand increases, it is difficult to keep pace with the amount of maintenance required. If routine maintenance is not addressed, ports will experience increased downtime and loss of efficiency and economic opportunities.
OPERATIONS AND MAINTENANCE
Port operations oversee vessel operations, cargo handling, terminal operations, and logistics to ensure port activities are safe and efficient. The ability of Texas ports to meet operational demands can be hindered by entry/exit gate capacity, insufficient cargo handling equipment, berth and/or storage capacity, poor navigation channels, and inadequate intermodal connectivity. Most Texas ports are meeting current operational demands; however, future upgrades to increase capacity will be required to ensure continued efficiency. Most ports in Texas already face limitations and are unable to keep up with existing demand.
Asset management programs are beneficial for identifying and maintaining the condition of infrastructure, equipment, and resources essential for port operations. Routine maintenance at port facilities is critical because marine assets are subject to corrosion, erosion, sedimentation, and other factors that present challenges. Specialized construction can lead to high repair costs, and implementing regular maintenance schedules can help maximize the lifespan of assets, reduce downtime, and ensure regulatory compliance. While some Texas ports have established asset management programs, others are either in the process of development or have yet to implement such programs.
FUNDING
Texas ports typically fund improvement projects at their facilities and partner with the federal government on ship channel projects. Due to funding delays and project backlogs, there is an increasing need for ports to consider public-private partnerships as alternative funding sources. Over the past decade, more than 98% of investments in Texas ports and navigation districts have been supported by private funding sources, contrasting with only 2% that have been supported by public funds at local, state, and federal levels.
Annually, a portion of U.S. Army Corps of Engineers (USACE) appropriations is dedicated to maintenance dredging for federal channels in Texas. Texas ports and navigation districts are responsible for providing a match and funding the dredging of non-federal components to maintain proper depth at connector channels and port facilities. Texas ports report spending more than $48 million per year on channel operations and maintenance costs and plan to invest up to $955 million in channel dredging and maintenance over the next two years.
FUTURE NEED
The main challenge for Texas ports is securing additional funding for capital improvement projects to meet the projected growth in maritime trade. The 2024-2025 Texas Port Mission Plan developed by the Port Authority Advisory Committee (PAAC) highlights the funding needs of Texas ports. Planned investments total $9.67 billion, including $1.67 billion in port capital investment projects for facility improvements, $3.66 billion for federally authorized ship channel projects to deepen and widen waterways, and $4.34 billion for inland connectivity projects.
PUBLIC SAFETY
Safety is paramount to port operations. Many ports have emergency response plans outlining procedures for handling various types of incidents, such as fires, chemical spills, natural disasters, and security threats. In recent years, cybersecurity along shipping channels has become a large focus to secure data networks and terminal operation systems.
Ports have enacted security measures to prevent unauthorized access, protect critical infrastructure, and mitigate the risk of criminal activities. These measures include surveillance systems, access control mechanisms, perimeter fencing, and security patrols.
Ports collaborate with relevant stakeholders, including government agencies, law enforcement officers, emergency responders, shipping companies, and local communities to coordinate efforts and share information related to public safety and security. Additional funding will be required to assist Texas ports with increased security.
INNOVATION
Texas ports work to streamline operations, reducing turnaround times for vessels, improving cargo handling processes, and optimizing infrastructure and resources. They do this using technology to improve the operations, monitoring, and management of port activities. Many Texas ports include environmental considerations within their strategic plans, aiming to reduce carbon emissions, minimize waste generation, and mitigate the impact of port activities on local ecosystems and communities. Limited federal grant programs have supported ports’ efforts to innovate and reduce carbon emissions; however, additional funding will be required. Increased throughput of cargo will increase the amount of carbon released and require ports to enhance their use of technology to keep pace with this challenge.
RESILIENCY
Ports, like any type of infrastructure, require the capability of preventing or protecting facilities from significant multi-hazard events and the ability to expeditiously recover. They do this by planning for events, implementing recommended actions to prevent or reduce damaging effects, responding with plans and emergency information to decision makers and citizens, and coordinating recovery efforts to return to normal operations
To address infrastructure resiliency ports, collaborate with all government levels and promote effective public and private sector partnerships. Most Texas ports have some type of contingency plans, some more developed than others. Continued support for infrastructure that can withstand increased storm activity and rebound from these events will be key to accommodating the increased demand that Texas ports will face in the future.
PHOTO: SHIP DOCKED AT CALHOUN PORT AUTHORITY; TXDOT
RECOMMENDATIONS TO RAISE THE GRADE
• Increase funding for port infrastructure and ship channel expansion to maintain stability and foster growth for the Texas economy.
• Urge Congress to fully appropriate the revenues generated each year by the Harbor Maintenance Trust Fund.
• Encourage state and federal governments to provide grant programs to support innovation and reduce carbon emissions.
• Increase collaboration between ports and government agencies at all levels and promote effective public-private partnerships.
• Establish asset management programs to identify and maintain the condition of infrastructure, equipment, and resources essential for port operations.
Sources
• Port of Beaumont, Interview. 29 June 2024.
• Port of Calhoun, Interview. 22 May 2024.
• Port of Corpus Christi, Interview. 09 May 2024.
• Port Freeport, Interview. 27 June 2024.
• Port of Harlingen, Interview. 09 May 2024.
• Port of Isabel, Interview. 27 June 2024.
• Port of Victoria, Interview. 27 June 2024.
• Port of Houston, Interview. 13 March 2024
• Texas ASCE Ports Questionaire
• Texas Department of Transportation (2024). Port Authority Advisory Committee (PAAC) 2024-2025 Texas Port Mission Plan; 88th Legislative Session
PUBLIC PARKS AND RECREATION
EXECUTIVE SUMMARY
Texas contains some of the most diverse public lands in the country, including 14 national parks, 88 state parks, numerous county & local parks covering more than 70 million acres that showcase natural treasures, numerous county and city parks, and many public community green spaces. The Texas State Park System’s funding includes multiple allocations and appropriations passed by the Texas Legislature. The Texas Parks and Wildlife Department (TPWD) is the state agency whose mission is to manage and conserve the natural and cultural resources of Texas and to provide hunting, fishing, and outdoor recreation opportunities for the use and enjoyment of present and future generations.
The TPWD Fiscal Year (FY) 2025 budget is $534.1 million. These funds are required to operate, maintain, and protect state parks. Historically funding has fallen short due to diversions. Texans, however, passed Proposition 5 in 2019, which created a dedicated method of funding support for Texas state parks and historic sites through annual sporting goods sales tax. Because of the timing of the Prop 5 election in 2019 and the biennial legislative sessions in Texas, TPWD did not realize the full effect of the sporting goods sales tax funding until FY22. Additionally, in 2021 Texas voters passed Proposition 2, which authorized the use of county infrastructure bonds to improve blighted areas for county and local parks. Recently, residents in a number of municipalities, cities, and counties in Texas have voted to increase bond funding for park infrastructure, including an estimated $1.8 billion for park and recreation funding in 2023. Both propositions and an increase in local bond programs show how passionate Texans are about the importance of parks. Additionally, both these propositions contributed to improving many urban parks and green spaces
throughout the state. Parks and green spaces energize communities and serve as retreat venues, creating memories and enjoyment of the outdoors. State parks serve as emergency shelters during crisis events, such as hurricanes and floods. Parks also preserve scenic natural treasures and conserve wildlife and their habitats, while allowing the public to enjoy recreational resources. With over 95% of Texas land privately owned, counties and cities depend upon donations to acquire properties and designate it for public use.
CONDITION AND CAPACITY
Texas parks, nature, and historical sites with more than 70 million acres across the state are preserved and operated by U.S. National Park Service (NPS), Texas Parks & Wildlife Department (TPWD), and Texas Historic Commission (THC) which include:
• 14 National Parks with 5,569,993 visitors annually
• 20 National Natural Landmark
• 2 National Trails
• 89 State Parks with more than 9.2 million visitors in 2023.
• 38 State Historic Sites
• 76 Safety Rest Area operated by TxDOT
• 166 Community Conservation & Recreation Projects
The Texas Heritage Trails Program (THTP) supports THC’s mission to protect and preserve the state's historic and prehistoric resources. THC is divided into 10 regions and works to encourage communities to explore Texas’ historic and cultural treasures. Various counties can be part of more than one heritage region.
• Brazos Trail Region: 18 total counties
• Forest Trail Region: 35 total counties
• Forts Trail Region: 29 total counties
• Hill Country Trail Region: 19 total counties
• Independence Trail Region: 28 total counties
• Lakes Trail Region: 31 total counties
• Mountain Trail Region: 6 total counties
• Pecos Trail Region: 22 total counties
• Plains Trail Region: 52 total counties
• Tropical Trails Region: 20 total counties
The increase in Texas population led to a decrease in rural areas. Over 95% of land in the State is privately owned and less than 2% of the land is protected, including state and local parks. Non-profit organizations like Trust for Public Land (TPL) work with communities to ensure the creation, protection, and stewardship of public parks. Since 1972, TPL has worked on about 175 projects, protected about 43,633 acres of land to connect about 235,716 people to the outdoors.
FUNDING
The funding for state parks, amounting to about $148 million, represents approximately 27.7% of the total TPWD budget of $534.1 million for FY 2025. This funding includes various allocations and appropriations approved by the Texas Legislature.
The TPWD FY2025 budget consists of funding sources that include general revenue funds, special funds, bonds, federal funds, foundations, and grants.
The General Revenue Fund, or Fund 1; funding consists of allocations of sporting goods sales tax; used to fund state and local park-related needs.
Special Fund 9 (Game, Fish and Water Safety) and Fund 64 (State Parks) are the largest contributors; most of Fund 9 allocation is due to the revenue of license, permits, fees, and leases.
The Federal Funds budget consists of grants and appropriations, with the remaining budgets include other organizations and foundations. Many of these allocation sources are anticipated values that may not be fully allocated since the funds are based on user fees and taxes. Budget shortfalls are common, and the Texas State Park System continues experiencing increased attendance and aging facilities increases costs for operation, maintenance, and improvement.
With growing populations, many Texas municipalities and counties are experiencing increased park demand to serve the public. Increased costs and budget shortfalls persist. Certain municipalities and counties have successfully passed bond programs to fund park expansions and improvement projects. These programs assist to expand and improve parks but do not contribute to their operations and maintenance budgets, which come from multiple other sources such as general budgets, user fees, grants, and state and federal assistance. Even with the benefits from these programs, many municipalities and counties are seeing difficulties in funding operations and maintenance costs as demand increases and tax revenues are allocated elsewhere.
In 2023, the Texas House passed two bills, Senate Bill 1648 and Senate Joint Resolution 74, which, after receiving voter approval for Proposition 14, established a Centennial Parks Conservation Fund. This fund is dedicated to investing $1 billion in acquiring additional land for the state parks system. The land for state parks exists. Now, it is a matter of ensuring there are funds to plan, design, maintain, and operate these future state parks.
FIGURE 1. TPWD FY2025 Budget by Division - $534.1MM
FIGURE 2. TPWD FY2025 Budget by Funding Source
FUTURE NEED
In 2023, the Texas state parks system celebrated its 100th anniversary. Greater need still exists to offer Texas residents well-planned parks and green spaces designed and constructed with sustainable infrastructure to provide meaningful outdoor experiences.
As evidenced during the COVID-19 pandemic in 2020, parks and greenspaces (an area of grass, trees, or other vegetation set apart for recreational or aesthetic purposes in an otherwise urban environment) were a safe-haven for many Texans. Parks and greenspaces ought to be considered in the echelons of critical infrastructure. Without dedicated greenspaces, many Texans might not have a much-needed environment to maintain their well-being.
Texas will add at least six new state parks over the next 15 years which are planned across Texas, from Big Bend to the Hill Country and Texas coast.
• Devils River State Natural Area
• Palo Pinto Mountains State Park
• Albert and Bessie Kronkosky State Natural Area
• Powderhorn State Park
• Chinati Mountains State Natural Area
• Davis Hill State Natural Area
The need remains to have dedicated funding sources to maintain and operate existing and new state parks.
OPERATIONS AND MAINTENANCE
Texas municipalities continue to revise and improve strategic plans for their parks and recreation departments to maintain their infrastructure. Since the 2021 Texas Infrastructure Report Card, many municipalities have been able to implement volunteer programs and initiatives to help fund and maintain park infrastructure. The initiatives have saved park departments throughout the state time, resources, as well as reduced expenditures for local governments while providing a sense of unity and ownership as residents clean, operate and repair within their ability and capacity. The TPWD strategic plans are being updated and community involvement in the operation and longevity of parks has proven to be effective. However, there remains noticeable gaps in the number of rehabilitation projects that are proposed but remain unfunded. Pressing unmet maintenance needs includes collaboration in the form of sharing equipment and staff expertise between TPWD and THC.
PUBLIC SAFETY
Since 1971, a special group of law enforcement officers has been responsible for the safety, security and protection of state parks and those who visit them. The State Park Police protect the state’s natural and cultural resources.
Access to parks and outdoor recreation improves quality of life for all Texans. More time spent in parks and green spaces can help individuals combat mental health issues such as depression, anxiety, and stress. In contrast, urban areas without parks and vegetation can negatively impact communities by increasing air pollution levels and urban-heat effect related illnesses and mortality. The 2018 Texas Outdoor Recreation Plan calls for more trails and greenways to encourage active lifestyles, new parks in or near urban areas, better access to public waters, and a review of local park grant rules to make the most of limited dollars, among other recommendations.
Texas State and National Parks protect much of the clean water on which the public relies. As Texas’ population continues to grow at an accelerated rate, investment in nature-based infrastructure and conservation of parkland can help conserve and protect drinking water for our communities, economies, and environment.
RESILIENCE AND INNOVATION
Parks and open spaces are crucial in addressing the pressing climate and biodiversity crisis. They provide outdoor activities that boost positive energy, reduce mental fatigue, and support local economies through resilient programs like clean air and wildlife habitats.
Open Spaces regulate climate by storing carbon dioxide. By conserving trees and wetlands and developing resilient solutions, we can assist in stabilizing the climate. These efforts can help address a variety of climate change impacts, including:
• Sea level rise
• Heat waves
• Storm surges
• Droughts
Climate changes affect the built environment in ways that severely affect our cities' health, viability, and economic vitality.
Through the Infrastructure Investment and Jobs Act (IIJA) and the Inflation Reduction Act (IRA), the Department of the Interior will partner with local and state agencies to assist in developing drought-resilient basins and coordinate with partner agencies in restoration projects such as flood plains and riparian habitats.
Promoting people-centered solutions involves incorporating resilience considerations into landscape conservation designs and leveraging capacity-building programs. By choosing Texas native plants that provide food and shelter for birds, butterflies, and other native wildlife, we can add colorful additions to our landscapes that require less water than non-native plants. Protecting and restoring coastal wetlands and parks innovatively through nature-based solutions can improve coastal and estuarine habitats, increase resilience against hazards such as storm surges and sea level rise, and protect crucial natural carbon storage opportunities.
Developing ecosystem programs to enhance climate change adaptation for parks' natural and cultural resources is not just important; it's crucial. This approach is critical for resilience and informed decision-making. Fostering partnerships with stakeholders and communities further supports park sustainability, climate resilience, and environmental justice efforts.
PHOTO: PALO DURO CANYON STATE PARK; TEXAS PARKS AND WILDLIFE DEPARTMENT
RECOMMENDATIONS TO RAISE THE GRADE
• Collaborative Partnerships. Identify other state programs and partners with similar missions and goals to increase exposure for potential fund grant award opportunities.
• Corporate Sponsorships. Offer corporate partners an opportunity to support the communities by sponsoring park programs (e.g. nature learning focused on flora and fauna), park events (e.g. health expos, fun-runs, etc.), or infrastructure (e.g. trails, building structures, ponds, etc.)
• Resilience and Innovation. Focus on nature-based infrastructure will raise the grade by enhancing the Texas environment by supporting minimization of flooding, replenishment of aquifers, reduction of the urban heat effect, capture of carbon dioxide, reduction of the risk of toxic algae blooms in lakes and rivers, increased aesthetics, and improved water quality throughout Texas.
• https://www.txdot.gov/discover/rest-areas-travel-information-centers/safety-rest-area-list. html
• https://www.tpl.org/
RAIL
EXECUTIVE SUMMARY
This Rail report covers Freight (Class 1), Short Haul lines, and Commuter High-Speed Rail (HSR) for passenger service. Freight rail in Texas plays a critical role in the State's economy, given its size and position as a central transportation hub for the United States. Texas has the largest rail network in the country, with more than 10,400 miles of track and a substantial number of Class I railroads, short lines, and regional rail operators. Both freight and passenger rail receive a mix of private and public funding that ensures rail continues to be a key part of the transportation network in Texas.
Freight Rail: The State's freight rail system handles a wide variety of commodities, including oil, gas, agricultural products, chemicals, and consumer goods. Funded predominantly by private investment from railroad companies like Union Pacific Railroad (UP) and BNSF Railway (BNSF), with occasional public support for projects that benefit the broader economy or public infrastructure (such as ports, grade crossing improvements, or border crossings). Freight is in better condition generally than Passenger Rail.
Passenger Rail: Current passenger rail services operate (through agreements) on existing Freight Class I rail networks and HSR is not currently available in Texas. Passenger rail is funded through a combination of federal and state subsidies, particularly for Amtrak, with opportunities for private investment in special projects like HSR. Public funding also supports safety improvements and new rail corridors.
CONDITION AND CAPACITY
Passenger rail in Texas is provided by National Railroad Passenger Corporation, also known as Amtrak, operating three routes in Texas— The Heartland Flyer, The Sunset Limited, and The Texas Eagle, which make up 1,539 miles of track in Texas. Connecting these miles of track are 19 active stations, with the Fort Worth Intermodal Transportation Center serving the greatest number of passengers at more than 114,000 in FY 2017.
Texas also boasts one of the most extensive freight rail networks in the U.S., largely because of its key geographic location near Mexico, major ports, and large metropolitan areas. As of 2020, Texas was the U.S. state with the largest railroad mileage, reaching more than 10,400 miles. It represented around 7.6 percent of the total mileage for the United States. The State's rail system connects to major ports like Port Houston and Port of Corpus Christi, which are vital for exports. Class I railroad companies, like BNSF and UP, dominate the freight landscape in Texas. These private companies invest heavily in Class I infrastructure to support the high volumes of traffic moving through the State.
Rail transported 486 million tons worth $850 billion in Texas in 2019 and is projected to grow to more than one billion tons by 2050. Major commodities transported by rail include chemicals and allied products, nonmetallic minerals, coal, miscellaneous mixed shipments, and farm products. The most rapidly growing commodity groups as a percentage of 2019 tons include shipping containers, apparel or related products, textile mill products, chemicals or allied products and food or kindred products. Coal, the third highest commodity by tonnage in 2019, is forecast to decrease by 87% by 2050, in part due to the availability of other electricity generating fuels such as natural gas, solar and wind.
UP plays a vital role in several Texas industries and invests significant private capital in improving safety, efficiency, and growth opportunities. From 2019-2023, UP invested more than $3.6 billion to improve existing infrastructure and complete projects designed to keep Texas industries thriving. UP alone spends more than $700 million in payroll in Texas and employs more than 5,000 in Texas and purchased $2.4B worth of goods in Texas in 2023.
This robust freight rail system transports three major categories of goods:
1. Energy Products: Texas is a hub for oil, gas, and petrochemical industries. Freight rail moves a significant amount of crude oil, refined petroleum products, and liquefied natural gas.
2. Agriculture: Texas produces large volumes of agricultural goods, including cotton, grains, and livestock, which are transported via rail to various markets.
3. Automotive and Consumer Goods: The State's industrial growth includes manufacturing (especially in the automotive sector), which relies on freight rail to transport materials and finished products
Texas is a key player in U.S.-Mexico trade, with railroads handling a substantial portion of cross-border goods. The value of U.S.-Mexico trade moved by rail increased 41.9 percent (from $64.4 billion in 2012 to $91.4 billion in 2022). The Laredo and El Paso border crossings are particularly important for rail freight, moving goods like automobiles, electronics, and raw materials discussed above. The U.S.Mexico-Canada Agreement (USMCA) has further strengthened trade relationships, increasing rail traffic between Texas and Mexico.
Rail is more environmentally efficient than trucking for long-distance freight, as it reduces highway congestion and emissions. The Texas freight rail industry supports thousands of jobs and contributes billions to the State’s economy. According to the Association of American Railroads (AAR), freight rail is three to four times more fuel efficient than moving freight on the highway based on the CSX system-wide train efficiency of 506 ton-miles per gallon while trucks have an efficiency of 134 ton-miles per gallon.
Challenges:
i. Congestion: With Texas being such a vital hub, rail congestion in key corridors, especially in urban centers like Houston and Dallas, can be a problem. Investments are needed to alleviate bottlenecks.
ii. (ii) Safety: Accidents at rail crossings and derailments pose ongoing safety concerns, although railroads continually invest in infrastructure improvements and safety protocols.
iii. (iii) Competition with Trucking: Though rail can move large quantities of goods efficiently, competition from trucking—especially for shorter hauls, remains strong.
Investments and Future trends:
Rail companies are investing in technology to improve efficiency, including better signaling systems, advanced data analytics, and automation to increase capacity and reduce operational costs. There is also an increasing emphasis on intermodal ‘near-shoring’ transportation, where freight is transferred between different modes (like truck to rail) to improve overall supply chain efficiency. Texas is home to many major logistics centers to enhance connectivity between rail, marine, and truck traffic such as the Texas Logistics Center at the Port of Victoria. Growth in major logistics centers in Texas is strong with expanding facilities such as the International Inland Port of Dallas providing direct access to three interstate highways and UP’s rail network through the UP Dallas Intermodal Terminal opened in 2005.
In summary, Texas's freight rail system is a vital part of the State's infrastructure, supporting its economy and connecting it to national and international markets. However, it faces challenges like congestion and the need for continual investment to maintain efficiency and safety.
Rail funding in Texas is a mix of private and public sources, depending on the type of rail service. Freight rail and passenger rail have different funding models, as freight rail is largely privately funded while passenger rail often relies on government subsidies and investments. Freight Rail Funding:
Investments are made from multiple sources.
1. Private Investment: Freight rail is almost entirely privately funded. Major Class I railroads like BNSF and UP, as well as smaller regional and short line railroads, invest in their own infrastructure, including track maintenance, upgrades, rolling stock, and safety improvements. In Texas, these companies maintain and operate more than 10,000 miles of track, and they are responsible for routine investment in this infrastructure.
2. Capital Expenditures (CapEx): Railroad companies invest billions annually into their networks to improve safety, expand capacity, and modernize their systems. These investments come from the companies' revenues. For example, in 2022, U.S. Class I railroads invested more than $23 billion in infrastructure, locomotives, rail cars, and technology as reported by the AAR.
3. Public-Private Partnerships (P3s): Occasionally, public funds are used to support freight rail projects, particularly if they have a broad public benefit. These partnerships allow railroads to tap into government funding for infrastructure projects, especially in key corridors or near ports and border crossings. For example, the State of Texas has supported projects that enhance freight movement, like improvements at the Laredo border crossing
Passenger Rail Funding: Passenger rail in Texas, such as Amtrak, and current planning efforts for high-speed rail projects, rely heavily on public funding sources since it is not typically profitable. Funding comes from federal, state, and sometimes local governments.
1. Federal Funding
a. Amtrak: The federal government provides substantial funding for Amtrak, the national passenger rail operator. Amtrak receives grants from Congress each year to cover operating losses and capital expenditures. In Texas, Amtrak operates several routes (such as the Texas Eagle), which are partially supported by federal subsidies. Amtrak operates its services on Class I Freight owned rail lines.
b. Infrastructure Investment and Jobs Act (IIJA): This recent infrastructure law allocates significant federal funding for rail projects, particularly aimed at improving passenger rail service, expanding routes, and upgrading rail infrastructure. The Federal Railroad Administration (FRA) provided funding for passenger rail improvements under IIJA through the Corridor Identification and Development (Corridor ID) Program in FY22, including for advanced planning of the Houston to San Antonio Corridor and the Texas Triangle: Dallas-Fort Worth-Houston Intercity Passenger Rail Corridor. Funding was also provided for planning improvements, including for the Heartland Flyer Extension and service enhancements to Amtrak’s Daily Sunset Limited.
2. State and Local Funding: States can provide additional funding for passenger rail services. In Texas, however, state support for passenger rail is very limited compared to other states with more developed networks. Local transit agencies and municipalities may also contribute to rail funding, particularly for urban commuter rail systems.
3. HSR Projects: Texas has seen proposals for high-speed rail, most notably the Texas Central Railway. This project is designed to be funded largely by private investors, though it has faced hurdles in securing full financing and regulatory approvals. Public funding could potentially play a role in such projects, either through grants, loans, or tax incentives, particularly if the project is seen to have public benefits, such as reducing highway congestion or emissions. The FRA provided funding for further study of the Texas HighSpeed Rail Corridor and for the Fort Worth to Houston High-Speed Rail Corridor in FY22 under the Corridor ID Program.
Federal Loan Programs have also been used to provide additional funding avenues for rail infrastructure through the Railroad Rehabilitation and Improvement Financing (RRIF) program, which offers low-interest loans and loan guarantees to railroads for infrastructure development. Both freight and passenger rail operators can tap into these funds for upgrades, safety improvements, and new construction. Transportation Infrastructure Finance and Innovation Act (TIFIA) provides loans for transportation projects, including rail, which promote public-private partnerships and infrastructure development.
The federal government also provides grants through various programs to improve rail infrastructure, safety, and efficiency. The Consolidated Rail Infrastructure and Safety Improvements (CRISI) program offers grants to improve freight and passenger rail infrastructure and enhance rail safety. Texas has applied for and received some limited funding through CRISI for several rail projects. The Federal-State Partnership for Intercity Passenger Rail grant program focuses on improving intercity passenger rail, which could apply to Amtrak routes and potential new services in Texas.
HOW IS HIGH-SPEED RAIL PROGRESSING?
The development of HSR in Texas has been a significant focus, particularly with the proposed Texas Central Railroad (TCRR) project. TCRR is designed to connect Dallas and Houston via a high-speed rail line using N700 Shinkansen technology from Japan, like Japan’s bullet trains. The route would span approximately 240 miles, with a travel time of around 90 minutes, significantly reducing travel time compared to driving or flying. The status is as follows:
i. Land Acquisition: TCRR made progress in securing land for the route, but the process has been slow and met with legal and regulatory challenges. Much of the land lies in rural areas, and some landowners have resisted the project, leading to legal battles over eminent domain.
ii. Regulatory Approvals: The project has received several key regulatory approvals, including from the FRA, which issued the required safety rules and environmental approvals. However, it still faces additional hurdles before construction can begin.
iii. Funding Challenges: One of the biggest obstacles to the project has been securing full financing. TCRR originally aimed to fund the project through private investment, but financing has been slow to materialize, and there have been setbacks in securing investment. The COVID-19 pandemic caused delays, exacerbating financial difficulties. Amtrak is now working with Texas Central Partners to advance planning and analysis work associated with the proposed Dallas-Houston 205-mph HSR project to further determine its viability. Under the leadership of Amtrak, the project received a $63.9 million dollar grant through the Corridor ID program in August of 2024.
iv. Leadership Transitions: In 2022, TCRR faced uncertainty after reports of leadership changes and layoffs, leading to concerns about the project's future. However, with the recent support of Amtrak, the company is still actively pursuing the project and addressing funding and legal challenges, with continuing support from Japan Central Railways and other investors and developers.
The key Challenges and Controversies are as follows:
i. Eminent Domain: The project has faced stiff resistance from some property owners along the proposed route. One of the key legal battles involved whether TCRR had the authority to use eminent domain to acquire land for the rail line. In 2022, the Texas Supreme Court ruled that TCRR does have the authority to use eminent domain, giving the project a major legal victory. However, this has not resolved all land acquisition issues.
ii. Environmental Concerns: The FRA released the Final EIS on May 29, 2020, providing the required environmental clearance and released a final rule that establishes safety standards for the TCRR HSR system on September 10, 2020. However, some opponents argue that it will disrupt rural areas and ecosystems along the route and the FRA is currently working with Amtrak and TCRR to determine any further reviews that may be required given the time that has lapsed since 2020.
The Benefits include:
i. Economic Impact: Proponents of the Dallas-Houston HSR project emphasize the economic benefits the project could bring, including job creation during construction, long-term employment opportunities, and increased economic connectivity between Dallas and Houston. The project is expected to generate thousands of construction jobs and permanent positions for operations.
ii. Transportation Benefits: The HSR project would offer a reliable, fast alternative to both driving and flying. Currently, the I-45 corridor between Dallas and Houston is one of the busiest in the State, with significant congestion and long travel times. HSR could help alleviate some of this pressure.
iii. Environmental Benefits: If successful, the project could reduce road and air traffic between Dallas and Houston, leading to lower emissions and a smaller environmental footprint compared to cars and planes.
The Outlook:
• Timeline Uncertainty: Despite progress, the timeline for the TCRR project remains uncertain due to the ongoing challenges with financing, legal battles, and leadership changes. While the company initially aimed to begin construction in the early 2020s, delays mean that construction has yet to start, and there is no clear timeline for when it will.
• Potential Funding Sources: TCRR is now working with Amtrak and seeking federal and private funding through investors. TCRR project development to date has relied on partnerships with local investors and international companies and governments, particularly in Japan, where the Shinkansen technology first began providing service in 1964. Given the scale of the project and Amtrak’s involvement, the project is now pursuing more U.S. federal support in the form of grants or loans to make the project viable.
• Competition with Other Modes of Transport: HSR would be a major disruptor in the transportation sector in Texas, but it faces
competition from air travel, intercity buses, and private vehicles. The success of the project will depend on its ability to mitigate impacts and attract sufficient ridership by offering a faster, more convenient option compared to these alternatives
Other High-Speed Rail Initiatives: Studies have advanced about expanding high-speed rail beyond the Dallas-Houston corridor, such as potential routes connecting to Dallas to Fort Worth along I-30 and Forth Worth to Laredo along I-35 serving Austin and San Antonio through studies being advanced by both Texas Department of Transportation (TxDOT) and the North Central Texas Council of Governments (NCTCOG). These HSR project studies are continuing to move forward with the support of new federal funding under the Corridor ID program. However, these studies are still in the early stages. The Dallas-Houston HSR line is the most advanced and likely offers the best opportunity for HSR implementation with the FRA completed EIS and Rule of Particular Applicability (RPA) approval for the Shinkansen technology and the completed U.S. Army Corp of Engineer Section 404 and Section 408 reviews.
In conclusion, the TCRR HSR project has made progress but faces significant challenges. Legal victories, like the eminent domain ruling, have kept the project alive, but funding and public opposition issues remain significant obstacles. If the project moves forward, it could revolutionize transportation in Texas by connecting two of its largest cities with a fast, efficient, and environmentally friendly rail service. However, the future timeline remains uncertain, and more concrete steps, particularly in terms of financing and land acquisition, are still required.
PUBLIC SAFETY
Safety issues in Texas freight rail and short-haul routes are a concern, as the state has one of the most extensive and heavily used rail networks in the country. Given the volume of freight traffic, including hazardous materials like oil, chemicals, and other industrial products, maintaining safety is critical. Texas has one of the higher rates of train-related accidents and fatalities at crossings in the United States. The State consistently ranks first in the number of such incidents. In 2023, there were 246 accidents at rail crossings in Texas, resulting in 76 injuries and 16 deaths (other States had less incidents but higher death counts). Some of the deadliest crossings are found in densely populated areas where vehicle traffic intersects with freight lines, leading to frequent collisions.
One key issue is that many crossings in Texas are not equipped with modern safety features like gates or lights. Federal programs such as Section 130, which provides funds for improving rail crossing safety, have helped address some of these problems, but more crossings still need upgrades to reduce accidents. The Infrastructure Investment and Jobs Act (IIJA) aims to bolster these efforts with additional funding for separating or upgrading crossings, which could alleviate some of the dangers.
While Texas has a well-developed rail system, safety concerns persist due to aging of short lines infrastructure, human error, regulatory challenges, and the sheer volume of freight traffic, particularly in hazardous materials transport. The key safety challenges in Texas's freight rail and short-haul routes include:
Texas has many at-grade railroad crossings, where rail lines intersect with roads. These crossings are major points of concern for safety, especially in rural areas where trains and vehicles may cross paths without sufficient warning systems. Collisions between trains and vehicles at crossings are a leading cause of fatalities in the rail industry. Drivers ignoring warnings, inadequate signage, malfunctioning crossing gates, trespassing, are common causes of accidents at these intersections. In urban areas, pedestrians are also at risk, particularly if crossings are not well-maintained or if there is a lack of proper fencing or barriers to keep people off the tracks.
Derailments can result from a variety of factors, including track defects, equipment failure, operator error, and extreme weather conditions. Texas's extensive rail network requires constant maintenance to prevent wear-and-tear that can lead to accidents. Inadequate maintenance, particularly on short-haul routes and rural lines with less frequent traffic, can increase the risk of derailments. Equipment malfunctions and mechanical issues with rail cars, like worn-out wheels or brake failures, can also contribute to derailments. These derailments can lead to costly delays, damage to goods, and environmental risks, especially if hazardous materials are involved. They also pose a significant safety risk to rail workers and adjacent communities.
Freight rail frequently transports hazardous materials, including crude oil, chemicals, and other flammable or toxic substances. This poses significant risks, especially in the event of derailments, leaks, or other accidents. These accidents involving hazardous materials can lead to environmental contamination, fires, or explosions. For example, crude oil trains have been involved in high-profile accidents that caused large fires and damage to the surrounding areas. Although federal regulations require strict protocols for the transportation of hazardous materials, compliance in some limited situations can be inconsistent, particularly on smaller or short-haul routes. 99.99% of all hazardous shipments arrive without incident. Railroads have reduced hazmat incidents by 75% since 2000 according to the AAR. Railroads must follow rules for proper labeling, handling, and routing of hazardous goods to minimize risks.
Some parts of Texas's rail network suffer from aging infrastructure, especially rural tracks and short-haul routes, which are about 7% of the Texas rail network. Tracks that are not properly maintained can lead to safety issues like derailments, slowdowns, or accidents at crossings. Short-line railroads, which often operate on older and less-trafficked lines, may have fewer resources for infrastructure upgrades and maintenance. These rail lines may not have the same level of technological investment as major Class I freight routes, increasing the risk of track-related issues. Texas’ extreme weather conditions, including floods, heat waves, and hurricanes, can damage rail infrastructure. High temperatures can cause rail lines to expand and buckle, while floods can wash out tracks, leading to unsafe conditions.
Human error and fatigue present risks to safety, which covers operator fatigue, safety protocol violations otherwise known as failure to follow proper safety procedures, and training gaps that ensure that all rail employees are properly trained. This is of particular concern for those working for short-haul and regional operators.
To address these safety issues, both public and private stakeholders are working on various measures. Railroad companies, particularly Class I operators, invest heavily in infrastructure maintenance, while public-private partnerships help fund improvements in short-line and regional railroads. Federal and state safety regulations govern freight rail, and compliance is enforced through inspections by the FRA and TxDOT. Increasing the use of Positive Train Control (PTC), automated safety systems, and advanced inspection technologies can significantly reduce risks, although smaller operators may struggle with costs. Efforts like Operation Lifesaver raise public awareness about the dangers of railroad crossings and trespassing.
OPERATIONS AND MAINTENANCE
Since 2022, significant investments have been made in Texas freight rail maintenance and infrastructure. BNSF, one of the major freight rail operators in Texas, allocated $3.6 billion in 2022 for capital expenditures (capex), which includes projects related to track maintenance, bridge repairs, and rail safety improvements. This is part of the broader national spending by freight railroads, which consistently invest more than $20 billion annually in capital and maintenance expenses across the U.S.
The federal government has made substantial funding available for freight rail and infrastructure projects through multiple programs to improve rail safety, modernize infrastructure, and enhance grade-crossing safety, directly impacting states like Texas. The IIJA passed in 2021 made $102 billion in total rail funding available, including $66 billion from advanced appropriations, and $36 billion in authorized funding. Texas is eligible to compete for portions of these grants for rail improvement. This Federal support complements the investments by private rail operators, ensuring that the State's freight rail system continues to modernize and meet increasing demand.
Key Federal Funding Allocations for Rail:
• Infrastructure Investments and Jobs Act (IIJA): The IIJA allocates approximately $66 billion for rail improvements over five years nationwide, including freight, passenger, and safety projects. This includes both direct funding and competitive grants. Texas clearly does not receive its fair share of federal funding relative to rail miles and number of grade crossings in the State.
• Federal-State Partnership for Intercity Passenger Rail: Texas is eligible to compete for part of $36 billion under this grant program, which also supports freight rail that shares track or right-of-way with passenger rail.
° Corridor Identification and Development Program Selections, September 2024 for $63.9M:
› Texas High-Speed Rail Corridor Step 3 (Up to $63,932,000)
° Corridor Identification and Development Program Selections, December 2023 for $2M1:
› Amtrak Texas High-Speed Rail Corridor (Up to $500,000)
› Fort Worth to Houston High-Speed Rail Corridor (Up to $500,000)
› Houston to San Antonio Corridor (Up to $500,000)
› Texas Triangle: Dallas-Fort Worth-Houston Intercity Passenger Rail Corridor (Up to $500,000). A portion of this project passes through Texas Daily Sunset Limited Service (Up to $500,000) – not counted in above $2M total
• Consolidated Rail Infrastructure and Safety Improvements (CRISI) Grants: This program has allocated $5 billion over five years to enhance safety, efficiency, and infrastructure of freight rail systems. Texas freight rail operators can apply for portions of this funding to improve rail infrastructure, especially on rural or short line routes. In Texas this amounts to the following FRA Funding for Texas for 2023 and 2024:
° CRISI Grants October 2024 for Freight Short Lines FY24 - $140M
› Kiamichi Railroad Company - Up to $56,619,066
› Timber Rock Railroad, LLC - Up to $40,000,000
› Dallas, Garland & Northeastern Railroad - Up to $16,754,834
› Jaguar Transport Holdings, LLC / Texas & Eastern Railroad - Up to $13,354,839
› Rio Valley Switching Company - Up to $5,250,000
› Texas Gonzales Northern Railway Company - Up to $4,634,546
› Texas Rock Crusher Railway - Up to $3,511,714
° CRISI Grants2 September 2023: $14.8M :
› Texas – The Sunray Agricultural Supply Chain Efficiency Project (Up to $7,342,032) Texas Northwestern Railway Company (TXNW)
› Texas-- Downtown Laredo Rail Corridor Safety Planning Project (Up to $4,000,000) City of Laredo, Texas.
› Texas – Rio Valley Rail Capacity Improvement Project (Up to $3,500,000) Rio Valley Switching Company (RVSC), McAllen.
• Grade Crossing Elimination Program: A further $5.5 billion has been earmarked to improve grade-crossing safety, a critical issue in Texas due to its vast network of road-rail intersections.
INNOVATION
Freight rail in Texas is undergoing several innovations aimed at improving efficiency, safety, and sustainability. Five key innovations include:
1. Positive Train Control (PTC) is a safety system that monitors and controls train movements to prevent collisions and derailments. It is being rolled out across Texas freight rail lines, ensuring safer operations by automatically stopping trains under certain hazardous conditions. BNSF and UP, major freight operators in Texas, are testing automated technologies to manage rail traffic and improve operational efficiency.
2. Rail companies are increasingly using sensors and Internet of Things (IoT) technologies to monitor the health of rail tracks and rolling stock in real-time. These systems predict when maintenance is needed before failures occur, reducing downtime and improving safety. Freight rail operators are using artificial intelligence and big data analytics to optimize routing, reduce delays, and lower fuel consumption, making the operations more efficient.
3. Rail companies are exploring hybrid and fully electric locomotives to reduce their carbon footprint. UP, for instance, has announced investments in battery-electric locomotives for pilot programs in various regions, including Texas. The adoption of fuel-saving technologies such as dynamic braking and energy-efficient locomotives is helping Texas freight rail operators reduce emissions while lowering operational costs.
4. Freight rail in Texas is becoming more integrated with trucking and port systems. Major Texas ports, such as Houston and Galveston, are enhancing their rail connectivity, making it easier to transfer goods between ships, trains, and trucks, thereby streamlining supply chains. Projects like the Houston Belt & Terminal Railway and improvements to border rail links are increasing the efficiency of freight handling and international trade through Texas.
5. Blockchain technology is being explored for secure and transparent freight documentation and tracking. This could enhance the visibility and reliability of rail freight shipments, especially for high-value or time-sensitive goods.
These innovations aim to modernize Texas freight rail, making it more competitive, safer, and environmentally friendly.
RESILIENCE
Freight and short-haul rail lines in Texas face several resiliency challenges that impact their reliability and efficiency. There are three main issues:
1. Many rail lines in Texas are aging, especially on short-haul routes and in rural areas, which can lead to frequent breakdowns or delays. Deferred maintenance exacerbates the risk of accidents, derailments, and disruptions. Keeping up with the infrastructure demands and ensuring that the system is in a state of good repair is challenging given the scale of the rail network and the increasing freight volumes. Many bridges and rail crossings need modernization. Their deteriorating condition poses safety risks and bottlenecks, particularly during extreme weather events like floods or heavy rainfall.
2. Texas is prone to severe weather, including hurricanes and flash floods, which disrupt rail service. Flooding can damage rail lines, bridges, and track beds, particularly in coastal and low-lying areas. The impact of climate change is expected to increase the frequency of these events, further straining rail infrastructure. Prolonged heat waves, which are common in Texas, can cause rail tracks to expand, leading to track buckling and derailments. This is especially critical on older or less maintained short haul lines.
3. The sharing of rail lines between freight and passenger services leads to capacity issues. With Texas’s rapidly growing population, this has caused increasing congestion on shared corridors, reducing the reliability of freight services, especially for short-haul trips. The proximity of Texas to Mexico means a large amount of cross-border rail traffic. Short-haul rail lines around border regions and ports like Houston and Laredo can experience congestion, delaying shipments and causing logistical challenges.
Addressing these resilience issues requires significant investments in modernization, weatherproofing infrastructure, and optimizing capacity to support the growing freight demand.
PHOTO: BUFFALO BAYO PADDLING TRAIL; TXDOT
RECOMMENDATIONS TO RAISE THE GRADE
Rail infrastructure (both freight and passenger intercity and high-speed rail) is capital intensive, but it delivers considerable economic benefits to the Texas economy. Investment in rail infrastructure and expanding rail service can ease congestion and help to develop urban areas making it a sound investment of public dollars, especially in Texas where growth has been and will continue to be strong. The need to expand the currently ineffective funding base with an equitable, and predictable (dedicated) funding source is paramount. Recommendations to raise the Rail grade include:
• Allocate Federal and State funds to rail safety programs and projects to save lives and further help the economy.
• Provide sustained public investments (and invite private equity to partner) to capitalize on the socioeconomic, environmental, and other benefits of highspeed passenger rail as a legitimate mode of transportation in Texas. A renewed commitment to rail transportation would be a sound basis for further economic growth and prosperity by allowing the rail industry to fairly compete and provide quality services.
• Prioritize rail investments to encourage sustainable land-use decisions.
• Adequately fund passenger rail vehicle fleets and associated infrastructure improvements to achieve the goal of zero emission vehicles.
• Redefine the role and quantify the benefits of rail transportation in the larger context of Texas and US economy. Rail mobility will help to reduce aviation and long-distance highway traffic. It is green and sustainable, and it has been a proven launching pad for land and economic development.
• Reduce fragility of existing rail lines to improve the State’s resiliency and redundancy by supporting new initiatives focused on operational and maintenance costs and efficiencies.
• Adequately fund state of good repair to reduce the associated backlog on the remaining poor areas (<10%) and upgrades to allow faster and more frequent passenger services on freight rail lines.
• Address significant escalations in capital costs to narrow the gap between investment needs and available funding.
• Assess vulnerability and align capital improvements to increase the resiliency of rail systems to extreme heat, precipitation, and electric grid disruptions.
• US DOT Federal Railroad Administration - https://railroads.dot.gov/BIL
• 2024 Border District Trade Transportation Report, TxDOT: https://ftp.dot.state. tx.us/pub/txdot/gov/trade-transportation-activities.pdf
• Bureau of Transportation Statistics. Trend in U.S.- North American Freight Since January 2006 to August 2023 - Value; https://explore.dot.gov/views/Dashboard_PortbyCommodity/ HistoricalTrend?%3Aembed=y&%3Aiid=1&%3AisGuestRedirectFromVizportal=y
• https://ftp.txdot.gov/pub/txdot/move-texas-freight/resources/texas-delivers-2050. pdf
Texas boasts a massive road network, but keeping pace with a growing population and rising congestion is an ongoing challenge. While pavement conditions are good (nearly 90%), traffic congestion, particularly for trucks, is a growing concern. Texas tackles this by dedicating significant resources to highways (more than $37 billion budgeted in 2024-2025) and exploring innovative solutions such as traffic flow technology. Safety remains important, with more than $3 billion allocated for safety projects. Despite public awareness campaigns and other projects, fatalities persist (4283 people died in road accidents in 2023), prompting local Vision Zero initiatives. Funding comes from the Infrastructure Investment and Jobs Act (IIJA), gas taxes, registration fees, and a new electric vehicle fee, but the rising number of vehicles emphasizes the need for continued investment. The Texas Department of Transportation (TxDOT) is preparing for the future by planning for and investing in new construction projects. Overall, Texas is working diligently to keep its transportation system moving.
CAPACITY AND CONDITION
The state and federal highways in Texas ensure the movement of people, goods, and services, connecting regions to commercial opportunities and individuals to work and school. Road type and length are important to understanding capacity and condition. Lane miles in Texas total 686,281 miles, with rural roads making up 62.34% of these miles and urban roads representing 37.66%. There are 16 interstate highways and 45 U.S. Federal highways.
The table below provides a detailed breakdown of the road network in Texas, categorized by road type and location (rural or urban).
TABLE 1. FHWA-Functional System Lane Length (2020)
The statewide percentage of lane miles in “Good” or better condition increased from 89.49% in Fiscal Year (FY) 2022 to 89.69% in FY 2023. This is the highest percentage of pavements in good or better condition in the last five years. Factors such as flooding or droughts, the availability of construction materials, routine maintenance, vehicle loads, traffic volumes, and design also contribute to road conditions.
The increase in overall pavement conditions in FY 2023 was a result of decreased deterioration. While pavement condition scores improved on most roads in Texas, they decreased for Interstates.
Driving on deteriorated roads cost Texas motorists $13.8 billion a year – $773 per driver – in the form of additional repairs, accelerated vehicle depreciation, and increased fuel consumption and tire wear. Estimated vehicle miles traveled (VMT) in Texas was 51.2 billion miles in 2023, a 3.8% increase in traffic when compared to 2022.
The capacity of our roadways is one factor that impacts the efficiency of our transportation systems and the overall quality of life. The following table shows Texas’s top 10 most congested roads in 2022.
Automobile commuters in Texas spend more than 30 hours annually stuck in peak-hour traffic congestion (7:00 to 9:00 AM in the morning and 4:00 to 7:00 PM in the evening on weekdays).
The table below compares the vehicle miles traveled and annual hours of delay for various areas in Texas between the years 2019 and 2022.
Traffic delays statewide in 2023 were up 7% over 2021 conditions. Even with last year’s increase in large districts, 2022 estimates of delay were still 23% lower than in 2019, a noteworthy comparison, because total traffic volume on roadways has increased by 2% compared to 2019. Truck delays, on the other hand, were up 15% over 2021 levels and 1% higher than 2019. Although conditions are improving, traffic congestion persists.
Road reconstruction and expansion have continued at a brisk pace in recent years, highlighted by TxDOT’s $100 billion and the Texas Clear Lanes initiative. TxDOT has invested more than $32 billion to plan, construct, and complete non-tolled projects in the State’s largest population centers since 2015. The eighteen Texas Clear Lanes projects are now complete, 25 are under construction, and another 62 are planned.
TABLE 2. Texas' Top 10 most Congested Roads in 2022 The State's most congested roads are in the Houston, Dallas-Fort Worth and Austin metropolitan areas, according to an annual study from the Texas A&M Transportation Institute.
TABLE 3. Texas: Area-Level Congestion VMT and annual hours of delay (2022)
OPERATION AND MAINTENANCE (O&M)
In recent years, Transportation Systems Management and Operations (TSMO) has played an important role in managing, maintaining, and improving the safety and efficiency of existing roadway infrastructure. Roadway operations require various strategies and practices implemented by the State roadway owner, TxDOT.
During extreme winter weather events, roadways are prioritized for clearing based on their functional use, with interstates and major highways taking precedence. Deicing and snow removal response depends on factors like temperature, snowfall intensity, location, available resources, and priorities. Materials used include liquid anti-icing solutions and granular de-icing materials.
TxDOT's statement of net position for fiscal year ending August 31, 2023, was $124.4 billion, reflecting a 7.8% or approximately $9 billion increase from 2022. While 96.1% of TxDOT’s net position invested in capital assets of related debt, 9.8% is restricted and represents funds that can only be used for construction activities, payment of debt, and other specific programs identified by law. This results in a deficit in net position of approximately $7.4 billion in 2023 which is a slight increase from 2022.1
TxDOT has allocated a larger portion of its budget toward roadway maintenance and repair. By addressing congestion through increased investment in roadway infrastructure, TxDOT can improve the condition of the State's transportation network and generate substantial cost savings for commuters and businesses alike. The 2022 Condition Table illustrates the cost savings for Areas in Texas.
PUBLIC SAFETY
In 2023, 4,268 people died in traffic fatalities in Texas. The number of people killed in traffic accidents increased by 9.9% from 2020 to 2023.
Fatal traffic crashes in rural areas of Texas accounted for 52.84% of the State’s traffic fatalities in 2023. In 2023, there were 403 fatalities due to distracted driving. This is a 17.25% decrease from 2022 and may be attributed in part to laws against texting and handheld device use as well as TxDOT’s public awareness campaign against distracted driving.
TxDOT has several initiatives underway to enhance road safety and prioritizes road safety through its Strategic Highway Safety Plan (SHSP). This plan includes infrastructure improvements for pedestrians and cyclists, safer road designs, and partnerships with law enforcement to enforce traffic laws. Data-driven approaches help identify high-risk areas, while public awareness campaigns educate drivers about safe practices. While the SHSP doesn't explicitly address equity, local Vision Zero initiatives aim to improve safety in underserved communities. Driver education could benefit from more comprehensive training on sharing the road with vulnerable road users. By investing in these areas, Texas aims to create safer roads for all.
Texas and its cities are taking steps to reduce road deaths, but there's room for improvement. The State's SHSP identifies high-crash
corridors but lacks detailed programs to address the issues. Data collection and analysis can help target safety interventions. Vision Zero is a global goal to eliminate all traffic deaths, and while Texas has its "Road to Zero" program, it doesn't fully align with the comprehensive Vision Zero approach. Several cities like Austin, Houston, and San Antonio have adopted Vision Zero, focusing on engineering, enforcement, education, and equity to improve road safety. Taken as a whole, a more comprehensive and equitable approach is needed to fully realize the goal of zero traffic fatalities.
Pedestrian fatalities in Texas totaled 807 in 2023, which represents a 0.98% decrease from 2022, and cyclist fatalities totaled 105 in 2023, which is a 15.38% increase from 2022. While Texas has made efforts to improve road safety through public awareness campaigns, law enforcement partnerships, and data-driven initiatives are needed to improve safety on Texas roads. Strengthening engineering measures, such as creating dedicated spaces for pedestrians and cyclists, and increasing funding for safety programs are crucial. Additionally, a focus on equity in safety improvements is essential. Many Texas cities have adopted Vision Zero goals, aiming for zero traffic fatalities through a comprehensive approach that includes infrastructure changes, education, and enforcement.
RESILIENCE AND INNOVATION
Texas has witnessed a significant surge in its population during the pandemic, growth that is attributed to new construction and affordable living costs. Concurrently, Texas faces challenges from climate change, which poses risks to its critical infrastructure. Consequently, ensuring the resilience and adaptability of Texas's transportation system becomes imperative.
Building resiliently requires infrastructure leaders to grasp potential hazards, mitigate risks, and make strategic investments for more dependable transportation options. Texas is pursuing innovative solutions to bolster traffic flow, particularly in urban areas where upgrades to public transport, such as metro rail, buses, bicycle routes, and pedestrian facilities, are underway.
In tandem with technological advancements, TxDOT is spearheading research in Artificial Intelligence (AI) for managing physical and digital assets, aiming to optimize budget utilization, reduce costs, and enhance sustainability. Additionally, the widespread adoption of Intelligent Transportation Systems (ITS) by cities aims to improve mobility and alleviate traffic congestion.
Recognizing the vulnerability of its transportation system to various hazards, Texas is launching the Statewide Resiliency Plan (SRP) to fortify its multimodal transportation infrastructure. Annual threats such as extreme weather events, security risks to ITS, and humanmade hazards caused by lack of maintenance, such as dam failures, necessitate proactive management.
FUNDING
TxDOT’s biennial 2024-2025 budget includes appropriations totaling more than $37.2 billion. The budget dedicates approximately $32.7 billion, or 88% of the total budget, to fund the development, delivery, and maintenance of state highway projects.
The State Highway Fund primarily relies on state motor vehicle fuel taxes, federal highway reimbursements, vehicle registration fees, and various smaller revenue sources like lubricant sales taxes and permit fees. Dedicated funds from Propositions 1 and 7 also contribute to the fund. These revenues are crucial for financing public roadway projects across Texas.
The Texas Legislature in 2023 passed Senate Bill (SB) 505 to address current and anticipated transportation funding gaps by creating a state electric vehicle registration fee. The bill requires alternative fuel vehicle owners to pay an annual registration fee of $200. The Texas Comptroller of Public Accounts estimates the implementation of the additional fees established by SB 505 will result in a revenue gain of approximately $985 million for the State Highway Fund in the next five years.
The State gas tax rate has remained at 20 cents per gallon since 1991, with 15 cents going to the State Highway Fund and 5 cents going to the Available School Fund. The federal gas tax rate has remained at 18.4 cents per gallon of gasoline since 1993. Compared to other states, Texas’ fuel tax rate is low and ranks 44th in the nation, as of July 1, 2023.
Figure 2. Texas Oil & Gas Production Taxes Above Threshold, Motor Fuel Taxes and Fees (https:// comptroller.texas.gov/taxes/fuels/)
Figure 1. TxDOT Biennial 2024-25 Budget
FUTURE NEED
TxDOT is developing a long-term transportation plan called Connecting Texas 2050. This plan involves gathering input from the public and conducting technical studies to establish a vision, objectives, performance measures, and strategic recommendations for the State's transportation system across all modes. TxDOT aims to identify strategies for better access to reliable, safe transportation options.
Personal auto traffic is expected to increase by 66% from 2008 to 2035, and truck traffic is expected to grow by 123%. As a result, congestion in Texas is worsening due to the rapid population growth outpacing the construction of new capacity. Currently, 67% of freeway travel in urban metro counties experiences heavy congestion, and this is expected to grow more than 80% by 2035.
TxDOT releases the Unified Transportation Program (UTP) annually, outlining planned construction projects for the next decade. The draft 2025 UTP proposes $104.2 billion in spending for these projects over the next 10 years, indicating a significant increase in investment in Texas' roadways whereas the 2024 UTP identified investments in transportation projects totaling approximately $100 billion in infrastructure improvements. Pavement funding from UTP is expected to total $15 billion between FY 2020 and 2027, and maintenance operations program funding is expected to total $5.7 billion over the same period.
To achieve a goal of zero traffic fatalities and serious injuries, TxDOT’s Statewide Transportation Improvement Program (STIP) estimates more than $3.17 billion on safety projects. For safety improvements, TxDOT has also allocated more than $105 million from state and federal funds for traffic safety programs focused on pedestrian and bicyclist safety, highway-rail grade crossing safety, and roadway safety.
FIGURE 3. Sales & Use Tax; Motor Vehicle Sales and Rental Tax
GAS TAX $/Gallon
TABLE 5. Gas Tax Distribution
ROADS
RECOMMENDATIONS TO RAISE THE GRADE
• Increase funding for repairs and maintenance to mitigate the high cost of deteriorated roads. This could involve raising tolls, along with securing additional government funds.
• TX should consider revising the motor fuel tax or exploring using other forms of road user fees to adequately fund roads, highways, and other transportation modes.
• Identifying and implementing sustainable and consistent funding sources for local roadway and transportation projects to adequately fund needs because a significant portion of roads are managed by municipal agencies.
• Creating dedicated cycling infrastructure such as protected bike lanes to separate cyclists from traffic to reduce fatalities.
• Invest in infrastructure to optimize traffic flow, such as high-occupancy vehicle (HOV) lanes to incentivize carpooling, public transportation, sidewalks, bike lanes, and trails. By offering Texans more transportation options, we can reduce reliance on single-occupancy vehicles, mitigate the strain on existing infrastructure, save lives, and reduce harmful emissions.
Texas continues to grow in statewide population and with that comes a related increase in the amount of waste generated. The Municipal Solid Waste in Texas: A Year in Review 2022 Data Summary and Analysis report published by the Texas Commission on Environmental Quality (TCEQ), found that the average disposal rate of pounds per person per day in Texas slightly climbed from the previous reporting year of 2021.
The United States Environmental Protection Agency (US EPA) delegates the authority to permit and regulate all municipal solid waste (MSW) facilities in the state to the TCEQ. Solid waste management in Texas is provided by a combination of public and private entities. Texas currently has an average of 51 years of reserve capacity statewide. Continued population growth will result in an uneven distribution of Texas’ reserve waste disposal capacity.
Most large metropolitan cities in Texas have robust recycling collection programs and access to infrastructure to divert material from direct disposal. Many urban and rural areas are without access to recycling programs due to a lack of infrastructure and process centers. This continues to be a problem as reported in the 2021 Texas Infrastructure Report Card (IRC), with little improvement over the past four years. One recent development is a new recycling operation will open in San Antonio in late 2024, but that is the only one scheduled to open. Growth, particularly in waste diversion and recycling must improve
and will require supporting infrastructure in place. A general lack of facilities to recycle continues to be an overriding problem in the State where municipalities have difficulty funding in their annual budgets.
Improvements needed over the next four years in solid waste recycling and diversion must occur to provide more options for Texas’ solid waste management programs.
CONDITION AND CAPACITY
Based on TCEQ’s 2022 Data Summary and Analysis report published in September 2023, approximately 39.73 million tons of solid waste was disposed of in Texas MSW landfills. The Texas definition of municipal solid waste is more encompassing than the definition used by US EPA or some states and includes sludges from municipal wastewater treatment plants and construction or demolition wastes. The average disposal rate is 7.25 pounds per person per day and represents a slight increase from 7.09 pounds per person per day in 2021. That represents a 2.26% increase in per capita disposal rates while during the same time, the State’s overall population increased 1.70%. If Texas used the US EPA definition for municipal solid waste in 2022, the total disposal rate is much less at approximately 4.87 pounds per person per day. Currently all solid waste management demands are being met, and future capacity exceeds 50 years.
As noted above, Texans generated approximately 39.73 million tons of solid waste in 2022. Texas produces approximately 13.59% of the total waste produced in the United States. Table 1 shows the type and number of active landfills in Texas in 2012, 2017, and 2022. The total number of active landfills did not change significantly. Table 2 shows the total disposal amounts and the remaining waste disposal capacities in Texas in 2012, 2017, and 2022. Largely due to the State’s population growth, the amount of waste increased over the period while the waste disposal capacity slightly decreased. This decrease was also a result of reduction in the total number of Type I and Type I&IV Arid Exempt (AE) sites. There have been new MSW landfills opened across Texas since 2022. These new facilities will increase the overall capacity in the new reporting year, later in September 2024.
Type of Landfill
Description of Landfill
TABLE 1. Active MSW landfill numbers and types in Texas in 2012, 2017, and 2022.
Table 2 below shows slightly more than five decades of remaining waste disposal capacity for the State. This data does show a downward trend in the remaining capacity while the amount disposed each time has increased. It is important to note that the excess capacity is not evenly distributed. Some areas of Texas do not project as much future disposal capacity as others.
TABLE 2. Total Disposal Amounts and Remaining Capacities in 2012, 2017, and 2022.
There are 24 Councils of Governments (COGs) across Texas and each one is responsible for regional MSW management planning in their area. Original MSW management plans were developed for each regional COG in the mid 1990’s. These management plans have been periodically updated over the past 20 years and most recently in 2022. These updated plans from all 24 COGs were completed as required by TCEQ based on the planning period of 20 years. The plans may be accessed and read on the TCEQ website.
Recycling facilities in Texas are authorized by TCEQ’s notification process that allows them to operate without a full permit and they are not required to report quantities to TCEQ. At the time of this report, mandatory recycling data was not available. According to a 2015 study on the potential economic impacts of recycling found that Texans recycled 9.2 million tons of MSW designated material.
TCEQ monitors and periodically inspects all operational facilities. Any issues or noted violations are noted by the inspector and presented to the operator. These are generally corrective issues noted, and sites must make operational adjustments to address the issue within a specific time frame. Currently there are no known facilities in Texas that have any pollution issues.
Texas does not have any solid waste incineration facilities.
OPERATION AND MAINTENANCE
Permitted landfills in Texas are owned and operated by private entities, publicly traded companies, cities, municipalities, or counties. Of the total 200 permitted landfills in Texas, 130 of these are publicly owned. Tipping fees, which include a state-mandated fee, are charged at the facility gate to generate revenue to pay for operational and maintenance costs. Larger facilities handle a sufficient incoming waste stream that these fees are sufficient to pay for most operational costs. Smaller community owned facilities struggle generating enough revenue and are usually subsidized by the city.
One of the issues faced by landfills is the liquid generated by rainfall known as leachate. Since this liquid by product may contain decomposed components, it can be difficult to dispose of. Landfills can recirculate leachate if they are constructed with a “prescriptive” clay liner constructed and approved by the TCEQ. For many landfills, this is not an option because clay liner requirements are expensive. One of the simplest and most common leachate collection disposal methods is to remove the liquids generated and pump it to an onsite evaporation pond. If there is no pond, a second option is to pump or haul the leachate to a municipal publicly owned treatment works (POTW) for treatment and disposal. Since the previous assessment four years ago, the issue of “forever chemicals” such as per- and polyfluoroalkyl substances (PFAS) has risen. No regulations have been passed to govern this substance, but it is one that many in the MSW industry are watching closely.
In 1986, there were 790 authorized MSW landfills in Texas accepting waste, but by 1994 there were only 199. The 591 sites that did not upgrade their designs, operating practices, closure requirements, liner requirements and groundwater monitoring were “grandfathered” by EPA’s Resource Conservation and Recovery Act (RCRA) Subtitle D standards that was promulgated on October 9, 1993. These closed sites are not monitored by any agency in Texas. There was a commissioned study in the 1990’s to identify the locations of closed landfills and develop a statewide inventory of these facilities. This data can be accessed from TCEQ’s website at https://www.tceq.texas. gov/permitting/waste_permits/msw_permits/msw-data#historical.
TCEQ has extensive requirements for the closure and monitoring of landfills that have either reached capacity or are no longer open. The owner or operator is required to install a final cover to the system that is designed and constructed to minimize infiltration of rainfall and side slope erosion.
FUNDING AND FUTURE NEED
Unlike other infrastructure, solid waste does not receive funding from the Federal government. The US Environmental Protection Agency announced the Solid Waste Infrastructure for Recycling (SWIFR) Grant Program for political subdivisions in November 2022 for award in October 2023. These grants are intended to assist local communities to improve post-consumer materials management including municipal recycling programs and waste management systems. Two grants were awarded in Texas to cities that already have waste management systems. One was outside of San Antonio in the City of Bandera and the other one was granted to the City of Austin. In September 2023, TCEQ was awarded a SWIFR grant from US EPA. The TCEQ SWIFR grant will provide additional funds to five Texas COGs to implement their Regional Solid Waste Management Plans with a focus on benefits to rural communities.
As previously discussed, Texas collects tipping fees at disposal sites for each ton of waste disposed. In 2022, the average statewide tipping fee at a municipal solid waste landfill was $41.88 per ton. Larger facilities can self-support their costs through tipping and collection fees; whereas smaller facilities struggle to break even. Tipping fees are used for operation and maintenance and not generally used as an income source for the local governments.
Texas has a mandated state disposal fee of $0.94 per ton. This fee has remained at this level since it was lowered from $1.25 per ton in 2013. Previous Texas Health and Safety Code requires TCEQ to collect and place the fees generated into two state general funds known as FUND 549 and FUND 5000. In 2023, FUND 5000 and FUND 549 were combined into one account, FUND 549. FUND 549 now funds TCEQ’s solid waste management regulatory operations and grant funds back to the regional COGs for local solid waste management, recycling, or other waste minimization efforts. In addition to landfills, incinerators, composters, shredders, and similar facilities pay a state fee. In 2023, TCEQ collected approximately $36.7 million from all waste disposal sources. As of December 2024, the balance of that reserve was $154 million. Texas could fund more alternative waste practices for public and private industries by increasing the spending out of the reserve fund. This money could further local efforts, such as:
• Encouraging the development of recycling infrastructure;
• Supporting local enforcement projects that contribute to the prevention of illegal dumping; and
• Creating a cleanup fund for illegally dumped tires.
PUBLIC SAFETY
Generally, facilities in Texas are operated and monitored with overall public safety in mind. Most facilities try to limit public entrance onsite at landfills and there are strict rules for accessible locations, driving speed, etc., which are enforced to protect the public once they are onsite. The larger issue is everyday operational safety for the workers who operate these facilities. According to the Bureau of Labor Statics, solid waste is the fifth most dangerous occupation that they track. Many daily operations involve large trucks, containers, compactors, etc., all require constant vigilance for worker safety. Larger solid waste facilities utilize an asset management system to track heavy equipment (trucks, dumpsters, carts, etc.), to maintain inventory and to ensure that these assets are maintained, replaced, and removed from inventory on schedule. Some utilities also use a variety of GPS-based systems to identify where their assets are in real-time to ensure service delivery and to ensure the safety of their staff.
TCEQ has an exhaustive regulatory program that oversees the location selection, landfill liner design/construction requirements, and closure processes that protect underground drinking water resources. All landfills are required to monitor for methane, storm water, groundwater, and air emissions to ensure protection of public health and the environment. The sampling and monitoring requirements ensure the proper functioning of the facilities liner system.
Each COG maintains an inventory of closed landfills in their area. This inventory locates and identifies the closed landfill to monitor and minimize impacts.
TCEQ does not set sustainability requirements for design and/or construction of landfills, and sustainability design processes have not typically been used for existing solid waste infrastructure. Many communities are individually pursuing sustainability goals. These goals are generally reflected in purchasing practices, design standards for facilities, among other practices. The 24 COGs have 20-year solid waste management plans that were updated in 2022. These plans address sustainability, waste diversion, and/or recycling goals that drive the direction of MSW management in their location. The counties and cities within the COGs have subsequently adopted similar goals to fit their individual county or city needs.
Larger municipal communities offer some types of recycling programs, ranging from curbside collection to drop-off facilities. There are limited facilities in the western half of the State to process recyclables and this area within the industry has been referred to as a “recycling desert”. Reducing and reusing efforts are largely grown out of education and outreach programs. Additionally, the TCEQ has a statewide program, Take Care of Texas that provides helpful information on Texas’ successes in environmental protection and encourages all Texans to help keep the air and water clean, conserve water and energy, and reduce waste.
INNOVATION AND RESILIENCE
In 2022, MSW processing facilities managed approximately 8.7 million tons of waste with more than 1.76 million tons reported as diverted from MSW facilities for recycling or reuse. Of this total, the largest category was “Yard Trimmings or Brush” accounted for 31.58% of the total. Compost facilities across the State processed 916,027 tons of organic material while waste-to-energy facilities generated 220 million kilowatt hours (kWh) of electrical power. All 24 COGs identified the need for better access to waste diversion in their most recent regional plans. The western half of the State has limited to zero access to recycling programs as there is no infrastructure to support these programs. The eastern half of the State has better access to companies processing recyclable materials, but even then, larger urban communities are struggling to ensure access to those residents in multi-family homes. The State must invest in waste diversion programs and infrastructure for all residents.
Landfills that have specific design capacity and a non-methane organic compound emission rate at a specified level must control the methane gas by installation of a gas control and collection system. There are 29 facilities in Texas that utilize landfill gas for beneficial reuse with the following results.
Natural disasters have had little impact on Texas’ MSW facilities, but the debris these storms produce is an issue that these landfills must handle. Most municipal solid waste operations are quite resilient during disasters. The normal operation of waste collections is disrupted when a community is impacted by a natural disaster, and the efforts of collection operation shift in focus to removal and disposal of debris. Debris from a natural disaster does have a secondary impact as the increased inflow of debris greatly reduces the disposal capacity life of the facilities.
Innovation and research are conducted in Texas by the University of Texas at Arlington (UTA) Solid Waste Institute for Sustainability (SWIS). It is renowned for its solid waste research program. SWIS relies on landfills to support their programs by providing funding as well as opening their doors to allow onsite research to be conducted. As recently as 2023, SWIS is working with the Texas Department of Transportation to utilize waste plastics in asphalt mixes for Texas roadways. They have a test roadway section on the main campus in Arlington and are working with DFW Airport to expand this application. This innovation could take some of the plastics not suitable for recycling and reuse them effectively.
PHOTO: LUBBOCK LANDFILL
SOLID WA STE
RECOMMENDATIONS TO RAISE THE GRADE
• Sustainable Materials Management (SMM) – Encourage and promote the use and reuse of materials in the most productive and sustainable way across their entire life cycle. SMM conserves resources, reduces waste and minimizes the adverse environmental impacts of material use.
• Public policy and public education - Sponsor more public policy public education programs that focus on reducing waste at its source, recycling, and minimizing disposal amounts to move closer to the national average of waste generation.
• Innovation - Develop technologies through funded research for treating and recycling solid waste.
• Increase landfill capacity - Update statewide study on recycling and resource recovery efforts to evaluate progress and adjust processes toward continuing reduction of solid waste disposal to extend existing landfill capacity far into the future.
• Improve access to solid waste and recycling services in all areas of Texas with focus assisting smaller rural areas that are currently underserved.
• Seek changes in federal funding to allow solid waste management projects to receive federal money for assistance.
Sources
• TCEQ (2023). Municipal Solid Waste in Texas: A Year in Review, 2022 Data Summary and Analysis. AS-187/23, September 2023.
• US EPA (2020). Advancing Sustainable Materials Management: 2018 Fact Sheet, EPA 530-F-20-009, United States Environmental Protection Agency, Office of Land and Emergency Management (5306P), Washington, DC 20460, December 2020.
• Waste Dive. Recycling Partnership report identifies more than a dozen cities with curbside expansion potential, February 19, 2020.
STORMWATER
EXECUTIVE SUMMARY
According to the 2024 State Flood Plan, nearly 5 million Texans currently live or work in high-risk flood zones, and with projected population growth and increasingly severe storms, it is critical to improve stormwater infrastructure. While it is nearly impossible to eliminate all flood risk during extreme storm events, state and local leaders have advanced strategies to enhance technical analysis of risk, developed risk mitigation and resilience solutions, and identified and dedicated the necessary funding. The Texas Water Development Board (TWDB) completed Texas’ first comprehensive State Flood Plan in 2024, comprising the herculean effort of identifying flood risk across Texas and consolidating recommended solutions from across the State’s 15 flood planning regions at an implementation cost of more than $54B.
INTRODUCTION
Stormwater infrastructure includes systems designed to manage the quantity and quality of storm runoff, effectively conveying storm and flood water to protect lives and property against potential loss and damage. Due to its size, geographic diversity, diverse climate, and level of development, Texas is at risk for various types of flooding. These flood risks arise from various sources, including riverine (fluvial), urban (pluvial), coastal, and flash-flooding. While the impacts of smaller storm events, especially in urban areas, are conventionally managed using engineered structures like storm sewers, open ditches, smaller concrete or natural channels, and roadway conveyance systems, larger storm events are managed using larger concrete or natural channels, dams, levees, canals, and detention basins. These structures, referred to as grey infrastructure, are designed to quickly move stormwater away from structures and out of developed areas. More recently, stormwater infrastructure owners have turned to green infrastructure as a complementary alternative to grey infrastructure systems. Green infrastructure, including rain gardens, green roofs, and permeable pavements, are designed to mimic and maximize the benefits of natural processes to manage stormwater flows and improve the quality of stormwater runoff.
The United States (US) Environmental Protection Agency (EPA) classifies publicly owned stormwater systems that discharge into waters of the US as Municipal Separate Storm Sewer Systems (MS4s). Texas MS4s are regulated by the Texas Commission on Environmental Quality (TCEQ) under the Texas Pollution Discharge Elimination System (TPDES) program. Apart from EPA and TCEQ regulations, counties and local governments may also require stormwater management practices through ordinances, building codes, and development plans to better address stormwater quality and quantity issues specific to local concerns. As the State continues to grow and experience more severe storms more frequently, investing in stormwater infrastructure to reduce flood risk is critical.
CAPACITY
In 2018, the National Oceanic and Atmospheric Administration (NOAA) published revised rainfall frequency values for Texas (NOAA Atlas 14 Volume 11), updating rainfall estimates previously established in the 1960s and 1970s. These rainfall estimates are the key data points that engineers use to size and design stormwater infrastructure. The revised data shows increased rainfall values throughout the State that result in changes to design storm events used to determine capacity of stormwater systems. Given the recent changes in rainfall trends, increasing urbanization across Texas, and the age of existing infrastructure, the actual capacity of stormwater systems is often less than current design standards and will likely be undersized under future rainfall projections.
The capacity of Texas’ storm system networks was tested and ultimately overwhelmed in 2017, when Hurricane Harvey produced the highest rainfall totals for an individual storm event ever recorded in the contiguous US. In the wake of this epic storm, the Texas Legislature passed Senate Bill 8 (SB8) in 2019 which created a regional and state flood planning program as well as provided funding for updated statewide flood hazard information. The flood planning process began regionally in late 2020; finalized regional plans were delivered to TWDB in 2023, which were combined into the State’s first comprehensive State Flood Plan adopted by the TWDB in September of 2024. Studies, projects, and strategies developed under the regional plans are estimated to cost more than $54B to complete.
CONDITION
Stormwater conveyance systems typically last 50-100 years, while storage and treatment facilities last 20-30 years. Based on available data, it is estimated that most of Texas' stormwater infrastructure systems were originally built in the 1970s or earlier and have likely surpassed or are approaching the end of their design lifespan. Additionally, many systems are undersized due to current management practices , legacy design standards, and impacts of projected future rainfall impacts. Stormwater infrastructure within MS4s is required under the TPDES program to have ongoing maintenance plans but are only required to provide inspections of storm sewer outfalls but not the entirety storm sewer system.
Stormwater often flows untreated through storm drains into water bodies. Without regular maintenance, these systems can accumulate debris and pollutants, leading to blockages, floods, and downstream water quality issues. Pollutants in stormwater runoff are a significant concern in Texas, with the TCEQ regulating discharges through the TPDES. Nonpoint source (NPS) pollution, which occurs when rainwater carries pollutants into waterways, is a major contributor to water quality impairments. The EPA estimates that NPS pollution accounts for approximately 72% of river and stream impairments and 77% of reservoir impairments in Texas. For example, the City of Austin “Caution” graphic illustrates the common concerns for communities dealing with the effects of non-point source pollution. This information is posted at many parks in the city of Austin that have impaired water quality.
Municipalities with MS4s in Texas have protocols for routine maintenance and operations of stormwater infrastructure systems including training, techniques, equipment, and schedules. However, various factors can hinder the effectiveness of these programs, such as challenging locations due to topography of and development encroachments on legacy infrastructure installations as well as staffing and
funding constraints. Local government efforts to maintain stormwater infrastructure are being updated to account for these challenges with cities like Fort Worth implementing active cleaning and maintenance programs using specialized equipment. MS4 permitting requirements are also driving local governments to adopt more comprehensive and sustainable approaches to stormwater management.
Newer developments in Texas face stricter stormwater management requirements compared to older communities, often incorporating updated design criteria and modern techniques like green infrastructure and stormwater quality regulations. Retrofitting existing infrastructure to meet these standards remains challenging given constraints and encroachments on existing infrastructure right-of-way (ROW).
FUNDING
Funding for stormwater infrastructure comes from multiple sources at the local, regional, state, and federal levels. Flood and drainage infrastructure funding for communities in Texas is usually available through bonds and general revenue funds (ad valorem and sales taxes). There are 161 stormwater utilities in Texas, with an average fee of $5.27 per month for a single-family home. Texas communities also receive flood mitigation funds through FEMA Flood Mitigation Assistance (FMA) grants, administered by the TWDB under the Texas FMA program. Since 2015, these programs have provided approximately $530.1M in funding.
In response to successive years of major storm and flood events across the State, specifically Hurricane Harvey, the 86th Texas Legislature in 2019 entrusted the TWDB with new flood financing responsibilities, including creating the Texas Flood Infrastructure Fund (FIF) and the Texas Infrastructure Resiliency Fund (TIRF). The Legislature also directed TWDB to develop a multi-agency clearinghouse for flood planning and funding information. The Flood Information Clearinghouse Committee (FLICC) was formed to review funding inquiries and coordinate state and federal funds for flood mitigation.
The US Department of Housing and Urban Development (HUD) allocated more than $4.3B in Community Development Block Grant Mitigation (CDBG-MIT) funds to Texas in 2019. In 2023, the Texas Legislature appropriated an additional $625M for the Texas FIF, bringing the total to approximately $1.42B since its inception in 2019, of which the TWDB has committed $513M for 138 active projects. $550M was also appropriated for coastal resilience programs.
Despite recent state and federal investments in flood prevention, funding still lags current and future needs. The draft State Flood Plan estimates that more than $54B is required to fund the current set of proposed studies, projects, and strategies to improve stormwater infrastructure, reduce flood risk, and increase flood resiliency across Texas.
FUTURE NEED
Texas is home to 5 of the top 14 most populous cities in the US, with the Dallas-Fort Worth-Arlington metroplex having the highest increase in population (170,396) and the Houston-The Woodlands-Sugar Land metroplex having the second highest increase (124,281) between 2021-2022. Additionally, 6 of the top 13 fastest growing US cities in terms of population change percent (from 2021-2022) are in Texas. With so much urban growth projected to continue, it is imperative that municipalities across the State utilize sound stormwater management practices that consider future growth.
The 2022 Water Environment Federation (WEF) MS4 Needs Assessment Survey estimated a $6.2B funding gap across all MS4 permittees, which is likely an underestimation of the actual need. As communities continue to grow and existing infrastructure reaches or exceeds its useful life, stormwater programs should prioritize capital investments, long-term operations and maintenance, and end-of-life replacement costs in any funding strategy generated using asset management, data-support programs.
Most communities in Texas use FEMA Flood Insurance Rate Maps (FIRMs) as part of the National Flood Insurance Program (NFIP) to communicate local flood risks to communities and residents. Out of 254 counties in Texas, approximately 63 counties do not have existing flood hazard data. After the passing of Senate Bill 8 (SB8) in 2019, TWDB initiated several programs to bridge the data gap in flood risk. In 2021, TWDB released a statewide cursory floodplain dataset to include pluvial, fluvial, and coastal storm surges flood hazards. Future conditions (2060) cursory floodplain dataset is currently under development and will be used in future flood planning cycles. Concurrently, TWDB is developing base level engineering (BLE) hydraulic models for all regions in Texas aiming for completion by 2024.
The NOAA Atlas 14 update for Texas demonstrated increases, often significant, in the amount of rainfall that must be managed by stormwater infrastructure systems. However, Atlas 14 was only based historical observations: the Atlas 15 update, which is scheduled for release in 2027, will incorporate climate change projections in the rainfall estimates. Preliminary data suggests that under Atlas 15, the severity and frequency of major and extreme storm events are expected to increase, which will exacerbate flooding and induce further wear on aging infrastructure systems. This will in turn require future revisions to design standards and floodplain regulations and integrated resiliency planning for stormwater infrastructure.
OPERATION AND MAINTENANCE
MS4s, local communities, special districts, drainage districts, private owners, and TxDOT are responsible for operations and maintenance of stormwater infrastructure. Stormwater infrastructure within MS4s is required under the TPDES program to have ongoing maintenance plans. Nationally, only 44% of stormwater systems conduct an ongoing asset management program. Smaller communities and private developments not covered under the NPDES program typically lack adequate funding and staff to regularly inspect their storm sewer infrastructure. According to the WEF 2022 MS4 Needs Survey, the top operational concerns include the ability to evaluate storm sewer infrastructure life-cycle costs and the prioritization of assets for maintenance and replacement.
PUBLIC SAFETY
Approximately 67,000 square miles of the State are in 100-year or 500-year regulatory floodplains, putting more than 5 million Texas residents at risk of extreme flood events. The impacts of future rainfall projections will likely expand the extent of flood risk across Texas. Through June 2024 there have been 379 federally declared disasters, of which 105 have involved flooding, hurricanes, severe storms, or coastal storms that have caused widespread flooding and resulted in billions of dollars in damage and repair costs. Hurricane Harvey, which made landfall in southeast Texas in August 2019, caused nearly $125B in damage alone. Since 1953, every county in Texas has experienced at least one federally declared flood disaster.
Efforts at the state, local, and individual levels are being made to address flood risk and mitigate the costs of potential damage. Through the Texas FIF, the State has allocated approximately $1.4B to fund projects identified in the State Flood Plan. As of December 2023, Texas has nearly 664,000 flood insurance policies in force through the NFIP, with more than $200B in coverage. The TWDB is enhancing data for infrastructure improvement decisions, including flood resource guides, early warning systems, and flood awareness communication. Larger communities are implementing early warning systems and structural barriers (flood gates, flood barrels, etc.) to lessen flood impacts.
RESILIENCE
Resilient stormwater infrastructure systems must minimize the threat of damage and loss of life during major events and facilitate rapid recovery from disruptions to service. In larger communities across Texas, the increasing levels of urbanization and continued population growth are leading decision makers to adopt more progressive design standards and criteria for stormwater infrastructure systems to adapt to more frequent, intense, and prolonged major storm events. Smaller communities, by contrast, are more focused on balancing development needs against stormwater quantity control under current standards. Stormwater infrastructure planning and implementation in Texas is increasingly better coordinated with local and regional development and hazard mitigation planning initiatives and is beginning to consider a balance of grey and green infrastructure.
INNOVATION
Population growth, aging infrastructure, and the impacts of more severe and frequent major storm events are straining Texas’ stormwater systems. In response, municipalities and agencies across Texas are implementing innovative solutions to minimize flood risk.
TWDB’s Flood Priority Research Program is enhancing data for infrastructure improvement decisions. Projects include flood resource guides, early warning systems, extreme rainfall evaluations, highwater mark inventories, flood awareness communication, infrastructure assessment methodologies, agricultural flood loss models, nature-based mitigation solutions, and future rainfall frequency grids.
PHOTO: LADY BIRD LAKE FLOODING, OCTOBER 2018; REBECCA KATZE
RECOMMENDATIONS TO RAISE THE GRADE
• Continued funding into the Flood Infrastructure Fund will be necessary to address the funding gap of local communities to implement flood risk reduction solutions.
• Expand innovative funding strategies like stormwater or drainage utility fees for Texas cities and counties to establish dedicated funding sources.
• Improve the inventory and assessment of existing stormwater and flood infrastructure by local governments using GIS-based asset management systems.
• Flood mitigation designs should consider environmental and climate impacts, sea level rise, subsidence, future population growth, and other factors, with programs to include future updates from NOAA when they are made available.
• Continue to update FEMA FIRM maps using the most recent scientific data, updated models, and updated rainfall rates for all watersheds in the State.
• Consider the adoption of statewide floodplain management standards and encourage communities to adopt higher standards such freeboard and compensatory flood storage.
• Encourage and possibly incentivize communities to explore the broader use of stormwater retention and detention strategies, including nature-based solutions, green infrastructure, regional systems, and public/private partnerships.
• Encourage communities to create and/or enforce development standards which consider alternative design practices and the most recent NOAA Atlas 14 rainfall data.
• Point source and nonpoint source pollution should be addressed through a watershed approach that encourages regional coordination to improve impacts from stormwater-induced pollution.
• Office of Water Prediction, NOAA Atlas 15: Update to the National Precipitation Frequency Standard
• National Oceanic and Atmospheric Administration; Atlas 14, Volume 11, Version 2.0
• National Weather Service Office of Water Prediction; NOAA Atlas 15: Update to the National Precipitation Frequency Standard
• Texas Commission on Environmental Quality; Nonpoint Source Program
• Texas Water Development Board; 2024 State Flood Plan
• Texas Water Development Board; Flood Research
• US Environmental Protection Agency; Stormwater Discharges from Municipal Sources
• United States Global Change Research Program; Impacts, Risks, and Adaptation in the
• United States: Fourth National Climate Assessment, Volume II
• Water Environment Federation Stormwater Institute; 2022 National Municipal Separate Storm Sewer System (MS4) Needs Assessment Survey Results
• WEF 2022 MS4 Needs Assessment Survey
• Various agency websites
TRANSIT
EXECUTIVE SUMMARY
Public transit services in Texas are provided primarily by three types of entities: rural transit districts, large and small urban transit districts, and metropolitan transit authorities. Across the State, public transit ranges from light rail and bus services in metro areas to on-demand and curb-to-curb shuttle and van rides.
Texas transit is funded through a combination of federal, state, and local funding mechanisms. The Texas Triangle (DFW-Houston-San Antonio/Austin) continues to experience rapid growth. Texas now has 42 cities with a population of 100,000 people or more and a non-urbanized population of 6.9M people accounting for only 24% of total State population. Eight metropolitan authorities, 32 large and small urban area transit districts, and 36 rural transit districts accounted for 205 million rides in 2023, with 89% of those rides taking place within the area of the metropolitan districts. Ridership is up from the previous year and continues to recover from the effects of the COVID-19 pandemic. Service has returned to within 2% of pre-pandemic levels and ridership is at approximately 75% of pre-pandemic levels. As Texas’ population continues to grow and urbanize, project costs increase, and right-of-way is limited, transit becomes an increasingly important travel mode. Funding transit will be critical based on a 2018 report. Multi-year capital needs for transit in Texas require a funding level of approximately $4 billion per year. Based on the current available information, the 2025 Texas Infrastructure Report Card recommends a Transit sector grade of D+, down from a B- in 2021. This downward trend is not entirely indicative of a poorer performing transit system but is better aligned with the data driven approach undertaken for this reporting cycle.
Cities and Counties Served by General Public Transportation Systems
1. Cities and Counties served by General Public Transportation Systems
CONDITION AND CAPACITY
Multiple public transportation agencies operate across the State of Texas, focused on delivering safe and timely trips, while expanding and modernizing their systems.
Public transit infrastructure varies based on location. In many rural and some of the urban districts, less infrastructure is required as the transit services offered focus on van shuttle services and/or limited bus networks. This is significantly different than the complex metropolitan districts, which include more diverse systems, such as light rail, commuter rail, and Bus Rapid Transit (BRT) systems. Several major cities, including Houston, Dallas, Austin, and San Antonio, have invested in expanding their public transit systems in recent years. This includes adding new bus routes, extending light rail lines, and launching BRT systems.
Major elements of any transit program include rolling stock/vehicles, stations, maintenance facilities, signaling and control systems, guideways, rail, and dedicated roadway. Across Texas, these elements are in different states of need, mostly due to their service age. Unlike bridge or roadway condition rating, there is no set standard criteria at the state level to grade these systems, so maintenance costs have been the metric to grade the overall condition of each system.
FIGURE
Overall, Texas transit continues to recover from the COVID-19 pandemic, with ridership returning to 205 million, approximately 75% of pre-pandemic ridership levels, which is in line with national trends. Statewide, an additional 68.4 million passengers need to return to resume to 2019 ridership levels.
Per the FY2023 Texas Transit Statistics issued by Texas Department of Transportation (TxDOT):
OPERATIONS, MAINTENANCE, FUNDING, AND FUTURE NEEDS
Every two years, the Texas Legislature appropriates state funding to support both urban and rural transit districts. Additionally, the annual budget is examined and approved in collaboration with the Texas Transportation Commission, which is appointed by the Governor. For Fiscal Year (FY) 2024, $96 million was approved. Conversely, operations for metropolitan transit authorities are funded through local sales taxes that range from 0.25% to 1%, which provides an annual budget of more than $2.2 billion.
Increasing pressures from inflation have detrimentally impacted operational budgets across the State over the past five years. Transit agencies balance maintaining service equal to pre-pandemic levels, incorporating additional safety improvements, and providing customer satisfaction while facing higher costs for fuel, labor, materials, equipment and insurance. These costs are most apparent with the metropolitan transit authorities, as observed by the increase in costs per revenue mile, seen in figures 3 and 4. The result is a 7% increase in the cost per revenue mile from FY 2022 to FY 2023.
FIGURE 2. Statewide 2022 and 2023 passenger ridership in trips (MTA, 5307, 5311, & 5310 Programs)
While each agency has its own processes for maintaining assets and reducing its backlog, the Federal Transit Administration (FTA) is implementing the Transit Asset Management system to provide a standardized measure of asset conditions across the country. In recent years, Texas has approved significant funding for transit maintenance and improvements. TxDOT allocated more than $146 million of its $37 billion budget for transit projects in 2022, which included provisions for maintenance, purchasing new buses, and building new facilities. This funding is available for both rural and urban areas, covering more than 90% of the state’s land area (with the remaining 10% as part of the metropolitan districts). Key initiatives included constructing bus storage and maintenance facilities for systems such as Concho Valley Transit in west-central Texas and expanding service areas for other regions. The Metropolitan Transit Authority of Harris County (METRO), which serves the state’s largest city, Houston, spends the most of any transit agency in Texas on maintenance. METRO oversees the largest transit system in Texas’ most populous metropolitan area. Due to its extensive fleet of buses servicing its 83 local bus routes and 31 commuter bs routes, three light rail lines, and numerous facilities, METRO allocates significant funding for ongoing maintenance and repairs to ensure the reliability and safety of its services. In 2023, METRO allocated more than $100 million for operations and maintenance. Dallas Area Rapid Transit (DART) and VIA Metropolitan Transit in San Antonio also have significant maintenance budgets ranging in the tens of millions of dollars annually.
PHOTO: METRORAIL TRAIN IN DOWNTOWN AUSTIN TRAFFIC, CAPITAL METROPOLITAN
FIGURE 3. Cost per Revenue Mile Year-Over-Year Percent Change FY 2022 to FY 2023
FIGURE 4. Cost per Revenue Mile Five-Year Percent Change FY 2019 to FY 2023
The table below provides a summary of funding for the larger metropolitan transit agencies. Nearly all the agencies have major capital expansion programs, which are significant when compared to their operating expenditures. New Capital Expenditure (CapEx) will need additional Operational Expenditure (OpEx) in future years. Longer term funding (or private equity financing opportunities) should be further examined to maintain life-cycle costing, addressing the needs of CapEx and OpEx of existing, expanding or new transit systems.
PUBLIC SAFETY
Across Texas, transit-related safety incidents have increased over pre-pandemic levels, potentially driven by a population increase in the metropolitan areas across Texas. This increase may not indicate decreasing performance of the transit systems but rather reflect how the public is interfacing with transit. Another contributing factor that may be the increase is enhanced reporting as required by the FTA’s National Transit Database1 and TxDOT, yielding more accurate and timely data. The table below illustrates safety incidents over the past three years. The National Transit Database defines “safety incidents” as fatalities, injuries, and/or property damage costing above $25,000. Upward trends can be seen in the metropolitan and small urban transit districts, whereas large urban and rural levels have stayed approximately the same.
In addition to improving collecting and updating safety data, Texas is currently seeing new developments in its highway-rail grade separation programs, supported by federal and state funding. The Federal Railroad Administration (FRA) has announced more than $1.1 billion in grants nationally under the Railroad Crossing Elimination (RCE) Grant Program for 2024. This funding supports projects such as constructing overpasses and underpasses and improving rail safety devices at crossings, particularly in areas where blocked crossings cause traffic issues or pose safety risks.
RESILIENCE
Following the freeze of 2021, the State has invested in strategic initiatives towards a more resilient transit network while mapping the criticality and vulnerability of assets. Key priorities and goals ensure transit can function during extreme events while adapting to long-term change. These initiatives include improved monitoring using the Internet of Things (IoT)-enabled sensors and cameras, increased agency coordination to respond to events, and improved design standards to increase the resiliency of transit across the State. In Texas, several major transit projects focus on improving the State’s ability to withstand extreme weather events and other disruptions. These initiatives are designed to enhance infrastructure durability, protect public transit assets, and ensure continuity of services during emergencies. Some key projects include:
• Houston METRO’s Hurricane Resiliency Projects: After Hurricane Harvey, METRO began elevating facilities, flood-proofing bus depots, and reinforcing rail lines to prevent damage from future flooding. Additionally, METRO is upgrading power systems and backup generators to keep transit running during outages.
• DART’s Infrastructure Reinforcement: Improvements to enhance the resiliency of its light rail and bus services including implementing stormwater management systems to handle heavy rainfall and prevent flooding of key transit routes.
• TxDOT’s Rural Transit Resilience Programs: Working on improving rural transit systems’ resilience, such as bridges and roadways that support transit routes, especially in areas prone to flooding or extreme heat.
• VIA Metropolitan Transit’s Green Infrastructure: Initiated projects to reduce the environmental impacts of its operations including installing solar panels on transit facilities, incorporating electric buses, and building storm-resistant transit hubs. These initiatives are part of a broader effort to protect Texas’ transit systems from natural disasters and future effects of climate change.
INNOVATION
Texas continues to adopt proven transit technologies to improve current operations and prepare for the future. Autonomous vehicle technology is a major factor in the transformation of transit for both urban and rural areas, as it will eventually offer improved, safer, and more accessible transportation. Several pilot projects for autonomous shuttles are being developed across the State, such as the Arlington Rideshare, Automation, and Payment Integration Demonstration (RAPID) program, the Drive.ai service in Frisco, and the Houston METRO Autonomous Vehicle testing program. These projects may eventually provide insights for deploying autonomous vehicles in rural areas, where transit options are often limited, and distances are longer.
Texas has also been exploring the use of microtransit, which is a flexible and demand-based service which can complement fixed-route transit. Microtransit helps fill traditional transit’s gaps in coverage, frequency, and accessibility, especially in suburban and rural areas. The cities of Kyle, Pflugerville, and Round Rock have adopted various microtransit programs to augment their transit footprints, and many other municipalities such as Laredo are exploring similar services. Innovative programs such as fleet electrification are also crucial to lowering the environmental impact of transit while reducing maintenance costs. Houston Metro has completed initial efforts to develop one fully electric bus line and will serve as a proving ground for future fleet electrification projects.
Additionally, innovation is fostered through innovative contracting solutions, such as performance-based contracts, or alternative delivery mechanisms such as the Construction Manager/General Contractor (CM/GC) method or Progressive Design-Build. Currently, Austin Transit Partnership, a joint entity between the City of Austin and CapMetro, is examining how to best deliver Project Connect, which will add a new light rail system, improving existing commuter rail service and expand bus routes across the city of Austin. Austin voters approved the package of transit improvements and the dedicated funding to pay for the investments in 2020 after years of community planning and engagement, leading to improved delivery quality and equity. This project, however, has faced legal challenges at the state level, with the Texas Attorney General challenging the legality of the funding system. Furthermore, at the time of the previous Texas Infrastructure Report Card, Houston Metro was preparing for a number of BRT additions. With the changing administration, a number of these projects have been shelved.
RECOMMENDATIONS TO RAISE THE GRADE
• Establish and provide legislation for sustained investments (and invite private equity to partner) capitalizing on the socioeconomic, environmental, and other commercial benefits of transit and rail transportation.
• Adequately fund state of good repair projects to reduce the associated backlog.
• Address significant escalations in capital costs to narrow the gap between investment needs and funding available.
• Implement FTA requirements for rail and facility inspections and rating by developing standardized grading criteria for other transit systems including signaling and traction power systems, similar to that of road and bridge condition assessments. This is to truly understand the condition of the transit systems and make them publicly available.
• Examine how intra-state transit planning is being developed and leverage lessons learned from other state entities. With the sustained growth of the Texas triangle, commerce between the cities of Dallas, Fort Worth, Houston, Austin, and San Antonio will need to be supported by systems that allow people to travel more freely, without further burdening other transportation systems at capacity.
• Quantify the benefits of transit in the larger context of Texas and U.S. economy, such as reducing congestion and supporting economic development.
• Support and stimulate educational and training programs that address the longterm labor availability. The transit industry relies on attracting and training the labor force to match the evolving technologies and demands of a modern, efficient, safe, and reliable multi-modal transit transportation system.
• Reduce fragility of existing transit rail lines and improve the State’s resiliency and redundancy by supporting new initiatives focused on operational and maintenance costs and efficiencies. Assess vulnerability and align capital improvements to increase the resiliency of transit systems to extreme heat, precipitation, and electric grid disruptions.
TR ANSIT
Sources
1. The National Transit Database (NTD) was initiated in 1974 by the Federal Transit Administration (FTA) as a primary source for statistics on the transit industry in the United States. The database was established under Section 5335 of Title 49 of the U.S. Code, requiring transit providers receiving federal funds to submit annual reports with financial, operational, and asset information. This data is used to allocate federal funds and supports public transit policy, planning, and research.
• https://www.txdot.gov/content/dam/docs/government/texas-transit-statistics-report-2023.. pdf
The wastewater industry in Texas is currently resource constrained. Whether the resource is funding from federal, state, or local agencies, personnel to operate and maintain wastewater infrastructure, science and engineering professionals to innovate quicker, economical, or durable solutions, it all stems from the available resources to advance infrastructure improvements.
Texas’ increasing population is intensifying the State’s already stressed wastewater infrastructure. Available funding from Federal and State sources is not near enough to support the demand for new infrastructure as well as rehabilitation needs, placing financial shortfalls on local entities. Although there are some innovative and resilient efforts in the wastewater arena, the basic funding needs far outweigh many of these efforts.
To improve the current wastewater infrastructure conditions, the wastewater industry must secure additional funding for new infrastructure, rehabilitation, and replacement of existing systems. Funding may require educating wastewater users on issues impacting functionality of the system alongside implementing rate increases. Additionally, discussions with Federal and State government officials regarding future wastewater funding opportunities are necessary. Texas wastewater professionals will continue to find more innovative, resilient, cost-effective solutions that both protect the State’s natural resources and improve its infrastructure.
CONDITION AND CAPACITY
Wastewater is generated from households, commercial businesses, and industrial operations. The Texas Commission on Environmental Quality (TCEQ) is responsible for permitting authorized wastewater discharges and monitoring waterways to ensure they meet state and federal water quality standards.
Like much of America, Texas’s wastewater pipeline infrastructure is extremely old and has deteriorated due to mineral buildup, clogging due to fats, oils, and grease (FOG), rags or wipes, or they have simply deteriorated due to age and air pressure changes that have caused extensive corrosion and cracks. Damaged pipes cause other equipment within the system to work harder to compensate for these failures, significantly accelerating wear on the overall system. Urbanization tends to magnify any issues already inherent in the system.
According to the U.S. Census Bureau, as of 2022 nearly 80% of the US population lives in an urban environment. Loosely defined, the Census defines an urban environment as “densely developed residential, commercial, and other nonresidential areas.” According to the Texas Demographic Center, Texas’ population is expected to increase more than 70 percent between 2020 and 2070, from 29.7 million to 47.4 million residents.
FIGURE 1. Replacing existing pipe through Pipe Bursting Methods in Euless, TX
FIGURE 2. Forecasted Population in Texas through 2060.
With an increased population in urbanized areas and a projected increase of nearly 70 percent within Texas by 2070, the wastewater infrastructure must be prepared to handle the demands of both existing and future residents.
Some wastewater treatment plants and collection systems in the State are subject to becoming overwhelmed by heavy rainfall events and stormwater flooding through inflow and infiltration. Inflow and infiltration occur when rainwater (through stormwater runoff) or groundwater seeps into sewer pipes through cracks, pipe joints, or deteriorated manholes.
As a result, the volume of flow can sometimes exceed the capacity of the wastewater sewer system or treatment plant. When inundated, these systems can discharge untreated stormwater and wastewater directly to nearby streams, rivers, and other water bodies, resulting in a sanitary sewer overflow (SSO) event.
According to TCEQ, an SSO is defined as an unauthorized discharge of untreated or partially treated wastewater from a collection system or its components (e.g., a manhole, lift station, or cleanout) before reaching a treatment facility. [See also Texas Water Code Paragraph 26.049(e)(4).]
TCEQ’s voluntary SSO Initiative encourages corrective action before there is harm to human health and safety or the environment. According to the fiscal year (FY) 2023 – FY2024 Biennial Report to the 89th Legislature, between 2022 to 2023, wastewater investigations were reduced from 5,236 events in 2022 to 5,182 in 2023. When SSO events persist, consent decrees may be implemented. Consent decrees are tools for legally enforcing water quality compliance. These actions are expected to require funding for additional repairs over the next 10-15 years. In Texas, cities like San Antonio, Houston and Tyler are well into their negotiated EPA consent decrees along with Corpus Christi, which is the most recent city in Texas to begin implementation of their consent decree.
Publicly Owned Treatment Works (POTWs), often referred to as Wastewater Treatment Plants, are owned by the State or a municipality and include certain political subdivisions created by the State which provide regional municipal and industrial wastewater treatment. Privately owned domestic wastewater treatment facilities are not owned by a governmental entity and are typically built to provide wastewater service to residential or commercial developments.
The TCEQ requires domestic wastewater treatment facilities to conduct planning for additional future flow that may occur due to population or other growth in the area. TCEQ implements the 75/90 rule that is found in 30 TAC 305.126 and has the following requirements for future planning at domestic wastewater treatment facilities:
1. Whenever flow measurements for any sewage treatment plant facility in the State reaches 75% of the permitted average daily or annual average flow for three consecutive months, the permittee must initiate engineering and financial planning for expansion and/ or upgrading of the wastewater treatment and/or collection facilities.
2. Whenever the average daily or annual average flow reaches 90% of the permitted average daily flow for three consecutive months, the permittee shall obtain necessary authorization from the commission to commence construction of the necessary additional treatment and/or collection facilities.
These growth projections necessitate the construction of new treatment systems, capacity expansions, and operations and maintenance improvements within existing systems. Approximately 20% of new homes use on-site sewage facilities (OSSFs), also known as septic tanks. Texas has seen an increase of 30% in the number of OSSF permits issued from 2017 to 2022. These OSSFs, although suitable for protecting public and environmental health, typically rely on household owners for system operation and maintenance (O&M). When O&M practices are inadequate, a system’s condition deteriorates and capacity diminishes, yielding inconsistent performance.
FIGURE 3. Example of Sanitary Sewer Infiltration
FIGURE 4. Example of Sanitary Sewer Overflow
5. Location of Wastewater Treatment Plant (WWTP) outfalls within Texas (source: TCEQ)
According to TCEQ, the State of Texas currently has 2,513 active wastewater permits for POTWs and 771 active domestic wastewater permits issued for privately owned wastewater treatment facilities. TCEQ’s Annual Enforcement Records, a summary of the number of violations are listed below (from all Regional Offices):
In addition to the reported inability to adequately manage capacity increases across the State, Texas (along with much of the United States) continues to experience changes in weather patterns. The week of February 11-20, 2021, the State experienced record setting winter storms, Uri and Viola, where six to nine consecutive days of freezing temperatures occurred, breaking records for the longest freezing streak in the State’s recorded history. Most sanitary sewer systems have experienced system operation challenges including loss of power to entire wastewater facilities. Weatherization and resiliency improvements are now being implemented as priority activities for wastewater systems, adding weatherization to the long list of high priority capital needs already noted herein.
FIGURE
OPERATION AND MAINTENANCE
Wastewater infrastructure may be owned by a public, private, or cooperative entity, and the O&M may be conducted by the owners or subcontracted. As utilities face the challenges of meeting increasingly stringent water quality regulations, funding significant infrastructure replacements, and providing affordable services amid growing public and environmental health risks, the option of merging (utility consolidation) may unlock financial, technical, and managerial resources to meet current needs and adapt to future demands.
According to the U.S. Conference of Mayors, trends among municipal WWTPs show that nationwide O&M expenditures have increased by approximately 4% annually from 1993 to 2017, an increase partially due to deferred capital expenditures. Depending on the type of WWTP and the collection system, O&M spending varies. In rural areas where decentralized systems are common, the responsibility to coordinate and finance O&M activities ranging from $250 to $500 every three to five years falls on homeowners. However, with little to no instruction or oversight from state regulatory agencies, if O&M goes unaddressed, systems may fail, costing homeowners between $3,000 and $7,000.
The 2022 Wastewater State of the Industry Report shows that 93% of survey respondents indicated that their operating costs have increased from 2021 to 2022, with only 3% stating that there was no cost change and 3% seeing decreases in costs. These operating costs, however, do not correlate with budgets. Only 65% of respondents report that they expect to see an increase in their 2023 operating budgets, 28% expect no change in budget; and 6% expect to see a decrease in budget.
Urbanized cities will require more inter-agency collaboration and data sharing, particularly as maintenance needs grow. In a 2019 American Water Works Association (AWWA) report, as much as 62% of wastewater pipeline maintenance performed by combined utilities occurs through the proactive execution of asset management plans; the remaining 38% is completed as a reactive response to failures. The report goes on to mention that since 2017, replacement rates for wastewater collection pipes have essentially stagnated. Nevertheless, in 2020, Bluefield Research estimated that utilities throughout the country will spend more than $3 billion on wastewater pipe repairs and replacements, addressing 4,692 miles of wastewater pipeline. This value translates into more than $18 per wastewater customer, a cost that is projected to grow by an average of 5% annually.
There was a change in the social habits during the Coronavirus pandemic that further stressed wastewater infrastructure. During the pandemic, many cities saw an uptick in the use of “flushable wipes” due to limited supplies of toilet paper and marketing campaigns stating that these wipes were both cleaner and safer to send into the sewer system. While these wipes may provide convenience and a sense of cleanliness, they can cause an issue known as ragging in the sewer system which is shown in the photo below.
FIGURE 6. 2022 Wastewater State of the Industry
Another major issue facing operations and maintenance crews dealing with wastewater infrastructure is the challenge of fats, oils, and grease. While many Texas cities have an active FOG program and community outreach, there are other cities that fail to educate their residents on what they can do to prevent buildups of FOG within their systems. Fats, oils, and grease that are sent down the drain eventually solidify in the sewer pipe. The solidifying FOG combines wipes, tree roots and other debris within the system potentially causing clogs and SSOs which may result in property damage, foul odors, road closures, and fines from regulatory agencies such as TCEQ.
Finally, the wastewater industry is facing the following four top workforce challenges: staffing shortages, talent attraction, retention, and providing competitive wages. The aging workforce and the impacts of changing workplace culture precipitated by the pandemic resulted in a reduced workforce and caused an increased risk of prolonged work hours or lack of professionals to meet the rising demand in the wastewater sector.
PUBLIC SAFETY
A significant percentage of American households (about 20 percent) are not connected to public treatment plants and instead rely on septic tanks or other privately owned community wastewater systems (CDC, 2023). According to TCEQ, there are currently 771 active permits for privately owned treatment facilities. According to the Centers for Disease Control (CDC), these privately owned wastewater systems play important roles in sanitation and disease prevention by removing harmful viruses, bacteria, and parasites. For communities in which any of those systems fail, the public health and socioeconomic consequences of uncontrolled sewage can be devastating. These systems can be damaged during an emergency such as a flood, hurricane, or earthquake. This damage can lead to contamination of the environment and drinking water supply and result in an increased risk for disease.
According to the 2022 Texas Integrated Report of Surface Water Quality for the Clean Water Act Sections 305(b) and 303(d), approximately 470 rivers in or bordering the State of Texas were listed as experiencing a Category 5 impairment, including sections of Upper Trinity River, Nolan River, Brazos River, the Guadalupe River, the San Antonio River, and several tributaries that flow into many other major rivers. (TCEQ, 2022 Guidance for Assessing and Reporting Surface Water Quality in Texas, 2022). A Category 5 impairment of a water body means that data or information shows that effluent limits are not stringent enough to implement water quality
FIGURE 7. FOG buildup in PVC pipe in Huntsville, TX
standards. These effluent discharges are pollutants that are measurable and must meet requirements known as Total Maximum Daily Loads (TMDLs). In Category 5 situations, these high levels of TMDL’s negatively impact surface waters by limiting or threatening at least one of its designated uses, requiring implementation of regulatory water quality limits to reduce further impairment.
Texas beaches continue to experience relatively high levels of contamination. (Lewis & Berman, 2022). Private septic systems, which are used in approximately 20% of new Texas homes, are also a major source of sewage pollution that have the potential to impact beaches and coastal areas. Deteriorating sewers can experience exfiltration (sewage leaking from pipes) or infiltration (groundwater or stormwater entering pipes, which can then cause overflows which can lead to harmful substances in recreational waterways. While failure rates and efficacy of septic systems depend on many factors like age, proper maintenance, and location, it is estimated that approximately 50% of all septic tank systems do not function properly. Sewerage spills are particularly dangerous for public health because they contain bacteria, viruses, and parasites more likely to cause illnesses and disease.
Many U.S. Water and Wastewater Systems (WWS) are using data-enabled capabilities to improve utility management, operations, and service delivery (McCarthy, Stea, & Faatz, 2003). As the water and wastewater industry continues to transition towards network-based approaches in data collection, operational technology, and security, cybersecurity-related vulnerabilities and risks associated with these to these systems also increase. With an ongoing increase in cyber threats, there is a consensus from the water and wastewater sector that additional cybersecurity measures are needed to protect this critical infrastructure.
Contaminants such as Per- and Poly-fluoroalkyl substances (PFAS) continue to be a growing concern for wastewater treatment operations. According to the EPA, researchers are continuing to evaluate technologies to identify PFAS contributors at their source, attempting to minimize their effects to wastewater streams by creating preventative or pre-treatment strategies which will reduce contamination in the surface and groundwater supplies. Texas has promulgated rules outlined in the Texas Risk Reduction Program (Texas Administrative
FIGURE 8. Texas River Basins
Code 30 Chapter 350) for ground water assessment and action in response to a PFOS/PFOA release. Around Texas, many utilities are undertaking sampling of water sources and evaluating the nationally recommended frequency for detection of these contaminants, with some of the larger utilities proactively implementing a more rigorous sampling frequency.
FUNDING AND FUTURE NEEDS
Wastewater infrastructure costs typically consist of the following:
1. Infrastructure costs which include the construction, maintenance, and repair items such as treatment plants, pipelines, and pumping stations and their supporting facilities (buildings, roofs, doors, fences, and any paving associated with these facilities).
2. Operational costs which are the day-to-day costs like labor, energy, chemicals, and equipment maintenance. These costs can be fixed costs or variable costs. For operations, the labor and equipment are usually fixed costs. Energy and chemicals will vary as the flow or loading to the system changes.
3. Compliance costs deal with meeting regulatory requirements and include testing, monitoring, and reporting to ensure treated wastewater adheres to environmental and regulatory standards. Municipalities must anticipate future changes in the treatment process, potential new tie-ins with municipal plants, future shifts in waste streams, and future regulatory adjustments.
4. Capital Expenditures include the replacement or upgrades of equipment and infrastructure.
5. Contingency Funds are money that is set aside for unexpected repairs or regulatory changes and is based on research and the knowledge of potential unknown conditions. The more that is known the less contingency that is needed. (Budgeting for Water and Wastewater Treatment Expenses (uswatercorp.com)
The funding mechanisms available to pay for wastewater infrastructure include: local user fees and taxes, state-specific grants or discretionary set-asides, federal grants or financing mechanisms, or a combination of all three. According to the Congressional Research Service, the federal government’s share of capital investment has fallen from 63% in 1977 to less than 9% in 2017. State and local entities shoulder most capital projects and O&M expenses, which were approximately $20 billion in 1993 and increased to $55 billion by 2017. Furthermore, state leaders have turned to levying local taxes, initiating restoration fees, and creating legislative set-asides to invest in wastewater infrastructure and to close the funding gap.
Nationally, a single-family residence pays an average rate of $504 annually for wastewater collection and treatment. According to the Texas Municipal League (TML), the average customer in Texas pays approximately $465 per year (tml.org). TML recently surveyed 285 cities and 25.4% of respondents have decided to postpone capital projects as part of their cost saving measures as well as implementing increases in wastewater fees, with an average increase in 2024 of 11%, the highest increase in over a decade. 2024 Fiscal Conditions (tml.org) Some WWTPs are recouping savings and generating profits by implementing innovative technologies that reuse water, recover energy, and recycle nutrients.
In 2019, Bluefield Research reported that state agency requests for Clean Water State Revolving Fund (CWSRF) funding surpassed $55.9 billion, indicating that the total, nationwide need significantly exceeded available funding. CWSRF grants require local entities like the Texas Water Development Board (TWDB) to match a portion of funds requested by local municipalities. Between 2020 and 2024, the TWDB has provided close to $2.19 billion in funding for nearly 165 projects throughout the State of Texas. (Financial Assistance Project Details | Texas Water Development Board)
Working in conjunction with EPA’s CWSRF program, the Water Infrastructure and Finance Innovation Act (WIFIA) is an additional long-term, low-cost funding mechanism for regionally and nationally significant, large-dollar-value projects. In FY23, the WIFIA Program announced availability of an estimated $7.5 billion in financing to support infrastructure projects. The WIFIA program has closed a total of 126 loans totaling $20.1 billion and has 61 pending loans totaling $11.9 billion. Of those loans, only 37.3% are for wastewater projects and 14.3% are for water reuse projects. WIFIA Fund Facts Dashboard | US EPA.
Although there are a multitude of federal programs designed to support wastewater infrastructure, there simply is not enough being allocated to meet the needs. Rates will continue to increase and/or much needed infrastructure repair and refurbishment will be delayed, unless a more comprehensive overhaul of the wastewater funding resources is implemented.
Funding Commitments Since Inception 1957 - November 2024
RESILIENCE
Resilience is the ability of a wastewater system to prepare for, withstand, recover from, and adapt to a range of natural, man-made or climate-related threats. Wastewater infrastructure vulnerabilities vary by geographic location, type of treatment system, age, and ownership status, making a “one size fits all” solution nearly impossible. Critical infrastructure decision-makers address short-term metrics like population growth, capacity demands, and affordability along with long-term factors such as sea-level rise, frequency, intensity, and the likelihood of natural disasters, cybersecurity threats, and post-interruption recovery time efforts into Risk and Resilience Assessments and Emergency Response Plans.
Cyber-attacks against critical infrastructure facilities are increasing The USEPA stresses that adopting cybersecurity best practices at drinking water and wastewater utilities is essential to protect communities from the increasing number and severity of cyber-threats. Past incidents have shown that these attacks have the potential to disable or contaminate the delivery of drinking water to consumers and other essential facilities. The USEPA has agreed to partner with co-regulators in the states to ensure that water and wastewater utilities employ essential best practices for cybersecurity to protect public health and there are many federal and state funding opportunities available to assist in increasing security of publicly owned treatment works.
According to the US Climate Resilience Toolkit, the safe collection and treatment of wastewater can be disrupted by extreme weather events. Municipalities may be able to avoid unpleasant issues by checking and addressing weather- and climate-related vulnerabilities of their wastewater treatment systems.
The process of treating wastewater emits relatively substantial amounts of methane gas (CH4). Wastewater treatment is the fifth largest human source of methane. As population increases, the demand for wastewater treatment facilities also increases. Methane emissions can be reduced through improvements to infrastructure, equipment, and innovations such as using this methane to produce renewable energy can help treatment facilities become waste-neutral instead of waste-generating.
Resource recovery from wastewater plants is also a growing industry. According to the American Biogas Council, Texas ranks 2nd out of 50 states for its biogas production potential, with current wastewater facilities able to provide approximately 46% of the total. The City of Dallas and the City of Fort Worth have both invested in biogas energy recovery facilities. Mining phosphorus for use as fertilizer or generating electricity from digester gas (anaerobic digestion is a sequence of natural processes by which biodegradable material is broken down in the absence of oxygen) presents opportunities to use the wastewater facility resources. However, these innovative technologies require large up-front capital expenditure investments that many wastewater facilities cannot afford.
Biosolids, or organic materials resulting from the treatment of sewage, produced at some Texas wastewater treatment facilities are safely and beneficially used in composting programs or in beneficial land application (organic fertilizer) through partnerships with the agricultural community. These land application programs have been challenged, due to location and environmental views, making it difficult for larger utilities to locate viable disposal options for their biosolids.
INNOVATION
As noted earlier, with the projected increase in population and the increased effects and costs of weather-related disasters, a combination of traditional means and new, innovative approaches to treatment and building are necessary to meet these challenges.
One way to meet growing demands for infrastructure is through Texas Water Districts and Authorities (WDs), which are local governmental entities that provide limited water-related services to customers and residents. WDs can be created by the Texas Commission on Environmental Quality (TCEQ), a county commissioner’s court, or the legislature. WDs issue both tax-supported and revenue debt and are governed by Texas Water Code, Chapters 49, 51, 54, 65, and Subtitle G of the Special District Local Laws Code. Texas has many types of WDs, but only two (2) provide sanitary sewer services to residential customers: municipal utility districts (MUDs), and special utility districts (SUDs). There are 1,700 MUDs in Texas, and 1,200 active SUDs, all of them outside city limits.
Many of these MUDs are located within the Extra-Territorial Jurisdiction (ETJ) - a designated buffer area located just outside of the city limits. Although the Water Code gives TCEQ a continuing right of supervision over all districts and authorities, TCEQ does not control the daily operations of infrastructure within individual MUDs or SUDs. Any decision concerning the daily operations of a district’s facilities are the responsibility of the district’s board. The MUD is led by a group of elected Board Members (typically from the community) with additional hired consulting staff which include engineers, attorneys, financial advisors, and operation and maintenance staff as required for existing infrastructure.
MUDs and SUDs can provide quick, cost-effective solutions for growing wastewater demands in the State in areas that are seeing large increases in population. It is an innovative way to provide capacity relief to larger regional treatment facilities and collection systems where sanitary sewer needs are quickly outpacing the ability to meet demand. MUDs and SUDs essentially provide a mechanism for the landowner to cover the costs to build the infrastructure for development. There are both opportunities and drawbacks to this infrastructure on demand. Since many of these systems are not constructed in any city or municipality’s jurisdiction, it is unclear if these smaller systems are built to regional standards or specifications. This could be a concern if, in the future, the MUD or SUD needed to connect to the larger regional facility. It also remains unclear whether these smaller wastewater treatment systems can be operated and maintained in a manner equivalent to those of their larger counterparts or if they will be able to adapt to future regulatory requirements.
There are both opportunities and drawbacks to this infrastructure on demand. Since many of these systems are not constructed in any city or municipality’s jurisdiction, it is unclear if these smaller systems are built to regional standards or specifications. This could be a concern if, in the future, the MUD or SUD needed to connect to the larger regional facility. It also remains unclear whether these smaller wastewater treatment systems can be operated and maintained in a manner equivalent to those of their larger counterparts or if they will be able to adapt to future regulatory requirements.
Rehabilitation of existing collection system infrastructure is a large piece of the puzzle to maintain existing capacity. New materials to reline old pipelines which maintain or increase capacity and add 100+ year life spans are currently being installed all over the State. Materials and methods such as cast in place polymer pipe (CIPP), Slip lining with Fiberglass/HDPE, and Geopolymer linings are being used to bring old wastewater pipelines back to life. Additionally, installation methods focusing on minimal disturbance to the area of construction, including various forms of tunneling are being implemented such as pipe jacking, micro tunneling, Horizontal Directional Drilling, and traditional tunnel boring operations.
In 2007, the 80th Texas legislature amended the code to allow alternative project delivery methods on wastewater projects. This positive change in legislation has allowed collaborative project delivery methods such as construction manager at risk (CMAR), Design Build (DB), Progressive Design Build (PDB), etc. for entities serving a population greater than 100,000 to be implemented. These delivery methods allow larger projects to be completed in short-term time frames and often at a guaranteed maximum price. As the need for faster project delivery increases, legislation will need to be more expansive to broaden the toolbox for all sizes of cities that are growing quickly beyond their existing infrastructure.
FIGURE 9. Installation of Packaged 110,000 GPD Wastewater Treatment Plant in Kendall County
FIGURE 10. Completed Installation of above Packaged WWTP in Kendall County, TX
TWDB reports that in 2020 wastewater made up 7.2% of new water supplies (as known as reclaimed water: recycled from wastewater and treated for non-potable uses). This is projected to double by 2070. Indirect potable reuse of wastewater occurs through the Texas rivers and lakes already – for example, a portion of Houston’s water is supplied by treated wastewater from the DFW area. The treated wastewater is discharged into the Trinity River which flows down to Houston where it is retreated and used to supplement Houston’s water supply.
Reclaimed water, also known as recycled water or reuse water, is domestic or municipal wastewater which has been treated to a quality suitable for beneficial use. Water has been reused for agricultural irrigation in Texas since the 1800s, and for industrial uses since the 1940s and 1950s in Odessa, Big Spring, and Amarillo. In 2022, Austin Water opened a cutting-edge onsite reuse system in its new Permitting and Development Center. Reusing the building’s blackwater, rainwater, and air-conditioning condensate is expected to save the city almost 1.5 million gallons of drinking water annually. The City of McAllen supplies 3.5 million gallons per day (MGD) of recycled water to the Hidalgo Energy Center for uses including cooling towers. The recycled water helps produce 477 megawatts of energy that serve the surrounding community. These non-potable reuse systems require separate conveyance and distribution systems to reach their end use; therefore, there is an additional cost beyond the treatment to implement this type of system and might be a barrier to more wide-spread implementation.
Although lagging non-potable reuse, direct potable reuse (DPR) is a future imperative, as the convergence of water stressors makes the tapping of new water supplies increasingly difficult, if not impossible, in metropolitan areas. As noted in previous Texas Infrastructure Report Cards, the cities of Big Spring and Wichita Falls currently operate DPR facilities (and the first two DPR projects in the United States) and El Paso’s Advanced Water Purification Facility will be the first direct-to-distribution potable reuse facility in the United States and will recycle up to 10 MGD.
Resource recovery from wastewater facilities continue to grow in application across the State. According to the American Biogas Council, there are more than 40 wastewater systems in Texas that convert biogas to energy. Additionally, Texas is ranked 2nd in the United States with the potential for biogas production potential. Mining phosphorus from the biosolids, or organic materials resulting from the treatment of sewage, produced at some Texas wastewater treatment facilities have been safely and beneficially used in composting programs or in beneficial land application (organic fertilizer) have been applied for decades in cities like Austin (Dillo Dirt). However, these innovative technologies require large up-front capital expenditure investments. These land application programs have been challenged, due to location and environmental views, making it difficult for larger utilities to locate viable disposal options for their biosolids.
PHOTO: FRISCO RECLAIMED WATER PUMP STATION; CITY OF FRISCO
FIGURE 11. Tunneling Construction
RECOMMENDATIONS TO RAISE THE GRADE
• Monitor the expansion of MUDs and SUDs to determine if public-private partnerships have the potential to drive needed infrastructure improvements in rapidly growing areas in Texas. Information gathering on these MUDs and SUDs should include discussions on the ultimate buildout of the area and if there is a plan or needs to be a plan in place to connect to regional facilities when the area reaches buildout.
• Infrastructure owners should engage in asset management practices to extend the lifespan of assets and prioritize limited funding. Future asset management principles may include AI to assist in the continuous assessment of the condition of assets and prioritize investment decisions based upon a comprehensive suite of data that includes pipe materials, age of pipe, O&M data, geographical location, and other critical information set by each municipality.
• Collaborations between researchers, technologists, wastewater utilities and operators, and federal decision-makers are needed to develop and quickly deploy regulations, systems, public safety education, and policies that address concerns such as per- and polyfluoroalkyl substances (PFAS, forever chemicals), pharmaceuticals, or biological and viral components in the wastewater stream and in residual solids removed from the waste stream.
• Expand the use of reclaimed water (purple pipe) as a viable alternative for large landscape irrigation (golf courses), parks, and highway medians.
• Expand EPA’s CWSRF program and the Water Infrastructure and Finance Innovation Act (WIFIA) with additional long-term, low-cost financing mechanisms for regionally and nationally significant, large-dollar-value projects. Streamline these programs to make it easier for smaller municipalities to obtain funding and grants needed for smaller projects.
• Develop a federal grant pilot program for publicly owned wastewater treatment plants whose purpose is to create or improve waste-to-energy systems that increase wastewater treatment efficiency. (Biogas, biosolids)
• Incorporate geographically specific, projected impacts of climate change into wastewater infrastructure planning and long-term funding decisions.
• Set responsible, resilient utility rates and user fees: Pursue utility rate increases to fully account for the full cost of service, including capital, maintenance, and operating needs. This should include life-cycle costs, materials, labor, inflation, and resilience upgrades necessary for extreme weather. Utilities should ensure their rates cover the full cost of service including operations, maintenance, and capital needs; clearly communicate rate increases to the public; and balance local issues of affordability.
• As all wastewater systems face multiple and increasing natural and cyber threats, a rule like America’s Water Infrastructure Act of 2020 should be implemented to direct utilities to develop, update, and implement vulnerability (risk and resilience assessments) and emergency response plans.
• Encourage new technologies, methods of construction, and use of materials. Municipalities should be open to Design-Build and alternative delivery methods.
• Expand or increase number of cities that participate in public outreach programs to encourage public knowledge in areas such as FOG, “flushable wipes” and “Don’t Flush Your Meds”
Sources
• Brey, J. (2024, June 19). Governing. Retrieved from When $20 Billion Isn't Enough: Water Infrastructure: https://www.governing.com/infrastructure/when-20-billion-isntenough-water-infrastructure
• CDC. (2023). Centers for Disease Control and Prevention. Retrieved from Water, Sanitation, and Hygeinie (WASH)-related Emergencies and Outbreaks: https://www. cdc.gov/healthywater/emergency/sanitation-wastewater/index.html
• CISA. (2021, October). Cybersecurity & Infrastructure Security Agency. Retrieved from Cyber Risks and Resources for the Management of Water and Wastewater Systems Sector: https://www.cisa.gov/sites/default/files/publications/infographic-managewastewater-national-critical-function-102021-508.pdf
• Council, A. B. (n.d.). Biogas State Profiles: Texas. Retrieved from https:// americanbiogascouncil.org/resources/state-profiles/texas/
• Fox, R. (2023). Addressing PWS Cybersecurity in Sanitary Surveys or an Alternate Process. Washington DC: US Environmental Protection Agency.
• Gabel, E. (2024, September 18). Water Online. Retrieved from Why Can't America Fix Its Water Infrastructure?: https://www.wateronline.com/doc/why-can-t-america-fix-itswater-infrastructure-0001
• Information, N. C. (2024). Climate Monitoring. Retrieved from Climate Mapping: https://www.ncei.noaa.gov/access/monitoring/streaks/mapping/TX/832/20210219
• Lewis, M., & Berman, S. (2022). Safe for Swimming, 2022 Texas Edition, Pollution at our Beaches, and How to Prevent it. Austin: Environment Texas, Research and Policy Center.
• Lloyd Potter, T. S. (2022). Texas Demographic Center. Retrieved from Texas Population Projections Program: https://demographics.texas.gov/Projections/2022/
• McCarthy, J., Stea, B., & Faatz, D. (2003). Cybersecurity for the Water and Wastewater Sector: A Practical Reference Design for Mitigating Cyber Risk in Water and Wastewater Systems . McLean: National Institute of Standards and Technology.
• TCEQ. (2019, October). Texas Water Districts: A General Guide. Retrieved from https:// www.tceq.texas.gov/downloads/water-districts/guidance/gi-043.pdf
• TCEQ. (2022). 2022 Guidance for Assessing and Reporting Surface Water Quality in Texas. Austin: Texas Commission on Environmental Quality. Retrieved from https://www.tceq.texas.gov/downloads/water-quality/assessment/integrated-report2022/2022-303d.pdf
• TCEQ. (2023). Permitting Data for OSSF. Retrieved from https://www.tceq.texas.gov/ permitting/ossf/texas-historical-ossf-permitting-data
• TCEQ. (n.d.). Testimony of David W. Galindo Director, Water Quality Division, Office of Water House Natural Resources –Request for Information, Interim Charge #2. Austin: TCEQ.
• Texas Bond Review Board. (2023). Texas BRB Data Center Water District Debt Analysis. Retrieved from https://data.brb.texas.gov/local/wd/
• Texas Municipal League. (2023). Wastewater Fees by Population Category Summary. Retrieved from https://www.tml.org/Archive.aspx?AMID=41
• Texas Water, F. (2023, April). New Data Reveals Texas Water Workforce Challenges. Retrieved from https://www.texaswater.org/news/new-data-reveals-texas-waterworkforce-challenges
• TWDB. (2022). Future Population and Water Demand. Retrieved from State Water Plan: https://www.twdb.texas.gov/waterplanning/swp/2022/docs/04-SWP22_FuturePopulation.pdf
• TWDB. (2023). Use of Alternative Delivery Methods for Texas Water Development Board Funded Projects. Retrieved from https://www.twdb.texas.gov/financial/ instructions/doc/twdb-0570.pdf
• US Climate Resilience Toolkit. (n.d.). US Climate Resilience Toolkit. Retrieved from https://toolkit.climate.gov/topics/built-environment/water-and-wastewater
• US Wastewater Services Corporation. (2024). Guide to Budgeting for Water and Wastewater Treatment Expenses. Retrieved from https://www.uswatercorp.com/aguide-to-budgeting-for-water-and-wastewater-treatment-expenses/
• USEPA. (2023, March 23). US Environmental Protection Agency. Retrieved from Route to Resilience for Drinking Water and Wastewater Utilities: https://www.epa.gov/ waterresilience/route-resilience-drinking-water-and-wastewater-utilities
• USEPA. (2023, March 22). Water Resilience. Retrieved from Route to Resilience for Drinking Water and Wastewater Utilities: https://www.epa.gov/waterresilience/routeresilience-drinking-water-and-wastewater-utilities
• WateReuse. (n.d.). Profiles in Reuse: Texas. Retrieved from https://watereuse.org/wpcontent/uploads/2023/09/Profiles-in-Reuse-Texas-v3.pd
With each Report Card update, the ASCE Texas Section Infrastructure Report Card Committee members volunteer their time to work with ASCE Texas Section leaders and staff to prepare the Texas Infrastructure Report Card. This year’s Committee comprises 60 dedicated civil engineers from across the State with decades of expertise across all infrastructure category specialties. The Infrastructure Report Card Committee assesses all relevant data and references, consults with other technical and industry experts, develops summaries and assigns grades based on the data collected. The following individuals are responsible for the successful completion of the Texas Infrastructure Report Card:
Mrs. Gonzales is the Principal Engineer of GRIS Engineering, PLLC. She is experienced in various disciplines of engineering which have enabled her to practice with a comprehensive understanding of civil engineering principles. Her expertise spans land development, water and wastewater systems, drainage design, and transportation and roadway projects. As a leader in her field, Mrs. Gonzales is committed to serving her community through her profession. Her dedication is evident through her active involvement in various organizations. She has served ASCE as a committee member and held various leadership roles at the local, state, and national levels. She was recognized with the Service to People Award (2019) and Advocate of the Year (2021). Mrs. Gonzales is an alumnus of the 2014 Greater Houston Hispanic Chamber of Commerce (GHHCC) Emerging Leaders Institute (ELI) and Leadership Houston Class XXVI.
AUSTIN MESSERLI PE, M.ASCE | COMMITTEE CO-CHAIR
Mr. Messerli is a Project Manager at K Friese & Associates. Originally from Oklahoma, he earned a bachelor’s and master’s degree from the University of Oklahoma. Soon after, he relocated to Central Texas, and after 6 years, he is happy to call Georgetown home. For over 12 years, he has focused on Municipal, County, and DOT transportation projects across Texas, Oklahoma, and the surrounding states. The most exciting and satisfying part of this work is seeing all the various infrastructure components come together to create a safe, positive, and lasting impact for the public.
Austin is an active member of ASCE, first participating in the University of Oklahoma Chapter, where he eventually became president, then holding various positions professionally across Oklahoma and Texas. He serves as Austin Branch Vice President of Programs and Texas Section Infrastructure Report Card Co-Chair. Previously, he has served in various positions with the Government Affairs Chair, Communications, and younger members and participated in the National Legislative Fly-In, the Texas State Legislative Drive-Ins, MLRC, and student mentoring programs for UT. These roles with ASCE have helped him become part of a dedicated community of professionals united by a common goal to create lasting change and build a safer, more sustainable world through collaboration and innovation.
Aviation Subcommittee*
Jason Frank PE | Subcommittee Lead
Craig S. Covil PE
Bridges Subcommittee
Marcelo F. DaSilva PhD, PE | Subcommittee Lead
Sumanth Cheruku PE
Michael J. Hrncir PE
Yan Linwood PE, PMP
Anna Olveda
Arish Sajwani PE
Broadband Subcommittee*
Sean Droptini | Subcommittee Lead
Dams Subcommittee*
Nishant Dayal PE | Subcommittee Lead
Lei Wei
Drinking Water Subcommittee
Eelhard E. Meneses PE | Subcommittee Lead
John K. Baker PE, COL USA (Ret)
Julia Hunt PE
Denis W. Qualls PE
Energy Subcommittee*
Geoffrey D. Roberts Jr | Subcommittee Co-Lead
Oliver E. Smith Jr | Subcommittee Co-Lead
*Committee member name(s) withheld by request.
Vikrant Joshi
Wesley J. Oliphant PE
Les Pittman PE
Silky S. K. Wong PhD, SE, PE
Hazardous Waste Subcommittee
Mark K. Boyd PhD, PE | Subcommittee Lead
Trey Buzbee
Chuqi Huang
Dallas May PE
Levees Subcommittee
Frederic Ma PE | Subcommittee Lead
Stephanie Zertuche PE
Ports Subcommittee
Joseph E. Scarborough | Subcommittee Lead
Roger H. Hoh PE
Ashley Judith PE
Jessica Shambra PE
Public Parks Subcommittee*
Adam T. Giblin PE | Subcommittee Lead
Patricia Frayre PE
Hugo E. G. Hardwick
Rail Subcommittee
Craig S. Covil PE | Subcommittee Lead
Allen Bud Beene PE
Bruce C. Mann
Christopher J. Taylor PE
Roads Subcommittee*
Anjuman Ara PE | Subcommittee Lead
Nathan A. Kebede PE
Mohammed Abu Bakar Siddique PE
Solid Waste Subcommittee
Robert H (Holly) Holder PE | Subcommittee Lead
Brenda A. Haney PE
Abate T. Wolde-Kirkos
Stormwater Subcommittee
Adam P. Eaton PE | Subcommittee Co-Lead
Melvin Spinks PE | Subcommittee Co-Lead
Rebecca Katzke PE
Madison Koceich EIT
Shuchi Mishra EIT
Transit Subcommittee
Russell Ruplinger PE | Subcommittee Lead
Craig S. Covil PE
Wastewater Subcommittee*
Sarenna Moore | Subcommittee Lead
Tara Delagarza PE
George I. Farah PE
Carl T. Pitzer PE
ASCE Texas Section would also like to recognize the following individuals for their contributions to the Texas Infrastructure Report Card:
JULIE JONES PE, CFM, M. ASCE | 2025 VICE PRESIDENT FOR PROFESSIONAL AFFAIRS
Ms. Jones serves as the ASCE Texas Section 2024 Vice President for Professional Affairs and, as such, oversees the Infrastructure Report Card Committee. She is the Director of Water Resources at Nathan D. Maier Consulting Engineers, joining the team in 2008, and has an engineering background with experience in land development, drainage studies and designs, erosion control, FEMA studies, and transportation.
Ms. Jones is Past President of the ASCE Dallas Branch and continues to serve in the Dallas Branch. She is also an active member of Engineers Without Borders-USA. Ms. Jones earned her Bachelor and Master of Science degrees in Civil Engineering from The University of Arkansas at Fayetteville, and started her journey with ASCE there
KIMBERLY K CORNETT PE, F.ASCE | 2024 PRESIDENT
Ms. Cornett is the Regional Stormwater Manager for Lockwood, Andrews, and Newnam, Inc. (LAN), bringing over 25 years of expertise in water resource infrastructure. She specializes in guiding projects through all phases, from analysis to design, delivering innovative stormwater solutions tailored to North Texas communities. A recognized leader in her field, Ms. Cornett holds a Bachelor of Science in Hydrology and Water Resources from Tarleton State University and a Master of Science from the University of Texas at San Antonio. An active member of ASCE since 2002, Ms. Cornett has held leadership roles, including immediate Past President of the Texas Section.
MARK K. BOYD PHD, PE, DWRE, CAPM, M.ASCE | 2025 PRESIDENT
Dr. Boyd’s 40-year journey within ASCE began in 1984 as a member of the ASCE Student Chapter of SMU. Since then, he served on and chaired the 2021 Texas Infrastructure Report Card Committee, contributed to the Texas Section’s Centennial Celebration, and progressed through five years of leadership roles within the Dallas Branch Board of Direction.
Dr. Boyd currently works as a Sr. Environmental Engineer for Stantec. His career spans hazardous materials remediation, environmental compliance, water resources, hydraulics and hydrology, and geo-environmental studies. His expertise also extends to projects with the City of Dallas, the TxDOT, and Dallas Area Rapid Transit (DART).
A proud alumnus of SMU’s Lyle School of Engineering, with a PhD in Civil/Environmental Engineering, he has served as an adjunct faculty member at SMU since 2001, mentoring ASCE student members and aspiring engineers.
TRAVIS N. ATTANASIO PE, M.ASCE
With his experience working on the past two Texas IRCs, Mr. Attanasio—a sole proprietor with 20 years of private and public experience, served as an advisor for the 2025 Texas Infrastructure Report Card. He is a Past President of the ASCE Texas Section, a member of the ASCE Fort Worth Branch, and previously chaired ASCE Texas Section’s Infrastructure Report Card Committee, overseeing the development of the 2017 Texas Infrastructure Report Card. Travis served in the role of Vice President for Professional Affairs for ASCE Texas Section in 2017 and is a past committee member at the society-level, volunteering for ASCE Committee for America’s Infrastructure, and currently serves as the Chair of the ASCE Texas Section Subject Matter Experts Bureau.
OLIVER E. SMITH JR, A.M.ASCE
ASCE Texas Section extends a warm Thank You to Mr. Smith for his photographic services, giving a keen eye to find and capture Texas’ infrastructure at its best.
Mr. Smith served on the ASCE Texas Section Beyond Storms Infrastructure Network Resilience Task Committee, giving several technical and public awareness presentations on the Committee’s work product, the Reliability and Resilience in the Balance report on the 2021 Winter Storms impact on Texas’ energy grid infrastructure. He also served on the 2021 and 2026 Texas IRC Energy subcommittee.
After serving as Captain in the U.S. Army Corps of Engineers, his engineering career began at Humble Oil and Refining Company (now Exxon-Mobil), then as a construction engineer and oilfield production process engineer for Exxon Company USA. Later, he served as a construction engineer for process operations at BASF and Frito-Lay. With a graduate degree in hand, he worked as a construction management consultant and program controls manager at CH2M Hill supporting a California wastewater construction program. His career next took him to 3M working in engineering, process optimization, and manufacturing leadership; finishing his career in global supply chain leadership focused on production materials and resilient supply chain principles.
PHOTO: EAST TEXAS WIND FARM DURING SUNRISE: OLIVER SMITH
AGENCIES AND ORGANIZATIONS
ASCE Texas Section would like to thank the following agencies and organizations for their assistance and reference material utilized during the research and preparation of the 2025 Texas Infrastructure Report Card:
Airport Council International
Alamo Area Council of Governments
American Road & Transportation Builders Association
ASCE, Committee for America’s Infrastructure
Association of State Dam Safety Officials
Austin Transit Partnership
Benton Institute for Broadband & Society
Capital Area Council of Governments
Center for Disease Control and Prevention
City of Austin Parks & Recreation
City of Dallas
City of Dallas Parks and Recreation
City of Farmers Branch Parks and Recreation
City of Fort Worth
City of Fort Worth Parks and Recreation
City of Houston
Connected Nation
Cybersecurity & Infrastructure
Security Agency
Dallas County Trails and Open Spaces
Denton County Transportation Authority
Electric Reliability Council of Texas
Federal Aviation Administration
Federal Communications Commission
Federal Emergency Management Agency
Federal Highway Administration, National Bridge Inventory Data
Houston Galveston Area Council of Governments
Institute for Energy Research
National Highway Traffic Safety Administration
National Law Review
National Oceanic and Atmospheric Administration
North Central Council of Governments
Pew Research Center
Port Freeport
Port of Bay City
Port of Beaumont
Port of Brownsville
Port of Calhoun Port Authority
Port of Corpus Christi
Port of Galveston
Port of Harlingen
Port of Houston
Port of Isabel
Port of Port Arthur
Port of Victoria
Public Utilities Commission of Texas
Railroad Commission of Texas
Texas A&M Transportation Institute
Texas A&M University System
Texas Association of Regional Councils
Texas Broadband Development Office
Texas Commission on Environmental Quality
Texas Commission on Environmental Quality, Municipal Solid Waste Permits Division
Texas Commission on Environmental Quality, Dam Safety Program
Texas Department of Public Safety
Texas Department of State Health Services Asbestos Program
Texas Department of Transportation
Texas General Land Office
Texas Municipal League
Texas Office of the Governor, Development Council
Texas Parks & Wildlife Department
Texas State Soil and Water Conservation Board
Texas Water Development Board
Texas Water Infrastructure Network
U.S. Census Bureau
U.S. Department of Transportation
University of Texas
US Army Core of Engineers
US Environmental Protection Agency
Wate Reuse Association
Water Environmental Federation
ASCE TEXAS SECTION STAFF
Kimberly Garcia - Marketing Communication Specialist
Jennifer Peters CAE– Executive Director
ASCE STAFF
Gordon Chaffin – Senior Manager, Infrastructure Initiatives
Kevin Longley – Director, Public Affairs & Media Relations
Josh Shumaker – Director, Policy Research and Industry Engagement
PHOTO: VESSEL UNLOAD CARGO IN PORT ARTHUR; TXDOT
SOLUTIONS TO RAISE THE GRADES
To raise the Texas infrastructure grade, ASCE Texas Section urges action on the following policy statement:
Texas requires consistent and sustained investments to ensure safe and secure infrastructure, while also addressing future needs that consider economic and population growth.
This Report stands as a resource to bring awareness to the condition of our infrastructure based on eight key metrics (See Methodology > Grades) that directly impact the health, safety, environment, resources, and economy of Texas. Further action is necessary to bring our infrastructure up to satisfactory performance standards. We urge elected officials to reverse negative trends and act now on these recommendations.
INFRASTRUCTURE INVESTMENT
Infrastructure systems provide the essential physical facilities that allow people to move, produce goods and services, grow and expand business and commerce, manage waste for safe and healthy environments, and access clean water. They are the backbone of economies. Investments are required to develop and maintain conditions for these systems that are sufficient to operate and are safe for intended use. Additional dedicated infrastructure investment is needed across all infrastructure categories to expand, maintain, and operate efficiently.
• Appropriate funding and revenues to their respective source, such as Ports revenues to the Harbor and Maintenance Trust Fund
• Inject funding through grant programs, low interest loans, and public private partnerships
• Adopt appropriate fees with periodic review for rate adjustments to access capital for improvements; for example, utility rates for water and wastewater services
• Develop new dedicated funding revenues for utilities, such as a stormwater drainage utility fee
• Invest in research and advancement of technology, such as artificial intelligence (AI), for efficiency and safety
SOLUTIONS TO RAISE THE GRADES
POLICY AND REGULATIONS
Policies set regulations to establish requirements and standards that guide the development of infrastructure systems to ensure safety, efficiency, and reliability. Establishing clear standards ensures that infrastructure projects across all categories are technically sound, socially and environmentally responsible, and resilient. The framework of sound policy fosters design innovation, enhancing infrastructure systems' functionality and resilience. Furthermore, well-crafted policies and regulations can facilitate public-private partnerships, attracting investment and expertise from various sectors to accelerate infrastructure development. Such collaborations can lead to more efficient project delivery, better resource allocation, and innovative solutions to infrastructure challenges.
• Foster policies to deliver greater equity to underserved regions for infrastructure, such as broadband deployment and adoption
• Modify, remove, and develop new policies that enhance safety and remove risk, such as dam safety exemptions, updating hazardous clean-up regulations, and allowing solid waste projects to receive federal funding
• Adopt Safe Development Rules to mitigate the risk of high hazard infrastructure, such as development in inundation zones
• Make substantial improvements in the regulatory and permitting process to facilitate transparency and timely reviews
• Establish new state programs to manage existing assets, such as a Texas Levee Safety Program.
STANDARDS
Engineering design relies on standards to govern critical infrastructure systems, which are relied upon for safety, efficiency, and resilience. Advancements in technology, materials, and design methodologies are reshaping the infrastructure landscape and increasingly interconnecting these systems. Regularly reviewing and enhancing standards ensures efficiency and reliability. We must modernize standards across all counties to support a growing economy, lead innovation, and minimize risk and vulnerabilities to our infrastructure networks.
• Incorporating resilience in the design and maintenance of infrastructure systems to account for climate and environmental impacts such as sea level rise, increased heat, extended drought, and more intense rainfall
• Continue implementing technological advancements as requirements, such as NextGen systems for improving safe and efficient air traffic
• Adopt standards to reduce environmental impacts and nature-based infrastructure, such as pollution reduction, green infrastructure, and decarbonization strategies, to enhance resiliency
SOLUTIONS TO RAISE THE GRADES
ASSET MANAGEMENT AND PLANNING
A comprehensive understanding of existing assets across all infrastructure categories allows owners to plan, manage, optimize investments, and allocate resources effectively. The ability to assess condition and performance allows for prioritization of funding based on need and impact. The proactive approach to managing infrastructure also facilitates strategic planning and supports risk mitigation to extend asset life and service delivery. Regulatory zoning and development reforms should be considered to improve strategic land planning.
• State and Local infrastructure agencies should develop repositories of existing assets, such as GIS database to assess the condition
• Implement strategic planning to fund infrastructure through collaborative partnerships
• Continue utilizing non-destructive evaluation methods for efficient management and condition analysis
• Require infrastructure owners to maintain and inspect assets such as high hazard dams and hazardous waste
• Require emergency response plans or contingency plans to improve resiliency, such as hardening Energy infrastructure for reliability and storm response
These recommendations support a vision for a safe, reliable, and efficient infrastructure in Texas that will continue to drive prosperity and the economy forward.
ABOUT THE TEXAS SECTION OF THE AMERICAN SOCIETY OF CIVIL ENGINEERS
The Texas Section of the American Society of Civil Engineers (ASCE Texas Section) represents more than 11,000 members Statewide. Headquartered in Austin, the Texas Section unites 15 Branches, 7 Technical Institute Chapters, and 24 Student Chapters.
ASCE Texas Section belongs to ASCE’s Region 6, which includes the Mexico, New Mexico, and Oklahoma Sections. ASCE has more than 150,000 global members in 77 countries.
ASCE
TEXAS SECTION ADVANCES CIVIL ENGINEERING BY PROTECTING THE PUBLIC HEALTH, SAFETY, & WELFARE, DELIVERING VALUE TO OUR MEMBERS, AND CREATING A LEGACY OF SERVICE THROUGH STEWARDSHIP & SERVICE (THE WORLD AT LARGE), PROFESSIONAL DEVELOPMENT & LEADERSHIP (OUR MEMBERS), AND ADVOCATING FOR CIVIL ENGINEERING (THE PROFESSION).
Texas civil engineers are leaders in their communities, building a better quality of life across the street and around the world. We are constantly presented with the challenge of improving infrastructure. To fulfill our mission to protect public health and safety, and in keeping with the Code of Ethics all ASCE members adhere to, civil engineers must be involved in the policy making process at all levels of government. To contribute to the policy making process, ASCE Texas Section administers two major milestone grassroots projects: regularly publishing this report, the Texas Infrastructure Report Card; and hosting a Texas Legislative Drive-In when the State legislator is in session. The Texas Legislative Drive-In allows members to continually build relationships with policy makers, while providing feedback and distributing educational tools based on the civil engineering industry’s state of practice and technical understanding of infrastructure design, operation, maintenance, and the associated environmental impacts.
In addition to the Texas Infrastructure Report Card and the Texas Legislative Drive-In, ASCE Texas Section members routinely support the year-round technical work of state agencies and policymakers, while expanding on public awareness and education.
• In 2023 and 2021, the Beyond Storms Infrastructure Network Resilience Task Committee release two reports for Twin Winter Storms Uri & Viola detailing the effects of the storms on Texas' power grid.
• In 2022, the Residential Foundation Committee met to update the Guidelines for the Evaluation and Repair of Residential Foundations.
• The Government Affairs Committee periodically reviews draft legislation and agency documents, providing testimony at Texas House and Senate Committee Hearings, and host free “Infrastructure Education for Legislators” webinars.
• Due to the effects of Hurricane Harvey, the Post-Hurricane Harvey Recommendations Task Committee (2018) released a report with comprehensive policy recommendations to mitigate flood risk in Texas, followed by the Flood Mitigation Advisory Task Committee (2020), which reviewed numerous documents drafted by the General Land Office and Texas Water Development Board and provided valuable stakeholder feedback
To ensure there is an ever-growing number of exceptional civil engineers capable of leading the most complex projects and building better communities, ASCE Texas Section also supports both the ASCE Frontier Student Symposium and the Texas Civil Engineering Conference (CECON). The Student Symposium is hosted each spring, gathering over 800 of the best and brightest civil engineering students from universities across Mexico, New Mexico, Oklahoma, and Texas for professional development and networking. The event features regional competitions—such as the concrete canoe and steel bridge competitions—a career fair, power skills sessions, networking opportunities, and continuing education for local engineering professionals. By fostering connections between students and industry professionals, the symposium helps shape the future of civil engineering and prepares students to enter the workforce with confidence.
CECON is hosted every fall and is the premier conference for civil engineers across Texas and beyond. The conference is a gathering of more than 600 professionals sharing and advancing civil engineering essential & emerging best practices, and addressing infrastructure challenges, through participation in networking, leadership development, and technical training. Several panels, periodically including a legislative panel, are held throughout the program to discuss current professional and infrastructure situations that Texas, and the whole industry are facing.
ASCE Texas Section also provides a platform to fulfill our State’s science, technology, engineering, and math (STEM) based workforce needs through a variety of pre-college outreach events and programs. Our Section volunteers and local Branches work with universities, K-12 schools, and programs, such as science museums, to engage students in fun engineering activities, sharing insights about the career they love – civil engineering.
Connect with #TexASCE
PHOTO: SAN ANGELO STATE PARK,TEXAS; BISON_SAN ANGELO; TPWD
ASCE Texas Section is one of the largest and most active sections of the American Society of Civil Engineers. Established in 1913, the Texas Section represents more than 11,000 members across Texas. Headquartered in Austin, the Texas Section unites 15 Branches, 7 Technical Institute Chapters, and 24 Student Chapters. ASCE Texas Section belongs to ASCE’s Region 6, which includes the Mexico, New Mexico, and Oklahoma Sections. ASCE has 150,000+ global members. We support & encourage the equitable opportunity for participation by all.
Texas civil engineers are leaders in their communities, building a better quality of life across the street and around the world.