
18 minute read
Antlers by the Numbers
Having a clear understanding of the antler potential for your deer herd is essential to establishing management goals and associated culling criteria for your mule deer herd.
ANTLERS BY THE NUMBERS The Apache Ranch Mule Deer Experience

Article by JUSTIN T. FRENCH, THOMAS S. JANKE, CARLOS E. GONZALEZ, JUAN J. CELAYA, P.J. FOUCHÉ, and LOUIS A. HARVESON
Managing mule deer herds may be considered more Unlike white-tailed deer, there are few captive populations to art than science. Unlike their eastern cousins, study because mule deer do not do well in captivity. Even if there little information exists to guide managers on the were captive populations, it’s difficult to say how well findings development of mule deer antlers or the efficacy of harvest on captive deer translate to the field. strategies in producing larger bucks and higher scores. Furthermore, studying wild mule deer is challenging because
Many questions remain unanswered, such as: “How do scores of their large ranges and relatively low density. Without serious of mule deer antlers progress over time?” “When do they peak?” investments in time, effort and equipment as well as a long-term “How variable are they through time?” “How can we predict vision and a healthy dose of patience, monitoring individual which deer will be trophies in the future?” mule deer over time is challenging .
Photo by Louis Harveson, Ph.D.

Once captured, known-aged mule deer bucks were scored, ear-tagged, and released back onto the Apache Ranch.
In 2010, the Borderlands Research Institute (BRI) partnered with the Apache Ranch near Van Horn, Texas to study how mule deer antler scores change over a buck’s lifetime, which we term “antler progression.” This is distinct from antler development, which is the process by which antlers form.
This project was conceived as a longterm study of wild, known-age deer. It was only possible because of the ranch owners’ long-term vision and commitment to quality management as well as desire to bring scientific understanding to this challenging task.
LOOKING AT ANTLERS A DIFFERENT WAY
Antler progression is widely studied in white-tailed deer. While some patterns may translate between the two, there is considerable debate over what patterns mule deer exhibit.
Many studies in white-tailed deer have produced seemingly disparate results, which have been attributed to study design, statistical errors and uncontrolled sources of variation. However, there is a near-universal tendency for studies to examine antler progression in cross sections. This means that the distributions of antler sizes are compared across age cohorts, 1.5-yearolds compared to 2.5-year-olds, etc., rather than considering how specific individuals’ scores change over time.
Cross-sectional analyses of dynamic processes such as antler progression are harder to interpret, particularly when inference is based on averages within cohorts. This difficulty likely leads to incomplete, perhaps contradictory interpretation of results, even when they may actually agree.
The alternative is called a longitudinal study, where researchers compare continued measurements of individuals over time to those of other individuals. This allows researchers to examine how attributes of the individual and changes in their environment affect antler progression. These studies rely on fewer assumptions and treat the question of antler progression more naturally.
Such studies are often difficult to implement, however, because they require long-term monitoring and considerable investment in equipment, manpower and time. The Apache Ranch’s willingness to make such an investment allowed us to implement a longitudinal study on wild, known-age mule deer bucks.
Using a helicopter and net gun, we captured a total of 93 mule deer bucks between 2011 and 2014 and were able to monitor 55 known-aged bucks on the Apache Ranch from 2011 to 2019. We only captured fawns and yearling bucks for this study because they are the only age classes that can be aged reliably.
We confirmed age based on tooth eruption and replacement. While tooth wear is not reliable for estimating age, the presence of a tricuspid premolar commonly known as a “milk tooth” indicates a fawn or yearling, similar to white-tailed deer. Fawns and yearlings can be further separated based on the eruption of the rear-most molars: they clear the gum-line in yearlings, but not fawns. Thus, fawns and yearlings were considered known-age deer for our study.
Known-age bucks were scored at the time of capture and fitted with an ear tag with a unique color and number combination. The tags permitted identification of known individuals following release.
We monitored bucks using trail cameras placed at feeder stations from 2011 to 2019, allowing us to monitor antler progression in mule deer bucks up to 8.5 years of age. We used multiple photographs of each tagged buck after he shed his velvet to estimate individual’s antler scores each year.
Boone and Crockett (B&C) measurements were obtained by measuring the antlers in pixels from different photo angles and relating them to the known size in inches of the ear tag in each respective photo (also measured in pixels). This process allowed us to estimate the bucks’ B&C score for each year of their lives without recapturing the animals.
We compared estimated scores to those obtained at capture or upon harvest to validate our camera-based estimates. Our results suggested that the estimates performed well, but were consistently overestimating the true score by 8 percent, which we addressed with a correction factor. We then compiled antler progression curves for each monitored deer, which simply represent each buck’s score through time (Figure 1).
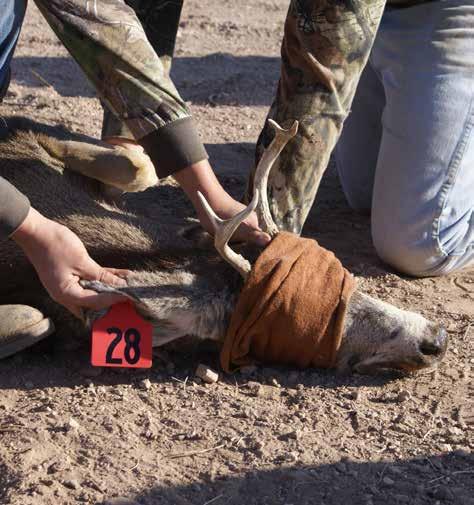
Figure 1: Antler progression curves for 55 known-age mule deer bucks monitored on the Apache Ranch from 2011-2019. Each buck is represented by a unique color, and the black dashed line represents the average antler progression. As you can see, it’s messy.

Photos by Louis Harveson, Ph.D.

By capturing only known-aged deer, researchers at BRI were able to monitor antler progression of individual mule deer over an 8-year time span. In the case of Red 28, the change is striking, progressing from a fork-horned yearling (l) to a 165 pound 7.5-year-old 10-pointer (r) that scored 155 inches.
Figure 2: Comparison of predictions of projected and realized antler progression curves of buck Yellow 86, relative to the average buck. He had high ratings on both Lifetime Potential and Age at Peak, which led to a high score early in life and a pronounced decline later on.

Photo by Louis Harveson, Ph.D.
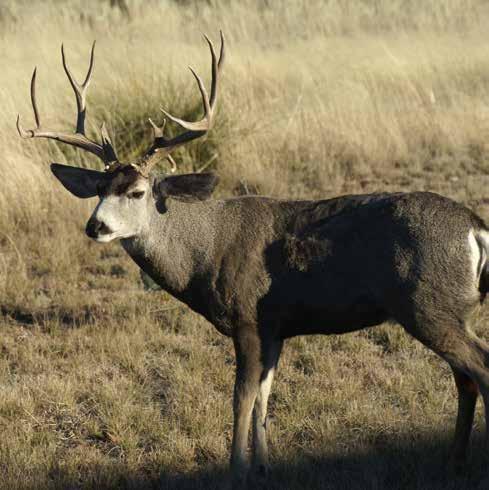
In theory, selective harvest or culling allows managers to increase the potential of favorable deer genetics (antler quality) to be passed on from one generation to the next.
The average mule deer buck reached an estimated peak score of 172 inches (B&C) in their fifth year, but we see tremendous variation among bucks. However, we can see that there are different tendencies in how the curves vary. We analyzed these tendencies with a method called functional principal components analysis (fPCA). This analysis finds different, independent ways in which antler progression varies among the bucks in our study and provides a rating of how much specific trends contribute to their antler progression.
The dominant pattern showed that some bucks have larger antlers throughout their lives than others. Ratings on this pattern therefore represent the Lifetime Potential of each buck. Surprisingly, this pattern accounted for a staggering 71 percent of the total variation in antler progression. Thus, Lifetime Potential is the most variable aspect of mule deer antler progression at the Apache Ranch.
The second pattern showed that some deer reach their peak score earlier or later than average. While some deer peak as early at 4.5 years old, most peak at 5.5 or 6.5 years old. Mule deer with particularly high ratings on Age at Peak are the “crashers” who may appear promising at a younger age but fall off later in life.
Our results suggest that the age at which a buck reaches his peak is independent of his Lifetime Potential, meaning a big-antlered buck can peak early or late—and so can a small-antlered one. Age at Peak accounted for an additional 21 percent of the variability in antler progression, meaning the variables Lifetime Potential and Age at Peak score captured 92 percent of the variation in antler progression at the Apache Ranch. The remaining 8 percent of variation is likely a combination of natural variability and unavoidable, random error in B&C score estimates.
We can illustrate this with Yellow 86, named for his ear tag color and number (Figure 2). He had an above-average rating on Lifetime Potential, which raised his curve above the average deer early in life. However, he also had a high rating on Age at Peak, meaning he reached his peak early and declined after.
We combined these ratings to show what Yellow 86’s antler progression curve would look like if only his potential and Age at Peak were considered. We see that the prediction did a pretty good job of matching reality, but other factors make him deviate from the prediction.
MAKING SENSE OF THE PIECES
We were able to separate different aspects of how antler progression varied, but what does that mean to a manager? The large contribution of Lifetime Potential is encouraging because it means that predictions of how big a buck could ultimately be are less confounded by other factors. This means that the future antler quality is more predictable.
Additionally, the Lifetime Potential rating gives us a single number that explicitly represents a bucks’ potential. That, in turn, gives us a basis by which to evaluate harvest strategies.
Photo by Louis Harveson, Ph.D.

Figure 3: Likelihood of making the correct call based on the number of points as a yearling mule deer buck. Blue and red areas represent the probability the given criterion achieves or fails to meet the goal of culling below average deer and passing over above average deer, respectively. The dashed vertical line represents how well a coin-flip would perform, instead of a criterion.
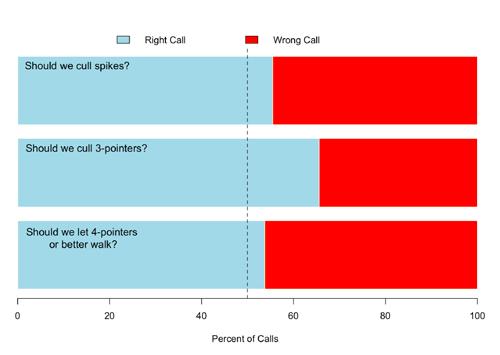
To cull or not to cull? Based on the antler progression study at the Apache Ranch, culling yearling mule deer bucks is risky business and equates to nothing more than a coin flip for this age class.
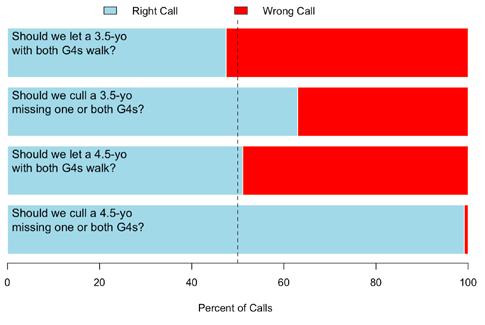
Figure 4: Likelihood of making the correct call based on the presence of G4s in adult bucks. Blue and red areas represent the probability the given criterion achieves or fails to meet the goal of culling below average deer and passing over above average deer, respectively. The dashed vertical line represents how well a coin-flip would perform, instead of a criterion.
Despite questions of its efficacy, selective harvest, or culling, is one of the most widely applied tools to manage antler quality. Independent of other factors, if a culling criterion does not reliably predict which bucks will have higher or lower quality in the future, then the culling effort will not be effective. Thus, rigorous evaluations of these criteria are incredibly valuable, particularly given the enormous investments of time and money these programs require. Because we know the characteristics of each deer throughout its life, we can compare different culling criteria based on how likely they are to meet management goals.
Culling Question: What about spikes?
As a simple example, consider culling spike mule deer bucks as yearlings, a hotly debated topic in white-tailed deer management. Figure 3 shows the chances of making the right call on deer that were spikes, 3-pointers, or 4-plus pointers as yearlings, based on their Lifetime Potential rating. If we were to cull spikes and 3-pointers, but let yearlings with 4 or more points walk, the blue areas represent the proportion of time we make the correct call based on our goal, while the red areas represent the chances of calling the shot incorrectly.
Looking at spikes alone, there is a 45 percent chance, essentially one out of two, of making the wrong call. For 3-pointers, if you were to cull them, each shot has a 34 percent (one out of three) chance of missing the goal. Somewhat ironically, letting a 4-plus point yearling walk would result in the wrong call 46 percent of the time.
It is important to remember that “wrong” in this case is relative to achieving the management objective. Allowing a buck to walk is not necessarily a bad decision, certainly since the outcome is less absolute than culling. However, if the goal is to remove below average deer, this criterion would pass them over more than half of the time.
Overall, at least on the Apache Ranch, culling spikes and 3-points would result in a 42 percent chance of culling a deer that was actually above average over the course of its lifetime, each time you pull the trigger—barely more reliable than a coin flip.
Culling Question: What about 3.5 or 4.5-year-old bucks without a G4?
We can evaluate any given set of harvest criteria in the same way we did for spikes. Most managers recognize the utility in giving deer a few years to start showing their potential. On the Apache Ranch, high quality deer are not harvested until they are 6.5 years or older for this reason. However, for culling we would like criteria that are reliable at younger ages.
For the sake of comparison, we evaluated a simple criterion applied on the Apache Ranch: presence of both G4’s on deer judged to be 3.5-4.5 years of age. Our average curve suggests that we need criteria that predict well prior to 5.5 years of age to be effective, thus we only consider 3.5 and 4.5-year old bucks here (Figure 4).
We see that the criterion does not reliably predict whether a 3.5-year-old will be above or below average, based on the presence of G4s. Additionally, we see that having both G4s does not mean a 4.5-year-old buck has a high Lifetime Potential. However, it is highly unlikely that a 4.5-year-old buck without both G4s will be a high-quality deer.
At least within our sample, culling 4.5-year-olds that lack one or both G4s would achieve the management objective of culling a below-average buck 99 percent of the time it is applied. While this certainly highlights the benefit of letting deer mature before making a ruling, the high percentage we see on the Apache Ranch may not apply to all settings, so more research is required in other areas before this should be considered a generally acceptable criterion.
Another important caveat to the foregoing discussion is that we are comparing strategies on the basis of Lifetime Potential. While overall Lifetime Potential captured a large portion of the variability, it left a considerable amount on the table. The more that is left, the less confident we should be that the deer will realize the potential we base the harvest decision on. That’s because the other factors act independently to influence each deer’s antler progression. This leads us to consider the second way antler progression varied.
Influence of Habitat Conditions
We suspect that the age at which these deer reached their peak antler score was influenced by the habitat conditions they experienced throughout their lives. One of the unique attributes of the Apache
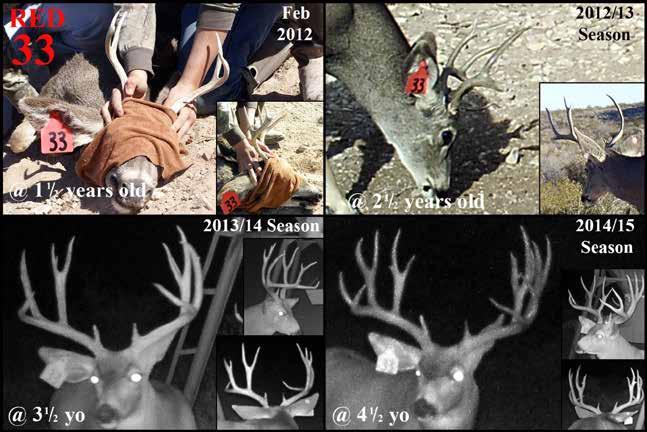
Mule deer known as Red 33 is a good example of a deer that showed below average antlers early in his life but matured into a nice deer sporting 18 points and scoring 220 B&C at 5.5 years of age.
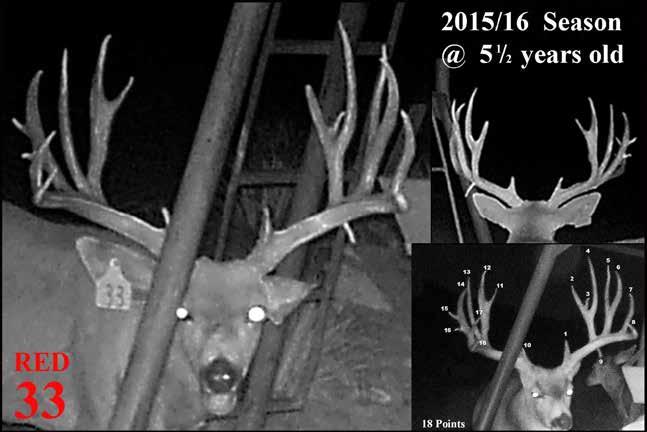

Photo by Louis Harveson, Ph.D.
Ranch is its extensive supplemental feeding program. Supplemental feeding serves to buffer animals from nutritional stress brought on by drought conditions, which would reduce the variability in antler growth caused by such conditions.
It is possible that supplemental feeding reduces variation caused by environmental conditions, meaning Lifetime Potential captures more. This could allow us to see the bucks’ potential more clearly. While an interesting hypothesis, the patterns seen on the Apache Ranch must be compared to those in areas with other management schemes before we can draw any conclusions on the feeding program’s effect.
WHAT HAVE WE LEARNED AND
WHERE TO GO FROM HERE?
Culling Questions: Are There Answers?
While it has been suggested that mule deer reach their peak antler size later than white-tailed deer, our data suggest the pattern is quite similar to that of white-tailed deer. At least at the Apache Ranch, the average mule deer reaches its peak at 5.5 years old, but it can vary from 4.5 to 6.5 years of age. Thus, for selective harvest to be effective we need reliable criteria before 5.5 years of age.
We see that judging bucks based on the number of points they have as yearlings is demonstrably unreliable at predicting their Lifetime Potential, and now have a reasonable basis for evaluating alternative culling criteria. Culling 4.5-year-old bucks that lack one or both G4s may be an effective culling criterion but should be evaluated further before general acceptance.
Additionally, although our data suggests that antler progression of the average buck peaks at 5.5 years of age, mule deer with high Lifetime Potential ratings and late Age at Peak, while rare, can become truly exceptional deer. In fact, the Apache Ranch strives to harvest trophy quality deer at 6.5-7.5 years to ensure they have ample breeding opportunity and to allow for maximum antler potential.
One of the biggest assumptions of applying these culling criteria is that deer can be aged accurately on the hoof.
Photo by Lane Sumner

We presented two pictures of mule deer bucks at a meeting of both wildlife professionals and experienced managers and asked the audience to estimate the age of the two deer. Estimates from the audience were variable but had one commonality: they were wrong.
The first was most often aged at 7.5-8.5 years old but was in fact 5.5. The second was commonly aged at 3.5-4.5 but was 6.5. The most interesting aspect of the comparison is that they were actually the same deer (Yellow 86 again, in fact) two years in a row. While most of us would like to think we are above average at aging deer, the truth is less satisfying. Without more reliable ways to estimate age, implementing these criteria effectively will remain difficult.
On top of that, recent work by the Caesar Kleberg Wildlife Research Institute on white-tailed deer in South Texas suggests that culling has no impact on a herd’s genetic structure. These white-tailed deer were under one of the most intensely managed scenarios possible, and yet there was no meaningful effect. Success would be even less likely in mule deer because they occur at low density and move over much larger areas.
Selective culling may still benefit deer with higher potential by reducing competition for resources, but how effective this is remains to be seen. So, while we don’t know if even a good culling criterion will lead to better B&C scores across the herd, if a criterion cannot reliably predict which deer are above average, or can’t be reliably applied, the program is already on a shaky foundation.
Variable Conditions and the Role of Supplemental Feeding
While we cannot yet conclude what effects supplemental feeding has, we suspect it may reduce variation in antler progression due to environmental factors. This would make predictions of lifetime quality a more effective management tool and increase the reliability of selective harvest criteria. If this hypothesis holds, antler quality would be more variable on “unfed” ranches, making it harder to predict Lifetime Potential.
We expect that this would particularly affect how much Age at Peak score contributes to the overall variability. This really highlights the appropriate role of supplemental feeding as just that: a supplement. Feeding will help animals weather lean habitat conditions, but cannot replace high quality habitat.
We cannot stress enough that weather conditions still play a prominent role in a bucks’ score as well. This is why we suspect that annual conditions contribute between 21 and 30 percent of the variation we observed in antler progression, despite extensive supplementation.
This notion is supported by the fact that despite the feeding program, peak antler years have consistently been wet years on the Apache Ranch. While feeding may also improve overall antler quality on average, we still see considerable variation in age at peak in this population, despite the Apache Ranch’s extensive feeding program. This simply demonstrates that mule deer management is a complex undertaking and requires multiple approaches to meet goals.
We continue to monitor bucks on the Apache Ranch and have expanded monitoring to other ranches with different management strategies. This additional data will allow us to test our predictions about supplemental feeding and examine environmental effects on different aspects of antler progression. For example, habitat conditions and doe nutrition during gestation are thought to influence the potential of bucks, which we can isolate with our approach.
Getting these data takes time, effort, a long-term vision and a considerable amount of patience. We are grateful to our partners investing what it takes to tackle these tough questions. While we bring science to the assessment of culling criteria, plenty of art— particularly in aging— remains…for now.


