5 minute read
Analysis of Fraudulent Financial Reporting with Fraud Hexagon Theory in Financial Sector

from Analysis of Fraudulent Financial Reporting With Fraud Hexagon Theory in Financial Sector Companies L
by The International Journal of Business Management and Technology, ISSN: 2581-3889

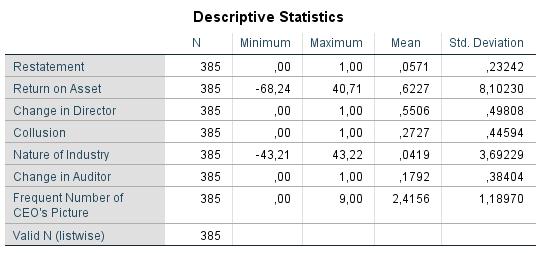
Descriptive statistical analysis is used to measure data by looking at the average value (mean), minimum value, maximum value, and standard deviation of the dependent variable and independent variable in the study. The dependent variable in this study is fraudulent financial reporting which is proxied by restatement. Independent variables in the study can be measured by return on assets, change in director, collusion, nature of industry, change in auditor, frequent number of ceo's pictures. Here are the results of the descriptive statistical test on the study:
Table 1: Analysis Descriptive Statistics
Advertisement
The dependent variable in this study is financial statement fraud which is proxied through financial restatement and measured using dummy variables. In Indonesia, financial statement fraud in financial companies averaged 0.0571 from 2017-2021. Financial statement fraud has a standard deviation of 0.23242. This score is higher than the average score, which indicates that information about financial statement fraud is spread unevenly. The ROA value in financial companies in Indonesia has an average of 0.6227. The ROA value has a standard deviation of 8.1023. This score is higher than the average score, which shows that the ROA value in financial sector companies in Indonesia is not evenly distributed.Change in Director, with an average turnover of directors in Indonesia in 2017-2021 of 0.5506, from the entire analysis unit there were 55.06% of companies that changed directors in the research period. With a standard deviation of 0.4981. The standard deviation value on the capability variable is lower than the average value, which indicates that the distribution of research data variables does not have a large enough gap or the data is evenly distributed.The average collusion value in financial companies in Indonesia is 0.2727 with a standard deviation value of 0.4460. Based on the results of descriptive statistical analysis, the average value of nature of industry is 0.419. The standard deviation value of the nature of industry is 3.6922. The average turnover of auditors in Indonesia is 0.1792 or 12.92% of financial companies in Indonesia make changes to external auditors in 2017-2021. The standard deviation of the change in auditor variable is 0.3840 which indicates the distribution of research data with low deviations and is homogeneous, so there is no significant difference in the data analysis unit. Frequent number of CEO's pictures showed that the average value was 2.4156 with a standard deviation value of 1.1897. The standard deviation number is smaller than the average indicating the presence of a low distribution of data with deviations. The lower the spread value, the more homogeneous the variation in data values, and there is no too large variance between one data and another.
4.2 Logistic Regression
To predict the likelihood of financial reporting fraud, logistic regression is used to predict discrete outcomes of dichotomous dependent variables. Logistic regression is considered more flexible because it does not have to meet the criteria requirements of predictor variables, namely normal distribution, linear connections, and the assumption of the same variance(Suh et al., 2019). The dependent variable in this study is a binary variable that shows whether financial statement fraud occurred (1) or not (0) in the financial sector in Indonesia in the last five years.
4.2.1 Overall Model Fit Results
Overall model fit is used to measure the feasibility of the model on logistic regression.The feasibility test results showed that the initial -2Log likelihood value (block number = 0) before being put into an independent variable, which was 168.655 and after the independent variable was entered the value of -2 Log Likelihood (Block number 1) was 130.434. This value indicates a decrease in the value of -2LL (-2 Log Likelihood) in Block 0 and Block 1 by 38.221. This indicates that the hypothesized model is fit with the data, so the addition of independent variables to the model shows that the regression model is getting better.
4.2.2 Coefficient of Determination Test Results (Nagelkereke's R Square)
Based on table 3, the results of the analysis show that the value of Cox & Snell R Square is 0.095 and the value of Nagelkerke R Square is 0.266. Nagelkerke R Square's value of 0.266 indicates that the independent variable was able to explain the variation of the dependent variable in detecting financial statement fraud of 26.6%, while the remaining 73.4% was explained by other variables that were not included in the research model.
4.2.3 Test Hosmer and Lemeshow's Goodness of Fit
Table 4 shows that the results of the Hosmer and Lemeshow Test Goodness of Fit test analysis obtained a chi square value of 1.226 with a significance level of 0.996. Where 0.996 ≥ 0.05 which indicates that H0 is accepted. This indicates that there are no statistically significant differences between the model and the data, which suggests that the regression model in this study is feasible and capable of predicting observation values.
4.2.4 Wald Test Results
The wald test is a parametric statistical test that can be used to determine the actual value based on the sample estimate when the relationship between data items can be described as a statistical model with the parameter estimation of the sample. The Wald test in logistic regression analysis is used to determine the degree of significance of each independent variable against the dependent variable.
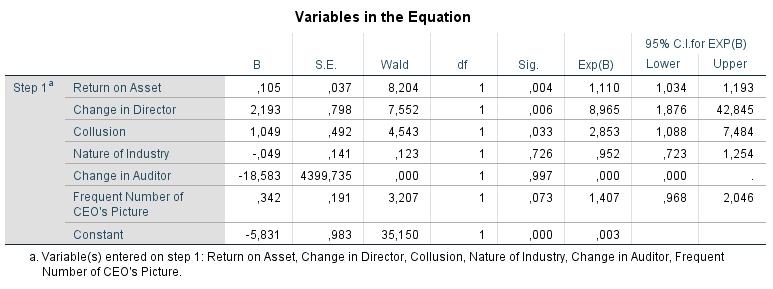
Table 5: Variables in the Equation
1. H1: financial targets affect fraudulent financial statements
Based on the results of logistic regression analysis, a Wald test value of 8.204 was obtained with a significance level of 0.05 and df = 1 with a financial target significance value of 0.004. A significance value of 0.004 ≤ 0.05 indicates that the financial targets affect the fraudulent financial statement and H1 is accepted
2. H2: Change in director affects fraudulent financial statement
Based on the results of logistic regression analysis, a Wald test value of 7.552 with a significance level of 0.05 and df = 1 was obtained with a change in director significance value of 0.006. A significance value of 0.006 ≤ 0.05 indicates that change in director affects fraudulent financial statements and H2 is accepted
3. H3: Collusion affects fraudulent financial statements
Based on the results of logistic regression analysis, a Wald test value of 4.543 was obtained with a significance level of 0.05 and df = 1 with a collusion significance value of 0.033. A significance value of 0.033 ≤ 0.05 indicates that collusion affects fraudulent financial statements and H3 is accepted
4. H4: Nature of industry affects fraudulent financial statement
Based on the results of logistic regression analysis, a Wald test value of 0.123 with a significance level of 0.05 and df = 1 was obtained with a nature of industry significance value of 0.726. A significance value of 0.726 ≤ 0.05 indicates that the nature of industry has no effect on fraudulent financial statements and H4 is rejected
5. H5: Change in Auditor has no effect on fraudulent financial statement
Based on the results of logistic regression analysis, a Wald test value of 0.000 was obtained with a significance level of 0.05 and df = 1 with a change in auditor significance value of 0.997. A significance value of 0.997 ≤ 0.05 indicates that the change in auditor has no effect on fraudulent financial statements and H5 is rejected
6. H6: Frequent number of CEO's pictures affects fraudulent financial statement
Based on the results of logistic regression analysis, a Wald test value of 3.207 was obtained with a significance level of 0.05 and df = 1 with a frequent number significance value of CEO's pictures of 0.073. A significance value of 0.073 ≤ 0.05 indicates that the frequent number of CEO's pictures has no effect on fraudulent financial statements and H6 is rejected.
4.2.5 Logistic Regression Model
This study used logistic regression analysis to test the effect of independent variables on dependent variables.
Based on the results of the logistic regression analysis shown in table 5, the logistic regression equation can be formulated as follows:
FFR= -5.831 + 0.105ROA + 2.193DCHANGE + 1.049COL - 0.049NI - 18.583CIA + 0.342CEOPIC + e
Based on the regression equation, the influence of independent variables on dependent variables can be analyzed, as follows:
1. The value of the constant (α) is -5.831, meaning that if the independent value of the variable is fixed (constant), then the value of the Restatement is also fixed (constant).
