9 minute read
ELEPHANT IN THE ROOM?
LED FLICKER: THE ELEPHANT IN THE ROOM
LED may be able to bring many benefits to light and lighting. But that does not mean we need to stop discussing how best to mitigate the impact of flicker and unwanted temporal light modulation from LEDs, argues a senior Public Health England scientist
By Luke Price
With any new lighting technology there seems to be a return to discussions about flicker. LEDs are no exception, and there is an increased level of interest in the topic, particularly within the standards and research communities. When it comes to flicker, perhaps LEDs will be an opportunity to improve lighting quality but currently they certainly present some challenges.
Flicker is the visual sensation of unsteadiness in a light stimulus, occurring either at a regular frequency (which is the type being discussed in this article) or at more random intervals.
Usually in lighting flicker is unintended, and originates from the modulation of voltage in the electricity supply. The general term is temporal light modulation (TLM), which is deemed to be flicker only when it can be seen directly.
There is a consensus in favour of regulations to stop at least the worst levels of flicker, but there is less agreement as to how far the regulations should go.

BACKGROUND Flicker is related to the main supply frequency. The standards for the electricity supplies in the US, UK and Europe were argued over for several years. In the US, Edison had argued in favour of DC, but Westinghouse chose 60 Hz AC in 1886, which eventually won out.
In the UK and Europe, the eventual outcome was 50 Hz AC around 1891, but this didn’t reach north east England until 1920, and some of the earliest AC systems had used 133 Hz.
These frequencies made most sense at the time, and were a compromise between efficiency, safety, driving electric motors and flicker levels in lighting.
Famously, or notoriously, there was much media outrage over a black-andwhite film made by Edison’s film company showing ‘Topsy’, an amusement park elephant, being electrocuted to demonstrate the inherent dangers of AC supplies.
However, although Edison’s company was indeed partly linked to this electrocution (and involved with those of other animals some years earlier), Topsy was electrocuted in 1903, by which time ‘the war of currents’ had largely been settled.
Nevertheless, the tale of Topsy is a useful reminder how emotive stories can be easily believed even when factually untrue, and that we should create evidence-based standards or regulations by getting as wide a consensus as possible.
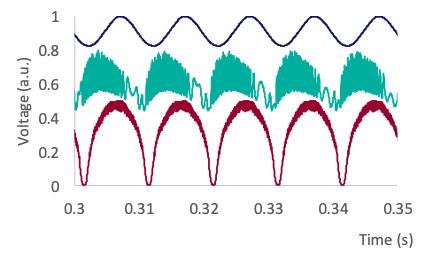
TYPES OF EFFECT In 2015, Public Health England (PHE) together with CIBSE and the Society of Light and Lighting (SLL) produced a report on several aspects of LED lighting products on the UK market, including flicker and unwanted TLM [1]. Examples are shown in figure 2 opposite (the top panel). The modulation depth, also called ‘Percent Flicker’ (see figure 1 below), ranged from 0% to 100% for LEDs and was not strongly related to price or other factors. The range for incandescent and tungsten-halogen lights (INC) was merely 9% to 10%, and for compact fluorescent lamps (CFL) was between 5% and 100%. All the flicker observed was at 100 Hz, usually with higher frequency components.
Flicker is just one effect of TLM. Firstly, visible flicker can trigger photosensitive epileptic seizures. Secondly, the cones in the retina continue to generate time-modulated responses at frequencies above the flicker perception threshold (or ‘phase-locking’) [2]. With rapidly modulating light, there are three further stroboscopic effects visible to the naked eye. These are: Figure 1. How Percent Flicker, PF, or modulation depth is calculated
1. The tunnel lighting effect. This is where a light moves across the field of view. This creates several separate images on the retina because each time the light comes on it has moved to a different relative location. With a series of evenly spaced lights, their images interfere and may appear to be moving more slowly than the lights are moving, or appear stationary. 2. The rotating machinery effect. This is where the motion is circular, and images from successive rotations or spokes may interfere in the same way. 3. The phantom array effect. This is where it is the eye that moves rapidly during a saccade, again creating several separate images on the retina.
As well as being unintended, flicker and stroboscopic effects are unwanted because they can be distracting, irritating, and the stroboscopic illusions can cause safety problems for using machinery.
The phase-locking effect and phantom array effects may also relate to other
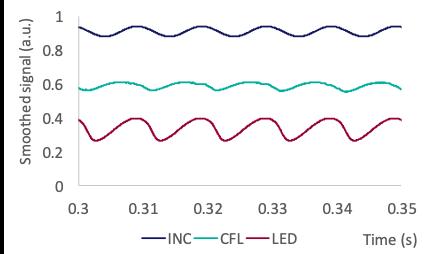
t Figure 2, showing unsmoothed and smoothed example waveforms (top and bottom panels respectively)
adverse health effects, such as visual discomfort, eye strain, impaired visual and reading performance, migraine, headaches and nausea.
With different levels of evidence, these have all been associated with lights flickering at frequencies above 50 Hz.
The ‘Physiological Percent Flicker’ (PPF) metric, published in LEUKOS [3], is based on the fastest responses of the cones smoothing the luminance over time (again see figure 2, above, versus unsmoothed modulation).
It has the useful property of converting the recommendations in the 2015 industry consensus published by IEEE [4] into a test that can be applied fairly to different products. The calculation is shown in figure 3 below.
The PPF metric applied to the CIBSE report dataset confirms that it was already possible in 2015 to produce lights that comply with the IEEE requirements for all the tested light fittings (B22, E14, E27, GU10, LED panels and street lamps; E14 finding is based on similar data).
PROPOSED REGULATIONS Confusingly, the phantom array effect has been classified as being distinct from stroboscopic effects [5]. Several draft regulations have proposed using the ‘Stroboscopic Visibility Measure’ (SVM) to regulate flicker above approximately 90 Hz at the 50:50 level. This almost certainly would allow the phantom array and phase-locking effects, and allows for the stroboscopic effects to be seen 50% of the time.
The SVM threshold proposed in the European Union’s eco-design consultation was tightened to make sure that at 100 Hz, modulation from LEDs was not significantly worse than previous lighting technologies (see figure 4, above and opposite).
This change represents a significant improvement in lighting quality, but some concerns remain. The regulations become too strict at high frequencies relative to the effect thresholds and the test used is not well-suited to rectangular waves (associated with pulse-width modulation, or PWM, often used in LED drivers and dimmers). These problems are built into the structure of the SVM metric (for example see reference 5), but they are not shared by PPF.
A metric such as SVM or PPF predicts the magnitude of the effect. The lines of equal SVM or PPF shown in figure 4 should
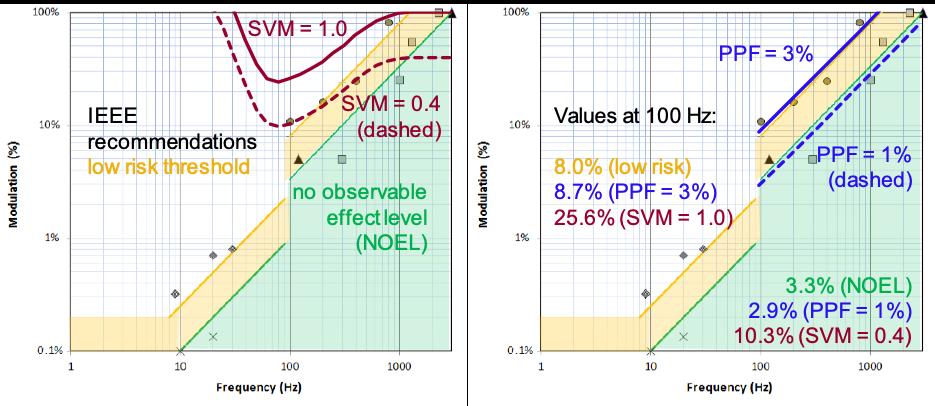
p Figure 4, showing an IEEE diagram with recommended thresholds, and either SVM or PPF overlays (left and right panels respectively). The values at 100 Hz and 120 Hz are critical for framing European and US regulations, respectively. To avoid creating perverse incentives, regulations relating to frequencies above 90 Hz could follow IEEE recommendations by adopting a suitable PPF threshold
therefore represent thresholds for conditions that produce the same effect magnitude. This is, for example, conditions that are predicted to be just as visible, or cause just as much phase-locking. better-quality lighting. New research may well reveal the finer details, but these two broad trends are reflected in evidence from several independent studies and findings from reviews.
THE SHAPE OF THINGS TO COME? Figure 4 above shows that the PPF thresholds run parallel to the IEEE lines where PF is proportional to frequency for a simple sine wave, because PPF itself follows lines where PPF is inversely proportional to frequency.
Ideally, lamp tests should correctly allow for wave shape and frequency. For high frequencies, the chosen test measure (or metric) should be proportional to frequency, and for rectangular LED modulation at a target time-averaged illuminance it is reasonable to assume it should be proportional to 100% minus duty cycle %.
Using the PPF metric makes sure the lamp tests conform to these requirements, and this allows fair comparisons between lamps with a minimal risk of i n c e n t i v i s i n g a n y t h i n g b u t
DIMMING Going one step further, we might wish to make predictions about dimming. This would add luminance or ‘time-averaged luminance’ as a third dimension to the IEEE diagram. So far, none of the metrics in regulations has included this factor. It is not clear if it would be entirely practical either.
Taking the worst-case scenario and assuming high time-averaged luminance, we can then make some predictions about PWM dimming using PPF.
At 10 kHz, a duty cycle of 21% or lower (for dimming to 21% of maximum output) lies on or above the extended IEEE lowrisk threshold. Also at 10 kHz, a duty cycle of 73% or more is on or above the extended IEEE no observable effect threshold.
A dimmable product therefore would be expected to dim to well below 73%, so a higher modulation frequency would be required. This is no surprise, as CFL products typically use modulation frequencies of at least 30 kHz, for precisely the same reason.
DISCLAIMER The author would like to emphasise that the choice over regulations leaves a large amount of leeway for personal opinions and alternative methods.
Any opinion or method can never be exactly ‘right’, but in one way or another they can all be wrong, because we will never know everything about this topic.
This is the reason regulations should be based on as wide a consensus view as possible. I invite constructive comments and considered alternative viewpoints. Those based on evidence, not elephants.
Luke Price is senior radiation protection scientist at Public Health England
[1] ‘Human responses to lighting based on LED lighting solutions’ (HRLBL), Chartered Institution of Building Services Engineers (CIBSE), 2016. [A Public Health England report (CRCE-RDD 01-2016) by O’Hagan J B, Khazova, M, and Price L L A, commissioned by CIBSE and the Society of Light and Lighting (SLL)] [2] Berman, S M, et al 1991. ‘Human electroretinogram responses to video displays, fluorescent lighting, and other high frequency sources’. Optometry and vision science, 68(8), pp.645-662 [3] Price, L L A 2017. ‘Can the Adverse Health Effects of Flicker from LEDs and Other Artificial Lighting Be Prevented?’ LEUKOS, 13(4), pp.191-200. [4] IEEE 2015 1789 – ‘IEEE Recommended Practices for Modulating Current in High-Brightness LEDs for Mitigating Health Risks to Viewers’, Institute of Electrical and Electronics Engineers [5] CIE TN 006:2016 ‘Visual Aspects of Time-Modulated. Lighting Systems – Definitions and. Measurement Models’, International Commission on Illumination (CIE) (2016)


