
Your Future in Wind Energy Student Guide SECONDARY 2021-2022
2 ©2022 The NEED Project Your Future In Wind Energy Student Guide www.NEED.org
Your Future in Wind Energy was developed for Career and Technology Education classrooms by the NEED project with funding and technical support from the National Renewable Energy Laboratory (NREL). NEED gratefully acknowledges its Teacher Advisory Board members for their work in creating this unit: La’Shree Branch, Shannon Donovan, and Tom Spencer.

In the United States, nine of the ten energy sources are used to generate electricity; the only source that is not commonly used for electricity generation is propane. Natural gas is the leading source for electricity, followed by uranium and coal. Hydropower is the leading renewable energy source for electricity generation. The most common way to generate electricity is by using thermal energy to boil water into pressurized steam, which turns a steam turbine. Turbines change linear motion into rotational motion; in this case, the linear movement of the steam is changed to a rotation to turn a generator. The generator houses a large magnet surrounded by coiled copper wire. The blades spin the magnet rapidly, rotating the magnet inside the coil, producing an electric current. Wind and hydropower use a flowing fluid, air or water respectively, to turn the turbine. Because no heat energy is lost, wind and water are more efficient sources of energy for generating electricity.
Energy Sources and Electricity
Petroleum 34.73% Uses: manufacturingtransportation,-Includes Propane Biomass 4.88% Uses: electricity, heating, transportation NONRENEWABLE, 87.50% U.S. Energy Consumption by Source, 2020 RENEWABLE, 12.48% Natural Gas 33.99% Uses: electricity, heating, manufacturing - Includes Propane Geothermal 0.23% Uses: electricity, heating Coal 9.89% Uses: electricity, manufacturing Uranium 8.89% Uses: electricity Propane Uses: heating, manufacturing Solar 1.34% Uses: electricity, heating Data: Energy Information Administration
Introduction to Energy
©2022 The NEED Project Your Future In Wind Energy Student Guide www.NEED.org 3
What is Energy?
We all use the word energy daily. We have energy drinks and energy shots, we pay our energy bills, and politicians discuss energy security almost daily. However, what energy actually is can be a difficult concept to explain precisely. Our bodies and objects all around us are using energy all the time. Energy allows us to do the things we need to do. Energy allows us to do work, and to affect change. It provides the ability to do what we need to do, whether we can visibly see what is happening or on a microscopic level. Energy exists in two basic forms. Stored energy to use later is called potential energy, while energy in motion is called kinetic energy. Each of these two, broad categories can be broken down further into nine different forms of energy. One type of potential energy can be gravitational potential energy (GPE), which is energy stored by position. A child at the top of a slide or water behind a dam both have gravitational energy. Elastic energy is potential energy that is stored by applying a force. When you wind up a toy car, you are storing energy in the spring inside of it. If you pull back on a rubber band, you are storing elastic energy in it. Nuclear energy is the potential energy within the nucleus of atoms. Very small changes in the nucleus of an atom can release tremendous amounts of energy. The most commonly used form of potential energy is chemical energy. It is the energy in the bonds between atoms of all the substances in the world. The food you eat, the fuel in the car you drive, the wood your campfire burns are all examples of chemical energy.
Anything moving has kinetic energy. It can be broken down into five forms. When large-scale things are moving, they have motion or mechanical energy. A child on a bike, water moving through a stream, and the wind all have motion energy. Thermal energy is the energy that allows atoms and molecules to move around. The more thermal energy in a substance, the faster the molecules move, and the higher its temperature. Sound is a form of energy that we often overlook – because a sound is a vibration, it is an energy form. Radiant energy is energy that moves through space in transverse waves. Sunlight and radio waves are examples of radiant energy, as are microwaves and x-rays. Electrical energy is the energy of moving electrons. Electricity is the most common example of electrical energy, but small static electricity jolts and lightning strikes are also examples of electrical energy.
Energy Sources
We use many energy sources to meet our needs. All of them have advantages and disadvantages—limitation or reliability of supply, and economic, environmental, or societal impacts. Energy sources are usually classified into two groups—renewable and nonrenewable. In the United States, most of our energy comes from nonrenewable energy sources. Coal, petroleum, natural gas, propane, and uranium are nonrenewable energy sources. They are used to generate electricity, heat homes, move cars, and manufacture all kinds of products from candy bars to tablets. They are called nonrenewable because their supplies are limited, and they cannot be replenished in a short period of time. Petroleum, for example, was formed hundreds of millions of years ago, before dinosaurs lived, from the remains of
**Total does not equal 100% due to independent rounding. Hydropower 2.79% Uses: electricity Wind 3.24% Uses: electricity *Propane consumption gures are reported as part of petroleum and natural gas totals.
ancient sea plants and animals. We could run out of economically recoverable nonrenewable resources someday. Renewable energy sources include biomass, geothermal, hydropower, solar, and wind. They are called renewable because they are replenished in a short time. Day after day the sun shines, the wind blows, and the rivers flow. We use renewable energy sources mainly to make electricity.
When people hear the word “energy” they often think about electricity. Electricity is not a source of energy – rather it is the energy carrier that we use as we convert energy from one energy source to electrical energy and then to a third form of energy for our intended use. For example, natural gas is burned to generate steam and turn a generator for electricity. That electricity is used by our cell phones and transformed into light and sound energy.
Power tells us how much work is done in a period of time. The numerical values of voltage and current are multiplied to tell us the power used (Power = voltage × current). Power is measured in watts. The amount of power itself does not tell us much about what is happening with electric power consumption. For example, 1,000 watts could be 100 volts and 10 Amperes of current, or it could be 1,000 volts and only 1 Ampere of current. However, power is the way the electric utility measures and bills us for the electricity we use.
NONRENEWABLERENEWABLE
Uranium 19.70% 1.40%0.42%2.27%8.42%7.13%
Data:
U.S. Electricity Net Generation, 2020 40.33%
4 ©2022 The NEED Project Your Future In Wind Energy Student Guide www.NEED.org
Voltage and current are related through two properties called resistance and power. Resistance is exactly what it sounds like – a material with a high resistance is not going to allow electricity to flow through it. Given a high enough voltage, current will flow, but the current will be low because the resistance is high. Conductors have lower resistances compared to insulators, but heavy-gauge wire has a higher resistance than fine-gauge wire.
Electric devices use two different types of electric power: DC and AC. Direct current , or DC, means the flow of electrons is in one direction only. Simple electrical devices, such as flashlights, LEDs, and cell phones, run on DC power. Alternating current , or AC, means the polarity of the circuit changes. In the United States, AC power is a 60 Hz system, meaning the direction of current flow changes 60 times in one second. When you charge a DC device using the AC power in your home, a transformer inside the charging cord changes the AC power to DC, and regulates the voltage being delivered to the battery being charged. Changing the AC electrical energy to DC electrical energy results in some of the energy lost as thermal energy. You can observe this directly by feeling the large plug, or the box in the middle of the cord. When the device is actively charging, the transformer gets warm.
Electrons will move through materials called conductors. These materials are familiar to you; copper and aluminum are excellent conductors of electricity. A common example of a conductor is insulated wire, and the wire may carry the electric current to a light bulb, which is the load. Materials that do not easily allow electrons to move through them are called insulators. The common wiring running through our homes and other buildings consists of a conducting wire surrounded by an insulating coating. The thickness of the insulation on the wire is important. Applications with high voltage require heavy gauge wire with thick insulation because high voltage indicates that the electrons are very highly energized and could, under the right circumstances, move through a thin insulator. Air is an insulator, yet lightning will travel through it given a high enough potential to do so.
Electric energy is carried by electrons, which are tiny particles moving around the nuclei of atoms. Electrons are more likely to stay associated with their respective nuclei unless they’re given additional energy and have the potential to move. That potential is called voltage. Electricity flows when a source of voltage such as a battery causes a current to flow through a conductor to an electrical load.
The number of electrons passing a point in one second is called current. Those electrons can be highly energized (high voltage) or not very energized at all (low voltage) but as long as they are moving, they are counted in the current. Current is measured in Amperes. One Ampere of current is a Coulomb of electrical charge (6.24 x10¹⁸ electrons) moving past a point in a circuit in one second. Electricity allows us to move energy around between systems for many different purposes.
Measuring Electricity
HydropowerNaturaGeothermalBiomass
Common applications of resistance and power exist in everyday life all around us. If you have an electric range or cook top, the large heating element inside is one giant resistor. The higher voltage needed to force electricity through the element is provided by the heavy-duty, higher voltage outlet. If you have a hair dryer or electric heater, those also have heating elements that work in a similar way, albeit at lower voltage. Microwaves and light bulbs are often described by their power use; however, the most efficient lighting with light emitting diodes (LEDs) inside are usually described by their light output because they use a small amount of power.
100%
What is Electricity
Voltage is how we indicate the likelihood an energized electron will move across an insulating gap. This is also called electrical potential. Think of voltage as the potential to make a jump. The higher the voltage, the more energy the electron has, and the more likely it is to jump the gap.
steam, tire-derived
Other:
*Total does not equal due to independent rounding. Energy Information Administration purchased fuels, electricity used for storage, etc.
Petroleum 0.44%


When a current runs through the coil, magnetic flux forms around the coil. This field is intensified by having the ferrous core, which is more capable of accommodating a magnetic field than air. The core is more magnetically permeable than air.
One of the many ways that we can produce or manipulate electrical energy is through electromagnetic induction. As a current flows through a wire, a corresponding magnetic field forms around the wire’s cross section, all along the conductor. The strength of the magnetic field is directly related to the amount of current flowing through the wire. It will also change in direct proportion to the current flow. As a result, greater current induces a greater magnetic field, and if the current changes in magnitude or direction, the magnetic field around the wire will also change in magnitude or direction. We represent magnetism as lines of magnetic flux or lines of magnetic force around a conductor that is carrying current.
The right-hand rule shows the direction of the current or magnetic field. The fingers of the right hand curl in the direction of the current (I), and the thumb shows the direction of the magnetic field (B). When applied to a straight wire, the thumb shows the direction of the current and the fingers show the direction of the magnetic field. Hand Rule Source:
Electromagnetic Induction
I B S N B I I
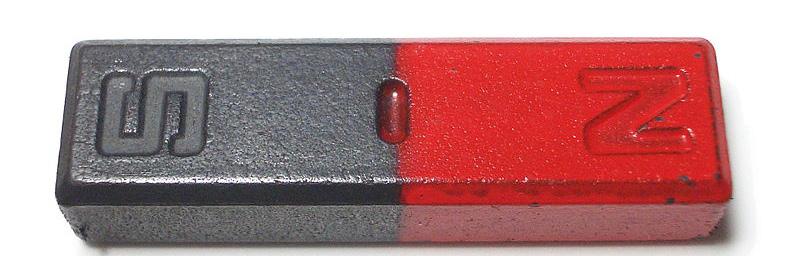
Magnets have north (N) and south (S) opposing magnetic poles very much like the Earth does. When you hold two permanent magnets near each other, you can feel the effect the magnetic fields have on them. The north poles of the two magnets will repel each other as will both south poles, and the north pole of one magnet will attract the south pole of the other magnet.
Most complex wiring systems, such as electronics and household wiring, use a combination of series and parallel circuits. Your home has a main power source, where the electric power comes in from the utility. From there, multiple circuits are connected that each radiate to different rooms or appliances in your home. Each of the components on one circuit breaker is wired in series, but all of the circuit breakers are wired parallel to each other from the main power source. Holiday lights with LEDs are also wired in a combined series and parallel configuration. Several sections are wired in series, and each of the sections are wired parallel to each other where they connect to the plug and the outlet.
Magnetism
Electromagnets are temporary magnets. An electromagnet is made by using a ferrous material as a core and winding an electrical conductor (such as an insulated wire) around it several times. The coil of multiple windings is not electrically connected to the core.
©2022 The NEED Project Your Future In Wind Energy Student Guide www.NEED.org 5
There are two general types of magnets: Permanent magnets are made from ferrous materials, which contain iron, that have their magnetic poles largely aligned. An object with enough iron can be made into a magnet by running a large electrical current through it. However, the strength of the magnet can be reduced or eliminated by physically striking the material (as in with a hammer). So if you like your powerful permanent magnet, don’t drop it!
Wikimedia Commons
Right
Electric current needs a pathway to flow; this is called a circuit. Circuits can be closed, forming a continuous pathway, or open, which has a break in the path. Current will not flow in an open circuit. Switches are used to open or close circuits to turn things off and on. When connecting loads in a circuit, there are two arrangements. Series circuits have all the components wired so that only one pathway is available for electrons to travel. Parallel circuits allow for more than one pathway for electric current to flow. Simple electrical devices are wired in series. A flashlight, for example, has the power source, switch, and light bulb all wired in line with each other. There is only one path for electricity. When series circuits are not operating correctly, they are relatively easy to troubleshoot; just locate the place in the circuit where the connection has been lost. Parallel circuits are useful when one power source is used to operate several loads. By using parallel wiring, one device can be switched off while another is switched on.
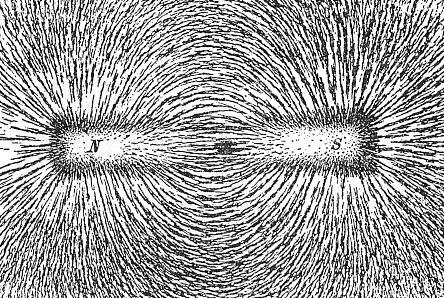
BAR MAGNET Image Source: Wikimedia Commons LINES OF MAGNETIC FLUX Image
Electric Circuits
The lines of magnetic flux within a magnetic field are easy to see when visualized by iron filings in a clear container with mineral oil. The filings will move within the oil and align themselves with the magnetic field. You can also do this if you have small steel bearings or loose iron filings. Place the magnet beneath a sheet of paper and sprinkle the bearings or filings on the paper. The tiny pieces of metal will align with the magnet’s magnetic field.
Distributing Electricity
PowerTower ElectricPoles
There are three ways to increase the power generated by an alternator by a wind turbine: increase the speed of the wind, turning it faster; increase the magnetic field that cuts through the coils of wire by using bigger magnets or electromagnets; or increase the number of turns of wire in the coils that rotate within the magnetic lines of flux, making bigger coils. Each of these options will provide additional power generated by the alternator.
Generators
Step-down transformers located at substations along the lines reduce the voltage to 12,000 volts. Substations are small buildings in fenced-in areas that contain the switches, transformers, and other electrical equipment. Electricity is then carried over local distribution lines that bring electricity to your home. Distribution lines may either be overhead or underground. The overhead distribution lines are the electric lines that you may see along streets. Before electricity enters your house, the voltage is reduced again at another transformer, usually a large gray can mounted on an electric pole. This neighborhood transformer reduces the electricity to 240 and 120 volts, the amount needed to run the appliances in your home. Electricity enters your house through a three-wire cable. The “live wires” are then brought from the circuit breaker or fuse box to power outlets and wall switches in your home. An electric meter measures how much electricity you use so the utility company can bill you. The time it takes for electricity to travel through these steps—from power plant to the light bulb in your home—is a tiny fraction of one second.
Generating electricity is great, but few of us live next-door to a power plant. Electric power generated in a power plant needs to get to the buildings where we use it. First, the electricity is generated at the power plant. Next, it goes by wire to a transformer that “steps up” the voltage. A transformer steps up the voltage of electricity from the 2,300 to 22,000 volts produced by a generator to as much as 765,000 volts (345,000 volts is typical). Power companies step up the voltage because less electricity is transformed to thermal energy along the lines when the voltage is high. The electricity is then sent on a nationwide network of transmission lines made of aluminum. Transmission lines are the huge tower lines you may see when you are on a highway connected by tall power towers. The lines are interconnected, so should one line fail, another will take over the load. This network is commonly referred to as the electrical grid.
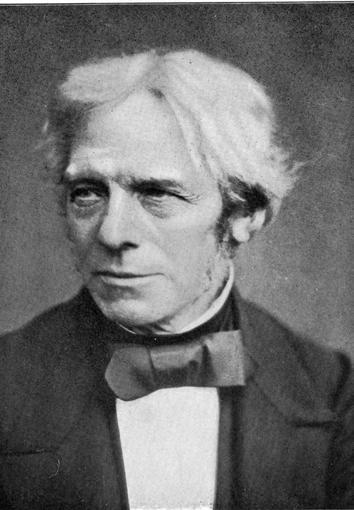
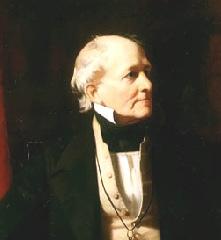
Michael Faraday
Michael Faraday did much of the initial work on electromagnetic induction. A law was named after him as a result of his work. Faraday’s Law states, “the electromotive force around a closed path is equal to the negative of the time rate of change by the magnetic flux enclosed by the Electromotivepath.” force or EMF is another way of saying voltage. The “closed path” referred to above simply means circuit. Michael Faraday is famous for much more than the law that bears his name. He invented inductors, motors, transformers, generators, and linear actuators called solenoids that we still use today. The unit of capacitance, the Farad, is named in his honor.
Power plant generates electricity
stepsTransformerupvoltagefortransmission reducestransformerStep-downvoltage(substation)
Transporting Electricity
Transmission lines carry electricity long distances Neighborhood transformer on pole steps down voltage before entering house Distribution lines carry electricity to houses
Generators are devices that take rotating motion and convert it into electrical energy. Generators are made using coils of wire and magnets. Sometimes those magnets are permanent magnets, but other times they are electromagnets using coils of wire wrapped around ferrous cores. Alternators (AC) and Generators (DC) transform rotating motion into electrical energy for us to utilize.
6 ©2022 The NEED Project Your Future In Wind Energy Student Guide www.NEED.org
80% Thin clouds 30%
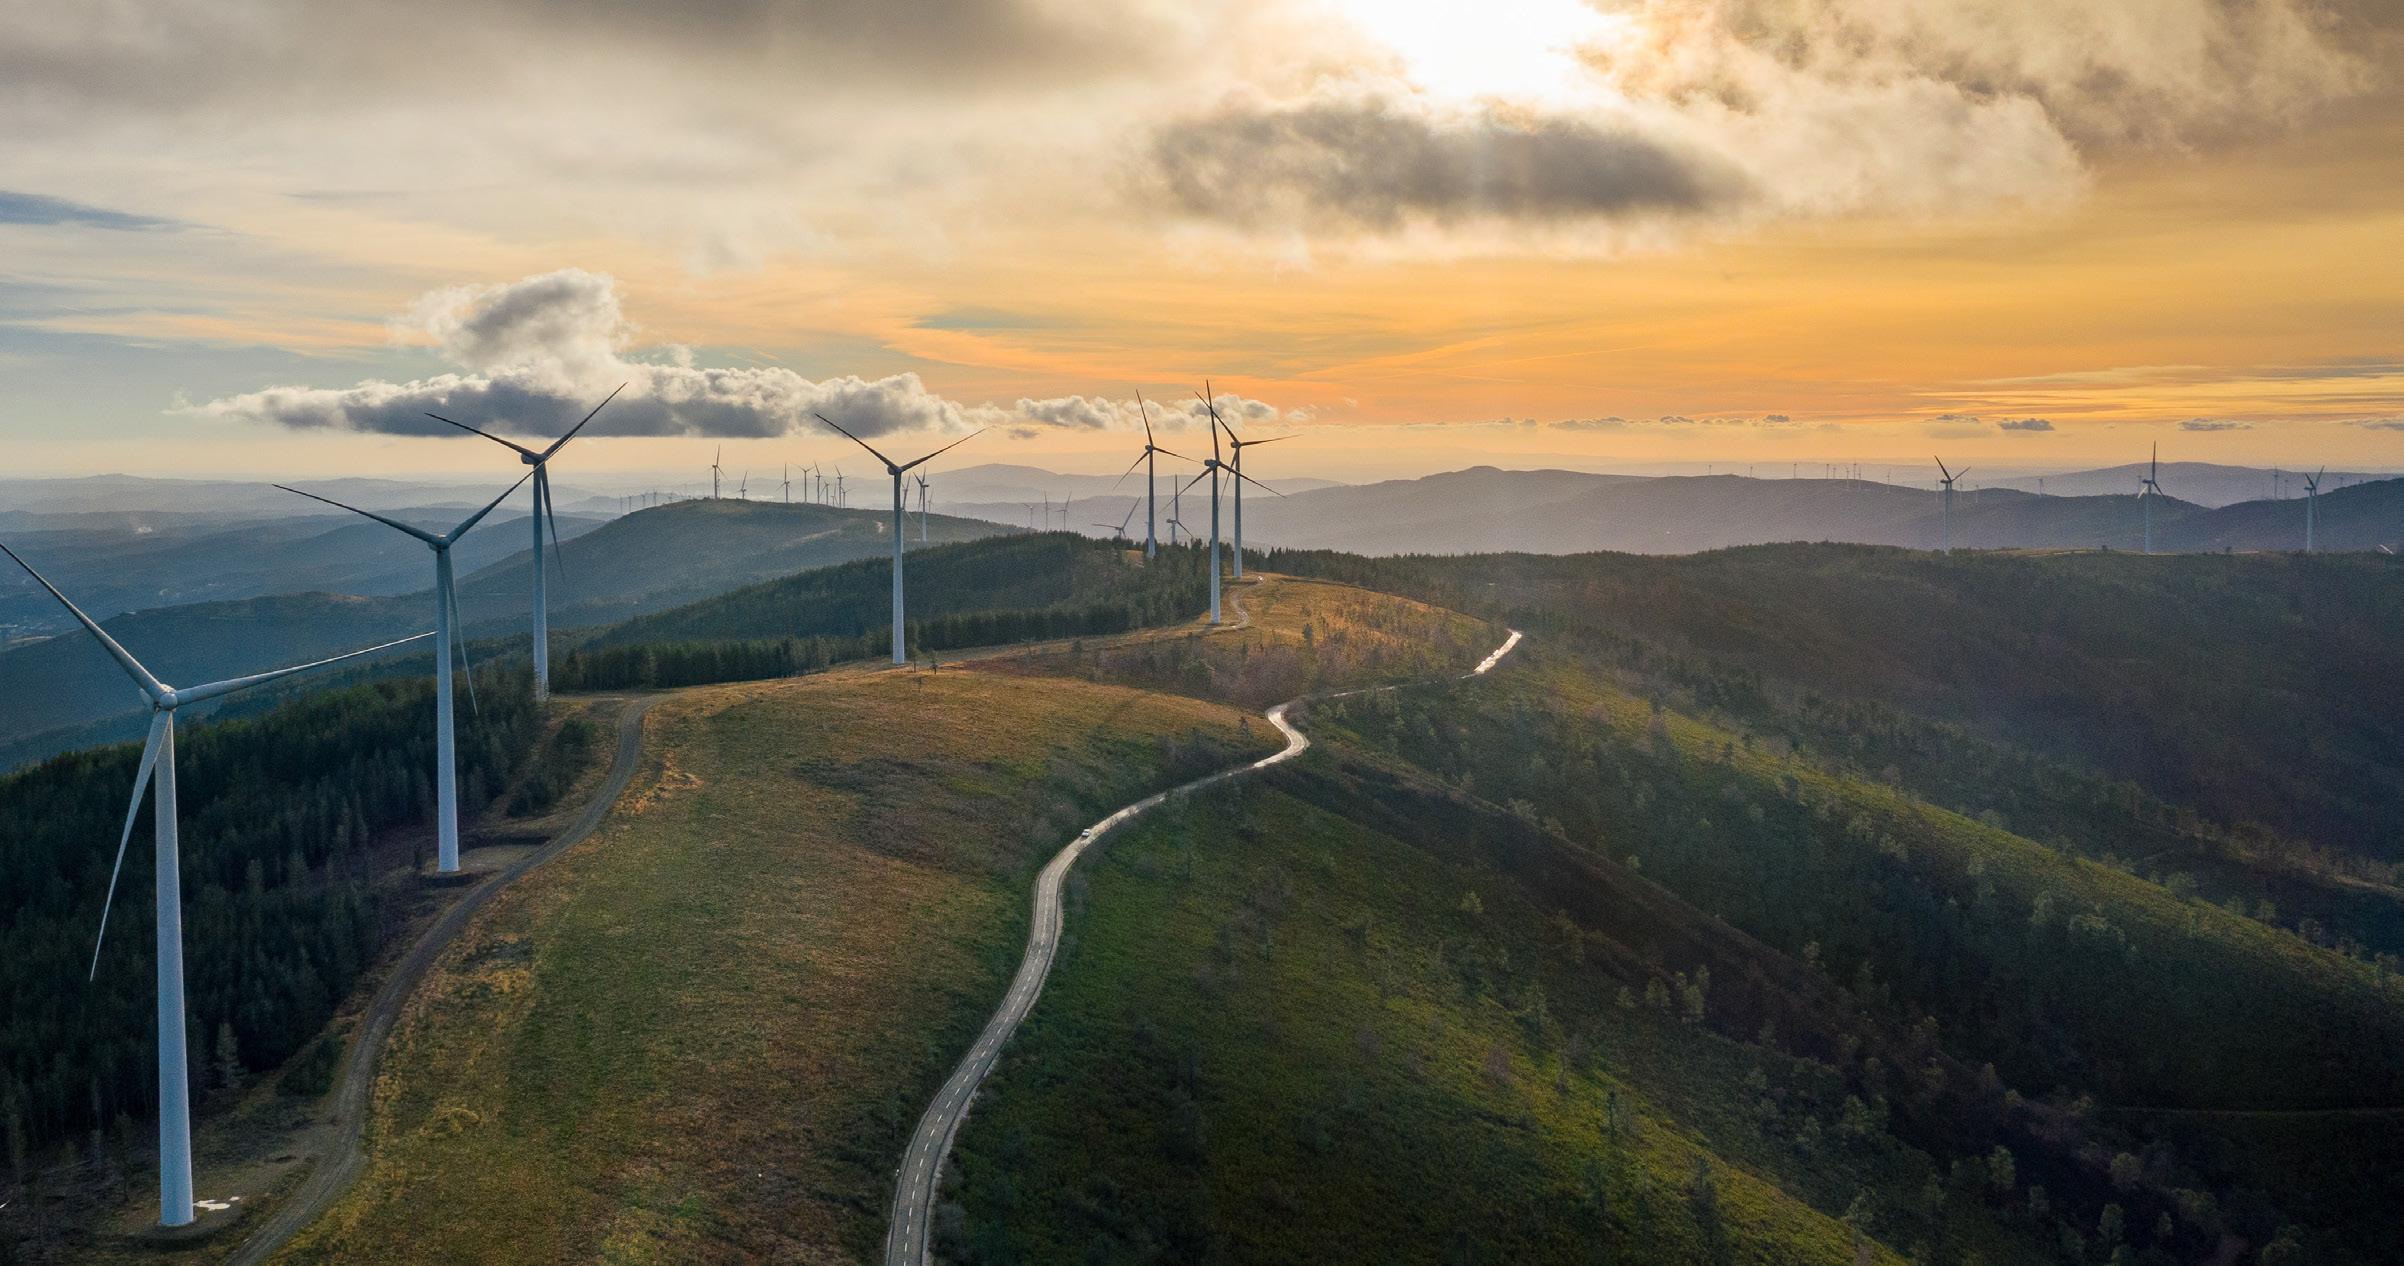
Wind and Turbines
Energy
The energy in wind comes from the sun. When the sun shines, some of its light or radiant energy reaches the Earth’s surface. The Earth near the Equator receives more of the sun’s energy than the North and South Poles. Some parts of the Earth absorb more radiant energy than others. Some parts reflect more of the sun’s rays back into the air. The fraction of light striking a surface that gets reflected is called albedo Some types of land absorb more radiant energy than others. Dark forests and pavement absorb sunlight while light desert sands, glaciers, and water reflect it. Land areas usually absorb more solar (radiant) energy than water in lakes and oceans. When the Earth’s surface absorbs the sun’s energy, it turns the radiant energy into thermal energy. This thermal energy on the Earth’s surface warms the air above it. The air over the Equator gets warmer than the air over the poles. The air over the desert gets warmer than the air in the mountains. The air over land usually gets warmer than the air over water. As air warms, it expands. Its molecules get farther apart. The warm air is less dense than the air around it and rises into the atmosphere. Cooler, denser air nearby flows in to take its place. This moving air is what we call wind. It is caused by the uneven heating of the Earth’s surface.
Light roof 35% to 50% Dark roof 10% to 15% Asphalt 5% to 10% Thick clouds 70%
©2022 The NEED Project Your Future In Wind Energy Student Guide www.NEED.org 7
50% Snow 50%
Forest 5% to 15% Water 5% to 80% (varies
Physics of Wind
At the age of 12, Francis Beaufort joined the British Royal Navy. For more than twenty years, he sailed the oceans and studied the wind, which was the main power source for the Navy’s fleet. In 1805, he created a scale to rate the power of the wind based on observations of common things around him rather than Theinstruments.Beaufort Scale ranks winds from 0–12 based on how strong they are, with each wind given a name from calm to hurricane. The Beaufort Scale can be used to estimate the speed of the wind. with sun angle) to to to Earth’s surface and objects reflect different amounts of sunlight.
What is Wind?
90% Albedo The
Wind is simply air in motion. It is produced by the uneven heating of the Earth’s surface by energy from the sun. Since the Earth’s surface is made of very different types of land and water, it absorbs the sun’s radiant energy at different rates. Much of this energy is converted into heat as it is absorbed by land areas, bodies of water, and the air over these formations.
The Beaufort Scale
BEAUFORT SCALE OF WIND SPEED BEAUFORTNUMBER NAMEWINDOF LAND CONDITIONS WIND(MPH)SPEED 0 Calm Smoke rises vertically Less than 1 1 Light air Direction of wind shown by smoke drift but not by wind vanes 1 - 3 2 Light breeze Wind felt on face, leaves rustle, ordinary wind vane moved by wind 4 - 7 3 breezeGentle Leaves and small twigs in constant motion, wind extends light flag 8 - 12 4 Moderatebreeze Wind raises dust and loose paper, small branches move 13 - 18 5 Fresh breeze Small trees and leaves start to sway 19 - 24 6 Strongbreeze Large branches in motion, whistling in wires, umbrellas used with difficulty 25 - 31 7 Near gale Whole trees in motion, inconvenient to walk against wind 32 - 38 8 Gale Twigs break from trees, difficult to walk 39- 46 9 Strong gale Slight structural damage occurs, shingles and slates removed from roof 47 - 54 10 Storm Trees uprooted, considerable structural damage occurs 55 - 63 11 Violentstorm Widespread damage 64- 72 12 Hurricane Widespread damage, devastation Greater than 72 Source: National Oceanic and Atmospheric Administration
Wind


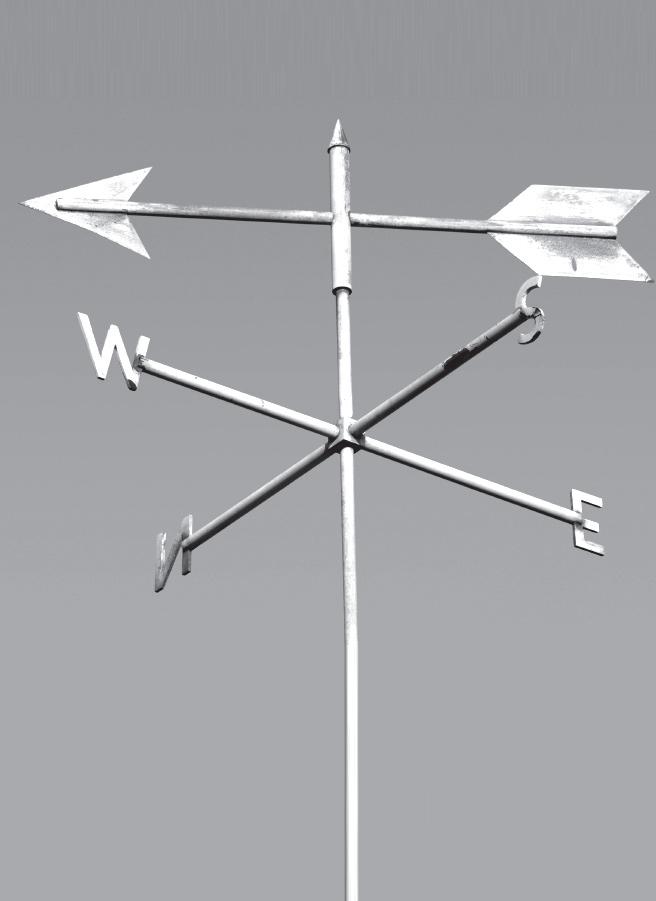
Wind direction is reported as the direction from which the wind blows, not the direction toward which the wind moves. A north wind blows from the north toward the south.
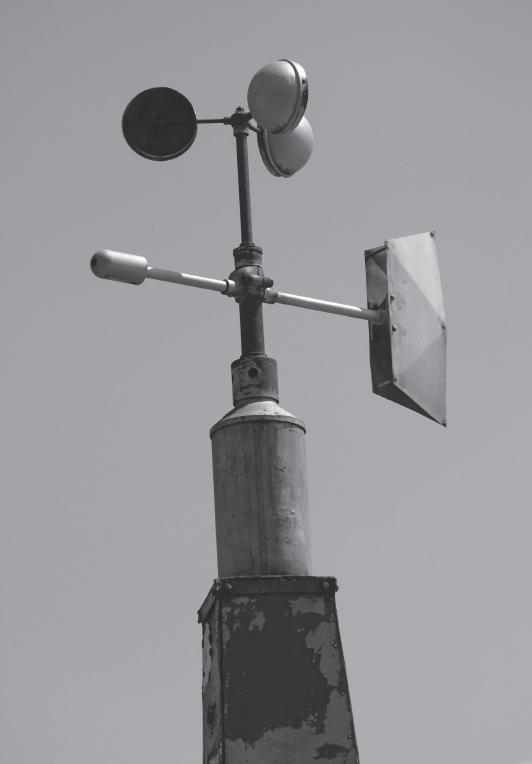
WIND VANE ANEMOMETER
8 ©2022 The NEED Project Your Future In Wind Energy Student Guide www.NEED.org
Wind Shear and Turbulence
Measuring Wind Direction and Speed
πr
WIND DIRECTION
(m/s)3 ρ
½
When wind moves across the Earth’s surface, it is slowed by friction as it runs into and flows around obstacles on the surface or meets other air masses. Friction also affects the direction of the wind. Higher in the atmosphere, away from the Earth, the wind meets fewer obstacles, and therefore less friction is produced. Winds there are smooth and fast. Wind shear is defined as a change in wind speed and/or wind direction at different heights in the atmosphere or within a short distance. It can be in a horizontal direction, a vertical direction, or
Wind power, measured in watts, is determined by air density, the area swept by the turbine blades, and wind velocity, according to the following formula: = = (kg/m3) x x = air density; 1.2 kg/ m3 at standard ambient temperature and pressure A = swept area (A = 2) V = velocity r = radius = 3.1416 m = meter s = second Wind speed can be measured using an instrument called an anemometer. One type of anemometer is a device with three arms that spin on top of a shaft. Each arm has a cup on its end. The cups catch the wind and spin the shaft. The harder the wind blows, the faster the shaft spins. A device inside counts the number of rotations per minute and converts that figure into miles per hour (mph) or meters per second (m/s). A display on a recording device called a data logger shows the speed of the wind. There are also digital anemometers that measure wind speed.
π
Turbulence is defined as a variation in the speed and direction of the wind in very short time periods (1 second) that results in random, disordered movement of air molecules. It occurs when the flow of wind is disturbed, and the direction or speed is changed. When wind mixes warm and cold air together in the atmosphere, turbulence is also created. This turbulence is sometimes felt as a bumpy ride during an airplane flight.
Wind shear and turbulence are important factors for wind turbine engineers to study because they can affect the operation and output of turbines, and even cause them to fail. Studying the wind shear and turbulence in an area often tells engineers more about how high to place the tower of a turbine to get the best wind conditions.
(m2)
½ ρAV3 Watts
Wind Velocity Wind speed is important because the amount of electricity that wind turbines can generate is determined in large part by wind speed, or velocity. A doubling of wind velocity from the low range into the optimal range of a turbine can result in eight times the amount of power produced. This huge difference helps wind companies decide where to site wind turbines.
Wind direction is reported as the direction from which the wind blows, not the direction toward which the wind moves. in both directions. Some wind shear is common in the atmosphere. Larger values of wind shear exist near fronts, cyclones, and jet streams. Wind shear in an unstable atmospheric layer can result in turbulence
Power
Wind Direction A weather vane, or wind vane, is used to show the direction of the wind. A wind vane points toward the source of the wind. Some locations such as airports use windsocks to show the direction in which the wind is blowing.

1981 2013
National O shore Wind Strategy announced. First grid-connected o shore wind turbine is installed o the coast of Maine. Wind energy provides 8.4% of U.S. electricity. 2016 202020111990 2012 2014 2019 As energy prices skyrocketed interest in wind power was rekindled. Newer designs of wind turbines were more e cient and more powerful than early models.
1200s 1890 1893
The History of Wind Energy
©2022 The NEED Project Your Future In Wind Energy Student Guide www.NEED.org 9
Daniel Halladay designs the Halladay Windmill speci cally for pumping water from wells in the American West. First utility-scale wind farms are installed in California. These early wind farms led to better understanding of environmental considerations and proper siting. The use of wind-driven mills expanded to include grinding cocoa and gunpower and to other tasks including pumping air into mines.
Poul LaCour invented a wind turbine generator that could generate electricity. 1970s1700s1800s1300s 1854 1890s 1941 1980 Smockmills, with fabric sails instead of wooden blades, were used. The sails were attached to the cap, and this was the only part that rotated. Smockmills were bigger, heavier, and stronger than Windpostmills.generates less than 1% of electricity in the U.S. U.S. installed wind capacity surpasses 100 GW. Cost of electricity from newly constructed wind farms calculated at about $0.08 per kWh. Steel blades replaced wood blades on American windmills. A 1.25 MW wind turbine is installed in Vermont, providing power to the local utility. Europeans build postmills, which used wind energy to grind grain bet ween t wo large stones The entire mill was rotated to face the wind NASA scientists Larry Viterna and Bob Corrigan develop a method for predicting wind turbine performance. Known as the Viterna Method, it is still used today. U.S. Wind Turbine Service Technician named the fastest-growing job of the decade. Cost of electricity from newly constructed wind farms calculated at about $0.03 per kWh. U.S. installed wind capacity reaches 60 GW. Wind energy is showcased at the World’s Fair in Chicago, Illinois.
Blade Length: 354ft
The wind turbines used to generate electricity today only somewhat resemble the windmills used centuries ago. In fact, the only similar features are blades built to be pushed by the wind that sit on top of a taller, narrow tower. Today’s wind turbines are taller, sleeker, and more efficient at transforming the wind’s energy into rotational motion, which is transformed into electricity.
The tower is a tall, narrow pole that extends the rest of the turbine into the air. Wind turbine towers are typically made of painted or coated steel, are hollow, and have ladders for workers to climb to the nacelle for repairs or maintenance. Connection cables run down through the tower and it typically has lighting and other safety-related equipment and installations inside.
If you’ve looked at pictures of wind turbines, you’ve noticed that the blades are not flat, but are attached to the hub at an angle. If the blade has no pitch (or angle), the blade will simply be pushed backwards (downhill) by the wind. But since wind turbine blades are set at an angle, the wind is deflected at an opposite angle, pushing the blades away from the deflected wind. This phenomenon can be viewed on a simple, flat blade set at an angle. If you push the blade with your finger from the direction of the oncoming wind, the blade will deflect away from your finger.
Service operation vessel Tower: *452ft to 492ft Water Depth: 80ft - 150ft+ Transition Max ~800ft to 900ft Electricity Cables Area: 1.3 million ft3 Generation Capacity: 14MW Foundation
10 ©2022 The NEED Project Your Future In Wind Energy Student Guide www.NEED.org
The foundation of a wind turbine is what anchors the turbine to the ground. Onshore it is made of concrete and extends deep into the ground. Offshore turbines have foundations that can be fixed to the sea floor, or floating.
Using Wind to Generate Electricity Modern Wind Turbines
The nacelle is the box on top of the tower. It contains the generator, gear box (if applicable), and connection point for the hub. This is where the rotational motion of the rotor hub is transformed into electricity in the generator.
Height:
There are five main parts of a wind turbine: Foundation; Tower; Nacelle; Hub; and Blades. Each of these pieces works together to position the turbine appropriately to maximize the energy captured by the turbine and transformed into electricity.
Piece
Rotor Hub TowerBladeNacelle
The Shape of Things
Newton’s Third Law of Motion is applicable to wind turbine blades because the wind does the pushing. Moving air exerts a force on the turbine blades, and the turbine blades exert a force back on the wind.
The rotor hub is the site where the blades are connected to the generator. It rotates when the wind pushes on the blades.
The blades are the parts of the turbine pushed by the wind. Their shape is designed to maximize the amount of energy the turbine is able to capture from the wind.
The shape of turbine blades is not haphazard. They are designed in accordance with Newton’s Third Law of Motion and the Bernoulli Effect Newton’s Third Law of Motion states that for every action force, there is an equal but opposite reaction force. For example, if your feet are pushing down on the floor, the floor is pushing up on your feet equally hard. If your feet pushed harder than the floor pushed back, you would sink through the floor. If the floor pushed back harder than your feet, you would fly up into the air.
O shore Wind TurbineRotorDiameter: 728ft Swept


Material Property Charts
Bernoulli’s Principle, or the Bernoulli Effect, tells us that faster moving air has lower pressure. Wind turbine blades are shaped so that the air molecules moving around the blade travel faster on the downwind side of the blade than those moving across the upwind side of the blade. This shape, known as an airfoil, is like an uneven teardrop. The downwind side of the blade has a large curve, while the upwind side is relatively flat. Since the air is moving faster on the curved, downwind side of the blade, there is low pressure on this side of the blade. This difference in pressure on the opposite sides of the blade causes the blade to be “lifted” towards the curve of the airfoil.
Forces are Vector Quantities
A force is a push or pull. If you push a door open, you are exerting a force on it. In physics, quantities are expressed as two forms: scalar and vector.
Materials in Wind Turbines
©2022 The NEED Project Your Future In Wind Energy Student Guide www.NEED.org 11
AIRFOIL SHAPE: A CROSS-SECTION
When it comes to selecting materials for a project, application is key. It is important to consider exactly how the materials will be used, and which properties are most important. When considering the materials for a wind turbine, several factors come into play, including availability, cost, strength, and transportability of the materials. Materials that are lightweight and strong, but extremely expensive, may not be practical in the quantities needed to construct a wind farm. When a design team is choosing the materials from which a wind turbine will be constructed, the push of the wind is an important consideration. Wind turbines need to be rigid to withstand all that wind, but they also need to be somewhat flexible. Engineers have learned to mimic nature, and building tall structures is a good example of this. Tall trees are strong, but they are not completely rigid. They withstand most winds, but when the wind is particularly Slower air Faster air
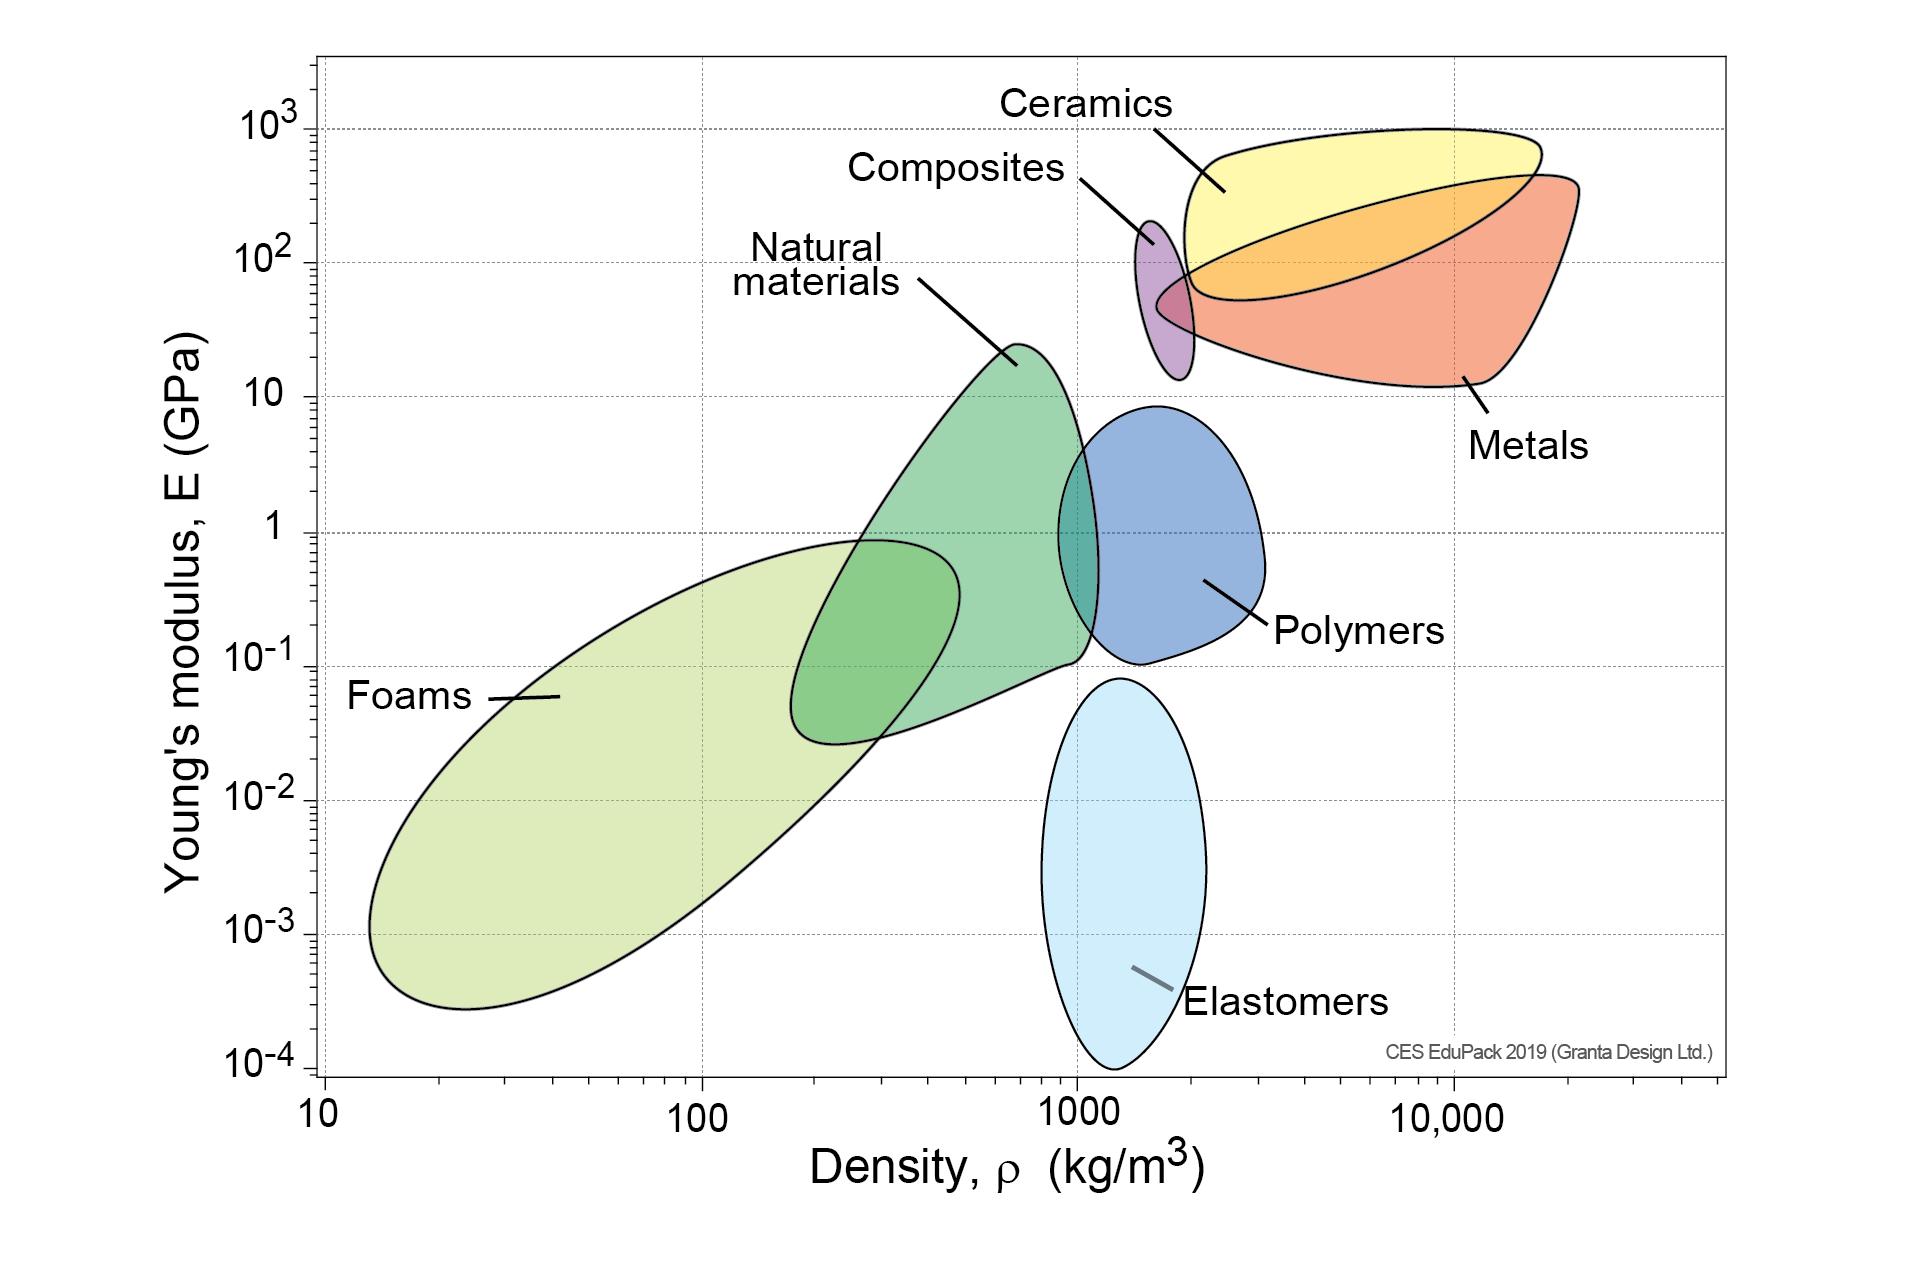
The first chart on page 12, Figure 1, shows Young’s Modulus vs the density of many different materials. The Young’s Modulus is a measurement of how much a material deforms under pressure; the higher the number, the less the material deforms. You should notice a couple important things about the chart. First, this basic chart is showing families of materials, not specific materials themselves. Perhaps the most important observation, though, is that the axes are logarithmic rather than linear. This means that every major division noted on the axis indicates a 10x increase. For example, the density of most elastomers and polymers is about 10 times higher than foams. Metals are about 100 times more dense than foams. Understanding the exponential nature of these properties is important. When transporting finished turbine parts to the site of installation, their overall weight, a direct result of the material’s density, impacts the kind of equipment and amount of fuel used to transport them.
Scalar quantities have only magnitude, or size. Percentages are examples of scalar quantities. Vector quantities have both magnitude and direction. Velocity, acceleration, and forces are vector quantities. They have magnitude, expressed by the size, and they have direction. For example, the force of your weight is a number, your weight, exerted downward. strong they flex and bend a little. By doing so, they avoid breaking. Man-made structures that are tall and narrow, like skyscrapers and wind turbines, must also be rigid but not too rigid. They need to withstand the force of the wind pushing on them, but they need to be able to flex and bend just a little to alleviate some of the pressure from the Engineerswind.and designers consult material property charts. These odd-looking charts plot two different properties against each other, then shade in the region of the range of values for various materials.
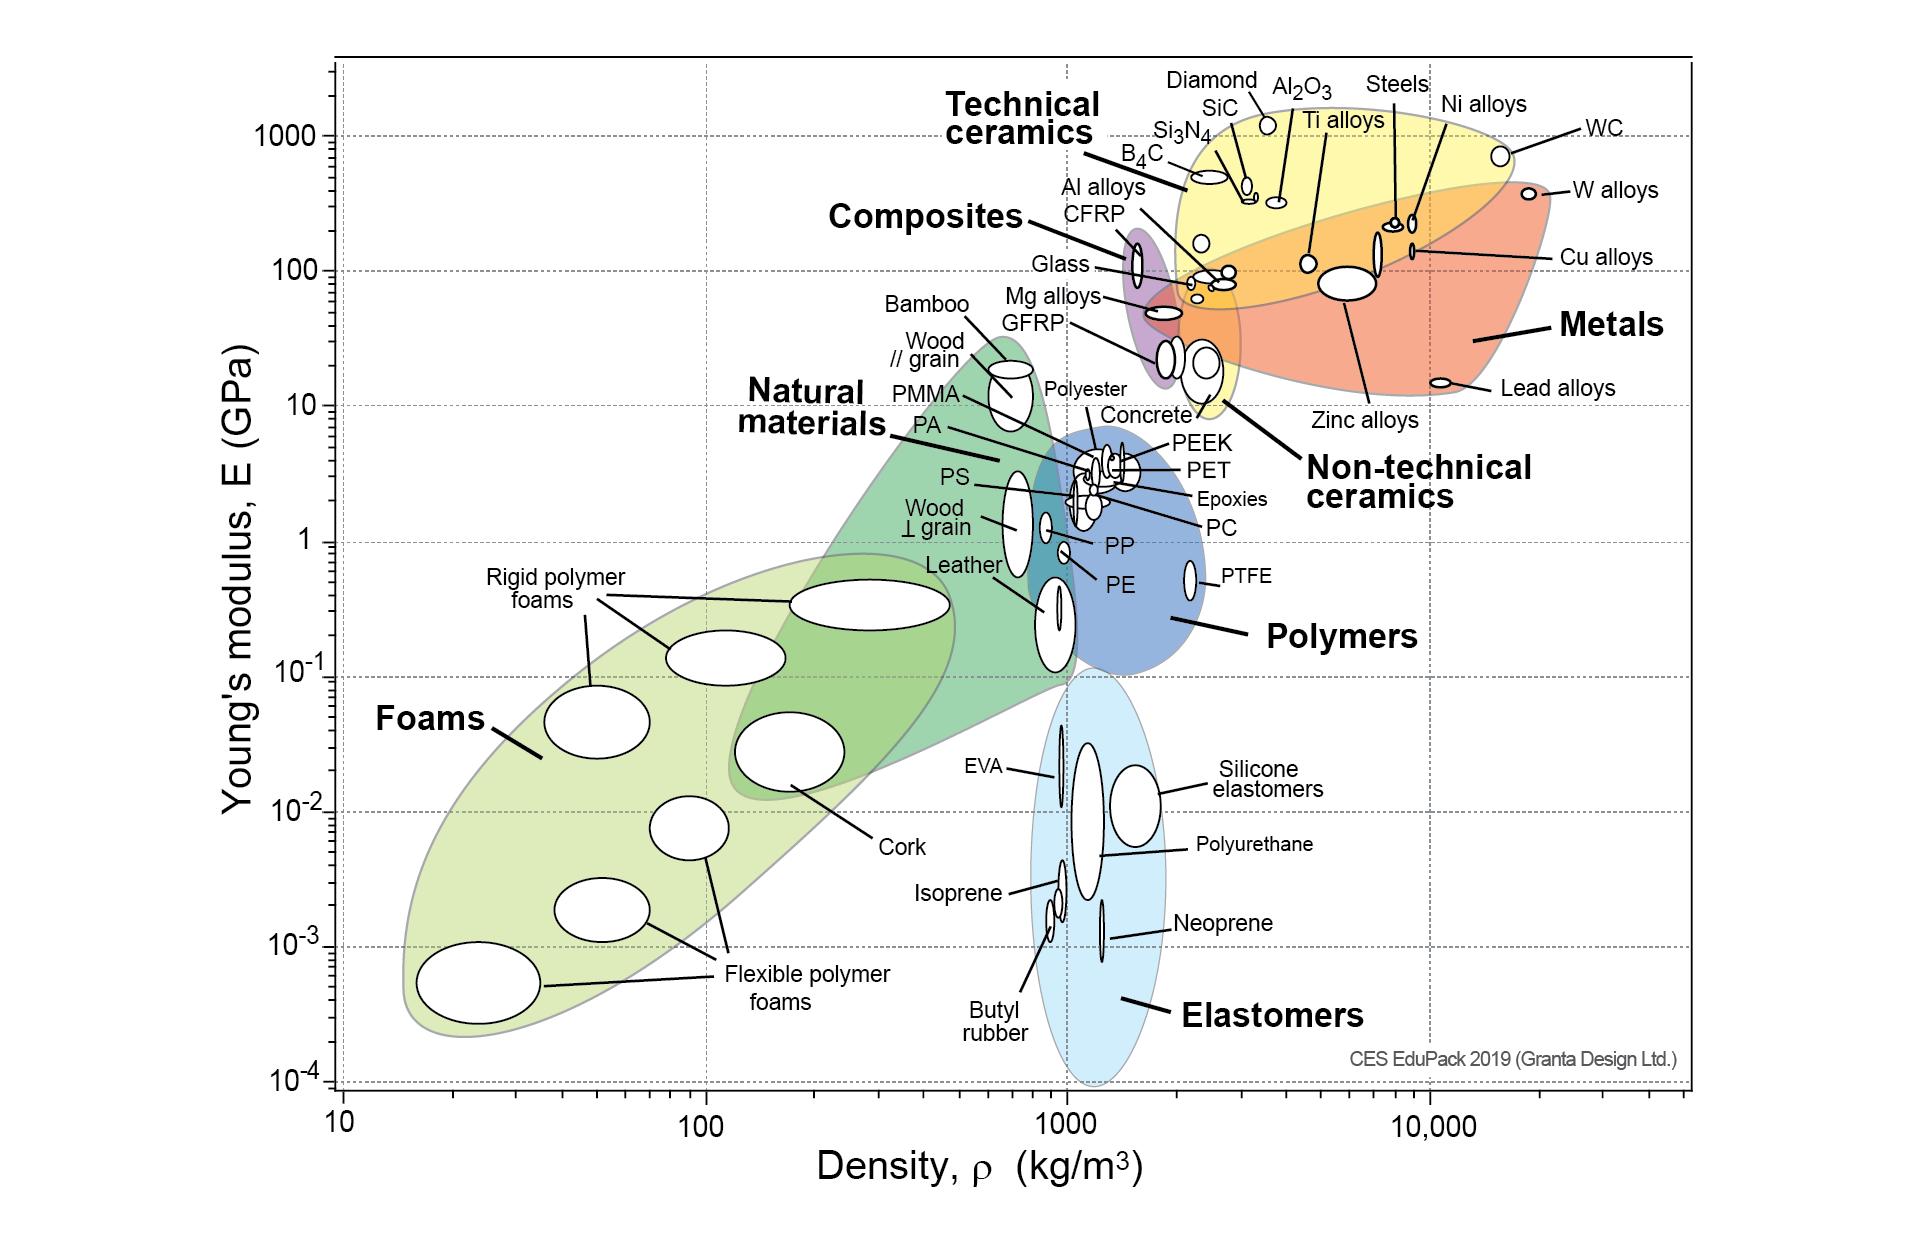
Figure 2: Material selection chart of Young’s Modulus vs density for material families and some specific materials
Using material property charts is one way a design team will decide how to construct an object. This is not the only material selection chart available; there are many that will factor cost of material, thermal conductivity, electrical conductivity, and just about any other physical property you can think of that may be relevant to an application.
Figure 1: Material selection chart of Young’s Modulus vs density for families of materials
12 ©2022 The NEED Project Your Future In Wind Energy Student Guide www.NEED.org
The second material property chart, Figure 2, is more detailed. It shows the ranges of Young’s Modulus vs. density for the families of materials, but plots values for specific materials on top of it. Note that the ranges for specific materials are much smaller.
The Gedser turbine, designed by Johannes Juul and built in 1956 off the Gedser coast in Denmark, took a different approach. It was the first 3-blade design, and the blades had steel spars , wooden ribs, and aluminum shells. This turbine operated for 11 years without maintenance, far outlasting the Grandpa’s Knob turbine. Clearly Juul was on to something with his composite design.
Steel is an alloy of iron and carbon. The iron is extracted from iron ore, melted, purified, and mixed with the right amount of carbon to strengthen it. Without carbon, iron can be soft; the addition of carbon to iron makes it stronger and slightly less dense than pure iron. Steel had been manufactured in small quantities throughout history, but the process was too expensive to be practical for large objects. In 1855 Henry Bessemer patented his steel-making process, which greatly reduced the cost of making steel. The Bessemer Process started with pig iron, and bubbled oxygen through the molten iron to remove impurities. It was an easier and less expensive way to produce large amounts of steel. From then on, steel beams and structural components for tall structures could be made, and suddenly the sky was the limit.
Why is steel a better choice than wood? There are many reasons but the most prevalent is strength. Wood is a very strong building material, and is the best choice for smaller structures like homes due to its cost. However, as structures get bigger and loads , or the forces exerted on structures, increase, steel is a better choice.
Look at materials chart, ‘Figure 2’. Note that wood has a Young’s Modulus about 100 times lower than steel. This means that wood will deform more than steel under pressure. As the height of a building increases, the amount of pressure on the lower parts of the structure increases as well. The last thing you want is for your building to deform under pressure! Wood is strong and lighter, but its limitations dictate using something else for taller structures. In order to reach the altitudes where the wind is strongest and most suitable for utility-scale electricity generation, the tower needed to be taller than the old, wooden structures. While the first steel turbine towers were made of crisscrossing steel support beams, modern turbines use a hollow tube to support the nacelle, hub, and blades. The benefit of this design is that wiring and any other important parts can be secured inside, away from curious humans and destructive weather patterns. Additionally, the tubular tower does not provide any surfaces upon which birds may nest, dramatically reducing the number of bird-turbine collisions.
The first wind turbine built for electricity generation was constructed at Grandpa’s Knob in Vermont in 1941. Made with steel blades, this turbine only functioned for a few hundred hours before the blades failed. Steel was strong enough, but not flexible and not light enough, to be a useful material for this application.
Build a Better Blade
Wind Turbine Tower Material: Steel Until the Industrial Revolution, buildings were constructed primarily of wood with masonry walls. Because of the strength limitations of wood and the thickness of those walls, the height of buildings was limited to about 3 or 4 stories high. Cathedrals were a little taller, but their heavy, arched, stone walls and roof made them very expensive to build. Then along came steel.
©2022 The NEED Project Your Future In Wind Energy Student Guide www.NEED.org 13
The foundation and tower of a wind turbine are, by necessity, very strong. They need to be to elevate the turbine to the height where winds are strongest and most consistent. The turbine blades, though, need to meet a different set of standards. They need to be strong enough to resist wind damage, but light enough to be moved by wind. This creates a design challenge for engineers –how to construct blades that are both strong and lightweight.
The answer is composite materials. Composites blend materials in a way to take advantage of the best properties of two or more materials. For example, building a wood deck on a house requires that the deck remain stable and strong for many years, while also being affordable and buildable by the average homeowner. However, over time, even treated lumber will rot when exposed to rain, snow, and sunlight. Paint or other treatments can prolong the life of the wood, but require regular reapplication. Furthermore, deck lumber is made from trees which take years to regrow. A newer way to build decks is by using composite boards made from sawdust and recycled milk jugs. They are environmentally friendly, longer lasting than regular wood, and have much lower maintenance than wood. They combine the strength of the wood fibers with the durability of the high-density polyethylene from the milk jugs. Manufacturers of composite boards incorporate colorants into the material so homeowners can choose the color of boards to complement their homes and not need to paint or stain them regularly. By using composite materials to build a deck, the best properties are utilized while the downsides of wood alone are Compositeavoided.deckboards are a homogeneous material, meaning they are the same top-to-bottom, inside-to-outside. Wind turbine blades are built using composites in a different way. They have a strong but lightweight inner core surrounded by a strong outer shell. The composite materials themselves are homogeneous, but the overall construction of the blade is not.
Using steel has also allowed offshore wind turbines to be about 1/3 taller than those built on land, increasing the generating capacity of each wind turbine. While most onshore wind turbines have generating capacities of about 2.5 MW, offshore turbines can be as high as 15 MW, decreasing the number that need to be built to achieve the same electricity generation.
Look again at the materials chart ‘Figure 2’ on page 12. Locate the range of values for steel, wood, glass, and epoxies. Notice that glass and epoxies have very similar densities , meaning chunks of each material that are the same size will have the same weight. Both are much lower in density than steel and are stronger than wood. However, epoxies aren’t quite as strong as glass. Another factor here is cost. Resins are least expensive, followed by steel, then glass. To solve the weight, strength, and cost problem, materials other than wood and metals need to be used.
AdhesiveJoint AdhesiveJoint
Cross-Section of a Wind Turbine Blade
Turbine blades are still the most expensive part of the turbine to manufacture, so bringing the cost of their production down has been important to making wind energy a viable method for generating electricity. Today’s blades are manufactured through a technique called resin infusion. The fibers in the blades are laid
inside a closed, sealed mold. As the fibers are laid in the mold, they are oriented in the same direction along the length of the blade, tapering from very thick near the root of the blade to thinner toward the tip. The layers, or plies, of fibers are forced together by applying a vacuum. The resin material, which is the bonding agent, is then injected into the mold. The entire assembly is heated so the resin can cure before the mold is opened and the shell removed.
Top Section
In the 1970s, composite blades, using lightweight fibers for strength and resins for durability, were built. These blades are a type of manufacturing sandwich, consisting of two shells joined by adhesive joints and web spars inside that provide the rigidity necessary. At first, the upper and lower shells were made by placing glass fibers in a mold and brushing bonding materials over the fibers by hand. Called an open mold process, this method for manufacturing turbine blades was very expensive in terms of labor costs and did not always result in good quality products. Furthermore, this method had its own problems with environmental impacts of the materials being used.
14 ©2022 The NEED Project Your Future In Wind Energy Student Guide www.NEED.org
*Shaded areas indicate areas of added strengthening In the cross-section of a modern wind turbine blade, the upper and lower composite shells are sandwiched with supporting web structures in the middle and adhered at the joints shown.
Made from composite Bottom Section Made from composite Interior web spars made from aluminum or balsa wood
The shell is attached to spars and sandwiched to its complementary shell to form the sandwich, and one blade is complete.
The fibers used in commercially manufactured wind turbine blades are made of borosilicate, or E-glass, fibers. The weight of the blade is 75 percent glass fibers. Other, lighter glass fibers are available, and stronger fibers like carbon fibers can work just as well, but the lighter, stronger fibers are cost-prohibitive.
Direct Drive Wind Turbine DiagramBladdeaRotor Hub Generator
It’s not enough to plop a wind turbine on a foundation and expect it to just generate electricity like magic. After building a highquality turbine, it must be properly configured and connected to the grid to generate power appropriately. There are several systems that facilitate electricity generation from a wind turbine, regardless of its location. Gear Systems Wind turbine blades rotate from the force that the wind exerts on them. As the blades rotate the hub, a shaft connected inside the nacelle spins to turn the AC generator. However, the turbine shaft often spins at a different rate than needed to produce the 60 Hz AC power for the grid system. The speed of the turbine needs to be manipulated to achieve the correct rotational frequency to generate AC power at 60 Hz and not some other frequency. This is often accomplished using gears.
Many offshore wind turbines being built today do not have gear box systems. The reason for this is that gear boxes present another mechanical system that requires maintenance and repair, and accessing offshore wind turbines is much more complicated than those constructed on land. These direct-drive turbines turn the generator directly from the hub, and the electricity is adjusted at the substation for the offshore installation before it is sent onto the grid.
©2022 The NEED Project Your Future In Wind Energy Student Guide www.NEED.org 15
Generating Power
Direct Drive Systems
BladeTowerBladeNacelle Tower Bl
Low-speed shaftRotor Hub Gear High-speedbox shaft Low-spRotor Hub Generaatotr Blade Nacelle
Gears do a lot of things. We can use gears to turn several items from just one power source, and we can use gears to increase or decrease the speed of a power source. In the case of our turbine, if it is rotating faster than we would like, a small gear would be attached to the turbine and coupled to a large gear attached to the generator. The degree to which a power speed is changed is determined by a gear ratio. Let’s say the turbine is turning at 1,000 revolutions per minute (rpm), and the generator needs 500 rpm. If we put a gear with 20 teeth on the turbine, we would attach a gear with 40 teeth to the generator, and the speed would be reduced by half. If a greater speed is necessary, a large gear is placed on the turbine and a smaller gear is placed on the generator. Frequently, a simple pair of gears is not adequate to change the speed as much as needed. Complex gears can be built, where a small gear is stacked on a large gear, and more than one set of gears is driven. When this occurs, the gear ratio is determined by multiplying the number of teeth of all the input gears, and dividing that by the product of all of the teeth of the output gears. The ratio tells you how many turns of the drive gear will turn the last output gear one revolution.
Controls Every day, we use the simplest of control systems: we evaluate light levels and make the decision to turn on a light. Or, hopefully, you realize you’re leaving the room and decide to turn off the lights. This is what a control or control system is designed to do. Controls evaluate certain operational criteria, then use known values of the written program to change the operating conditions of a device or system of devices.


Living in a Digital World Control systems now run primarily on digital controls, which can do everything an analog system can do and more. Digital controls use a discrete signal, a 1 or a 0 (and nothing else), to control an outcome. Where analog controls can use a sliding scale of values or inputs, digital controls have two choices and only two choices, which allows for greater precision in affecting outcomes. Digital controls are also less bulky and produce less heat, making them more efficient to operate. If less electricity is being transformed to undesirable thermal energy, less electricity is needed to operate the device overall. As industrial facilities update and modernize their systems, analog controls are being changed out for digital controls, or are being incorporated into digital control systems which can accommodate them.
Control Systems
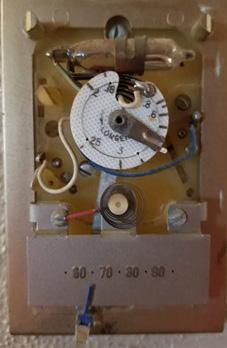
The thermostat was set by moving a slider in one direction or another to raise or lower the temperature. This would change the position of the bimetal strip and consequently the temperature at which the mercury switch would applicationsactivate. could be manufactured to have higher precision and accuracy than what was found in household thermostats, but they were always working in a world of approximations.
The first control systems developed are now identified as analog systems. An analog control uses an approximated, or analogous, measurement to control a system. The most familiar analog control is the old, mercury switch thermostat nearly every home had for controlling central heating systems. The scale on the outside of the thermostat was not always calibrated properly, and therefore more of an approximation of temperature. In fact, some times the thermostat would be set at an apparent temperature of 70 degrees Fahrenheit, when in fact the actual temperature was much warmer or colder.
Close Enough
Analog systems are not the most efficient means of controlling an outcome. However, until digital controls were developed, they were all that was available. Gauges and other devices in critical Mercury Switches
Before anything is constructed, there is usually some kind of drawing or diagram showing how the object is to be made. Bookshelves have assembly instructions showing step-by-step which parts go where and the fasteners used to hold them in place. Homes have construction drawings showing the location of the walls, the distance between them, and the location of everything inside of them from walls and doors to switches and electric outlets. Control
The mercury switch used a bimetal strip that was a sandwich of two metals with different rates of expansion. The bimetal strip was connected to a glass capsule containing mercury and two contacts. As the temperature increased or decreased, the metal with the higher rate of expansion would change its length to a greater degree than the metal with the lower rate of expansion, causing the strip to curl or straighten. The capsule with the mercury would tilt one direction or another; one direction would cause the mercury to bridge the gap between the two contacts inside the capsule and complete the circuit, thereby turning the system on. The other direction would cause the mercury to flow away from the contacts, opening the circuit, and turning the system off.
Almost every industry uses control systems. Control systems are devices that are linked together logically to control outcomes. The outcome will be industry-specific, such as how quickly a part is manufactured or how much electricity is produced at a power plant. But the principles guiding control systems are the same regardless of the industry in which they are installed, and the same concepts apply across-the-board.
There are controls more complex than light switches in our homes, too. One example is a thermostat. It senses the temperature of a room and then signals the furnace or central air conditioning system to turn on or off. The criterion is the temperature you have set, and the action is operating the heating or cooling system.
Imagine how uncomfortable you would be if you had to decide to do this! You would wait until it was too hot or too cold, and then turn the device on or off. The temperature in your home would be constantly rising or falling. Operating a heating and cooling system this way is neither energy-efficient nor cost-effective. Microwaves use a timer to determine how long to run. The timer is essentially saying “run for this long, then turn off.” If you use the microwave at a power level other than full power, you’re also setting that control. Every time you touch the keypad of your microwave you are using a control system.
Mapping it Out
16 ©2022 The NEED Project Your Future In Wind Energy Student Guide www.NEED.org
Controls in Our Homes
Stacking gears allows dramatic changes in gear ratios. The ratio of this combination is obtained by multiplying the number of teeth in gears A and C and dividing it by the product of the number of teeth in gears B and D. A DC B Gears in Motion
Second, the installer programs the remote openers so that the homeowner’s garage door opens, and not a neighbor’s. This is done by pressing the correct sequence of buttons on both the opener and the remote transmitter. It’s similar to syncing your game system controller to your game system.
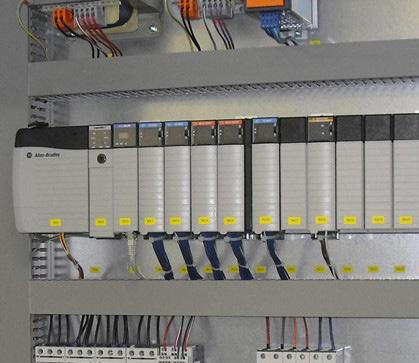
PLCs control a wide variety of industrial systems and subsystems. They implement digital control processes where logic relays were previously used. PLCs make automated systems possible and troubleshooting easier to perform. The use of PLCs originated in automotive manufacturing on assembly lines in the late 1960s and are now present throughout most industries and large scale systems such as onboard ships, in manufacturing facilities and in large-scale energy generation systems such as wind turbines.
First, the installer sets the limits for the opener. These limits tell the opener when the door is fully open or fully closed. If the unit tried to push the door beyond one of these limits, the motor, door, or other parts would likely be damaged.
Unlike wiring diagrams, schematic symbols are used in ladder logic drawings, and the process for the entire control system can be traced on the drawing.
Construction drawings are prepared digitally with computer-aided drawing software. They show the spatial layout of the building or room(s) where the control system is located. The drawings will also identify each of the materials, parts, and components of the building and system and show where each should be located.
Third, the installer aligns an infrared laser and detector near the bottom of the garage door opening. The purpose of this laser is to provide feedback that tells the opener that there are no foreign objects obstructing the safe closing of the garage door.
©2022 The NEED Project Your Future In Wind Energy Student Guide www.NEED.org 17
Wiring diagrams are not drawn to scale, and their layout may or may not resemble the layout of the construction drawings. They show in detail how each of the components is to be physically connected and how the circuits and other components are to be Ladderarranged.logic drawings show the different components of the system and how they are connected (terminated) to each other.
A programmable logic controller (PLC) is a computer system built to withstand higher temperatures and environmental conditions that is used to control industrial processes. PLCs analyze operating conditions and inputs and control outputs accordingly.
systems rely on three types of drawings: Blueprints or construction drawings, scaled diagrams showing the exact placement (location) of everything in the system and the building in which it sits; Wiring diagrams, showing how components are connected together by terminations and terminal point with terminal numbers; and
One way PLCs are used in the wind energy industry is to protect wind turbines from storm damage. If wind speeds are too high, the turbine will rotate too fast and will burn from friction within the nacelle. When the wind around large-scale wind turbine blades exceeds sixty miles per hour, the turbine will engage the electronic braking system to stop the turbine blades from rotating. It will then change the blade pitch to reduce the surface area affected by the wind, reducing the force on the massive blades in high winds to protect them from damage. No one has to be present at the wind turbine site to measure the wind speed and make the decision to engage the braking system; the PLC does this automatically.
An Open and Shut Case Let’s examine another system with which you may be familiar, an automatic garage door opener. These are units designed to receive a signal from a push-button activator on the wall inside the garage or on a remote transmitter from inside the car, and consequently open or close the door. When an automatic garage door opener is installed, there are several features set that allow the unit to operate correctly.
The entire garage door opening system has several controls. First, the opener operates within the limits that were set at installation. Second, it only operates when the button on the transmitter or wall switch is pressed. Third, it only closes the door if it is safe to do so. If any of these operating conditions is not correct, the opener will not open or close the door.
PROGRAMMABLE LOGIC CONTROLLERS (PLCS)
Ladder logic diagrams, showing the sequence of operation and devices in the process of the control system.
Where the Wind Blows
Wind Turbine Assembly and Placement
18 ©2022 The NEED Project Your Future In Wind Energy Student Guide www.NEED.org
The process of choosing a location to build a wind farm, known as siting, requires consideration of many factors. As with any human endeavor, there are trade-offs, which means that compromises are necessary. With any common resource, we seek to find compromises that are the “highest and best use” of our resources.
Image source: NREL
To make a wind turbine installation practical, wind speeds must be sufficient to produce enough electricity to pay for the cost of the turbine and its maintenance. Energy produced from wind is directly proportional to the cube of the wind speed. As a result, increased wind speeds of only a few miles per hour can produce a significantly larger amount of electricity. Wind speeds are much greater offshore than onshore or in coastal areas, where population density and energy demands are greater. In the U.S., wind speeds off the Pacific Coast are stronger than the Atlantic Coast or the Gulf of Mexico, however Atlantic Coast wind speeds are consistent enough to provide plenty of reliable wind energy. As a rule, wind speed increases with height and over open areas with no windbreaks. The site for a wind farm must have strong, Wind Resource Map
In the world of real estate, appraisers use four criteria to determine the highest and best use of an area: legal permissibility, physical possibility, financial feasibility, and maximum productivity. When it comes to siting a wind farm, whether onshore or offshore, the questions related to highest and best use can be very complicated. Wind speed is of course the primary consideration for choosing a site; without enough wind to generate a significant amount of electricity, the entire operation is pointless. However, there are other, quite important, factors to consider when choosing the best location for a utility-scale wind installation.
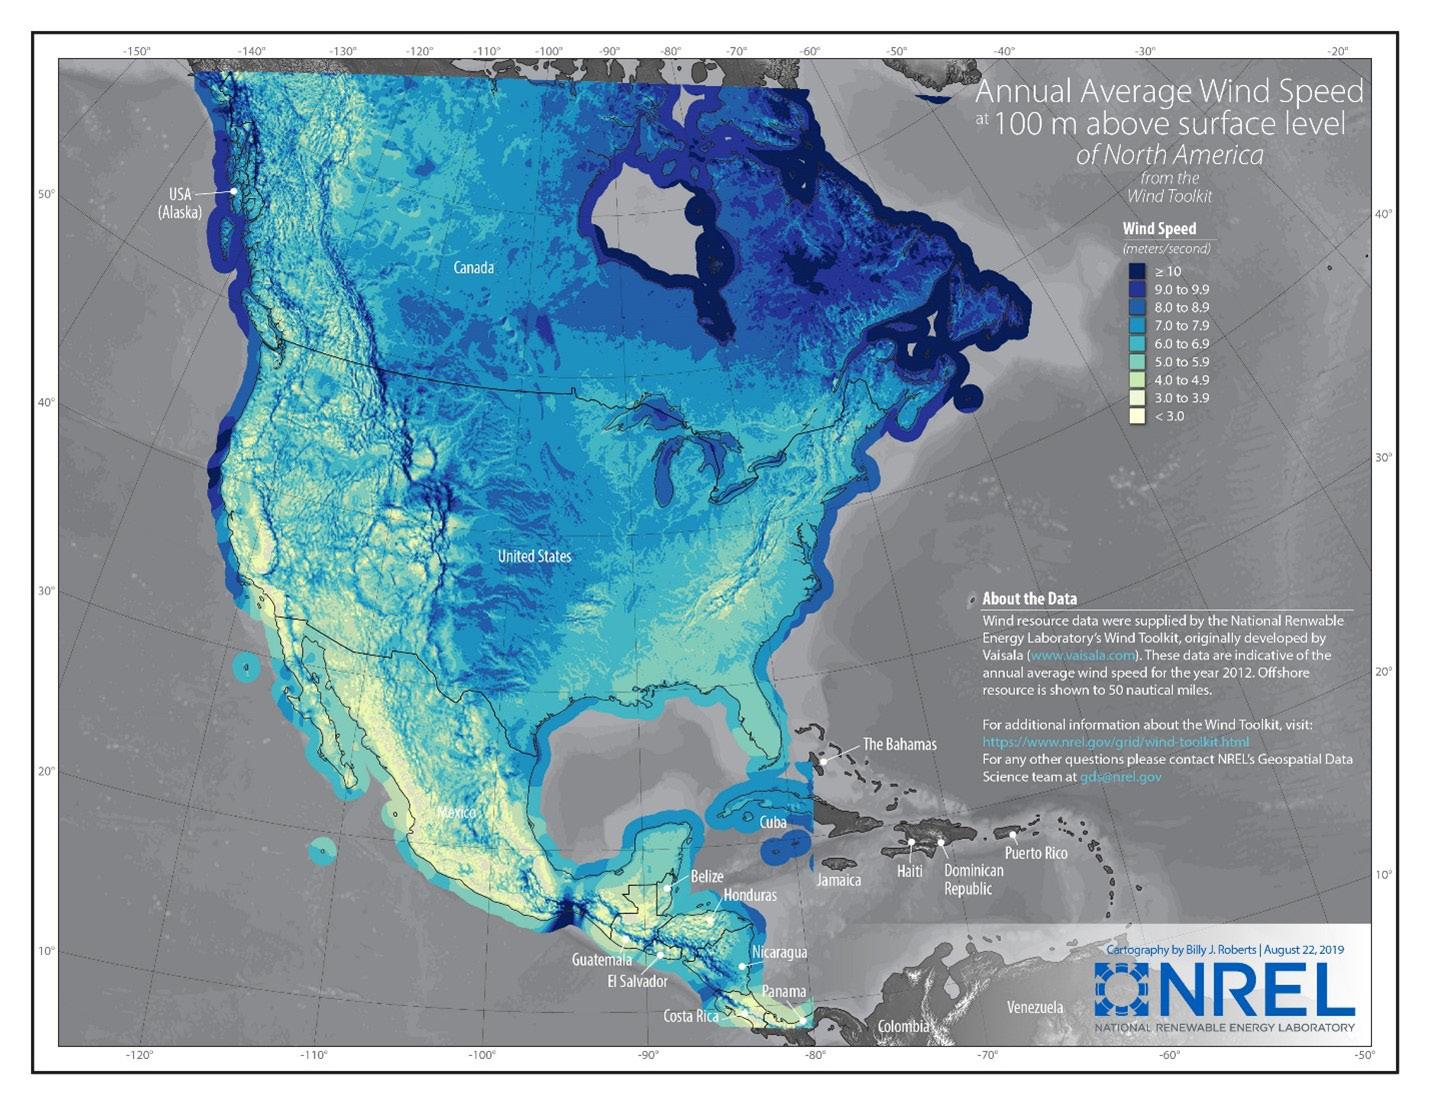
steady winds. Scientists measure the wind in an area for one to three years before choosing a site. Measuring the wind and obtaining construction permits requires the most time when building a wind farm. The best sites for wind farms are on hilltops, the open plains, through mountain passes, and near the coasts of oceans or large lakes. Turbines are usually built in rows facing into the prevailing wind. Placing turbines too far apart wastes space. If turbines are too close together, they block each other’s wind. The wind resource map, produced by the National Renewable Energy Laboratory, shows wind speeds 100 meters above the surface both on land and offshore in North America. Wind farms are located across the country. Most utility-scale wind farms are being installed in the Great Plains and Midwest, but other areas such as on mountain ridges in Hawaii are also being targeted for wind energy development. The top 5 states for wind energy generation in 2020 were Texas, Iowa, Oklahoma, Kansas, and Illinois.
Project Approval As with any other man-made structures, placing wind turbines in areas where nothing has been built before is going to change the way that land or offshore area is used. Even if a wind farm is located
©2022 The NEED Project Your Future In Wind Energy Student Guide www.NEED.org 19
A quick glance at the Wind Resource Map shows that areas onshore where winds are strongest are not where most people live, and this has been one of the greatest challenges to widespread wind energy use. The greater the distance from the site of generation to the site of electricity use, the more energy is lost to friction within the transmission lines themselves.
Proper Positioning and Placement
The layout of a wind farm is an important consideration because of how air flows past a turbine. When an air mass collides with a wind turbine, some of the energy it carries is transferred to the turbine to make the blades spin. The removal of that energy from the air mass results in reduced speeds of some groups of air molecules. This changes the smoothness of the wind moving away from the turbine. This disturbance is called a wake. As the air moves further away it begins to mix and smooth out again. When designing a wind farm, the turbines need to be spaced such that the air has a chance to smooth out again before it encounters another turbine. To avoid a wake effect between the turbines, engineers must consider the prevailing wind direction and the distance required on average for the air to become smooth again, given the average wind conditions at the site. Engineers create and test models to help make decisions about wind farm layout, and space the turbines in patterns to avoid this affect. In some cases, wind farms will require nearly a mile between each turbine, given the conditions.
Wind ows in at high energy speeds Distance Away Turbine Rotates Tail areas of turbulence where wind is slower, less smooth as it exits turbine.
Because most U.S. population centers are found on the Atlantic or Pacific coasts, building wind farms offshore where wind speeds are high makes a lot of sense. The East Coast, from the Outer Banks of North Carolina north through to the Maritime Provinces in Canada, has sustained winds favorable for wind energy. This is where fixedbottom, offshore wind farms are being developed or proposed. The first U.S. offshore wind farm was installed at Block Island, Rhode Island, in 2016 and another is being developed off the Virginia coast. Even stronger winds exist off the Central Coast region of California, but the water there is too deep to accommodate fixedbottom offshore wind turbines. The solution in these waters is to install floating wind turbines that are moored to the sea floor and attached to a floating foundation.
on land that has been farm land for a long time, and will continue to be farm land, the installation of dozens of wind turbines could disrupt and possibly change how that land is used.
However, there is no “ownership” of offshore areas where wind turbines might be installed. The first three nautical miles out from the coastline are governed by the state. The next 200 nautical miles are governed by the Federal government. Because most offshore wind installations are more than three nautical miles out, the Bureau of Ocean Energy Management (BOEM) is in charge of leases to companies wishing to develop in these waters. As BOEM identifies and opens areas for leasing, companies submit bids for leasing the rights to develop wind energy installations there.
When wind energy installations are proceeding on land, the people who own the land and govern its use must give permission and enter into an ownership or leasing agreement with the company installing the turbines. This is usually done through public hearings where people are able to express their positions and points-of-view about the proposed land use change, and governing bodies decide whether to allow the project to proceed.
Wake Effect Behind a Turbine
smoothsWindout Modern Wind Turbines StatueLibertyof 305 ft EmpireBuildingState 1,454 ft Ei Towerel 1,063 ft USOnshoreAverageturbine 466 ft FixedOModernshoreturbine 853 ft OFloatingshoreturbine 853 ftBlock Island O shoreProjectWind 590 ft ONSHORE OFFSHORE
Subsidence
Soils Building a heavy structure such as a wind turbine requires knowledge of the soil on which it will be built. Soil is the uppermost layer of the Earth’s crust that is typically crumbly and relatively easy to move around. Soil types and composition vary from place to place across the country, but all soils have some common characteristics. Soil is made of minerals, such as clay, silt, gravel, and stone; water; air; and organic matter. While soil is often thought of as organic, it is mostly inorganic material, with only about five percent of it being organic. This includes decaying matter, and any living organisms such as fungi, bacteria, and subterranean invertebrates.
South Karst Landscape Water-soluble
SOILHAZARDHAZARDSTYPE HAZARD DESCRIPTION AND IMPACT U.S. LOCATIONS PRONE TO THESE HAZARDS Acid-sulfate Sulfides in the soil react with water, forming sulfuric acid Corrosive to metals and concrete Toxic for plants and animals Coastal areas Dredging in San Francisco Bay and Baltimore Harbor Compaction Beneficial for construction Degradative for any other applications Reduces pore space Restricts water infiltration Restricts roots and inhibits plant growth Anywhere construction occurs Usually limited to top 24 inches Erosion Water and wind wear rock down and carry soil away Sediment from construction clogs stormwater drains Anywhere plant roots are not able to hold soil in place Expanding Soils –potentialshrink-swell Clay soils that absorb water and expand, or shrink when dry Expansion and contraction can damage structures and foundations Great Plains,
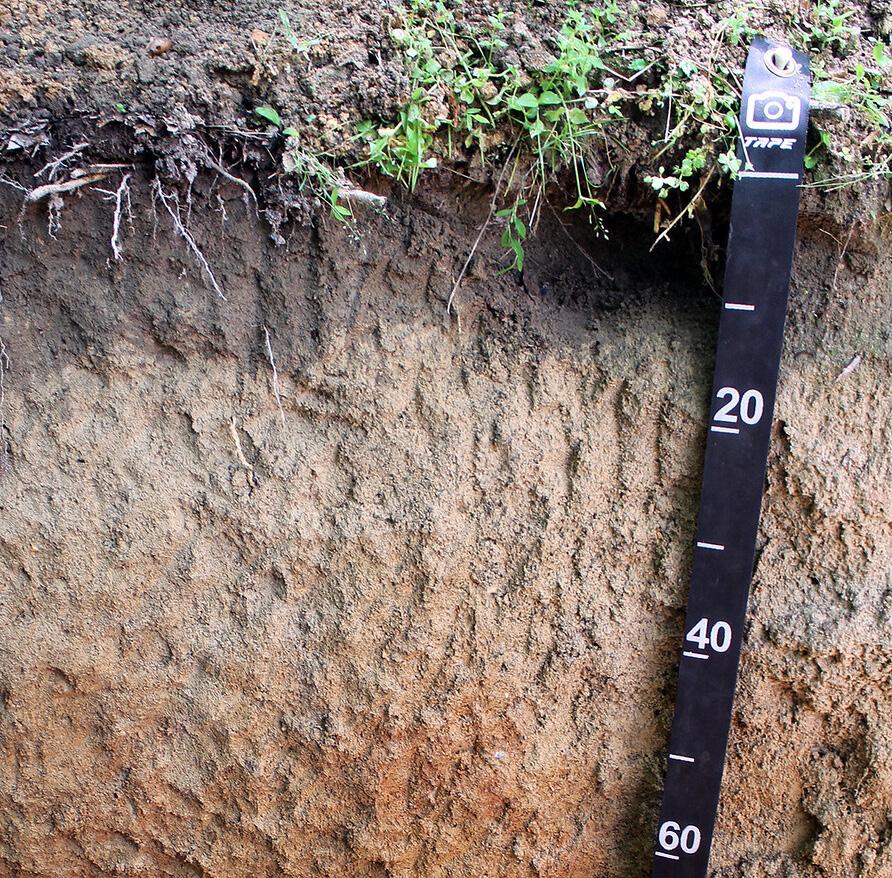
Soil Recipe Leave an empty piece of rock exposed for any length of time and soil will form. Soil formation relies on the parent material, climate, topography, and the living organisms present. Parent material describes the organic matter in the soil as well as the minerals. Wind and water can erode rocks into tiny pieces or deposit sand or silt; these constitute the minerals from which soil will form. Volcanic ash can be a parent material, too. Soil is characterized by slicing through the layers and photographing them. A measuring tape is included for reference. Texas, Deep salts in bedrock are carried away and sink holes form Midwest and South of Organic Soils soils occur in bogs and moors, and are often called peat or muck wet areas for construction can cause them to sink Bogs or fens in northern latitudes Flat deltas such as lower Mississippi River Coastal plains adjacent to oceans
Small ferns grow in a crevice in a lava field in Hawaii Volcanoes National Park. Over time, wind and rain have broken some of the rock into fine particles, and wind has deposited dust and organic matter, forming a thin layer of soil for the plants.
20 ©2022 The NEED Project Your Future In Wind Energy Student Guide www.NEED.org
Organic
Draining
Lay It On Thick Whether several meters or only a few centimeters thick, soil has specific layers, or horizons, that all have similar properties. The topmost layer is the organic, or O, layer. This darkest layer is where the freshly decaying material is found. Beneath the O layer is the A layer. Lighter in color, the A layer is mostly minerals and is where the roots of plants are found. Next is the E layer, which is where leached mineral salts are found. The E layer is often very bleached or whitish in color. The B layer, or subsoil, is light in color and denser than the O or A layers. Leached minerals accumulate in the B layer. Beneath the B layer is the substratum, called the C layer, followed by bedrock which is designated the R layer.

Subsoiling involves using deep ploughs that do not overturn the soil. Instead, the device slices through the soil like large knives slicing through a lasagna. The layers are not disturbed, but air and water can infiltrate down into the soil. Proper subsoiling is confirmed by measurements to determine the soil strength. The entire process is time-consuming and energy-intensive, and therefore expensive.
Most topographical or political maps of the world depict the oceans as large, featureless blue spaces. Some show major features like the Mid-Atlantic Ridge or Marianas Trench, but the rest of the ocean is depicted as a flat, uninteresting plain. Nothing could be further from the truth. The ocean floor is a dynamic, interesting place with peaks, valleys, slopes, canyons, and all the other physical features we see on land. The only difference is one is covered with salt water. The ocean floor has many of the same hazards as we experience on land. Landslides, volcanic activity, and earthquakes all affect the inhabitants and features of the ocean. Tsunamis can dramatically alter the ocean floor, and some soils at the bottom of the ocean are prone to liquefaction, where the soil and water mix creating an unstable fluid. Because the Pacific coast is more vulnerable to volcanic activity, earthquakes, and tsunamis, liquefaction is also a greater risk than experienced on the Atlantic side of the U.S. These factors contribute to floating turbine technology being necessary to take advantage of the wind speeds offshore in this location, and must be considered when placing and anchoring floating wind turbines.
By now you should have the understanding that building a wind turbine is not a simple feat. There are months, even years, of planning and preparation that go into constructing a wind farm before the foundations are poured and the parts arrive on site. The components are enormous and heavy, and require special transportation vehicles and techniques to avoid damaging them and other structures along the way.
©2022 The NEED Project Your Future In Wind Energy Student Guide www.NEED.org 21
Survey Says Before a location can be considered for any kind of human use, a soil survey is needed. A soil survey describes the topography and soil while identifying any limitations on the use of the land. Soil surveys include the county’s geography, a soil map, aerial photos, and photographs of the soil. Information about the area, crop production and land use planning are included in the report, and the soil itself is described in terms of its soil depth, texture, particle size, permeability, water capacity, and other important physical properties.
When soil is characterized, it is “sliced” open to expose the layers for measurement and analysis. Each of the layers of the soil is described in terms of its physical properties as well as its chemical composition, and an approximate depth is provided along with color photographs of the soil.
Soil Compaction
Transportation and Construction of Turbines
Soil Hazards
The purpose of a soil survey is to identify any qualities within the soil that will impose limitations. For example, soils that are very wet only a couple feet below the surface are not a good place to build a home with a basement. Soils that will not hold together and are prone to dust or erosion may not be the best place for growing crops. Soils that cannot be compacted are not good places to build heavy structures like wind turbines.
As stated earlier, soil compaction can be a good thing or a bad thing, depending on your perspective. When constructing a wind turbine, a solid foundation is necessary to properly support the turbine. If the foundation shifts, sinks, or splits, the wind turbine could collapse. To avoid catastrophic failure of the foundation of any construction project, contractors use equipment to compact the soil beneath it. This pushes the soil particles closer together and reduces the amount of air in the soil, making it more dense. The purpose of soil compaction for construction is to reduce or eliminate the amount of settling or shifting of a foundation over time after the structure is complete.
The Ocean Floor
What happens, though, when the wind turbine has reached the end of its life and will be removed? With proper maintenance, wind turbines on land will last 25-30 years. After this point, they can be upgraded with new technology, or decommissioned Decommissioning means everything involved with a wind turbine, including the foundation and any substations, must be removed. When a wind turbine is decommissioned, the soil that was beneath the foundation remains compacted. Mitigating steps are necessary so the land can be arable, or able to grow crops. While some may try additives such as chemicals or sand to lighten the soil, the best way to reduce compaction is by a technique called subsoiling A truck transports a wind turbine blade to Muirhall Wind Farm in central Scotland.
Before people can use an area for a specific use, the soil hazards must be identified. Some soil hazards are human health risks while others will cause damage or destruction to structures built on them. Some hazards are related to specific weather or climate conditions while others are independent of what is happening above the soil’s surface. Some of the most common soil hazards are summarized in the Sometable.soil hazards pose health risks. Falling rocks, floods, dust, and radon gas are all hazardous to human and animal health and occur nearly nation-wide when conditions are right.
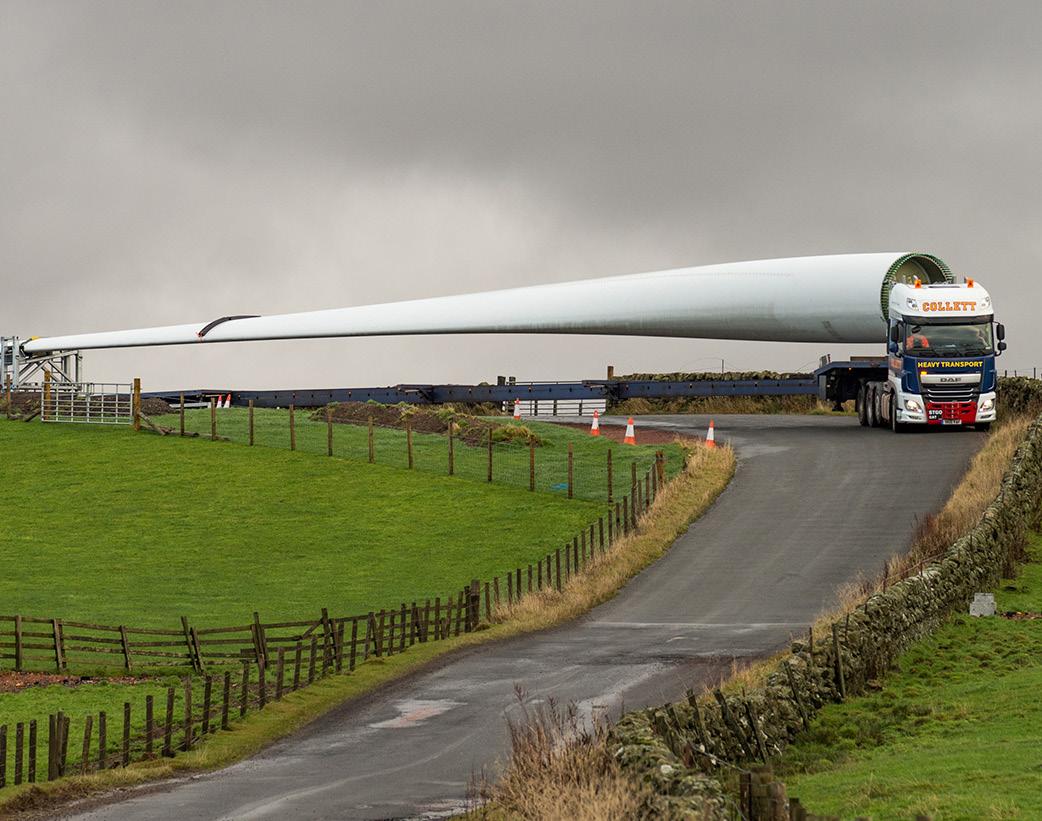
Transporting turbine tower pieces and blades on land is a complicated, well-orchestrated process involving trains, trucks, law enforcement, and the cooperation and patience of people who live in the communities along the way. When turbine blades are being transported, roads are often closed or restricted to allow the truck enough room to maneuver safely. Once on site, workers use cranes to lift the pieces into place and get everything assembled properly.
Images provided by Dominion Energy
The monopile is buried 100 feet (30 meters) into the seabed to provide a stable foundation. A transitional piece is placed on top to make the base for the remaining components. The ship will install an 800 foot tower, nacelle, and blades onto each base. These vessels can often load several complete turbines on board in less than 24 hours, and installation of a complete turbine can take less than a day!
Wind turbines for the Coastal Virginia Offshore Wind project will be installed by a new vessel called the Charybdis. This installation vessel is being built in Brownsville, Texas as part of a Dominion Energy consortium. The ship is estimated to cost $500 million, however, it will be very important to developing offshore wind in the U.S., as the U.S. Merchant Marine Act (Jones Act) of 1920 requires that all goods shipped between U.S. ports are transported by U.S. ships and mariners. For wind turbines to be constructed, transported, and installed in U.S. waters, a U.S. Jones Act-compliant ship will be necessary.
Installing fixed-bottom wind turbines offshore uses a special installation ship to transport the foundation pieces and out to sea. This vessel is equipped with large cranes and legs. The legs are lowered into the ocean until they can stand stably on the sea floor. The ship will then use the crane and drive the monopile deep into the seabed. Each monopile is made of steel and has a diameter of roughly 30 feet (9 meters) – large enough to drive a car through!
Wind turbine blades wind their way by train through Denver. (Department of Energy photo by Dennis Schroeder / NREL)
Installing turbines on land is complicated enough, but installing them offshore is quite a supply chain feat! First the turbine parts must be built and shipped to a location near to where they will be installed. Turbine blades, towers, nacelles (and the parts within the nacelle) may be constructed in various locations, and each is shipped by boat, train, or truck to a staging area. This staging area is set up in a port that has ample space to store the large components and enable the ships to bring the parts in and out.
22 ©2022 The NEED Project Your Future In Wind Energy Student Guide www.NEED.org
As floating offshore wind developments move into the construction phase within the next few years, a similar process will be employed to transport the pieces to the appropriate site, anchor them to the sea floor, and connect them to the grid.
TURBINE INSTALLATION VESSEL
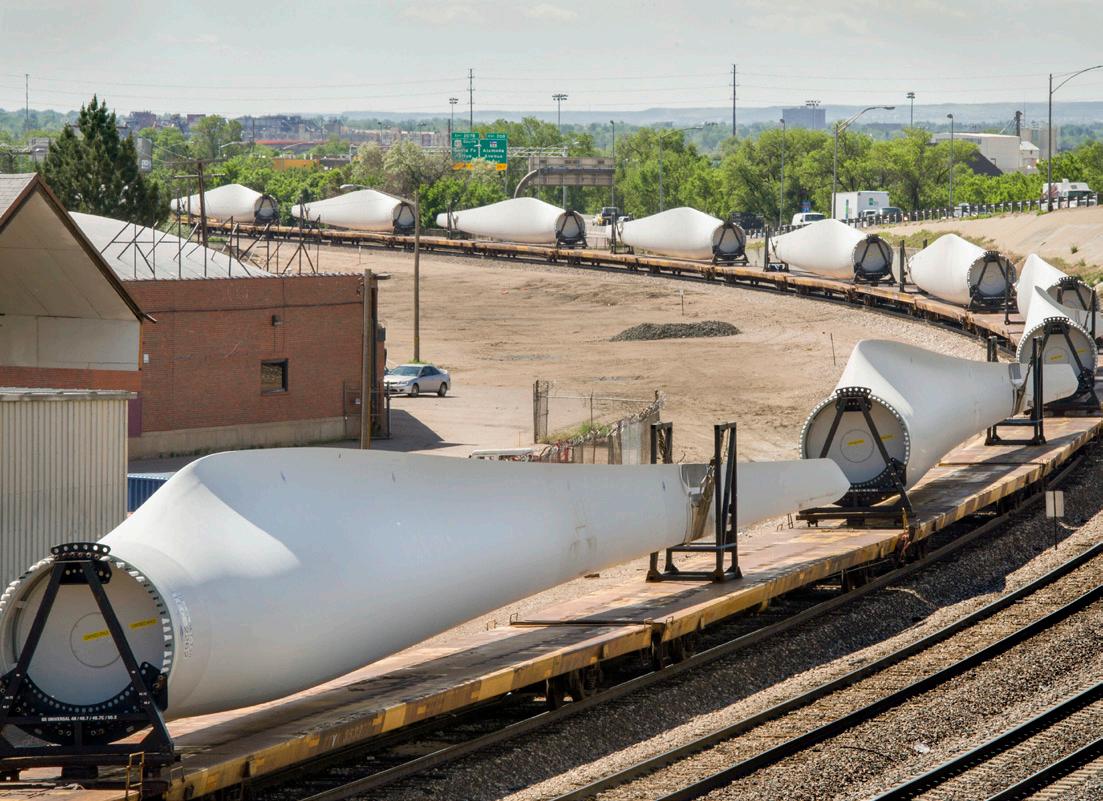
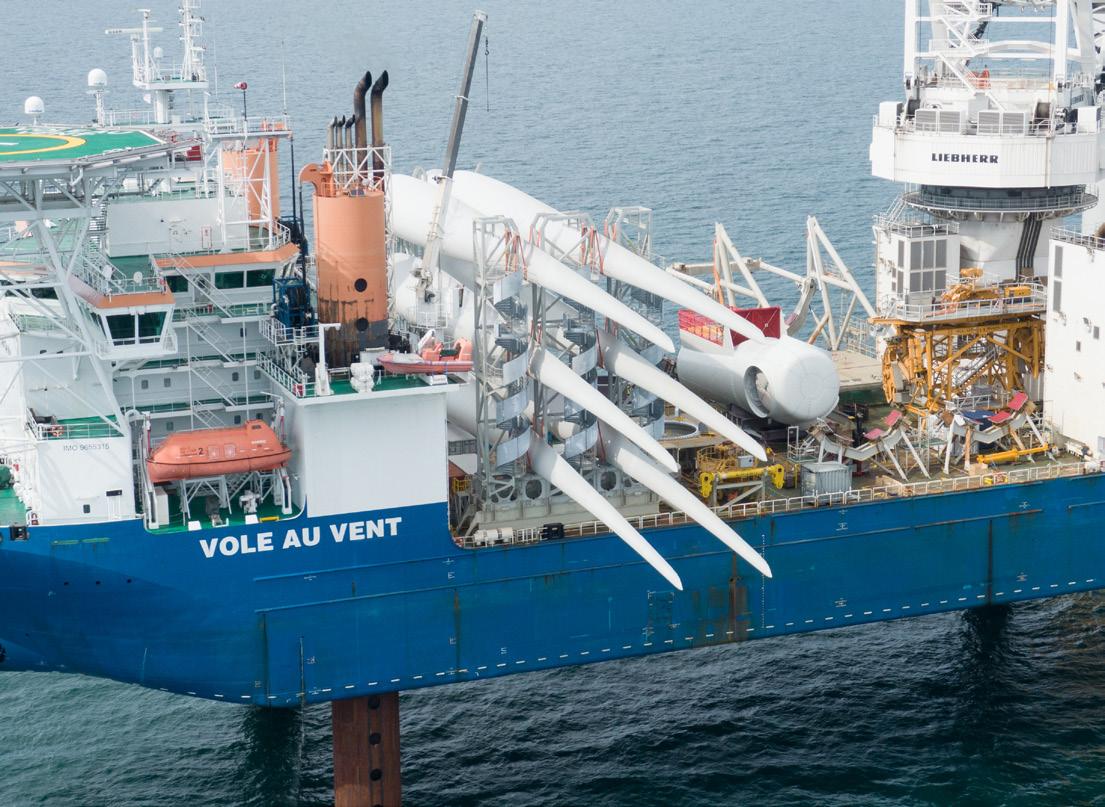
Fiberglass Evaluating the greenhouse gas emissions of fiberglass is not nearly as straight-forward as it is for steel. One way to look at its impact is to conduct a life-cycle analysis of the manufacturing of the E-glass in fiberglass. According to Argonne National Laboratory, E-glass fiber production results in about 160 kg of greenhouse gases emitted per ton of glass fiber produced. This is about 12 times less than steel, but not insignificant. Because each of the resins used to make the nacelle housing and blades is slightly different from one manufacturer to another, we can really only evaluate the energy consumed to make the resin-glass fiber composite and infer from there. The molding process used to make wind turbine parts uses about 11 million Btu per ton of material produced. For comparison, steel uses about 2.6 million Btu per ton produced, but steel is about 1,000 times more dense than the fiberglass-resin composite used to make turbine blades.
Everything humans do will have some kind of impact on the natural environment around us. The key is to minimize the negative impacts we have on other species. Because using wind energy to generate electricity has no carbon emissions for generation, many people believe that wind energy has no negative environmental effects and that just is not the case. The process of manufacturing and transporting turbines, placing them, and decommissioning them after they are no longer functional can adversely influence the natural world.
Semi-tractor 6.5 miles per gallon
Diesel locomotive 1.5 gallons per mile w/ 5 cars
Operational Impacts
©2022 The NEED Project Your Future In Wind Energy Student Guide www.NEED.org 23
Transportation As discussed earlier, transporting wind turbine components to their site of installation requires many different modes of transportation. Each step along the way requires heavy machinery that burns a lot of fuel, most of that being diesel fuel. Diesel fuel is a petroleum product consisting of hydrocarbon compounds between 12 and 20 carbons in size. A hydrocarbon is a compound made of just hydrogen and carbon atoms, and the carbons in these molecules form long chains or branched chain networks, with hydrogens bonded all around the outside. When hydrocarbons burn, they combine with oxygen and produce thermal energy, carbon dioxide, and water vapor. Carbon dioxide is a greenhouse gas and is increasing in atmospheric composition as we continue to burn more fossil fuels like diesel fuel. The buildup of greenhouse gases is responsible for the effects of climate change that we are experiencing today.
Ships have engines that run on a special blend of hydrocarbons called marine diesel oil, similar but not the same in composition as diesel fuel used in trucks and locomotive engines. One gallon of diesel fuel produces about 22 pounds of carbon dioxide.
Cargo ship 65,000 gallons per day @ 20-25 knots
Noise Wind turbines are machines, and like any other machine they make some noise. As the turbine blades are pushed by the wind, the gears inside the gear box and the generator transform a bit of that motion energy into sound energy which can be heard at ground level beneath the wind turbine. Like any sound, the intensity of it diminishes significantly as the distance from its source increases. Known as the inverse square law, the intensity of the sound follows the formula: I = P 4πr 2 where I is the intensity of the sound, P is the power of the source of the sound, and r is the radius out from the sound (distance from it).
The large trucks, trains, and ships that carry wind turbine parts use diesel fuel as their energy source. Semi-tractors use large diesel combustion engines that capitalize on the flash point of the fuel to power the engine. Train locomotives have diesel-powered generators that run the engines that pull the trains with the parts.
A properly sited wind turbine is far enough away from homes to not case noise pollution. The sounds generated inside the house as well as typical exterior sounds like roads, wind, and other rural noises will drown out any noise made by the wind turbine. That’s not to say the turbine will never be heard indoors on a very still, quiet day with the windows open. However, under normal living and operating conditions the turbine should not be heard from inside the home.
VEHICLE TYPE FUEL EFFICIENCY
Steel If the steel-making industry were its own country, it would rank third in the world for greenhouse gas emissions, accounting for 7-9 percent of all man-made greenhouse gas emissions. If that seems high to you, you’re right, it is high. For every ton of steel produced, 1.85 tons of greenhouse gases are emitted. This is partly due to the blast furnaces used to make steel and the way they are fueled, and partly due to the chemical reactions involved in combining iron with carbon to make steel. If the steel-making industry is to do its part to keep global climate change below a temperature increase of 2° Celsius, the amount of greenhouse gases emitted must drop to 0.2 tons per ton of steel produced. One proposed solution is to use a process called Hydrogen Breakthrough Ironmaking Technology, or HYBRIT. This method uses non-carbon-based fuels like hydrogen produced with renewable electricity to supply the high temperatures needed to produce steel from iron ore. European manufacturers of steel are leading the research into producing steel with less carbon emissions.
Manufacturing Impacts
Environmental Impacts of Wind Energy
Common benthic organisms that live at the depths where both floating and stationary offshore wind farms may be built include corals, sponges, echinoderms, mollusks, cephalopods, and crustaceans. While the initial construction phase will disrupt some benthic organisms, the structures used for anchoring floating turbines will provide additional surface area that these organisms will colonize, thus creating an artificial reef structure. Artificial reefs have been used in other parts of the globe to enhance marine Organismsecosystems.thatlive in the water column and can move around are referred to as pelagic organisms. Some, like most phytoplankton, are free floating, and many are active swimmers including, zooplankton, fish, marine mammals such as whales, and turtles.
The best areas for wind energy development are also some of the most beautiful, natural areas on our planet. Wide open plains, hill or mountain tops, waters immediately offshore are all places of natural beauty that people enjoy. People who enjoy these places often do not want to see wind turbines interrupting the viewshed, or what is visible in a specific location. In some places, property owners are concerned the value of their property will decrease if wind turbines are visible. It is important that the concerns of the people living near any wind farm be taken into consideration and the people living there feel they have been heard.
Bats are also a concern with onshore wind turbines. Every year in late summer and early autumn, which is when bats breed, bats are found dead underneath wind turbines all around the world. Most of these deceased bats are tree species, which roost in trees and migrate long distances. Nobody really understands why this happens. It could be that bats confuse the wind turbines for trees, or some other reason. To meet this concern, turbines are now designed to operate at higher start-up speeds than before, and ultrasonic deterrents are being evaluated for their effectiveness at keeping bats away from wind turbines where they can be hurt.
Changing the design of the tower eliminated these perching points, and combined with wider spacing between turbines greatly reduced the number of birds colliding with turbine blades.
24 ©2022 The NEED Project Your Future In Wind Energy Student Guide www.NEED.org
When wind turbines were first built, the design of the towers with their crisscrossing support structures provided lots of places for birds to perch and nest. As a result, many birds were being injured or killed by wind turbines as the birds would fly in to roost.
Viewshed
Onshore siting studies today focus specifically on any avian species native to the area and migrating through the area, and the impacts a wind farm installation can have on them. The Audubon Society, an organization dedicated to preservation and protection of birds worldwide, sees climate change as the biggest threat to avian species and has supported wind energy as a good way to provide electricity while minimizing adverse effects on birds.
BUBBLEWHALESCURTAIN Images: Wikimedia Commons
The greatest concerns related to offshore development is around potential impacts on marine mammals, specifically whales and other species.
Offshore wind turbines have similar concerns with regard to migration patterns and marine life. As with any big project, developers and regulators must assess the potential impacts on all stakeholders and the environment. Many wind turbines on the Atlantic coast will be installed far enough away from land that bird migration is not of concern. In the case of offshore wind turbines, the stakeholders include the marine organisms that live or migrate through the affected areas. Organisms that live on the seafloor are referred to as benthic organisms. Organisms that live in any environment are determined by a combination of abiotic (nonliving) and biotic (living) factors.
The greatest factors of concern related to marine mammals are sound, entanglement potential, and possible vessel collisions. To assess potential risk, scientists are studying migration and feeding patterns through studies involving direct observation from ships and tagging studies. Communication between whales is studied through analysis of data from hydrophones , underwater microphones, to learn more about the sound frequencies they use and how that overlaps or does not overlap with the sound frequencies generated by the turbines. Construction on offshore wind turbines taking place in known migration routes for whales is prohibited when the whales are in the area. When whales are not observed in the area, construction teams can employ bubble curtains to reduce the transfer of construction sounds under water.
RIGHT
Animals Animals are remarkably adaptive. They will learn new behaviors to survive under new circumstances, and will alter their behavior if given enough time. Even so, everything humans do should be done with the intention of minimizing the impacts on species in those areas, especially if those species are threatened or endangered.
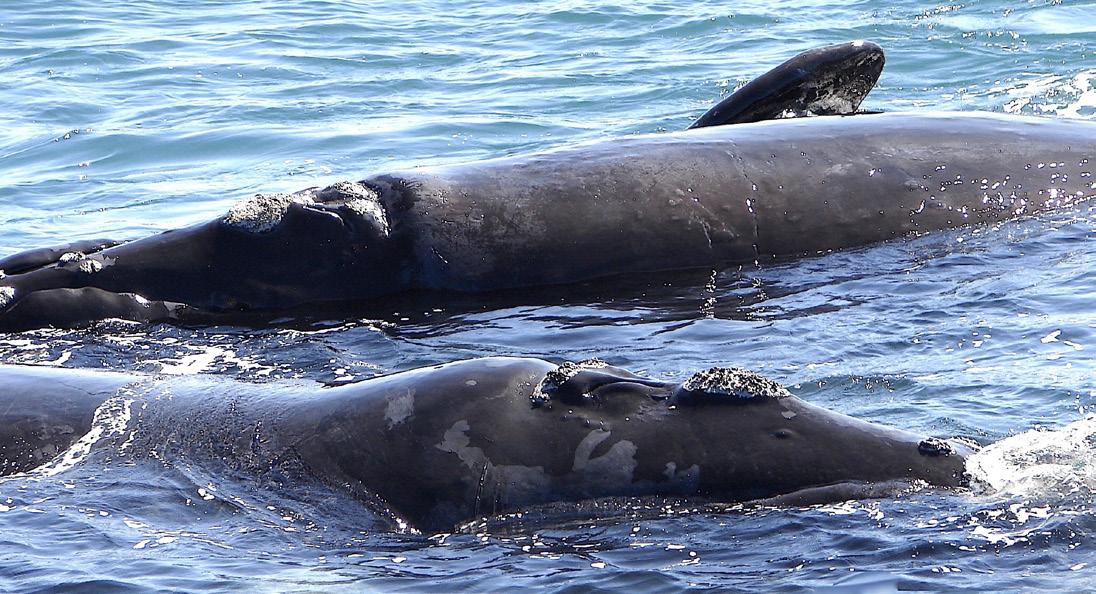
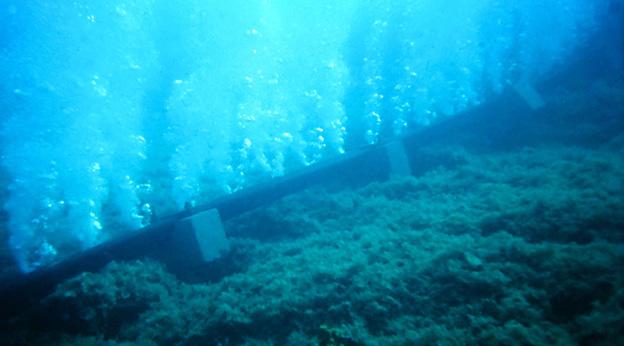
End of Life for Wind Turbines
Onshore Soil Compaction
As discussed previously, soil must be tightly compacted to provide a strong foundation for the extremely heavy equipment in a wind turbine. However, tightly compacted soil is not arable. Agricultural uses of soil rely on water and air being able to permeate through the soil layers, carrying oxygen and nutrients with them. When a wind turbine is decommissioned, mitigating steps are required to allow plants and subsurface organisms to grow. Subsoiling is one example of compaction mitigation.
One company in the Netherlands is using decommissioned wind turbine blades to build playground equipment and benches in public spaces. The playground project is called Wikado Playground and was designed by 2012Architecten, a firm based in Rotterdam, Netherlands.
Offshore Foundation Removal
Artist’sNetherlands.rendering of the Wikado Playground Project, using decommissioned wind turbine blades for climbing, crawling, and general imaginative play in Rotterdam, Netherlands.
Wind turbines have an expected life span of 25-30 years. After that time they can be refurbished with new parts, replaced with updated wind turbines, or disassembled and their foundations dismantled. If the turbines are replaced with new, or if the site is completely decommissioned, disposal of the turbine components is an issue, as well as other impacts.
Decommissioning offshore wind turbines is a relatively new process and is being done primarily in Europe since offshore wind is still in its infancy in the U.S. When an offshore wind turbine is removed from its foundation, it is taken onshore and disassembled there. The foundation is cut off a meter or two below the sea floor, leaving the rest of the steel and concrete in place. The problem with this is that the minerals in the concrete, and iron oxide from the steel, leach into the surrounding water and soil, impacting benthic organisms. Furthermore, the steel that is left in place cannot be recycled. Researchers in Europe are investigating ways to remove more of the foundation to reduce or eliminate this impact.
©2022 The NEED Project Your Future In Wind Energy Student Guide www.NEED.org 25
When something you own is no longer useful, what do you do with it? You probably throw it into the trash can unless it can be recycled. The same happens to wind turbines, but on a much larger scale. The generator and gear box can be disassembled and some of the parts recycled, and the steel in the tower can also be recycled. However, the composite materials in the nacelle and blades cannot be recycled. The resins in these parts are in a class called thermosets , which means they cannot be melted down and reformed into something new. The plastic in water bottles and milk jugs is a thermoplastic , meaning heating the plastic makes it soft and pliable. Heating a thermoset will just degrade, or possibly burn, the resin in turbine blades and nacelle shells. These parts need to be buried in a wind turbine landfill, or repurposed.
People relax on benches made from repurposed wind turbine blades in the
Decommissioning Impacts


26 ©2022 The NEED Project Your Future In Wind Energy Student Guide www.NEED.org
The Occupational Safety and Health Administration (OSHA) requires employees to have a well and safe environment that has limited occupational hazards. Accidents will still happen even with safety measures in place. Each company will have its own specific first-aid requirements, but all have some things in common.
Safety on the Job First Aid and CPR
Electrical Safety
The wind energy industry encompasses many occupations - more than what could be squeezed onto these pages.However, there are some things they all have in common. As you consider how wind energy might fit into your own career goals, think about each of these areas and the specific career profiles featured. Have you been presented with new information that changes your career goals? is there something you had not yet considered? Re-evaluating your goals and even changing your direction in life is not a bad thing. As you are presented with new information something new might pique your interest and set you on the path to finding your occupational passion.
In general, only qualified, licensed electricians should be working with any electrical wiring in a building or on a piece of machinery. They are trained to know how to work around energized wires, how to disconnect power, and how to safely move around high voltage equipment. It is always a good idea for all employees to know how to disconnect power for the building or room where they are working. In the event of an emergency, and when instructed to do so by emergency dispatchers, disconnect the power by moving the main breaker switch to the “off” position and wait for further instructions.
First aid training is available through many organizations across the country, but the most well-known is Red Cross First Aid training. Usually one full day in length, the training covers how to administer first aid to people with cuts, fractures, falls, and loss of CPRconsciousness.standsfor
If you are working near high-voltage equipment, you will probably be required to wear specific personal protection equipment (PPE) for high-voltage situations. A hard hat, safety glasses, high-visibility vest, work boots, and clothing made from non-conductive fibers are minimal requirements in a high voltage environment.
On The Job in Wind Energy
NAVFAC Pacific Public Works (PW) Utilities and Energy Management Supervisory Electrical Engineer Alan Oshiro captures infrared thermography to determine if any hot spots exists on High Voltage (HV) equipment. Oshiro is protected by wearing Category 4 personal protective equipment during his assessment at NAVFAC Marianas Harmon HV Substation.
Cardiopulmonary Resuscitation and is the technique used when a person’s heart has stopped beating. CPR involves applying pressure to the chest to artificially contract the heart and circulate blood until trained medical help arrives. The Red Cross and most hospitals offer CPR training and certification. Most job sites and commercial buildings have at least one AED, or automated external defibrillator, available. This device is used to shock the heart out of an irregular rhythm or to get it started beating after having stopped. AED training helps you understand when and how an AED should be used. Most AEDs also have printed and audible instructions explaining how the device should be Regardlessused. of your future career, first aid, CPR, and AED training can prove beneficial and might even help you save someone’s life.
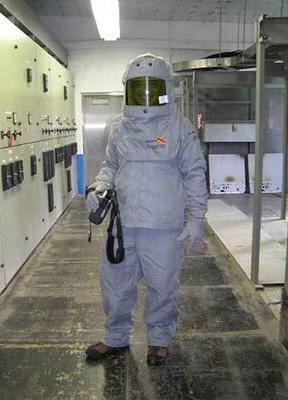
Image source: Unsplash Image source: Unsplash Image source: Unsplash
Climbing and Heights Safety
Job training at the college or university level ranges from certificate programs all the way through graduate and professional degrees. Many careers in the wind industry require Associate’s or Bachelor’s degrees, but some only require college level certificates which take less time than a full degree program to complete. Many college programs provide credit for work experience for the nontraditional, older student.
Professional organizations frequently offer certification training programs. These are usually short-term, intensive training programs designed to provide specific skills or knowledge quickly and efficiently. The GWO training mentioned above is one such certification. Certifications are often add-ons to job training programs, and many allow the employee to use specific letters after his or her name, indicating the certification.
Marine Safety
College Programs
Wind turbines are very tall structures. Working this far off the ground or ocean surface can be deadly if proper safety techniques are not followed. In general, anyone working that far off the ground should be wearing a safety harness and tied off to at least two different lines short enough to prevent a fall should the worker lose balance. Training in proper fitting and securing of a harness as well as tying knots in lines is essential to turbine workers’ safety.
Qualifications and Training Apprenticeships
Certifications
Anyone working on an offshore wind turbine in any way must attend Global Wind Organisation (GWO) safety training. Consisting of five areas, this training provides methods and procedures to prevent emergencies from happening, and in the case of an accident how to respond appropriately. The five areas are first aid with AED training, fire awareness, working at heights, manual handling, and sea survival. While the first four areas are common to all locations of wind turbine installations, sea survival is specific to offshore sites.
©2022 The NEED Project Your Future In Wind Energy Student Guide www.NEED.org 27
Many professions commonly referred to as trades, such as electrician, welding, and plumbing, are often trained through apprenticeship programs. An apprenticeship is usually a paid position where the apprentice is working alongside skilled workers, learning on-the-job. Some apprenticeship programs are operated through labor unions and combine classroom work with field training, while others are less formal. Most apprenticeship programs are available to anyone with a high school diploma who can pass simple employment requirements like residency status and drug screening. However, the application process for most apprenticeships is a competitive process, meaning previous work experience, training, and knowledge can factor into being accepted or waitlisted.
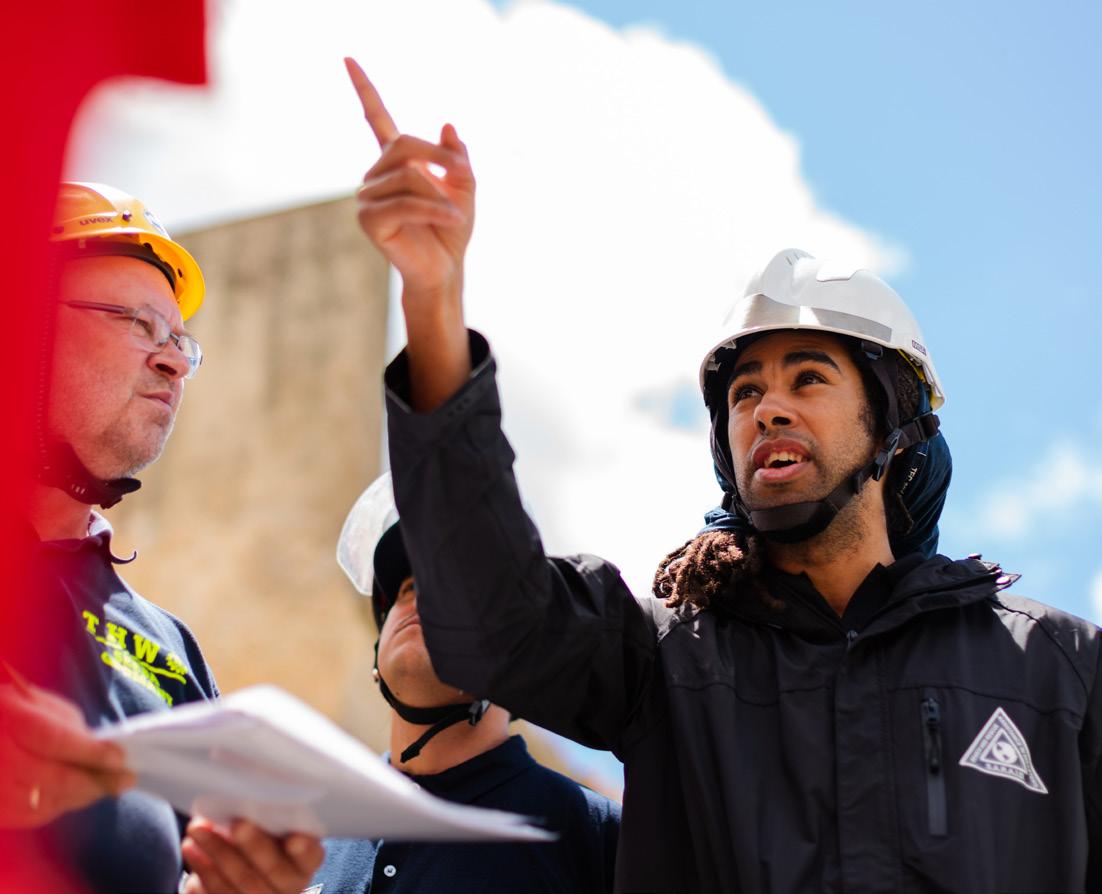

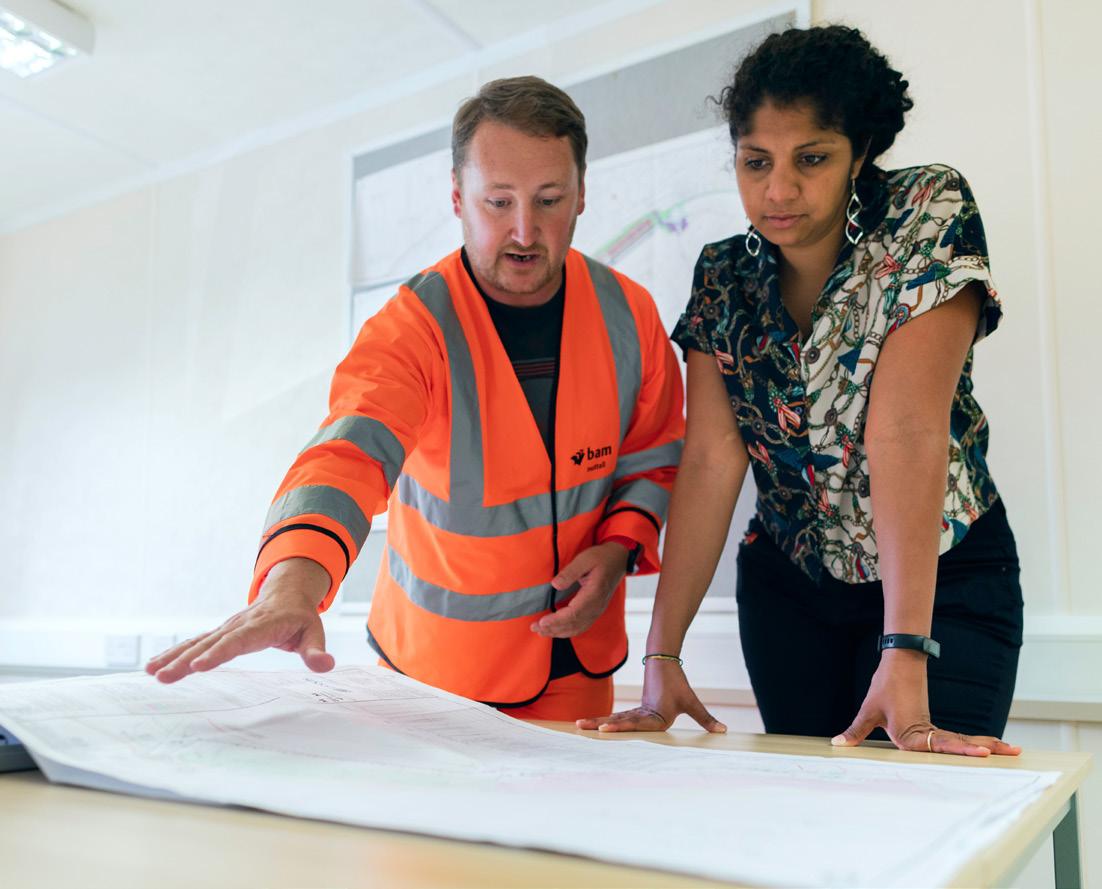
Industrial engineer – designs and tests industrial processes like manufacturing lines or molding systems
Welder – uses high heat techniques to fuse metals together
Machinist – makes and repairs custom parts for machinery
Materials engineer – studies uses for new materials and designs processes around them
Train engineer – operates a locomotive and oversees the cars it pulls
28 ©2022 The NEED Project Your Future In Wind Energy Student Guide www.NEED.org
electric, electronic, mechanical, and pneumatic instruments and systems
Concrete worker – sets forms and constructs structures from concrete
Line worker – installs, maintains, and repairs electrical transmission lines
Meteorologist – studies weather patterns and atmospheric conditions to forecast weather
Non-destructive Testing (NDT) Technician – inspects products and materials for flaws
Climatologist – studies global climates, looking for indicators of change Composite manufacturer – manufactures parts from composite materials
Power purchaser – works for a utility, regional transmission organization, company, or other entity to negotiate prices for electricity on behalf of a single customer or group of customers
The list of careers below are just some of the possible jobs in the wind energy industry. Each of these jobs has its own set of support jobs that are found in any other industry. People who work in management, project management, marketing, accounting, and so on can work in wind energy, too. As you study this list, make note of any that interest you.
Electrical drafter – completes drawings of electrical systems such as wiring diagrams
Atmospheric scientist – studies atmospheric conditions such as wind speed and direction
Electronics engineer – designs and tests electronics like industrial controls
Quality control inspector – inspects products or outcomes to ensure they are meeting quality standards
Sailor – works on board cargo ships and other large vessels
Industrial Controls Electrician Specialist – installs, programs, and services control systems
Surveyor – makes surveys and maps of land and shoreline features to determine topography, boundaries, positioning of structures, and routes for infrastructure
Architect – designs buildings and other support structures
Power plant operator – monitors and operates control systems in power plants
Soils scientist – studies soils to assist construction, agriculture, or other uses and to protect the health of the soil and its environment
Mechanical engineer – designs and tests mechanical systems such as gear boxes and hydraulic systems
Truck driver – drives a large semi-tractor trailer truck on highways to deliver cargo
Wind turbine manufacturing – works for companies that manufacture wind turbine parts
Health and safety engineer – studies health and safety of employees and designs solutions for problems
Wind turbine service technician – provides maintenance and service to wind turbines and their parts inside
Programmer – writes code for computers and control systems
Engineering technician – works alongside engineers, carrying out testing and other protocols
Injection molder – makes the shells for wind turbine blades
Project manager – oversees all aspects of a project from its inception all the way to its completion
Environmental engineer – studies environmental impacts of systems and proposes mitigation strategies
Materials scientist – develops and creates new materials
Electrical engineer – designs and tests electrical components like generators and transformers
Careers Related to the Wind Industry
Civil engineer – designs and oversees construction of support systems like roads, foundations, etc.
Metallurgist – prepares and tests metal alloys
Instrument technician – inspects, tests, adjusts, and repairs
OFFSHORE WIND PROJECT MANAGER, DOMINION ENERGY
A: Since we are in the infancy of this (Coastal Virginia Offshore Wind) project, most of my time is dealing with contract negotiations. On a day-to-day basis, I review the weather forecast each morning to determine if work can be started, plan the work at the turbines in the water and at the substation, review the previous day’s production numbers, and handle various commercial items like warranties and budgeting.
A: In order to enter the offshore wind turbine, a person must attend Global Wind Organisation (GWO) training which consists of first aid, AED, working from heights, fire prevention, material handling, and sea survival training. One of the biggest hurdles I have come across is the height of the turbines. People have a hard time dealing with that on a daily basis.
©2022 The NEED Project Your Future In Wind Energy Student Guide www.NEED.org 29
Q: What advice would you give kids who are thinking about a career in wind energy?
Q: What is a day in the life of Tony Taylor like?
A: It depends on the students’ path. If they are interested in working out in the field, on the wind farm, they should learn about electrical, mechanical, and hydraulic equipment and how they interact with one another. If they are seeking management positions, they should focus on all the normal courses – people management, finance, budgeting, supply chain, and safety. If students want to work in more of an office environment, courses to focus on are business management, information technology, logistics, construction, and project management.
A: A willingness to learn all aspects of offshore wind, from the planning of bid selection for Federal leasing and all the necessary documented submissions required to how the electricity leaves the substation and enters the grid, including understanding the agreements needed to transmit the power.
Q: What special training did you need to complete before becoming a Wind Project Manager?
Q: How did you become an Offshore Wind Project Manager?
A: I have a Bachelor of Science (BS) in Applied Science and Technology from Rochester Institute of Technology, a Master of Business Administration (MBA) from Medaille College, and am working on an Executive MBA at Virginia Commonwealth University. I started working in the onshore wind industry in 2009 managing wind farms in the Northeast. I got great exposure working on continuous improvement projects at various wind farms in the USA and Canada. I worked for a company in Oklahoma that was just putting up a wind farm, where I learned about the engineering, procurement, and construction (EPC) aspects of wind energy development.
Q: What special skills or interests make you most suited for your job?
Tony Taylor
The EPC side are the people responsible for the actual building of a wind farm. Now I’m in Richmond, Virginia, learning more about offshore and all the nuances involved operating in and out of the water.
Career Profiles

A: The biggest advice I would give is to be flexible and take whatever opportunities are given to you. I have been fortunate to have a wide variety of experiences that, while somewhat unrelated, have given me the experience and knowledge to allow me to contribute to my company in many different ways.
A: A focus in water resources relates to renewable energy projects by ensuring that there is proper drainage infrastructure for the project’s access roads and making sure the vital equipment for the project is not at risk of frequent flooding. Erosion control is necessary to protect the natural environment from excess sediment that will erode from the new infrastructure and areas disturbed by the project.
30 ©2022 The NEED Project Your Future In Wind Energy Student Guide www.NEED.org
Q: What does a typical day look like for you?
Q: What advice would you have for students who want to pursue civil engineering and water resource management?
Q: How does being a civil engineer relate to the energy industry?
Q: You’re a relatively recent college graduate. How did you prepare for your current position?
A: A typical day for me usually involves going into the office to work on hydraulic models or construction plans on the computer. This requires a lot of coordination among the various parties involved in the project such as architects, government agencies, and of course the client. This communication takes up a large part of my day to ensure that all the various needs of the project are met. Despite spending most of my time in the office, I get to go out into the field to construction projects frequently. While on a jobsite, I inspect the work being done to ensure that it meets the necessary standards and will be functional long into the future.
A: The main certifications I have for my job are the Stormwater Pollution Prevention Plan (SWPPP) Design Certification and the Engineer in Training certification. SWPPP is important because a large part of my job involves designing erosion control measures to ensure that projects we work on do not adversely affect water quality. The certification also gave me knowledge to better design stormwater management infrastructure on our projects. Being certified as an Engineer in Training is crucial for advancing my career as it will eventually allow me to gain my professional license. This is one of the most critical certifications civil engineers can hold. The skill that has helped me most in my career so far has been my ability to consider projects from the viewpoint of multiple stakeholders, from citizens near our projects to the client and construction company. By learning to look at a project or problem from a variety of viewpoints I am better able to consider solutions that will be in everyone’s best interest, whether it is quicker construction, lower cost, or better long-term results.
Q: Besides your degrees, what other qualifications and skills are necessary for you to do your job?
Andre Ringle CIVIL ENGINEER IN TRAINING, WIDSETH
A: I have a Bachelor of Science from Michigan Technological University in civil engineering, and I also have a Master of Science from Michigan Tech in water resources. I am currently working on my second job since college; my first job helped me to learn some basic skills and what I wanted out of my career. I accepted my current position at the start of the COVID-19 pandemic. I have really enjoyed the greater work-life balance and the improved focus on the technical aspects of the job. My position now closely matches what I learned in school with a focus on water resources and stormwater management. The biggest difference between school and work is that school was much more focused on the larger picture but now the small details are significantly more important than they were in the classroom.

©2022 The NEED Project Your Future In Wind Energy Student Guide www.NEED.org 31 Multimeters, Ohm’s Law, and Measuring Electrical Values OFF 750 200 µ 200 2000 µ 20 m 200 m 10 hFE 1000 200 20 2000 m 200 m 2000 K 200K 20K 2000 200 V V A CE DIGITAL MULTIMETER Ω NPN PNP E E B B C E E C 10AD C V mAΩ C OM ! ! 1 0 A ma x u n fu se d 750VAC 1000VDC 200m A max 500V max DISPLAYDCVOLTAGE ROTARY SWITCHRESISTANCE AC VOLTAGEDCCURRENT 10A JACK FOR RED (NOT USED) VΩmA JACK FOR RED COM JACK FOR BLACK Any professional who works with electricity and electronics needs to know how to use a digital multimeter properly to measure voltage, current, and resistance. These values are related to each other through Ohm’s Law, which states that the voltage through a circuit or portion of a circuit is equal to the product of the current and resistance. Being able to take measurements and using Ohm’s Law to calculate unknown values allows us to understand what is going on in a DC circuit or system. Direct Current (DC) is provided by a cell, battery or a power supply, and can be shown as a one-way arrow from the negative terminal (anode) to the positive terminal (cathode) of that power source. DIRECT CURRENT + Ohm’s Law is written as V=IR where V stands for voltage in Volts (V), I stands for current in Amps (A), and R stands for resistance in Ohms (Ω). Another way to write Ohm’s Law is as shown: V I R
Measuring Resistance: This is the only measurement made with the power disconnected. Touch the two leads to either side of the device or circuit segment you are measuring. The resistance scale is also used to determine whether a circuit provides a complete path for current, or circuit continuity.
Measuring Current: Current is measured in series with the load. Disconnect the load from the power supply and insert one lead of the multimeter. Connect the other lead of the multimeter to the power supply. If the display is negative, reverse the connection, and if there is a 1 in the far left of the display move the scale up one click.
Multimeter measuring voltage across the LED and resistor. The meter reads 7.49 V under load when powering this circuit. The meter is set to the 20V DC range.
Measuring Voltage: Voltage is measured in parallel to the load on the circuit. Place one lead on one side of the load and the other on the other side. If the meter has a negative reading, reverse the connections. If the meter shows a 1 at the far left, increase the scale one click and try again. The circuit must be powered to make this measurement.
32 ©2022 The NEED Project Your Future In Wind Energy Student Guide www.NEED.org
The meter in set to the 2000 Ω or 2K Ω range. The resistor is 330 Ω by color code - with a gold (5%) tolerance band - so the acceptable range is between 313.5 Ω and 346.5 Ω. This resistor is slightly out of tolerance and should be replaced.
Multimeter connected in series, measuring current. The meter in this case reads 18.1 mA or milliAmperes. The meter is set to the 200 mA range.
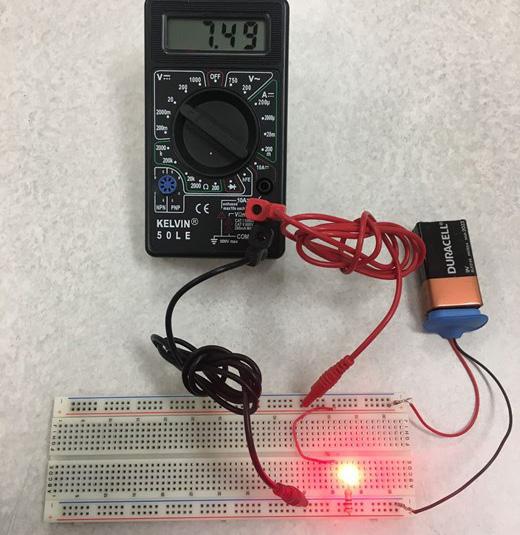
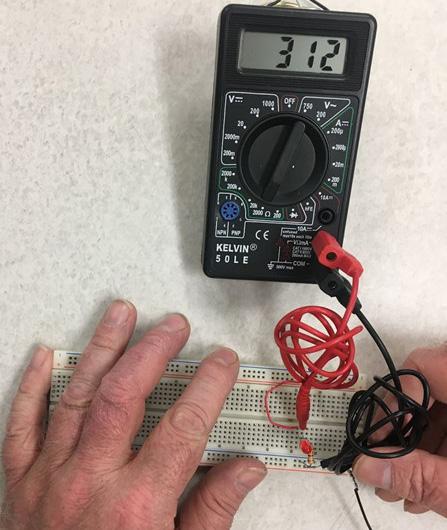
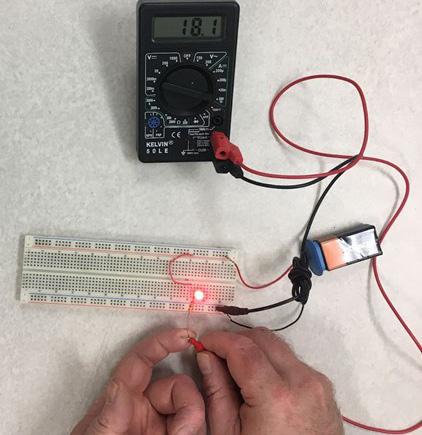
©2022 The NEED Project Your Future In Wind Energy Student Guide www.NEED.org 33 Units and Conversions 1 Ampere = 1 Coulomb / second 1 Coulomb = 6.24 x 10¹⁸ electrons; if electrons were grains of sand, one Coulomb would fill a triple-axle dump truck. 1 Volt = 1 Joule / Coulomb; Joule is the SI unit for energy. 1 Joule = 1 kg m2 / s 1 Ohm = 1 Volt / Ampere Each of these units may be modified by prefixes: Prefix Symbol Power of 10 Terra T 1 x 10¹² Larger than 1 Giga G 1 x 10⁹ Mega M 1 x 10⁶ kilo k 1 x 10³ centi c 1 x 10⁻² Smaller than 1 milli m 1 x 10⁻³ micro μ 1 x 10⁻⁶ nano n 1 x 10⁻⁹ pico p 1 x 10-12 It is important to pay attention to the prefixes on a meter’s scale; for example, if the scale is set to “20 mA” and your reading is 3.47, you are measuring 3.47 mA and need to make sure you are calculating with that measurement appropriately. 3.47 mA = 0.00347 A. There are more prefixes than those listed in the table above; however, these are the most common.
Science of Electricity Model
Observe the science of electricity model. Draw and label the parts of the apparatus. Explain how electricity is generated using appropriate vocabulary.
34 ©2022 The NEED Project Your Future In Wind Energy Student Guide www.NEED.org
4.
5.
8. Open the switch and disconnect all components.
3.
3. Connect the positive end of the batteries to one switch. Connect this switch to a light bulb holder, and connect the light bulb holder to the negative end of the batteries.
7. Close the switch and observe the bulbs again. Record all observations.
PART II: SERIES CIRCUIT WITH TWO LOADS Make sure the switch is open. As in Part I, put one battery into a battery holder, and connect it to one switch. Connect the switch to the first light bulb holder, the first light bulb holder to the second light bulb holder, and the second light bulb holder to the other end of the battery holder.
6. Disconnect the battery holder from the switch and insert the second battery in its holder. Use an alligator clip to connect the two batteries together in series (positive-to-negative).
4. Close the switch. Observe the brightness of each bulb and whether the battery or bulbs get hot.
4. Connect the positive end of the batteries to the other switch. Connect this switch to the other light bulb holder, and connect the light bulb holder to the negative end of the batteries, forming a parallel circuit.
2.
6. Open one switch and observe. Record observations.
8. Open both switches, disconnect all components, and return materials as instructed by your teacher.
1. Make sure both switches are open.
5. Close both switches and observe the bulbs and batteries as before.
7. Close the first switch and open the second. Record observations.
2. Use both batteries and battery holders. Connect them in series (positive-to-negative) with an alligator clip.
3. Insert a light bulb into each light bulb holder.
PART III: PARALLEL CIRCUIT
1.
PART I: SIMPLE SERIES CIRCUIT Make sure the switch is open. Put one battery in one battery holder. Connect one end of the holder to the switch with one alligator clip. Connect the other end of the battery holder to the light bulb holder. Use an alligator clip to connect the switch to the light bulb holder. Insert a light bulb into the light bulb holder. Close the switch. Observe the brightness of the bulb, and whether the battery or bulb get hot. Open the switch and disconnect the components.
2.
1.
5. Open the switch.
©2022 The NEED Project Your Future In Wind Energy Student Guide www.NEED.org 35 Series and Parallel Circuits ? Question How does wiring circuits in series or in parallel affect power use in a simple device? Hypothesis In your science notebook, write a statement addressing the question. Materials 2 D-cell batteries 2 Battery holders 2 Small light bulbs 2 Light bulb holders 2 Switches 7 Alligator clips Procedure 1. Gather all materials as instructed by your teacher. 2. Study the circuit schematics as shown in the data table. Know how you are going to build your circuit before you start. 3. Copy the data table into your science notebook. Leave room for diagrams and observations.
36 ©2022 The NEED Project Your Future In Wind Energy Student Guide www.NEED.org Data and Observations Copy the following data table into your science notebook, leaving enough room for diagrams and observations. Procedure Section Circuit Schematic Diagram Diagram of Circuit You Constructed Observations Part I: Simple Series Circuit Part II: Series Circuit, 2 bulbs, 1 battery Part II: Series Circuit, 2 bulbs, 2 batteries Part III: Parallel Circuit Conclusions 1. How did adding an additional light bulb to the series circuit change the brightness of the light bulb? 2. When you added the second battery to the circuit in Part II, what effects did you see? 3. How did the brightness of the light bulbs in the parallel circuit when both switches are closed compare to the brightness of the bulbs in the series circuits? 4. What happened when one switch was opened in the parallel circuit? How might this wiring scheme be an advantage over a series wiring scheme? Support your answer with evidence from the activity.
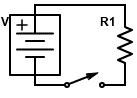
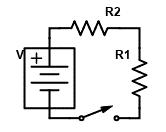
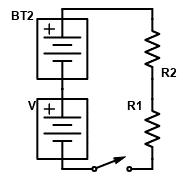
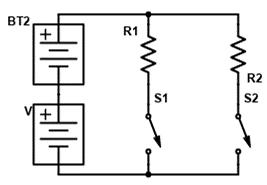
Breadboard Background
8
Breadboard
6.
330
9V
Figure 6 Breadboard Functional Diagram (with or without VCC and GND buses) snap or alligator clips Battery or alternate DC power supply pieces of # 22 ga. solid hookup wire - red and blue or other colors LEDs 4 Resistors 330 Ohms - ¼ Watt Multimeter (optional) and test the series circuit, leaving one lead to the battery disconnected. Make a diagram in the data table, using the appropriate schematic symbols for each circuit component. the last lead to the battery and observe the circuit. Record observations. one LED from the circuit and record observations. the series circuit, retaining all parts. Assemble and test the parallel circuit, leaving one lead to the battery disconnected. make a diagram in the data table, using the appropriate schematic symbols for each circuit component. Connect the last lead to the battery and observe the circuit. Record observations. Disconnect one LED from the circuit and record observations. Disassemble the parallel circuit and follow your teacher’s instructions for cleaning up.
7.
3. Connect
8.
9.
The breadboard functions as a quick and easy way to make connections with circuits that you would like to build. Connections are made by plugging component leads or wires into vertical rows of (5) holes to facilitate a connection. Never connect both component leads for a resistor or LED in the same vertical row as that will create a short circuit past the component and the current will just flow around it. Rather connect component leads by placing the connections next to one another horizontally.
NOTE: The long red (+) and blue (-) strips that run horizontally along the edges of most breadboards are bus strips to facilitate connections to positive voltage, sometimes called VCC, and ground. Ground is the point of lowest potential, often 0 Volts. You make these buses positive and negative by plugging the positive voltage source and ground or negative source into the bus strips. It is good practice to use red wire for positive and black for ground or negative in electronics. Any color wire will work, but it becomes more difficult to remember which is which if you do not follow the convention for red and black. Some smaller breadboards do not have bus strips. to use an appropriate current limiting resistor in series when utilizing LEDs with a 9V battery source or DC power supply. Ohms (orange, orange, brown, gold) should work fine. Materials
and Parallel Circuits
In your science notebook, write a statement addressing the question. Include a discussion about LED brightness if one of two LEDs in a circuit is disconnected.
Series with Breadboards what circumstances are series or parallel circuits the best choice? Hypothesis
! Safety Note Always remember
Switches - PBNO (Push Button Normally Open) or other switches (optional) Procedure 1. Acquire all parts in the materials list and identify them. 2. Assemble
4. Disconnect
Battery
©2022 The NEED Project Your Future In Wind Energy Student Guide www.NEED.org 37
? Question Under
Several
5. Disassemble
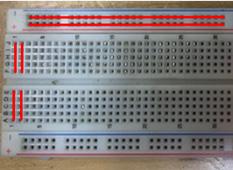
38 ©2022 The NEED Project Your Future In Wind Energy Student Guide www.NEED.org Data and Observations Copy the following data table into your science notebook, leaving plenty of space to write your observations. Use the following symbols when drawing your circuit diagram: Battery Resistor LED Circuit Type Schematic Diagram LED Brightness Disconnect one LED Other Observations Series (one path) Parallel (multiple paths) Conclusion 1. When you assembled the series circuit, how bright were the LEDs? 2. What happened in the series circuit when you disconnected one LED? 3. When you assembled the parallel circuit, how bright were the LEDs? 4. What happened in the parallel circuit when you disconnected one LED? 5. Based on your observations in this activity, what can you infer about the usefulness of series circuits? What about parallel circuits? Use the data you collected in the activity to justify your answer.

Extensions
DIAGRAM 1 DIAGRAM 2
Conclusion
10. Place your windmill in front of the fan and observe. Record observations in your science notebooks.
11. Investigate: Keep adding paper clips one at a time to determine the maximum load that can be lifted all of the way to the top. Record your data. Draw a diagram of the system. Label the energy transformations that occurred in order for work to take place. How could you change the design of your windmill to produce more work from the system? What variables can you change in this investigation? Create a new investigation changing one variable at a time.
©2022 The NEED Project Your Future In Wind Energy Student Guide www.NEED.org 39 ? Question What is the maximum load that can be lifted all of the way to the top of the windmill shaft? Materials Wind Can Do Work 4-Blade Windmill Template 1 Extra-long straw 1 Small stirrer straw Masking tape 50 cm String or thread Paper clips Large foam cup 2-3 Straight pins Binder clip Fan Ruler Hole punch Marker Scissors Procedure 1. Turn the cup upside down.
3. Prepare the windmill blades using the 4-Blade Windmill Template.
2. Cut the longer straw so that you have an 8 cm length. Share the other portion with another student or group, or discard it. Tape this straw horizontally to the bottom of the cup (which is now the top) so that there is an equal amount of straw on both ends. Set this aside.
8. On the very end of the stirrer near where the string is attached, fasten a binder clip in place for balance and to keep the string winding around the stirrer.
5. Slide the stirrer through the windmill template until the back of the template rests against the pin. Gently slide each blade over the end of the stirrer. Secure the blades to the straw using tape, and a pin.
9. Slide the stirrer forward to bring the binder clip next to the larger straw. Place an extra straight pin through the stirrer as needed to keep the blades away from the cup while still allowing them to move and spin.
4. Measure 1.0 cm from the end of the stirrer and make a mark. Insert a pin through the stirrer at this mark. This is the front of the stirrer. See diagram 1 to the right.
6. Insert the stirrer into the larger straw on the cup.
7. Tape the string to the end of the stirrer. Tie the other end of the string to a paper clip. Make sure you have 30 cm of string from the straw to the top of the paper clip. See diagram 2 below.
1. Check that your digital anemometer is set to measure m/s using the average (AVG). If it is not set up already, make these changes.
3. Turn the fan to the middle (#2) setting.
? Question How
Average Wind Speed does the distance from a wind source impact the speed of the wind? you predict the wind’s speed will change as you move away from the source of the wind? Make a claim that relates the wind speed to the distance from a box fan.
ANEMOMETERProcedureSET-UP
DATA COLLECTION
2. Place a measuring tape or stick perpendicular to the fan, starting the zero mark at the front of the fan. This will measure the distance away from the fan.
7. Plot each row of data on the graph to track the change in wind speed for each position as the anemometer moved away from the fan. Data and Observations
Record the wind speed in each of the coordinates below without a wind turbine in the fan’s path. Take 3 speeds at each distance; left of center, center, and right of center. To effectively measure the wind speed at each position, hold the anemometer 15 cm above the ground for at least 10 seconds.
Calculate the average wind speed at each distance from the fan by adding all 3 speeds and dividing by 3.
4. Hold the “MODE” button again until the screen changes and blinks.
Average Wind Speed = Right Wind Speed + Center Wind Speed + Left Wind Speed 3
5. Measure the wind speed at 4 distances (0.25 m, 0.5 m, 0.75 m, and 1.0 m). At each distance, measure the speed at 3 positions (center, right of center, and left of center).
6. Calculate the average wind speed for each of the 4 distances.
1. Set up your fan and safely plug the fan into an outlet. If using a box fan, make sure to install the plastic feet onto the fan for stabilizing.
3. Click the “SET” button to select “m/s” as the unit. Click on the “MODE” button to save the new settings.
5. Click the “SET” button to select “AVG,” so the anemometer will calculate the average wind speed.
6. To effectively measure the average wind speed at each position, hold it 15 cm above the ground for at least 10 seconds.
4. Hold the “MODE” button to turn on your anemometer.
2. Hold the “MODE” button until the screen changes and blinks.
40 ©2022 The NEED Project Your Future In Wind Energy Student Guide www.NEED.org
Materials “Wind Can Do Work” wind turbine model Meter Stick or Measuring Tape Fan Digital Anemometer
Hypothesis How do
©2022 The NEED Project Your Future In Wind Energy Student Guide www.NEED.org 41 Distance (m) 0.25 0.5 0.75 1.0 Right of Center Wind Speed (m/s) CenterWindSpeed (m/s) Left of Center Wind Speed (m/s) Average Wind Speed (m/s) Plot your data on the graph below by plotting the wind speed for each position (center, right of center, and left of center) at each position. Use a different color to plot each position’s change in velocity over time. (m/s)SpeedWindAverage Distance From Fan (m) Left, Center and Right (example data) 0.25 0.5 0.75 1.00 43210 Left Center Right (m/s)SpeedWindAverage Distance From Fan (m) Left, Center and Right 0.25 0.5 0.75 1.00 43210 Left Center Right
42 ©2022 The NEED Project Your Future In Wind Energy Student Guide www.NEED.org Conclusion 1. Place your hand at each position. What do you observe as you move your hand away from the fan? 2. Place a wind turbine at each position. What do you observe as you move the wind turbine towards the fan? 3. What is the relationship between distance and average wind speed? 4. Which position in the wind’s path (center, right of center, or left of center) experiences the lowest wind speeds?
3. Turn the fan to the middle (#2) setting.
5. Hold the “MODE” button to turn on your anemometer.
©2022 The NEED Project Your Future In Wind Energy Student Guide www.NEED.org 43 Wake Effect ? Question How does the wave effect impact wind speed in the space around a wind turbine? Hypothesis How do you predict that the wind’s speed will change if a wind turbine is placed in its path? Develop a claim that states how wind speed may change behind and to the sides of a wind turbine as energy is transferred into the turbine. Materials “Wind Can Do Work” wind turbine model Meter Stick or Measuring Tape Fan Digital Anemometer
8. Plot each row of data on the graph to track the change in wind speed for each position as the anemometer moved away from the fan. Data and Observations
DATA COLLECTION
Place a wind turbine at the center position, lining the blades up 0.25 m from the fan. Tape the wind turbine to the ground or table, so that it doesn’t move. Record the wind speed in each of the coordinates below. Take 3 speeds at each distance; left of center, center, and right of center. To effectively measure the wind speed at each position, hold the anemometer 15 cm above the ground for at least 10 seconds.
1. Check that your digital anemometer is set to measure m/s using the average (AVG). If it is not set up already, make these changes.
6. To effectively measure the average wind speed at each position, hold it 15 cm above the ground for at least 10 seconds.
Calculate the average wind speed for the 0.75 m and 1.0 m distances by adding all 3 wind speeds and dividing by 3.
ANEMOMETERProcedureSET-UP
2. Hold the “MODE” button until the screen changes and blinks.
3. Click the “SET” button to select “m/s” as the unit. Click on the “MODE” button to save the new settings.
3
4. Place a “Wind Can Do Work” wind turbine model so its blades line up at 0.25 m in the center of the wind’s path.
6. Measure the wind speed at 4 distances (0.25 m, 0.5 m, 0.75 m, and 1.0 m). At each distance, measure the speed at 3 positions (center, right of center, and left of center).
1. Set up your fan and safely plug the fan into an outlet. If using a box fan, make sure to install the plastic feet onto the fan for stabilizing.
7. Calculate the average wind speed for the 0.75 m an 1.0 m distances.
2. Place a measuring tape or stick perpendicular to the fan, starting the zero mark at the front of the fan. This will measure the distance away from the fan.
4. Hold the “MODE” button again until the screen changes and blinks.
5. Click the “SET” button to select “AVG,” so the anemometer will calculate the average wind speed.
Average Wind Speed = Right Wind Speed + Center Wind Speed + Left Wind Speed
44 ©2022 The NEED Project Your Future In Wind Energy Student Guide www.NEED.org Distance (m) 0.25 0.5 0.75 1.0 Right of Center Wind Speed (m/s) CenterWindSpeed (m/s) Left of Center Wind Speed (m/s) Average Wind Speed (m/s) Plot your data on the graph below by plotting the wind speed for each position (center, right of center, and left of center) at each position. Use a different color to plot each position’s change in velocity over time. (m/s)SpeedWindAverage Distance From Fan (m) Left, Center and Right (example data) 0.25 0.5 0.75 1.00 43210 Left Center Right (m/s)SpeedWindAverage Distance From Fan (m) Left, Center and Right 0.25 0.5 0.75 1.00 43210 Left Center Right
©2022 The NEED Project Your Future In Wind Energy Student Guide www.NEED.org 45 Conclusion 1. Place your hand at each position. Where do you observe the wind to be weakest? 2. Place your hand at each position. Where do you observe the wind to be the strongest? 3. Compare the average wind speed from the “Average Wind Speed” activity to your average wind speed at the 0.75 m and 1.0 m distance. Use this formula to calculate the percent of change. Percent of Change % = 100 x Average Speed Without A Turbine - Average Speed With A Turbine Average Speed Without A Turbine a. What is the percent of change in wind speed at 0.75 m? b. What is the percent of change in wind speed at 1.0 m? 4. Does the wind speed behind the turbine ever return to a predictable rate? 5. Change the location of the wind turbine. Do you observe the same changes in wind relative to the turbine’s placement? 6. How does the turbine impact the speed of the wind around it?
Wind Can Generate Electricity
4.
7. Connect the toilet paper roll to the cup by placing one large piece of tape over the toilet paper roll and cup, perpendicular to the toilet paper roll. It should extend from the side of the cup, over the roll, and to the other side of the cup.
6. Place the toilet paper roll over the smaller end of the cup. Adjust the roll so that it runs parallel to the straw on the top of the turbine, with the straw running directly down the center of the toilet paper roll.
1. Tape the ends of the toilet paper roll in place to help wrap your coils. Extend a piece of tape from one side of the toilet paper roll’s bottom and connect it to the side of the cup directly underneath. Make sure the tape covers the gap between the cup and roll. Repeat for the other side of the roll.
4. Continue the wire across the top of the toilet paper roll (without cutting) to the other end of the tube. Tape the wire near the edge of the other side, where you’d like to start wrapping your next coil.
3. After at least 150 wraps, secure the coil in place with tape to keep your coils intact and in place.
INSTALLING THE COPPER COILS
A
By
turbine model (with red/white coffee stirrer) Magnet wire 2 Neodymium magnets Multimeter 2 Alligator clips Nacelle Template Magnet Templates Toilet paper roll Hot glue gun with glue Ruler Scissors Tape Sandpaper BUILDINGProcedureYOUR NACELLE 1.
2.
46 ©2022 The NEED Project Your Future In Wind Energy Student Guide www.NEED.org
5. Remove the pins from the stirrer and set them aside.
2. Leave a 20 cm tail of magnetic wire hanging off the side of the roll. Tape the wire in place. Begin wrapping the wire around one end of the toilet paper roll. Complete 150 or more wraps of magnetic wire around one end of the toilet paper roll. Wire wraps should be tight and close together. Tape the wrapped coil of wires as needed to prevent unspooling.
3.
Background
A wind turbine uses the motion energy in the wind to generate electricity. A generator helps transfer the motion energy to electrical energy using magnets and wire. You will use the completed Wind Can Do Work model to create this wind turbine generator. This activity will help you to transform the paper clip lifting model into an electrified wind turbine. Your Wind Can Do Work model’s blades, rotor (stirrer straw), and monopile base (cup) will all transform wind energy into motion energy. But, now your model will spin a magnet instead of string. changing magnetic field can induce an electrical current, especially if the electrons are given a path through which to pass their charge. wrapping magnetic coated wire, you’ll have the opportunity to build your own copper coils. The spinning magnetic force created by the spinning magnets will push the negatively charged electrons through these coils. If you can move electrons, you’re generating electricity! Can Do Work Flatten your toilet paper roll. Cut out the Nacelle Template. Hold or tape the Nacelle Template in the vertical center of the toilet paper roll. The pointed edges of the Nacelle Template will be 1.8 cm from the open edges of the toilet paper roll. Once the Nacelle Template is in place, trace the shape onto the roll and carefully cut it out. Reshape the toilet paper roll. Unclip the binder clip from the back of your original wind turbine’s rotor (stirrer straw) and set the rotor/blades aside.
? Questions How is electricity generated? How can wind do work to generate electricity? Materials Assembled Wind
2.
7. Add a bead of hot glue to the blade end of the stirrer up to the side of the marker line. Slide the magnet onto this line of hot glue so that it lines up with your marker line. Add additional glue as needed.
1. Sand the enamel coating off of the ends of the 2 wire “tails” on your nacelle (toilet paper roll).
1. Cut out both Magnet Templates. Fold Tabs A and B inward on the dotted lines on both templates.
2. Line up the edge of Tab A on on one template to one end of one magnet and hot glue it in place, up to the dotted line. Line up the edge of Tab B to the other end of the magnet and hot glue it in place, up to the dotted line. This will leave a small gap between the paper and magnet. Repeat for the second magnet.
5. Adjust your magnets and pin placement. The magnets should spin in the middle of your copper coils as the blade spins freely. Mark the locations of the magnets and pins using a permanent marker.
9. Add a bead of hot glue to the back end of the coffee stirrer up to the side of the marker line. Slide the magnet onto this line of hot glue so that it lines up with your marker line. Add additional glue as needed.
Data
5. Start wrapping the wire in the same direction that you wrapped the other end. Complete 150 or more wraps of magnetic wire around this end of the toilet paper roll. Tape the wrapped coil of wires as needed to prevent unspooling.
6. Remove the back magnet from the stirrer and remove the stirrer from the large straw. Remove the pin from the coffee stirrer.
2.
3.
INSTALLING THE MAGNETS
©2022 The NEED Project Your Future In Wind Energy Student Guide www.NEED.org 47
2. Connect the alligator clips to each of your wind turbine’s wire leads.
3. Connect your multimeter to the alligator clips. Set your multimeter to 200 mV and start the fan to spin your blades. If the voltage is consistently negative, switch the alligator clips. Once you have a consistently positive voltage, add a small flag of tape to each wire lead coming off of the wind turbine.
1. Record your output and fan speed. Adjust the fan speed. How does the output change? Is there an optimal wind speed range? Change the orientation and positioning of your turbine. How does the output change? How is energy transformed when generating electricity using a wind turbine? What components are necessary for generating electricity? How are wind speed and generation output correlated?
TESTING YOUR WIND TURBINE:
6. After at least 150 wraps, tape the coil in place with tape to keep the coil intact and in place.
3. Slide one magnet onto the stirrer, so it is next to the blades. Reinsert the pin into the stirrer on the opposite side of magnet.
7. Leave a 20 cm tail of wire on this side. Cut the wire.
5.
6. Mark the wire lead that is connected to the red terminal on the multimeter as positive by drawing a “+” on its tape flag. Mark the wire lead that is connected to the black terminal on the multimeter as positive by drawing a “-” on its tape flag. and Analysis
4.
8. Reinsert the pin next to the blade-side magnet at your marker line. Insert the stirrer into the large straw. The pin should allow the rotor to spin freely.
Conclusion 1.
3.
4. Slide the coffee stirrer back into the large straw in the center of the toilet paper roll. Slide the other magnet onto the other end of the coffee stirrer.
4. Turn the “crank” on Gear A and count the number of revolutions required to turn Gear D one complete revolution. Record this in the data table. An example has been completed for you. Use a combination other than this one.
6. Remove the dowel rods from the gears and perpendicular block and return everything according to your teacher’s instructions.
48 ©2022 The NEED Project Your Future In Wind Energy Student Guide www.NEED.org Exploring Gear Ratios ? Question How can gears be used to modify a rotational speed? Hypothesis In your science notebook, write a hypothesis addressing the question. Materials 4050 20 10 Gear A Gear B Gear D Gear C 4050 20 10 Gear D Gear B Gear C Gear A 1 Hole plate 4 Gears: 1 each of 10, 20, 40, and 50 teeth 1 Dowel rod, 3/8” in diameter by 12 inches long 1 Perpendicular block 1 Permanent marker Ruler Cutting tool PARTProcedureI–PREPARING THE GEARS (FIRST USE) 1. Use a marker to mark the dowel rod into 1 ½ inch lengths. Use a cutting tool provided by your teacher to cut them apart. 2. Mark one place on each gear to use as a visual reference. For example, mark one tooth, or place a dot on one part of the interior of each gear. 3. Slide one dowel rod piece into the center of each gear so it extends through the unmarked side about half a centimeter. 4. Slide the end of a dowel rod into one of the two holes of the perpendicular block on the side with two holes (not the single hole in the middle). You will be using this with another dowel rod like a crank handle. PART II – EXPLORING THE GEAR RATIOS
5. Use dowels and the perpendicular block to explore other combinations of gears. Record the diagrams and data in the data table.
5. Repeat steps 3 and 4 with the other gears.
2. Slide the dowel rod up on the remaining gear so the gear will mesh with the small gear on the compound set. This is Gear D.
2. Place the 10-tooth gear on a hole (not one of the corner holes) near a corner of the hole plate.
3. Place another gear on the hole place so the teeth mesh with the teeth of the small gear.
1. Start with the 10-tooth gear. Attach the perpendicular block with dowel rod to the dowel rod in the center of the 10-tooth gear to form a crank.
4. Turn the “crank” on the small gear. Count the number of times it takes to turn the small gear to complete one revolution of the larger gear. Record this number in the data table.
PART III – EXPLORING COMPOUND GEAR RATIOS
3. Place the raised gear in a hole on the hole plate so the teeth of Gear D mesh with the teeth of Gear C (see diagram).
1. Make a compound gear by sliding a gear on the dowel rod of another gear. This is Gear C (see diagram).
©2022 The NEED Project Your Future In Wind Energy Student Guide www.NEED.org 49 Data and Observations Copy the data tables in your science notebook. Leave room in the second table for diagrams. PARTSmallIIGear Large Gear Number of Revolutions of Small Gear to Turn Large Gear Blue (10) Pink (20) Blue Green (40) Blue Yellow (50) PARTGearIIIA Gear B Gear C Gear D Number of Revolutions of Gear A to turn Gear D Blue (10) (example) Yellow (50) Pink (20) Green (40) 10 ¼ Diagrams of Complex Gear Combinations: Conclusions Copy the following questions into your science notebook, answering each after you copy it and before you copy the next question.
4. Using the derivation you obtained for question #3, determine the gear ratio for the complex gears you assembled. Does the gear ratio match the number of turns you recorded for each combination?
3. Derive a mathematical ratio from your data. Use this to generalize about gears and their ratios.
2. How do your numbers from question #1 compare to the number of teeth on the gear? Cite specific evidence from the activity.
5. What is the highest gear ratio you can achieve with the 4 gears in your set? What is the highest gear ratio you can achieve by combining your gears with the 4 from another group?
1. When you were driving one larger gear with the small, 10-tooth gear, how many times did you need to turn the small gear to turn the larger gear one complete revolution?
6. Using the answers you obtained in question #5, explain how these gear ratios can be beneficial when connecting a water turbine to a generator.
50 ©2022 The NEED Project Your Future In Wind Energy Student Guide www.NEED.org ? Question How does the blade’s pitch (angle) affect the turbine’s electrical output? Hypothesis Make a hypothesis to address the question using the following format: If (manipulated variable) then (responding variable) because ... Independent Variable: Blade Pitch Dependent Variable: Electrical Output Controlled Variables: Materials Poster board Dowels Scissors Masking tape Hub Protractor Turbine testing station (turbine tower, multimeter, fan) Benchmark Blade Template Procedure 1. Using the benchmark blade template, make three blades out of poster board. Space them evenly around the hub. 2. Slip the protractor around the dowel. Set the blades to a pitch of 90 degrees. 3. Put your hub on the turbine tower and observe the results. Record the data. 4. Set your blades to a new pitch and test again. This is your second trial. Record your data. 5. Repeat Step 4 at least once more to try to find the optimum pitch for the greatest electrical output. Data Table PITCH ELECTRICAL OUTPUT (VOLTAGE) TRIAL 1 90 DEGREES TRIAL 2 TRIAL 3 Graph Data The manipulated variable is written on the X axis (horizontal) and the responding variable is written on the Y axis (vertical). Conclusion Do you accept or reject your hypothesis? Use results from your data table to support your reasoning and explain which blade pitch you will proceed with for your next investigations and why. Note: The pitch you found to be optimal for the greatest electrical output will now be a controlled variable. In future explorations you will continue to use this pitch as you investigate. 1. Exploring Blade Pitch
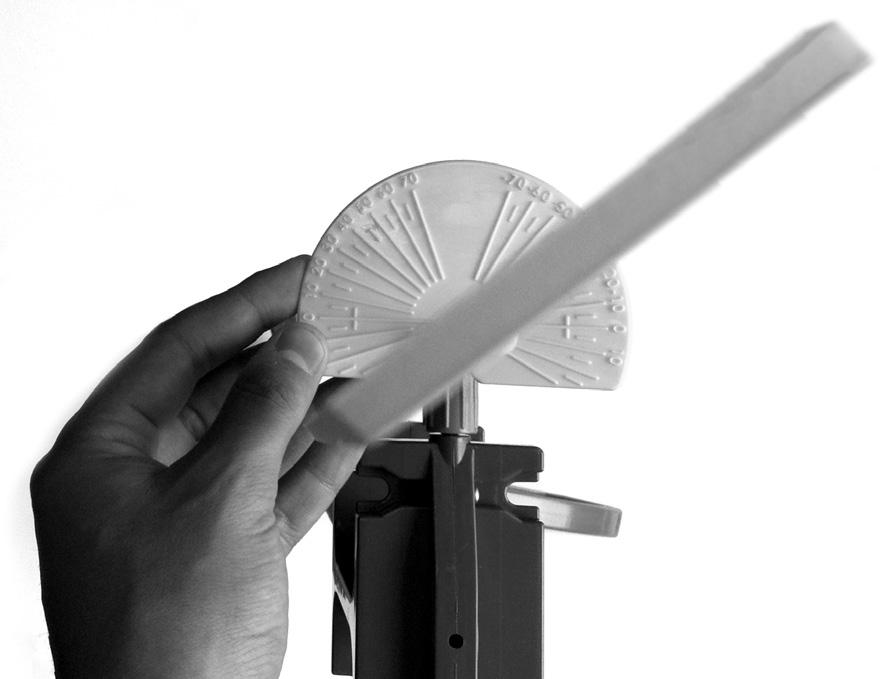
©2022 The NEED Project Your Future In Wind Energy Student Guide www.NEED.org 51 ? Question How do the number of blades on a turbine affect electrical output? Hypothesis Make a hypothesis to address the question using the following format: If (manipulated variable) then (responding variable) because ... Independent Variable: Number of Blades Dependent Variable: Electrical Output Controlled Variables: Materials Benchmark blades Poster board Dowels Scissors Masking tape Hub Turbine testing station Protractor Procedure 1. Decide how many blades you will be testing and make enough blades for the maximum number you will be testing. 2. In the data table, put down the greatest electrical output from the blade pitch investigation of the three benchmark blades. 3. Put the number of blades you want to test into the hub. They should have the same pitch as in the previous investigation. 4. Put your hub onto the turbine tower and test the number of blades. Record the results as trial 1. 5. Repeat steps 3-4 at least two more times to try to find the optimum number of blades for the greatest electrical output. Data Table NUMBER OF BLADES ELECTRICAL OUTPUT (VOLTAGE) BENCHMARK 3 BLADES TRIAL 1 TRIAL 2 TRIAL 3 Graph Data The manipulated variable is written on the X axis (horizontal) and the responding variable is written on the Y axis (vertical). Conclusion Do you accept or reject your hypothesis? Use results from your data table to support your reasoning and explain how many blades are ideal for a turbine. Note: The number of blades with the greatest electrical output should become the benchmark blades for your next investigation. 2. Exploring Number of Blades
52 ©2022 The NEED Project Your Future In Wind Energy Student Guide www.NEED.org ? Question How does the surface area of a turbine blade affect electrical output? Hypothesis Make a hypothesis to address the question using the following format: If (manipulated variable) then (responding variable) because ... Independent Variable: Dependent Variable: Controlled Variables: Materials Benchmark blades Poster board Dowels Scissors Masking tape Hub Turbine testing station Protractor Ruler Procedure 1. Calculate the surface area of the benchmark blade. In the data table, record the surface area and the greatest electrical output from your previous investigation of the benchmark blades. The formula for finding the area of a trapezoid is one half the sum of both bases, multiplied by the height or, a=1/2 (b1 + b2) h. 2. Keep the same shape as the benchmark blade, but change the length and/or width. This will change the surface area of the blade. 3. Make your new blades. You should have the same number of blades that you found had the best results in your previous investigation. 4. Find the surface area for each of your new blades. 5. Put your blades into the hub and onto the turbine tower. Test for electrical output and record data. 6. Repeat steps 2-5 at least two more times to try to find the optimum surface area for the greatest electrical output. Data Table SURFACE AREA ELECTRICAL OUTPUT (VOLTAGE) BENCHMARKTRIAL1TRIAL2TRIAL3 Graph Data The manipulated variable is written on the X axis (horizontal) and the responding variable is written on the Y axis (vertical). Conclusion Do you accept or reject your hypothesis? Use results from your data table to support your reasoning and explain how surface area affects the electrical output. Why do you think this is? Note: The blades with the surface area that achieved the greatest electrical output should become the optimum blades for your next investigation. AreaFormulaofatrapezoid = ½(b1 + b2) h 3. Exploring Surface Area hb1b2
©2022 The NEED Project Your Future In Wind Energy Student Guide www.NEED.org 53 ? Question How does adding mass to the blades affect the turbine’s electrical output? Hypothesis Make a hypothesis to address the question using the following format: If (manipulated variable) then (responding variable) because ... Independent Variable: Dependent Variable: Controlled Variables: Materials Optimum blades from previous investigation Pennies (or other mass) Masking tape Turbine testing station Protractor Procedure 1. In the data table, record your results from your previous investigation on the row with zero grams. 2. Tape one penny near the base of each blade, an equal distance from the center of the hub. 3. Test and record the electrical output. Repeat, adding another penny. If adding mass increases the output, add more pennies one at a time until you determine the ideal mass for the greatest electri cal output. 4. Distribute the pennies on the blades at different distances from the hub until you determine the optimal distribution of mass for the greatest electrical output. Data Table ADDITIONAL MASS ELECTRICAL OUTPUT (VOLTAGE) OPTIMUM 0 GRAMS TRIAL 1 TRIAL 2 TRIAL 3 Graph Data The manipulated variable is written on the X axis (horizontal) and the responding variable is written on the Y axis (vertical). Conclusion Do you accept or reject your hypothesis? Use results from your data table to support your reasoning and explain how mass and mass distribution affect the electrical output. Why do you think this is? Note: The blades with the mass that achieved the greatest electrical output should become the optimum blades or be considered for any further investigations, such as gear ratios and aerodynamics. 1c1c 1c1c 1c1c 1c1c Blade TapePennies Dowel 4. Exploring Mass
54 ©2022 The NEED Project Your Future In Wind Energy Student Guide www.NEED.org Turbine Tower Lift Mechanism ? Question How are smaller, residential-scale, wind turbine towers put into place? They are usually in places behind houses or alongside schools where large cranes cannot go. What is the best way to lift something from the ground to dozens of feet in the air? Hypothesis In your science notebook, write a statement explaining how you would accomplish this task. Materials 1/16” dia. x 14” Stiff steel wire, such as coat hanger wire, to serve as the tower Base - ¾” x 3 ½” x 16” - wood or plywood Hinge block - Small ¾” square x 1.25” piece of wood / plywood with small pilot holes on two sides 90 degrees apart (one on top for mounting and one on the side for tower to pivot within) Worm gear drive - 3mm output shaft Tape to affix take-up string String - light duty such as woven string line for construction Zip tie - 6” - to tie down worm gear drive to Base Small #2 wood screw #2 Screwdriver 3/32” Diameter drill bit Drill 3 Alligator clips or pieces of electrical tape 3 AA, C, or D batteries connected in series, or a 4.5 V bench power supply Knife Switch Stopwatch or timer Protractor PARTProcedure1–ASSEMBLING THE TOWER LIFT MECHANISM 1. Drill a small hole in the hinge block using a 3/32” diameter drill bit. Center the hole on the ¾” side. Attach it to the base with a small, #2 wood screw, as shown. Wind Turbine Tower Fixed String Worm Gear Drive Motor Assembly Hinge Block Zip TieFixed Base
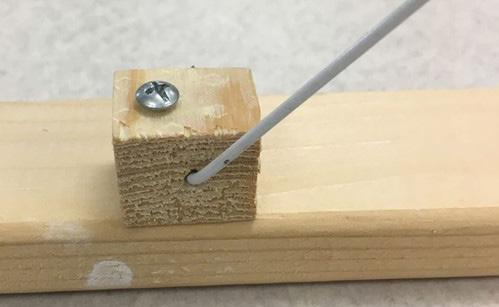
6. Attach the string line from the tower to the Worm-Gear Drive unit’s motor shaft by tying a knot and then wrapping the shaft to hold it still so it will not spin on the shaft with a piece of tape.
4. Attach the Worm-Gear Drive unit to the base about one inch from one end on the opposite end from the tower.
3. Tape the string along the centerline of the tower (1/16” diameter stiff steel wire) at a distance that you believe will provide appropriate leverage. This can be moved up or down as needed.
5. Tighten the zip tie to secure the motor to the base. The motor should be mounted on the centerline of the base.
8. If instructed by your teacher, position a kill switch to automatically cut the power to the worm-gear drive unit when the tower reaches its full height. Alternatively, this can be manually controlled by releasing the PBNO switch that provides power to the worm-gear drive unit.
2. Attach the tower to the hinge block by drilling a 3/32” diameter hole ½” from the end and centered vertically. Insert the stiff steel wire and bend it into a “U” shape to allow the tower to pivot in the hinge block.
©2022 The NEED Project Your Future In Wind Energy Student Guide www.NEED.org 55
7. Build the control circuits in the next section and use them to control the Worm-Gear Drive motor to lift the tower slowly into position.
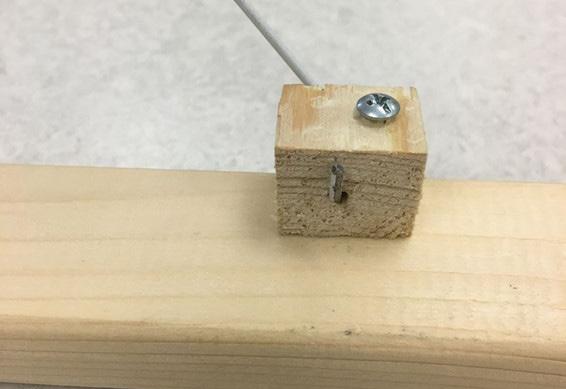
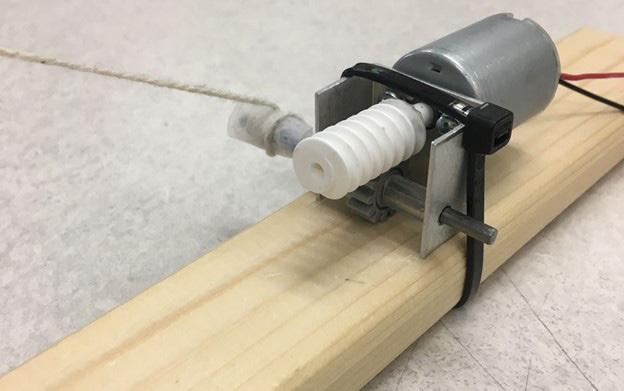
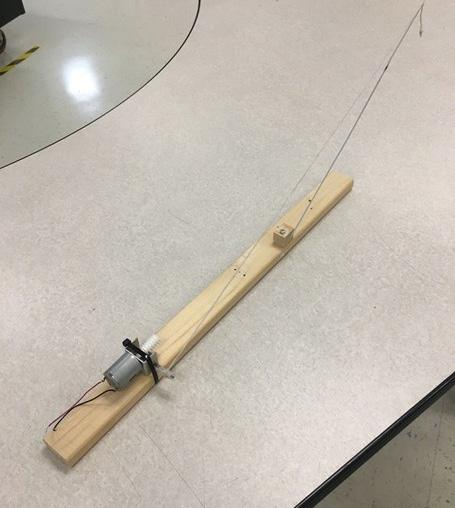
3.
Time to raise tower Angle of tower at fully raised position Make a sketch of your assembled lifting mechanism. What was most surprising about the functioning of the worm-gear drive? Compare this activity to the ideas you had in the hypothesis. What was different? What was the same? What would you do to redesign this mechanism to improve its performance? Cite evidence from this activity to support your statements.
Copy the following data table into your science notebook, leaving enough room for the measurements and observations.
2.
56 ©2022 The NEED Project Your Future In Wind Energy Student Guide www.NEED.org PART 2 – OPERATING THE TOWER LIFT MECHANISM 1. The motor requires a 4.5 Volt power source to operate. This can be accomplished by connecting 3 AA, C, or D batteries in series, or using a power supply. Follow the instructions of your teacher to do so. 2. Connect the red lead of the motor to the positive terminal of your power source using alligator clips or electrical tape. 3. Connect a switch between the black lead of the motor and the negative terminal of the power source. 4. Coordinate with your partner to close the switch and start the stopwatch or timer at the same time. 5. Record the amount of time it takes to raise the tower, and measure the angle at its fully raised position. 6. Repeat steps 4 and 5 two more times, for a total of three trials. Data and Observations
Trial 1 Trial 2 Trial 3 Average
Conclusion 1.
Ruler
1. Your teacher will assign an area for you to dig for a sample. Alternatively, your teacher may provide a soil sample to test in class. If your teacher provides a soil sample, skip to step 6.
The procedure outlined here is one that has been used before a small-scale wind turbine was placed in a specific location. It measures the proportion of sand, silt, and clay so the engineer approving the construction can determine whether the turbine can be supported by the soil without any amendments or alterations to the foundation. Sand is the largest of soil particles (0.5-2.0 mm) and the one with which you are probably most familiar. If you look at sand using a strong magnifying glass, you will see all the different kinds of rocks, shells, and other materials that make up sand. Clay is the smallest particle size (around 2 μm, or 0.002 mm) in soil and may also be familiar to you if you have taken a ceramics or art class where clay is used. The particles are extremely small and feel like talcum powder or corn starch. Silt is between sand and clay in size. Clay will hold a lot of water, expanding and shrinking considerably according to its moisture content. Clay is also very plastic, meaning it can be pushed and pulled into shapes while remaining intact. Sand does not compact well but also does not expand or contract according to moisture content. A good soil for heavy construction has the appropriate ratio of sand, silt, and clay to allow drainage and compaction but not expand or contract too much. Shovel 5-gallon bucket Small scoop or trowel, or large spoon 1-quart glass jar with lid Masking tape Procedure
When a site is being considered for construction of any structure larger than a single-family home, one step that must be completed is analysis of the soil to determine its suitability for development. There are many tests that engineers can use, including a percolation test which tests drainage, a density test which determines the density of the soil, and a compaction test which determines whether the soil will compact enough to support a heavy structure.
12. After resting mixture in a stable location for 12 hours, carefully, without shaking or disturbing the mixture place a piece of masking tape on the side of the jar vertically.
2. Remove top organic matter (grass) layer by using the shovel to cut into the organic layer all around a circle approximately 35 cm. Retain any sod removed so it can be replaced.
Testing Soil for Wind Turbine Foundations
11. Set the jar aside in an undisturbed location, such as on a shelf or window sill, for 12 hours.
7. Grab a handful of the soil and squeeze it together. Does the soil shrink in volume (compact)? Do the particles stick together? How wet is the soil? Record these and other observations in your science notebook.
10. Shake jar with water-soil mixture for 15 minutes until well mixed.
& Background
4. Use a ruler or meter stick to measure the depth of the soil horizons you can see. What is the thickness of the O-layer? Can you see the E layer, or even the B layer? Make a diagram of the horizons in your notebook.
6. In your science notebook, record the physical appearance of the soil. Is it wet? dry? what color is it? Can you see the particles without a magnifying lens? How does the soil feel?
8. Use the scoop or spoon to fill a mason jar ½ full with mixed soil from the bucket. If you dug a hole for your soil sample, return the remaining soil to the hole and replace any sod or vegetation removed.
Materials
3. Dig a hole 30 cm wide by 30 cm deep. Put all soil removed from the hole in a 5-gallon bucket.
13. Label sand, silt and clay layers along the masking tape. Measure the depth of each layer. Record this data in your notebook.
©2022 The NEED Project Your Future In Wind Energy Student Guide www.NEED.org 57
5. Use the shovel to mix up the contents of the bucket well.
9. Fill the jar with tap water, leaving about 2 cm air space, and cap firmly.
58 ©2022 The NEED Project Your Future In Wind Energy Student Guide www.NEED.org Data and Observations Record observations of your soil sample in your science notebook. In your notebook, make a diagram of your settled jar of soil. Copy the following data table into your science notebook and record your data there. Layer Depth in jar (cm) ClaySiltSand Conclusion 1. What is the ratio of sand to silt to clay of your soil sample? 2. Based on what you observe, is your soil sample suitable for supporting heavy equipment? Why or why not? Support your claim with evidence collected in the activity.
absorb take in or soak up energy or a substance by chemical or physical action
albedo the proportion of the incoming light that is reflected by a surface alloy metal made by combining two or more elements, especially to provide greater strength or resistance to corrosion alternating current (AC) an electric current that reverses its polarity at regular intervals or cycles; in the US the standard is 120 reversals or 60 cycles per second analogue using signals or information represented by continuously variable quantities
construction drawing more modern name of design plans or technical drawings used for constructing large structures control (n) device by which a machine or process is regulated control system device or system of devices which manages, commands, directs, or regulates the output of other devices or systems using control loops current flow of electric charge through a conductor; measured in amperes or amps cyclone wind rotating inward due to very low atmospheric pressure
decommission make inoperative; dismantle
©2022 The NEED Project Your Future In Wind Energy Student Guide www.NEED.org 59
Glossary
anemometer instrument used for measuring wind speed
airfoil the shape of a blade or wing from a side or cross-sectional view
Bernoulli Effect the pressure in a fluid is reduced as the flow speed increases
apprenticeship career training that combines classroom education with onsite job training arable able to be farmed or support a crop benthic bottom-dwelling; organisms that are benthic reside at the bottom of lakes, rivers, and streams
Bessemer Process process for producing steel patented by Henri Bessemer that greatly reduced the cost of manufacturing steel blade individual moving component of a turbine that is responsible for transferring energy blueprint design plan or other technical drawing; the first such plans consisted of white lines on a blue ground or blue lines on a white ground chemical energy energy stored in the chemical bonds of a substance and released during a chemical reaction such as burning wood, coal, or oil circuit a conductor or a system of conductors through which electric current flows clay mineral particle in soil that is smaller than 2 μm, or 0.002 mm compact (v) exerting a force on a substance to increase its density composite material made by combining two or more materials to improve upon the desired property conductor material that will allow electric current to flow (electrical conductor); material that will allow thermal energy to move through it (thermal conductor)
60 ©2022 The NEED Project Your Future In Wind Energy Student Guide www.NEED.org
density mass per unit volume, usually expressed in g/ml or kg/m3 diesel fuel fuel used in a diesel engine that is ignited by compression due to its flash point digital signals or data expressed as an exact value that represents a physical quantity direct current (DC) electric current that flows in only one direction through a circuit, as from a battery discrete individually separate and distinct; when applied to numeric values it means finite or well-defined rather than irrational or infinite elastic energy energy stored through the application of a force to stretch or compress an item electrical energy the energy associated with electric charges and their movements
electron very tiny, negatively charged subatomic particle that moves around the nucleus of an atom energy the ability to do work, produce change, or move an object; electrical energy is usually measured in kilowatthours (kWh) while heat energy is usually measured in British thermal units (Btu)
foundation lowest load-bearing portion of a structure, often below ground frequency how often something occurs in a time frame; the number of cycles per second front when discussing weather, term used to describe the boundary lines between masses of air with different densities; often associated with changes in wind speed gear ratio the ratio between the rates at which the last and first gears rotate generator a device that produces electricity by converting motion energy into electrical energy with spinning coils of wire and magnets gravitational energy energy of position or place greenhouse gas gas that traps the heat of the sun in the Earth’s atmosphere, causing it to warm the earth the way a greenhouse warms the interior of it by sunlight grid the layout of an electrical distribution system homogeneous having the same consistency or composition throughout horizon in soil science, a layer of soil or rock with particular characteristics hub part at which the blades are attached to the wind turbine that rotates due to the wind pushing on the blades hydrocarbon an organic compound made entirely of hydrogen and carbon hydrophone underwater microphone insulator material that resists electrical current flow (electrical insulator); material that resists transferring thermal energy (thermal insulator)
inverse square law relationship that says one quantity diminishes according to the square of another quantity; as one quantity increases, the other decreases by that quantity squared kinetic energy the energy of a body which results from its motion
electricity a form of energy created by the movement of electrons electromagnet magnet created through induction with a current-carrying coil inductionelectromagnetic production of voltage across an electrical conductor in a changing magnetic field
the strength and stiffness of a water-saturated soil is reduced by earthquake shaking load (electrical) a device that draws or uses electricity load (structural) forces exerted on a structure because of its weight and the weight of the contents of the structure
renewable able to be replenished in a short amount of time resin in material science, a resin is a substance made by mixing two fluid substances which react chemically and form a hard solid resin infusion a process where the empty spaces in a stack of porous material are filled with a liquid resin which is then allowed to cure, or solidify
ladder logic diagram showing the program governing a control system
liquefaction
a scale with points along an axis representing equal ratios; a scale with points where each is ten times greater than the previous point (pH 2 is ten times greater than pH 3) magnetic field the area of force surrounding a magnet motion energy the energy associated with objects moving, such as a ball rolling downhill or the wind blowing nacelle the housing where all of the generating components are found within a wind turbine
logarithmic
leasing limited time purchase agreement to the rights to something, such as energy production offshore or occupancy of a building
Newton’s Third Law of Motion laws that govern the motion of all items when a force is applied nonrenewable limited due to the inability to be renewed or produced in a short amount of time
nuclear energy energy stored in the nucleus of an atom that is released by the joining or splitting of nuclei parallel circuit conductor or system of conductors providing more than one pathway through which electrical current can flow parent material disintegrated rock and organic matter that is the basis for soil formation
©2022 The NEED Project Your Future In Wind Energy Student Guide www.NEED.org 61
pelagic relating to the open sea; pelagic organisms inhabit upper layers of the sea pitch the angle of the blade on a turbine; can be adjusted to reduce drag plastic (adj) ability to be easily shaped or molded ply layer of a laminated or bonded material potential energy the energy stored within a body power the rate at which energy is transferred, measured in watts; also used for a measurement of generating capacity programmable logic controller industrial computer control system that continuously monitors conditions and makes decisions based on those conditions
radiant energy energy that travels in electromagnetic waves like light or x-rays reflect throw off energy without absorbing it
resistance measure of the opposition to current flow in an electrical circuit; measured in ohms (Ω) sand soil mineral particle larger than 0.5 mm and up to 2 mm in diameter
scalar quantity with magnitude only, such as percentage or speed series circuit conductor or system of conductors providing only one pathway through which electrical current can flow silt soil mineral particle between 0.002mm and 0.5 mm soil mixture of organic and inorganic materials that form the upper layer of earth where plants grow sound energy energy that travels in longitudinal waves spar internal structure of a wind turbine blade
62 ©2022 The NEED Project Your Future In Wind Energy Student Guide www.NEED.org
subsoiling using very large blade-like devices to cut down through compacted soil to loosen it
substation location where step-down transformers reduce the voltage of electricity from large transmissions lines before distributing it to neighborhoods and businesses thermal energy internal energy within substances; movement or vibration of molecules thermoplastic substance able to be reshaped by heating it thermoset substance that is not able to be reshaped by heating it, and usually breaks down when heated tower structural support of a wind turbine transformer device that changes the voltage of electricity turbulence irregular motion within a moving fluid
U.S. Merchant Marine Act (Jones Act) Federal statute which requires shipping between U.S. ports be conducted by U.S.-flagged ships vector quantity with both magnitude and direction, such as velocity which is speed plus direction viewshed view of an area from a specific location or vantage point voltage measure of the pressure or potential difference under which electricity flows through a circuit wake fluid behind an object, such as air behind a wind turbine, that is slower moving and less smooth because of the energy extracted by the turbine or the drag the object creates watt unit of measurement of electric power; Joules per second wind moving air caused by uneven heating of the Earth’s surface wind shear change in wind speed and/or direction along a straight line or within a short distance wind turbine structural system that transforms motion energy in wind to electrical energy wind vane instrument used to show the direction of the wind wiring diagram document which shows how components of a system should be connected together; wiring diagrams show how control systems are connected or how the wiring in a new building should be laid out
Young’s Modulus ratio of the stress acting on a substance to the strain it produces; a measure of elasticity or deformation of a substance
What’s involved?
The NEED Youth Energy Conference and Awards gives students more opportunities to learn about energy and to explore energy in STEM (science, technology, engineering, and math).
©2022 The NEED Project Your Future In Wind Energy Student Guide www.NEED.org 63
The annual June conference has students from across the country working in groups on an Energy Challenge designed to stretch their minds and energy knowledge. The conference culminates with the Youth Awards Cenermony recognizing student work throughout the year and during the conference.
Youth Energy Conference & Awards
All NEED schools have outstanding classroom-based programs in which students learn about energy.
Students and teachers set goals and objectives and keep a record of their activities. Students create a digital project to submit for judging. In April, digital projects are uploaded to the online submission site.
Does your school have student leaders who extend these activities into their communities? To recognize outstanding achievement and reward student leadership, The NEED Project conducts the National Youth Awards Program for Energy Achievement.
For More Info: www.youthenergyconference.org
Check out: www.NEED.org/need-students/youth-awards/ for more application and program information, previous winners, and photos of past events.
Youth AWards Program for Energy Achievement
Share Your Energy Outreach with The NEED Network! This program combines academic competition with recognition to acknowledge everyone involved in NEED during the year—and to recognize those who achieve excellence in energy education in their schools and communities.
National Sponsors and Partners Adapt2 Solutions Alaska Electric Light & Power Company American Electric Power Foundation American Fuel & Petrochemical Manufacturers Arizona Sustainability Alliance Armstrong Energy Corporation Robert L. Bayless, Producer, LLC Baltimore Gas & Electric Berkshire Gas - Avangrid BG Group/Shell BP America Inc. Blue Grass Energy Bob Moran Charitable Giving Fund Boys and Girls Club of Carson (CA) Buckeye Supplies Cape Light Compact–Massachusetts Central Alabama Electric Cooperative CloverCLEAResultPark School District Clovis Uni ed School District Colonial Pipeline DominionDelmarvaConstellationConocoPhillipsConComEduencePowerEnergy, Inc. Dominion Energy Charitable Foundation Greenwired,GreenGovernmentGeraldGeorgiaScienceGeorgeTheFPLFoundationExelonExelonExelonEversourceEugeneEnelEduConEDPEcoCentricNowEastEastDukeDukeDonorsChooseEnergyEnergyFoundationBatonRougeParishSchoolsKentuckyPowerRenewablesEducationalConsultingGreenPowerNorthAmericaWaterandElectricBoardFoundationGenerationforEnvironmentalEducationFranklinInstituteMasonUniversity–EnvironmentalandPolicyPowerHarrington,GeologistofThailand–EnergyMinistryPowerEMCInc. Guilford County Schools–North Carolina HoustonHoneywellLULAC National Education Service IowaCentersGovernor’s STEM Advisory CouncilScale IllinoisUpClean Energy Community Foundation Illinois International Brotherhood of Electrical Workers Renewable Energy Fund Illinois Institute of Technology Independent Petroleum Association of New JacksonMexico Energy James Madison University Kansas Corporation Energy Commission Kansas Energy Program – K-State Engineering KentuckyExtensionO ce of Energy Policy Kentucky Environmental Education Council Kentucky Power–An AEP Company League of United Latin American Citizens –National Educational Service Centers LESLeidos–Lincoln Electric System Liberty Utilities Linn County Rural Electric Cooperative Llano Land and Exploration Louisiana State Energy O ce Louisiana State University – Agricultural Mercedes-BenzCenter USA Minneapolis Public Schools Mississippi Development Authority–Energy NationalNationalNationalMotusDivisionExperientialFuelGridHydropower Association National Ocean Industries Association National Renewable Energy Laboratory NC Green OklahomaOhioONorthNCiNicorNextEraNebraskansPowerforSolarEnergyResourcesGas–NortheastConstructionShoreGasshoreTechnologyConferenceEnergyProjectGasandElectricEnergy Corporation Omaha Public Power District Paci c Gas and Electric Company PeoplesPECO Gas PerformancePepco Services, Inc. Permian Basin Petroleum Museum Phillips 66 PowerSouthPNM Energy Cooperative Providence Public Schools Quarto Publishing Group Prince George’s County O ce of Sustainable Energy Renewable(MD)Energy Alaska Project Rhoades Energy Rhode Island O ce of Energy Resources Rhode Island Energy E ciency and Resource Management Council Salal Foundation/Salal Credit Union Salt River Project Salt River Rural Electric Cooperative C.T. Seaver Trust Secure Futures, LLC Shell USA, Inc. Shell Carson Shell Chemical Shell Deer Park Singapore Ministry of Education SocietySMUDSMECO of Petroleum Engineers South Carolina Energy O ce SunTribe Solar Tri-State Generation and Transmission TXU UnitedEnergyWay of Greater Philadelphia and Southern New Jersey UniversityUnitil of Kentucky University of Louisville University of Maine University of North Carolina University of Rhode Island University of Tennessee University of Texas Permian Basin University of Wisconsin – Platteville U.S. Department of Energy U.S. Department of Energy–O ce of Energy E ciency and Renewable Energy U.S. Department of Energy - Water Power Technologies O ce U.S. Department of Energy–Wind for Schools U.S. Energy Information Administration United States Virgin Islands Energy O ce We Care Solar ©2022 The NEED Project 8408 Kao Circle, Manassas, VA 20110 1.800.875.5029 www.NEED.org