School Energy Managers
Teacher Guide
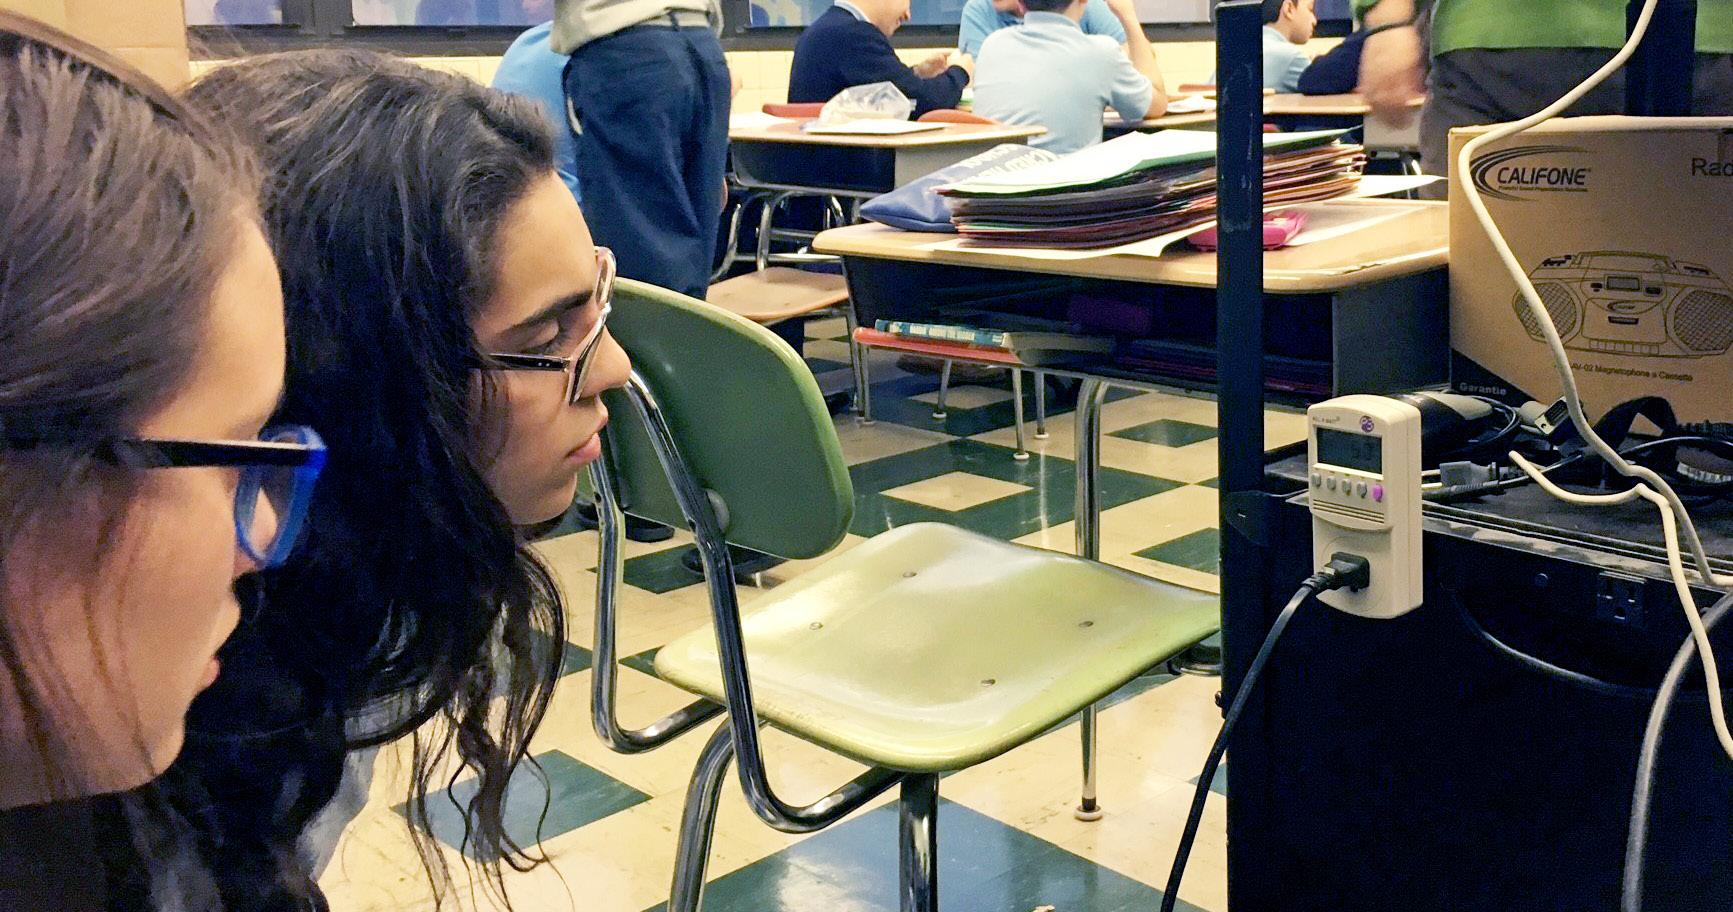
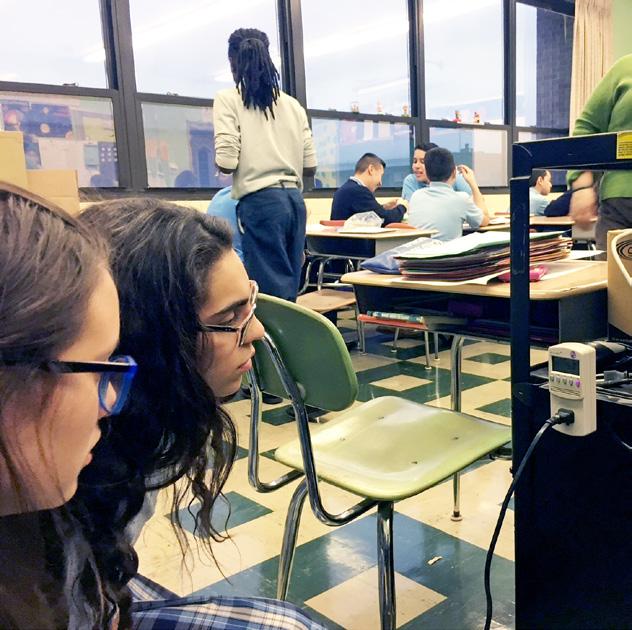
Hands-on activities that introduce students to the ways in which we use energy in school buildings. The school becomes a living laboratory as students explore thermal energy transfer, electricity, lighting, and conduct their own audits to improve the building’s function.
2024-2025

Grade


Science


OFF
Areas: Language Arts
Math Social Studies
Level: Subject
Secondary
Pri Ele Int Sec Technology
Teacher Advisor y Board
Constance Beatty Kankakee, IL
La’Shree Branch Highland, IN
Jim M. Brown Saratoga Springs, NY
Mark Case Randleman, NC
Lisa Cephas Philadelphia, PA
Nina Corley Galveston, TX
Samantha Danielli Vienna, VA
Shannon Donovan Greene, RI
Michelle Garlick Long Grove, IL
Michelle Gay Daphne, AL
Nancy Gi ord Harwich, MA
Erin Gockel Farmington, NM
Robert Griegoliet Naperville, IL
DaNel Hogan Tucson, AZ
Greg Holman Paradise, CA
Barbara Lazar Albuquerque, NM
Robert Lazar Albuquerque, NM
Melissa McDonald Gaithersburg, MD
Paula Miller Philadelphia, PA
Hallie Mills St. Peters, MO
Jennifer MitchellWinterbottom Pottstown, PA
Monette Mottenon Montgomery, AL
Mollie Mukhamedov Port St. Lucie, FL
Cori Nelson Win eld, IL
Don Pruett Jr. Puyallup, WA
Judy Reeves Lake Charles, LA
Libby Robertson Chicago, IL
Amy Schott Raleigh, NC
Tom Spencer Chesapeake, VA
Jennifer Trochez MacLean Los Angeles, CA
Wayne Yonkelowitz Fayetteville, WV
NEED Mission Statement
The mission of The NEED Project is to promote an energy conscious and educated society by creating effective networks of students, educators, business, government and community leaders to design and deliver objective, multisided energy education programs.
Permission to Copy
NEED curriculum is available for reproduction by classroom teachers only. NEED curriculum may only be reproduced for use outside the classroom setting when express written permission is obtained in advance from The NEED Project. Permission for use can be obtained by contacting info@need.org
Teacher Advisory Board
In support of NEED, the national Teacher Advisory Board (TAB) is dedicated to developing and promoting standardsbased energy curriculum and training.
Energy Data Used in NEED Materials
NEED believes in providing teachers and students with the most recently reported, available, and accurate energy data. Most statistics and data contained within this guide are derived from the U.S. Energy Information Administration. Data is compiled and updated annually where available. Where annual updates are not available, the most current, complete data year available at the time of updates is accessed and printed in NEED materials. To further research energy data, visit the EIA website at www.eia.gov.
2 ©2024 The NEED Project School Energy Managers Teacher Guide www.NEED.org
1.800.875.5029 www.NEED.org © 2024
School Energy Managers Kit
1 Light emitting diode bulb (LED)
1 Kill A Watt® meter
5 Sets of radiation cans (2 per set)
10 Lab thermometers
2 Bags of insulating materials (cellulose, packing peanuts)
5 Boxes
3 Student thermometers
1
1
School Energy Managers
©2024 The NEED Project School Energy Managers Teacher Guide www.NEED.org 3
meter
Light
1 Waterproof digital thermometer
1 Digital humidity/temperature pen (hygrometer)
9-volt Battery (for light meter)
1 Anemometer
1 Teacher Guide
1 Student Guide
Standards Correlation Information 4 Materials 5 Teacher Guide 6 Lesson 1 7 Lesson 2 8 Lesson 3 10 Lesson 4 12 Lesson 5 14 Lesson 6 16 Assessment and Evaluation 18 Energy Efficiency Bingo Instructions 19 Conservation in the Round 21 Baseload Balance 22 Student Information 25 Generation Parameters 27 Hang Tag Template 28 Incident Cards 34 Cheat Sheet 35 Student Worksheet 36 Masters Plug Loads Spreadsheet 37 Forms of Energy 38 U.S. Energy Consumption by Source, 2022 39 Anemometer 40 Kill A Watt® Meter 41 Interpreting an EnergyGuide Label 42 The Light Meter 43 Digital Thermometer 44 Hygrometer 45 Energy Efficiency Bingo 46 Conservation in the Round Cards 47 Evaluation Form 51
Table of Contents
Standards Correlation Information
www.need.org/educators/curriculum-correlations/
Next Generation Science Standards
This guide effectively supports many Next Generation Science Standards. This material can satisfy performance expectations, science and engineering practices, disciplinary core ideas, and cross cutting concepts within your required curriculum. For more details on these correlations, please visit NEED’s curriculum correlations website.
Common Core State Standards
This guide has been correlated to the Common Core State Standards in both language arts and mathematics. These correlations are broken down by grade level and guide title, and can be downloaded as a spreadsheet from the NEED curriculum correlations website.
Individual State Science Standards
This guide has been correlated to each state’s individual science standards. These correlations are broken down by grade level and guide title, and can be downloaded as a spreadsheet from the NEED website.

4 Teacher Guide www.NEED.org
Lesson 2
School Energy Managers Materials
Insulation Investigation (suggested)
Lesson 3
Calculating Ventilation
Plug Loads
Comparing Appliances
Light Bulb Investigations Keeping the Lights On
Lesson 4
Lesson 5
Vapor Barriers and Insulation
Two bags of insulating materials (cellulose, packing peanuts)
Radiation cans
Lab thermometers
Small boxes
Anemometer
Kill A Watt® meter
Student thermometers
LED Bulb
Kill A Watt® meter
Light meter
Hygrometer
Thermometers
Other insulation supplies as are safe and allowable
Spray can expandable foam insulation
Thick rubber or work gloves
May vary according to student experimental design
Respirator Masks
Gloves
Measuring tape
Calculator
Computers
Stopwatches or timers
Computers
At least 1, preferably 2 lamps
Incandescent bulb
Tape
Ruler or meter stick
Calculators
Fish tank (10 gal) or other large, transparent container with lid or cover
Quart-sized zip-close bags
Sandwich-sized zip-close bags
Cotton quilt batting
Ice
Water
Handwarmers
String, tape, meter stick (optional)
Student Audits
Lesson 6
Digital thermometer
Hygrometer
Light meter
Kill A Watt® meter
Clipboards or folders
Need more insulation materials? Head to NEED.org/shop to pick up a School Energy Managers consumbles kit.
*NOTE: Handle all insulation with caution. Use masks, gloves, and eye protection to minimize fiber and skin contact.
©2024 The NEED Project School Energy Managers Teacher Guide www.NEED.org 5 LESSON ACTIVITY MATERIALS IN KIT ADDITIONAL MATERIALS NEEDED
OFF
Grade Level
Teacher Guide
Secondary, grades 9-12
Time
8-13 class periods, plus additional time for audits
Home Kit
While this guide focuses on energy use at school, a supplementary guide is available that focuses on home energy use. Managing Home Energy Use is arranged in a similar, six-lesson format with the same focus as this guide. However, Managing Home Energy Use allows families to work together to learn to save energy at home by building on the classroom laboratory activities from this guide. The guide is available to download from NEED. Corresponding home energy efficiency kits are also available at NEED.org/shop
Additional Resources
The data in this curriculum comes mostly from the U.S. Department of Energy’s Energy Saver website, http://energy. gov/energysaver/energy-saver. This website has additional information, maps, and statistics that students can use. Copies of the Energy Saver Guide may be downloaded from the Energy Saver website.
NEED’s Blueprint for Student Energy Teams is an excellent resource to couple with this guide as you begin studying the efficiency of your buildings. The blueprint helps teachers and school staff to utilize their students to create energy teams and affect energy change in their buildings. Download the guide at NEED.org/shop
&Introduction
School Energy Managers introduces students to the concepts of energy, energy consumption, its economic and environmental effects, and conservation and efficiency through a series of activities that involve hands-on learning, teaching others, monitoring energy use, and changing behaviors. It is designed to be the classroom education component of a total energy management plan for secondary schools. An energy management plan could also include training of the building manager, administrators, and maintenance staff, and retrofitting the building.
The activities in this unit have been designed in a series of lessons to build on one another, providing all of the information students need to conduct a student energy audit of the building. The activities encourage the development of cooperative learning, math, science, comparison and contrast, public speaking, and critical thinking skills.
2Preparation
Familiarize yourself with the Teacher Guide, the Student Guide, and the information for each activity. Make sure that you have a working knowledge of the information, definitions, and conversions within the curriculum.
Familiarize yourself with the equipment in the kit. Procure materials needed that are not included within the kit (see chart on page 5).
Also included in this guide are two reinforcement activities. Energy Efficiency Bingo, and Conservation in the Round. These formative assessments are fun additions to the content and can be used as introductory activities or assessments throughout. Familiarize yourself with the activities on pages 19-21 and make copies as needed.
Well before you teach Lesson 6, communicate with your building principal and the other faculty and staff about allowing students to conduct a basic energy audit during the day. Secure permission from staff members before sending students into their offices, classrooms, and other work spaces to collect data. It helps if you explain what the purpose of the audit is, and what the expected outcomes are.
Make copies or digital masters of the following pages in the Teacher Guide for projection:
@Science Notebooks
This unit refers to students using science notebooks to record their questions, hypotheses, data, observations, and conclusions as they work through each lesson. If your students are not familiar with science notebooking, they may use the student worksheets in the Student Guides for guidance. Rubrics for assessing student work can be found on page 18.
6 ©2024 The NEED Project School Energy Managers Teacher Guide www.NEED.org OFF
MASTER TEACHER GUIDE PAGE Forms of Energy 38 U.S. Energy Consumption by Source, 2022 39 Anemometer 40 Kill A Watt® Meter 41 Interpreting an EnergyGuide Label 42 The Light Meter 43 Digital Thermometer 44 Hygrometer 45 Energy Efficiency Bingo 46 Conservation in the Round Cards 47-49
Lesson 1 – Introduction to Energy Use, Efficiency, and Conservation
&Background
This lesson introduces students to energy forms, sources of energy, and the economic sectors of the economy that consume energy. The emphasis of this lesson is on how each of us uses energy, and how efficiency and conservation contribute toward developing an energy management plan.
Objectives
Students will be able to identify the forms of energy and provide an example of each.
Students will be able to identify the sources of energy we use and describe the form(s) of energy therein.
Students will be able to explain how the various sectors of the economy use energy, and the main energy sources used by each sector.
Students will be able to differentiate between energy efficiency and energy conservation and provide multiple examples of each.
Concepts
Energy exists in many forms. Those forms of energy can be changed from one to another (transformed). The amount of energy in the universe is a constant amount, but the useable energy available to us in energy resources is not.
We use ten sources for our energy needs. Five of these sources are renewable, and five are nonrenewable. Fossil fuels are nonrenewable energy sources that are burned to release the energy stored in them.
The five sectors of the economy use energy in different ways. The electric power generation sector consumes the most energy. The residential/commercial sectors combined use the most energy when electricity is factored in.
Energy efficiency refers to the technology or equipment we use when doing an energy-using task. Efficient machines use less energy to do the same work as inefficient machines.
Energy conservation refers to the behavior we exhibit when using energy. Good conservation describes behaviors that minimize energy use.
Time
1-2 class periods
Materials
Forms of Energy master, page 38
U.S. Energy Consumption by Source, 2022 master, page 39
Student Guide pages 2-9
2
Preparation
Make copies of Student Guide pages as needed.
Prepare copies of the masters to project during the discussion.
Survey your classroom and make a list of items that use energy.
Familiarize yourself with the activities and decide how you want to assess them.
Procedure
1. Instruct students to read the student informational text for Lesson 1. This can also be assigned as homework prior to the lesson. Explain the forms and sources of energy and discuss how we as a country use energy. Project the Forms of Energy master, clarifying any unfamiliar terms for students using the definitions and conversions within the Student Guide as needed. Explain that as we use energy, we transform it from one form to another. Explain that at every transformation step, some energy is transformed into thermal energy, which we tend not to use. Project the U.S. Energy Consumption by Source, 2022 master and discuss the different ways we use each source. For more information, refer students to NEED’s Secondary Energy Infobook, which can be downloaded from www.NEED.org/energyinfobooks
2. Explain energy efficiency and conservation, providing examples or referring to page 3 in the Student Guide. Have students come up with their own examples of each. Students will need to synthesize the information about economic sectors and apply the concepts of efficiency and conservation to them when completing Efficiency vs. Conservation on page 8 in the Student Guide.
©2024 The NEED Project School Energy Managers Teacher Guide www.NEED.org 7
Additional Resources
Lesson 2 provides a great application to accompany your content-area lessons on specific heat capacity.
For deeper investigations into thermal energy and its transfer, download Thermodynamics from NEED.org/shop.
3. Talk about a few of the ways you use energy at school. Have students work individually or in small groups to complete the Energy Use Pre-Survey on page 9 of the Student Guide. You might want to point out some energy uses that are not as obvious to students, such as Wi-Fi routers, fire sensors, and clocks.
Extensions
Assign students an audit work area after Lesson 1 instead of during Lesson 6, and have them preview their work areas instead of just your classroom. Have students compare similarities and differences.
Assign students a sector of the economy to investigate new developments in technology that are improving efficiency in each of those sectors. Examples include new lighting choices, fuel economizing technology in vehicles, and lightweight machinery that uses less energy to manufacture goods.
Complete NEED’s Great Energy Debate as a class to discuss the energy sources as a class and help students to understand the advantages and disadvantages of each source based on its current uses in society.
Lesson 2 – Thermal Energy &Background
Lesson 2 focuses on thermal energy and its transfer. Conduction, convection, and radiation are discussed, and the concept of specific heat capacity is included to illustrate why some materials are used in certain applications but others are not. The lesson continues with a discussion of moisture, humidity, indoor air quality, and ventilation.
The Insulation Investigation has students designing their own investigation to determine which materials are the best insulators. You may provide students with as many or as few suggestions and limitations as you wish. Do what works best for your classroom, allowing your students the flexibility to discover the best way to scientifically determine insulating ability. You can use the materials in the classroom kit on their own, add to them, or provide students with no input with regard to material suggestions. If you want a more structured activity, a detailed, step-by-step activity can be found in NEED’s intermediate guide, School Energy Experts
Calculating Ventilation is designed to introduce students to some of the calculations that building managers and energy engineers utilize when designing or maintaining a ventilation system. Keep in mind that your classroom’s system is not necessarily pumping fresh air in; the HVAC system might be circulating air to warm or cool it, or mixing the existing air with some fresh air from outdoors. The activity is not intended to be used as a test to ensure compliance with local building codes for fresh air, but to illustrate your classroom’s air circulating capacity.
Objectives
Students will be able to explain how specific heat capacity factors in to material selection for thermal energy transfer.
Students will be able to calculate the amount of air being moved by HVAC equipment in cubic feet per minute as well as air changes/hour.
Students will be able to explain the balance among moisture, thermal energy, and fresh air ventilation when keeping occupants of a building comfortable and healthy.
8 ©2024 The NEED Project School Energy Managers Teacher Guide www.NEED.org
Concepts
Thermal energy is transferred by conduction, convection, and radiation.
The specific heat capacity of a material helps determine whether it will be used to transfer thermal energy, or prevent it (insulate).
The amount of moisture an indoor air mass can support depends on the temperature of the air.
The relative humidity of the air in a building is important to maintaining the comfort and health of its occupants.
Ventilation is exceptionally important when ensuring the health and safety of occupants of a building. The amount of fresh air that must be brought into a building varies by building use and local building codes.
Time
2-4 class periods
Materials
2 Bags of insulating materials (cellulose, packing peanuts)
Radiation cans
Lab thermometers
Boxes
Spray can expandable foam insulation
Other insulation materials as appropriate and safe, such as fiberglas fill
Respirator masks
Thick rubber or work gloves
Other approved materials according to student experimental design
Anemometer
Measuring Tape
Calculator
Anemometer master, page 40
Student Guide pages 10-17
Note
The activities in this lesson use Imperial units (degrees Fahrenheit and cubic feet per minute) rather than SI units ordinarily used in a science classroom. This is because American HVAC specialists use these units. Imperial units are used in these activities to remain consistent with industry standards.
! Caution
One suggested insulation that is not included in the kit is spray can expandable foam. Have students test this material, but the spray foam should only be dispensed by a responsible adult and only according to package directions. Polyurethane will dissolve many types of polymers so take care to not allow it to splatter. The foam will continue to expand after the outer surface is hard, so dispense less than you think you need; more can be added after curing if necessary. Polyethylene film (plastic food wrap or sandwich bags) can be used to protect boxes and containers from expandable foam.
Fiberglass batting should only be handled while wearing eye protection, gloves, and a mask under adult supervision to prevent inhalation of the fibers. Provide a mask to students if their group decides to utilize fiberglass.
2Preparation
Gather materials needed for the lessons.
Make copies of Student Guide pages as needed.
Review the Insulation Investigation activity in School Energy Experts for one method by which the insulating properties of the materials can be determined. This is not the only way to conduct the investigation, and your students may deviate from it to a great degree. However, being familiar with this activity will help you help your students if they struggle a bit.
©2024 The NEED Project School Energy Managers Teacher Guide www.NEED.org 9
Activity 2, Calculating Ventilation, within this lesson provides an excellent cross-curricular opportunity by incorporating some basic geometry.
Procedure
1. Introduce the lesson, and clarify any unfamiliar terms within the student text. Describe the three modes of thermal energy transfer and how systems relying on those modes work referring to page 10 in the Student Guide, if necessary.
2. Explain specific heat capacity using page 10 of the Student Guide as needed. Categorize conductors and insulators according to their specific heat capacities, in general, and explain how this property helps materials specialists select the substances used for different thermal energy applications.
3. Introduce the Insulation Investigation. Provide as much or as little background information as your students may need, while holding back enough information such that they are creative with their approach to solving the problem. Students might use hot water and its temperature decrease as the method for determining insulating capability, or they might look at the rate of temperature increase of cold water. They might not even use water. Students will be more innovative when you provide them very little input as to how they should conduct their investigation. Have students submit their experimental design before proceeding so you can review for experimental control and design safety. Students may need a full class period to come up with an investigative design.
4. Allow students a full class period to conduct their investigation, and to come together as a class and discuss their results.
5. Preview Calculating Ventilation starting on page 16 of the Student Guide. Review the formulas for calculating the area of regular shapes, and demonstrate how an irregular shape can be broken into smaller, regular shapes. Review how the area of those shapes can be calculated.
6. Project the Anemometer master and demonstrate its use. Show students how the measurement mode can be changed from one unit to another, and explain to them that they will use it to measure airflow in cubic feet per minute (CFM). Review the background information on the student page before student begin.
7. Allow students enough time to conduct the activity. They can measure air speed through the vents in small groups, or you can measure it and provide the data to them.
Extensions
Invite the building maintenance supervisor or engineer into your classroom to discuss airflow, air changes, and ventilation vs. heating or cooling with your class.
Invite a HVAC specialist to talk to your students about careers in HVAC systems.
Additional Resources
If you would like to take your students’ understanding of electric power generation a step further, consider including Baseload Balance with the other activities in Lesson 3. It provides an avenue to understand how power providers must balance generation with electric power demand. The activity can be found on pages 22-36 of this guide.
Lesson 3 – Electricity &Background
This lesson explains the energy sources used to generate electricity, how a generator works, and the parts of the transmission system. The units and measures of electricity are included, as well as the factors contributing to the cost of electric power from utility companies.
Objectives
Students will be able to explain how utility companies charge for electric power.
Students will be able to calculate the cost of running a machine using the power measured by a Kill A Watt® meter and the rate charged by the utility company.
Students will be able to calculate the life cycle cost of an appliance, comparing energy efficient devices to less efficient machines.
10 ©2024 The NEED Project School Energy Managers Teacher Guide www.NEED.org
Concepts
Electricity is a secondary source of energy, meaning it must be generated using other energy sources.
Generators use a changing magnetic field to generate electric current.
The generator in a power plant is turned by a turbine, which is itself turned by compressed steam, wind, or rushing water.
Transmission of electricity involves several steps, where voltages are increased or decreased as needed. Each step along the way results in some power loss.
ENERGY STAR® appliances are certified by a joint program between the U.S. Department of Energy and the Environmental Protection Agency as being the most efficient in their respective classes.
EnergyGuide labels provide the estimated annual cost to operate an appliance each year, and are useful when determining life cycle cost (purchase cost plus operation cost) for the appliance.
Time
1-3 class periods, depending on students’ computer skills
Materials
Computers with a spreadsheet program, such as Microsoft Excel
Kill A Watt® meter
Stopwatches or timers
Plug Loads Spreadsheet information, page 37
Kill A Watt® Meter master, page 41
Interpreting an EnergyGuide Label master, page 42
Student Guide pages 18-21
2Preparation
Prepare a digital copy of the master to project.
Gather materials for the investigations.
Make copies of Student Guide pages as needed.
Decide if you will have students go online to fill in a blank EnergyGuide label, or if you will provide the information for them to use. You may use the master to assist in this process.
Download a copy of the sample Plug Loads spreadsheet so you are familiar with it. The spreadsheet can also be used for students who need extra help or time on an assignment like this.
Make a list of plug loads as a class. Make sure to include items that you want students to include in their spreadsheets. They may list more, but it will be helpful for them if they know which devices they are required to include.
If you haven’t already put this in place, set up a way for your students to electronically submit their spreadsheets.
Procedure
1. Have students read the student text section on electricity. They will already be familiar with much of the information since electricity is the most familiar use of energy sources.
2. If students need more information or a refresher on electricity units and measures, direct them to NEED’s Secondary Energy Infobook
3. Introduce the Plug Loads activity. Students who are familiar with using spreadsheets should be able to develop their own. Those who are new to spreadsheet use may need help in developing a spreadsheet, and you may need to demonstrate for students how to type in a formula to do calculations.
©2024 The NEED Project School Energy Managers Teacher Guide www.NEED.org 11
4. Discuss the conclusion questions with your students. Develop as a class the top three things you all can do to reduce the amount of energy your classroom uses. If your school culture will be accepting, share this information with other teachers in your building to help them reduce the energy use in their classrooms as well.
5. Introduce Comparing Appliances in the Student Guide to the class. If needed, display the EnergyGuide Label master and discuss how to read it. Have them complete it in class or as homework with their families. Discuss the conclusion questions with them.
Extensions
Bring environmental impacts into the Plug Loads activity by having students calculate how much carbon dioxide is released into the atmosphere by each device. The Energy Information Administration calculates the amount of carbon dioxide released per kilowatt-hour of electricity consumed each year, based on the energy sources used nation-wide. In 2022, one kilowatt-hour of electricity resulted in 0.835 pounds of carbon dioxide emitted to the atmosphere.
Many students will begin to develop a strong, value-based opinion on energy use. As they start to understand the connection between energy use and its environmental impact, they may navigate toward extremes in opinion. If your students trend in this direction, consider some of the activities in NEED’s Exploring Climate Change to investigate the idea further.
Lesson 4 – Lighting
&Background
At the beginning of this century, lighting accounted for about 1/5 of the energy used in commercial buildings. In 2018, the most recent year for which data is available, that fraction had been cut to less than half that amount. The reduction is due to vast improvements in the efficiency of lighting. While fluorescent lighting is still the preferred lighting type in most schools, incandescent lighting has been replaced with primarily LED lighting in homes, and LED lighting is starting to be installed in place of metal halide and fluorescent fixtures in large spaces like gymnasiums and stadiums. This lesson is designed to give your students an understanding of the major lighting types in schools and the economics of operating them.
Objectives
Students will be able to explain the relative efficiencies of incandescent, halogen, fluorescent, and light emitting diode lighting.
Students will be able to determine the life cycle cost for each of the types of lighting found in schools, and evaluate the data to determine the most economic choice.
Concepts
Incandescent lighting is an old technology, using extremely high temperatures as its light source.
The Energy Independence and Security Act of 2007 mandated higher efficiency standards for light bulbs sold in the United States, and regular incandescent bulbs are no longer available.
Light bulbs should be compared based on the lumens of light emitted.
Light emitting diode (LED) lighting uses the least amount of energy to produce light. It has the lowest watt-to-lumen ratio.
Lighting has both an economic as well as an environmental impact.
12 ©2024 The NEED Project School Energy Managers Teacher Guide www.NEED.org
Time
1-2 class periods
Materials
Student thermometers
LED Bulb
Incandescent bulb
Kill A Watt® meter
Light meter
At least 1, preferably 2 lamps
Notes for Success
Tape
Ruler or meter stick
Calculators
The Light Meter master, page 43
Student Guide pages 24-33
*See notes for success below
The Light Builb Investigations activity is meant to showcase why we making lighting upgrades in our fixtures. Most importantly, incandescent bulbs produce more heat than they do light. More efficient bulbs can produce the same amount of light with little to no waste heat. This activity focuses more on the types of bulbs used at home and in lamp-style fixtures you might find at school. Due to lighting efficiency regulations in the U.S., the bulbs needed for this activity are no longer sold on shelves and are therefore difficult to provide in a kit. However, you may have some of these bulbs in fixtures around your classroom or home for use in completing this activity. If you choose to complete this activity, it is suggested you provide an incandescent (Edison, “rough service,” appliance, halogen incandescent, or white heat lamp) bulb for comparing to an LED and/or a CFL. You should aim to provide bulbs that have a similar shape and base/screw size, and put out a similar number of lumens to your efficient bulbs.
Some of the information needed to complete this activity may be more complicated than simply looking at a light fixture. Utilize the resources within your school to determine the type and size of lighting you have. Your custodian, maintenance worker, or building engineer should be able to help you.
If your school is relatively new or has been recently renovated, you may have integrated LED light fixtures rather than individual lamps. If that is the case, you will need to know how many watts each fixture uses. This is easily determined by lowering the light fixture and looking at the nameplate. Your building maintenance worker or building engineer can help you do this, or possibly even provide you with this information.
If you have motion sensors on your lights, time how long it takes for them to activate. Incorporate this time into students’ calculations.
Administrators or district business offices may be hesitant to provide information like the cost of electricity for the school. However, a simple explanation of how the data will be used will typically overcome that hesitancy and foster more cooperation, especially if the students develop a plan to reduce energy costs for the school.
2Preparation
Prepare digital copies of the masters for projection.
Make copies of Student Guide pages as needed.
Familiarize yourself with the operation of the light meter.
Gather the materials for the activities. Due to limitations in equipment, you may have to set up the light bulb activity and allow your students to rotate through in small groups.
Decide if you will have students working in small groups or individually on the Keeping the Lights On activity. If you choose small groups, you may want to assign them before class starts.
If you have windows, close the blinds completely to see if students catch on to using natural light to supplement the artificial lighting in the room.
Decide which of the Take Action activities you want students to complete after Keeping the Lights On, and how you want them to submit their work. This may be a good collaborative activity for the entire class; they can utilize online collaborative documents to complete their work.
©2024 The NEED Project School Energy Managers Teacher Guide www.NEED.org 13
Procedure
1. Introduce the activity by asking students what kinds of lighting they use on a regular basis, both at home and at school. Identify the major types of lighting they are likely to encounter and give a brief explanation of each. If able, invite the school facility staff to showcase the replacement bulbs and identify where each type is used.
2. Have students read through the informational text in the Student Guide. Fluorescents and light emitting diodes may be unfamiliar and you may need to explain the processes for producting light within each type of bulb.
3. Project The Light Meter master and explain its operation.
4. Allow students time to complete the Light Bulb Investigations. As a class, discuss the results.
5. Introduce the Keeping the Lights On activity. Explain that the skills needed to complete it are basic math skills – adding, subtracting, multiplying, and dividing.
6. Allow students sufficient time to complete the activity. When they attempt to adjust the lights to achieve 50 foot-candles, decide if you want to coach them about the blinds or let them figure it out themselves.
7. When students have completed all of their calculations, regroup the class and discuss their results. How much does it cost to light your classroom for one year? How much does it cost to light all of the classrooms?
8. Ask students which areas of the building were not included in their calculations. Some possible answers include office spaces, library, gymnasium, cafeteria, auditorium, etc. Decide if you will extend the activity to evaluate those spaces.
9. Direct students to the Take Action portion of the activity. Instruct them on which activities you’d like them to complete, and how you would like them to submit their work.
Extensions
Timing this lesson around the holidays allows you to discuss the different types of holiday lights available, and provides an avenue to investigate the cost of decorating with them. Bring in strings of different styles of holiday lights to compare, using the light meter and Kill A Watt® meter for data.
Encourage students to conduct this activity at home, by looking at all the different artificial lights in their home, estimating the amount of time each is on, and calculating the cost. They can find their cost per kWh for electricity on their utility bills or use the national average of $0.15 per kWh.
Allow students to survey other parts of the building for its lighting type, number, and illuminance. The auditorium may be particularly interesting if there are theater lights installed. Many school auditoriums have dimmable lighting that is separate from brighter overhead lighting, not to mention spotlights, back lights, and other kinds of lighting used in theatrical productions or concerts.
Lesson 5 – Energy Systems Working Together
&Background
In preparation for a culminating activity (energy audits), this lesson emphasizes the importance of a building’s systems working together. Students consider a case study of a fictitious school needing some efficiency upgrades under a limited budget and observe how one improperly installed system can lead to problems with others.
Objectives
Students will be able to explain the impacts one energy-consuming system might have on another.
Students will be able to justify upgrade choices based on efficiency and payback period data.
Concepts
The parts of a building work together to maintain the health and comfort of its occupants.
Disruptions or malfunctions of one building system can adversely impact another system.
14 ©2024 The NEED Project School Energy Managers Teacher Guide www.NEED.org
Time
1-2 class periods
Materials
Hygrometer from kit
2 Thermometers from kit
Fish tank (10 gal) or other large, transparent container
2 Quart-sized zip-close bags
2 Sandwich-sized zip-close bags
Cotton quilt batting
2Preparation
Ice
Water
2 Handwarmers
String, tape, meter stick (optional)
Tank lid, container lid, cookie sheet, etc. for covering the tank
Student Guide pages 34-37
Decide if you will have students work individually or in small groups on the Upgrading School Energy Systems activity.
Make copies of Student Guide pages as needed.
The morning of the Vapor Barriers and Insulation activity, set up the experimental apparatus using the following steps:
1. Decide whether you will model hot weather with cooling indoors, or cold weather with heating indoors.
2. Cut the cotton batting such that you can insulate the inside of one quart-sized bag and the outside of the other quart-sized bag. Secure in place, making sure all edges and sides of the bag are insulated.
3. If you are modeling hot weather with cooling indoors, place some ice inside each sandwich bag (close to the same mass of ice in each bag as possible), and seal each bag. Place them inside the insulated quart-sized bags.
4. Place very warm water in the bottom of the fish tank or clear plastic container. Fill it as full as you can, but leave enough room that the insulated quart-sized bags will hang above the water and not touch it.
5. Place thermometers inside each insulated quart-sized bag and secure. Suspend these bags in the tank so they do not touch the sides of the tank and are not sitting in the water in the bottom. One way to do this is to poke a hole in the top of the bag, thread string through the hole, and tie it to a meter stick. Place the meter stick across the tank so the bag hangs from it inside the tank.
6. Secure the hygrometer inside the tank so you can read the temperature and relative humidity.
7. Cover the tank, and allow your students to make observations throughout the day.
8. If you are modeling cold weather with heating inside, open the handwarmers, placing the packet inside each of the quart-sized bags instead of the ice. Substitute ice water for the hot water in the tank. Follow steps 5-7 as described. If you are doing this activity at a time of year when the weather is cold outdoors, place the tank outdoors where you students can access it easily. It will slow down the melting and warming rate of the water in the tank.
9. Provide a place for students to share data across class periods throughout the day. A suggested method is using an Internet-based document so the data is accessible after school, but they can also record it on a large piece of paper on a bulletin board, or on a white board or smart board in the classroom. Students in early class periods will need the data taken later in the day.
Procedure
1. Have students read the informational text on page 34 of the Student Guide. Discuss the various careers available within energy management.
2. Explain to students that you have set up a model that will demonstrate how vapor barrier placement is important when insulating a house.
3. Allow students time to make observations and record their data in the collaborative document you have set up.
4. Discuss the results of the vapor barrier model. Ask them to extrapolate these observations to other systems in a building, and explain how one system can affect another.
5. Introduce the case study activity. Allow students enough time to complete their recommendation and prepare a brief presentation.
©2024 The NEED Project School Energy Managers Teacher Guide www.NEED.org 15
Extensions
Arrange for a building engineer or your maintenance supervisor to come to your classroom and talk about the energy systems in your school and discuss his/her career pathway.
Ask your principal or building maintenance supervisor to give your students a tour of the mechanical room(s) of your school, describing the systems and how they work.
Lesson 6 – Energy Audits
&Background
Lessons 1 through 5 have been designed to give your students the background information they need to be able to successfully conduct a basic energy audit of your school building. Lesson 6 leads them through the process, including the kinds of observations they need to make as well as the questions they need to ask others.
A student energy audit does not substitute for a professional audit done by a trained professional, but often a student audit turns up simple things that school personnel can address right away that can immediately save energy in the school.
Objectives
Students will be able to evaluate the energy use of a school building at a basic, grade-appropriate level.
Students will be able to interpret data and make recommendations for energy savings based on that data.
Concepts
Energy use can be evaluated by making some simple measurements and observations.
Energy conservation recommendations will allow the school community to immediately begin saving energy.
Students can positively influence their school’s energy use by making efficiency upgrade recommendations.
Time
1 class period for lesson, plus several blocks of time (15-30 minutes each) for auditing
Materials
Digital thermometer
Indoor hygrometer
Light meter
Kill A Watt® meter
Clipboards or folders
Digital Thermometer master, page 44
Hygrometer master, page 45
Student Guide pages 36-45
Anemometer (optional)
2Preparation
Make copies of Student Guide pages as needed.
Make several additional copies of the audit form found in the Student Guide on pages 43-44. Students will need two copies for each room or area they audit – one for gathering data before recommendations, and another for gathering data after recommendations have been implemented.
16 ©2024 The NEED Project School Energy Managers Teacher Guide www.NEED.org
Assign students to work groups. The optimal group size is 2-4 students.
Use a school map to assign work groups to work areas. Provide a clear description of the areas students are going to audit. If any areas are off-limits, mark those clearly.
Gather and test the audit tools before sending any student group out to collect data. You may want to have extra batteries for each device on hand The anemometer can be used to verify air is coming from a vent. It is your choice if you wish for students to verify the CFM and calculate, however, this is not listed on the audit sheets.
NOTE: The energy audit tools have been used in prior activities, however if more practice with each tool is needed before conducting the audits, download NEED’s School Energy Inspectors for more practice.
Procedure
1. Have the students read the informational text found on page 38 of the Student Guide.
2. Explain to students that you will be placing them in work groups and assigning them a specific work area. They will be taking data in this area and making recommendations about it.
3. Review the operation of the light meter and Kill A Watt® meter. Review the light levels information on page 33 as well.
4. Project the Digital Thermometer and Hygrometer masters, explaining their functions and operation.
5. Review the School Building Survey and student audit form found in the Student Guide. As a class, determine how windows will be counted. They can be counted as one complete unit inserted in an opening in the wall, or each individual piece of glass, or some other way. The important thing is that everyone counts windows in the same way.
6. Walk students through data collection by having them collect data in your classroom. Remind students that some devices, such as computers and copy machines, should not be unplugged in the middle of the school day, and that they may need to come back to school in the early morning or stay later in the afternoon to measure those devices.
7. Allow students sufficient time to collect data in all of their work areas.
8. After data collection, bring the students together to evaluate the data as a class. A good way to do this is to create another collaborative document into which students can record their findings, much as was done in Lesson 5 with the vapor barrier/humidity activity.
9. Guide the students in their discussion, taking care to not tell them explicitly what their data show. Instead, allow students to brainstorm energy-saving ideas, and then guide them through an eliminating process to determine the best steps to recommend. They may record ideas on page 43 of the Student Guide or use it as a template for guiding discussion.
10. Allow students time to write a report of their findings and set up a time for them to present it to the principal or superintendent of schools.
Extensions
As a review prior to audits, conduct the Energy Efficiency Bingo and/or Conservation in the Round activities. Use them again after audits as a formative assessment tool. These activities can be found on pages 46-49.
After students have made their presentations, begin a campaign encouraging better energy use. Students can make posters to hang around the school and video “commercials” to play at various times of the day.
Student energy audits lend themselves very nicely to a Youth Awards project, and can provide an avenue for your students to develop leadership and presentation skills. For more information, visit youthawards.need.org.
©2024 The NEED Project School Energy Managers Teacher Guide www.NEED.org 17
Assessment and Evaluation
Assessment and Evaluation
Ask students to help devise a rubric to assess their group work on data collection, and class discussion during the audit process. A sample data and notebooking rubric can be used below.
Evaluate final group work on final audit recommendations. Share the rubric with groups ahead of time. A sample is provided below.
Use Energy Efficiency Bingo and Conservation in the Round as formative assessments throughout the unit.
Evaluate the unit with your students using the Evaluation Form on page 55. Return it to NEED.
@Student Reporting Form or Science Notebook Rubric
This is a sample rubric that can be used with student reporting forms or science notebooks. You may choose to only assess one area at a time, or look at an investigation as a whole. It is suggested that you share this rubric with students and discuss the different components ahead of time.
4 Written explanations illustrate accurate and thorough understanding of scientific concepts.
3 Written explanations illustrate an accurate understanding of most scientific concepts.
2 Written explanations illustrate a limited understanding of scientific concepts.
1 Written explanations illustrate an inaccurate understanding of scientific concepts.
Group Work Rubric
The student independently conducts investigations and designs and carries out his or her own investigations.
The student follows procedures accurately to conduct given investigations, begins to design his or her own investigations.
The student may not conduct an investigation completely, parts of the inquiry process are missing.
The student needs significant support to conduct an investigation.
Comprehensive data is collected and thorough observations are made. Diagrams, charts, tables, and graphs are used appropriately. Data and observations are presented clearly and neatly with appropriate labels.
Necessary data is collected. Observations are recorded. Diagrams, charts, tables, and graphs are used appropriately most of the time. Data is presented clearly.
Some data is collected. The student may lean more heavily on observations. Diagrams, charts, tables, and graphs may be used inappropriately or have some missing information.
The student clearly communicates what was learned and uses strong evidence to support reasoning. The conclusion includes application to real life situations.
The student communicates what was learned and uses some evidence to support reasoning.
The student communicates what was learned but is missing evidence to support reasoning.
Data and/or observations are missing or inaccurate. The conclusion is missing or inaccurate.
This is a sample rubric that can be used to assess group recommendation projects for Lesson 6.
4 Project covers the topic in-depth with many details and examples. Subject knowledge is excellent. Content is very well organized and presented in a logical sequence. Project shows much original thought. Ideas are creative and inventive. The workload is divided and shared equally by all members of the group.
3 Project includes essential information about the topic. Subject knowledge is accurate.
2 Project includes essential information about the topic, but there are 1-2 factual errors.
1 Project includes minimal information or there are several factual errors.
Content is organized in a logical sequence.
Content is logically organized but may have a few confusing sections.
There is no clear organizational structure, just a compilation of facts.
Project shows some original work. Work shows new ideas and insights.
Project provides essential information, but there is little evidence of original thinking.
Project provides some essential information, but no original thought.
The workload is divided and shared fairly equally by all group members, but workloads may vary.
The workload is divided, but one person in the group is viewed as not doing a fair share of the work.
The workload is not divided, or it is evident that one person is doing a significant amount of the work.
18 ©2024 The NEED Project School Energy Managers Teacher Guide www.NEED.org 18 ©2023 The NEED Project School Energy Managers Teachers Guide www.NEED.org
SCIENTIFIC CONCEPTS SCIENTIFIC INQUIRY DATA/OBSERVATIONS CONCLUSIONS
CONTENT ORGANIZATION ORIGINALITY WORKLOAD

Get Ready
BINGO Energy Efficiency
Instructions
Duplicate as many Energy Efficiency Bingo sheets (found on page 46) as needed for each person in your group. In addition, decide now if you want to give the winner of your game a prize and what the prize will be.
Get Set
Pass out one Energy Efficiency Bingo sheet to each member of the group.
Go
PART ONE: FILLING IN THE BINGO SHEETS
Give the group the following instructions to create bingo cards:
This bingo activity is very similar to regular bingo. However, there are a few things you’ll need to know to play this game. First, please take a minute to look at your bingo sheet and read the 16 statements at the top of the page. Shortly, you’ll be going around the room trying to find 16 people about whom the statements are true so you can write their names in one of the 16 boxes.
When I give you the signal, you’ll get up and ask a person if a statement at the top of your bingo sheet is true for them. If the person gives what you believe is a correct response, write the person’s name in the corresponding box on the lower part of the page. For example, if you ask a person question “D” and they give you what you think is a correct response, then go ahead and write the person’s name in box D. A correct response is important because later on, if you get bingo, that person will be asked to answer the question correctly in front of the group. If they can’t answer the question correctly, then you lose bingo. So, if someone gives you an incorrect answer, ask someone else! Don’t use your name for one of the boxes or use the same person’s name twice.
Try to fill all 16 boxes in the next 20 minutes. This will increase your chances of winning. After the 20 minutes are up, please sit down and I will begin asking players to stand up and give their names. Are there any questions? You’ll now have 20 minutes. Go!
During the next 20 minutes, move around the room to assist the players. Every five minutes or so tell the players how many minutes are remaining in the game. Give the players a warning when just a minute or two remains. When the 20 minutes are up, stop the players and ask them to be seated.
PART TWO: PLAYING BINGO
Give the class the following instructions to play the game:
When I point to you, please stand up and in a LOUD and CLEAR voice give us your name. Now, if anyone has the name of the person I call on, put a big “X” in the box with that person’s name. When you get four names in a row—across, down, or diagonally—shout “Bingo!” Then I’ll ask you to come up front to verify your results.
Let’s start off with you (point to a player in the group). Please stand and give us your name. (Player gives name. Let’s say the player’s name was “Joe.”) Okay, players, if any of you have Joe’s name in one of your boxes, go ahead and put an “X” through that box.
When the first player shouts “Bingo,” ask them to come to the front of the room. Ask them to give their name. Then ask them to tell the group how their bingo run was made, e.g., down from A to M, across from E to H, and so on.
Energy Efficiency Bingo is a great icebreaker for a NEED workshop or conference. As a classroom activity, it also makes a great introduction to an energy unit.
2Preparation
5 minutes
Time
45 minutes
Bingos are available on several different topics. Check out these resources for more bingo options!
Biomass Bingo—Energy Stories and More
Change a Light Bingo—Energy Conservation Contract
Coal Bingo—Coal guides
Energy Bingo—Energy Games and Icebreakers
Forms of Energy Bingo— Science of Energy
Hydropower Bingo— Hydropower guides
Hydrogen Bingo—H2 Educate
Nuclear Energy Bingo— Nuclear guides
Oil and Natural Gas Bingo— Oil and Natural Gas guides
Solar Bingo—Solar guides
Transportation Bingo— Transportation guides
Wind Energy Bingo—Wind guides
©2018 The NEED Project School Energy Managers www.NEED.org 19 ©2024 NEED Project School Energy Managers Teacher Guide www.NEED.org 19
OFF
Now you need to verify the bingo winner’s results. Ask the bingo winner to call out the first person’s name on their bingo run. That player then stands and the bingo winner asks them the question which they previously answered during the 20-minute session. For example, if the statement was “can name two renewable sources of energy,” the player must now name two sources. If they can answer the question correctly, the bingo winner calls out the next person’s name on their bingo run. However, if they do not answer the question correctly, the bingo winner does not have bingo after all and must sit down with the rest of the players. You should continue to point to players until another person yells “Bingo.”
ENERGY EFFICIENCY
A. Can name two ways to increase a car’s MPG
Knows the definition of energy efficiency
I. Knows a type of bulb that uses one-quarter of the energy of incandescents
M. Sets this item differently at day and night and for the season
B. Can name three ways to save energy at home
Knows the definition of energy conservation
J. Knows where to find an EnergyGuide label
N. Knows the number one use of energy in the home
proper tire inflation, drive the speed limit, slow acceleration
Switch to CFLs or LEDs, use a programmable thermostat, wash clothes in cold water, etc.
BINGO ANSWERS
C. Can name three ways to save energy at school
Knows what an ENERGY
K. Can name one appliance that should be run only when fully loaded
O. Has an energy conservation team at school
D. Has at least one ENERGY STAR® appliance at home
Knows what SEER is
L. Uses day lighting in the classroom instead of overhead lights
P. Knows whether energy is the first, second, or third highest expenditure in a school district (choose one)
Using technologies to continue activities at the same level while using less energy
Choosing to use less energy through alternative behaviors or actions
Turn off computers/lights/ appliances when not in use, close doors and windows, etc.
The product meets energy efficiency requirements
ask for location/description
seasonal energy efficiency ratio of cooling output by power consumption
On appliances and products for homes and business
clothes washer
ask for details
programmable thermostat
heating/cooling
ask for description/details
second, the first is personnel
20 ©2024 The NEED Project School Energy Managers Teacher Guide www.NEED.org 20 ©2018 The NEED Project School Energy Managers www.NEED.org
CFL or LED
A E I M B F J N C G K O D H L P
E.
F.
G.
STAR® label means
H.
20 ©2023 The NEED Project School Energy Managers Teachers Guide www.NEED.org
Get Ready
Conservation in the Round
Copy the Conservation in the Round cards on pages 47-49 onto card stock and cut into individual cards.
Make an additional copy to use as your answer key. This page does not need to be cut into cards.
Have the class refer to the informational text in the Student Guides for quick reference, or refer to the Secondary Energy Infobook
Get Set
Distribute one card to each student. If you have cards left over, give some students two cards so that all of the cards are distributed.
Have the students look at their bolded statements at the top of the cards. Give them five minutes to review the information about their statements from their Student Guides.
Go
Choose a student to begin and give the following instructions:
Read the question on your card. The student with the correct answer will stand up and read the bolded statement, “I have _____.”
That student will then read the question on their card, and the round will continue until the first student stands up and answers a question, signaling the end of the round.
If there is a disagreement about the correct answer, have the students listen to the question carefully looking for key words (forms versus sources, for example) and discuss until a consensus is reached about the correct answer.
Alternative Instructions
Give each student or pair a set of cards.
Students will put the cards in order, taping or arranging each card so that the answer is directly under the question.
Have students connect the cards to fit in a circle or have them arrange them in a column.
Conservation in the Round is a quick, entertaining game to reinforce information about energy sources, forms of energy, and general energy information from the Intermediate Energy Infobook. Grades
5–12
2 Preparation
5 minutes
Time
20–30 minutes
“In the Rounds” are available on several different topics. Check out these guides for more, fun “In the Round” examples!
Coal in the Round—Coal guides
Energy in the Round—Energy Games and Icebreakers
Forms of Energy in the Round—Science of Energy guides
Hydrogen in the Round—H2 Educate
Oil and Natural Gas Industry in the Round—Fossil Fuels to Products, Exploring Oil and Natural Gas
Solar Energy in the Round— Energy From the Sun
Transportation Fuels in the Round—Transportation guides
Uranium in the Round— Nuclear guides
©2024 The NEED Project School Energy Managers Teacher Guide www.NEED.org 21 The NEED Energy www.NEED.org ©2023 The NEED Project School Energy Managers Teachers Guide www.NEED.org 21
OFF
Baseload Balance TEACHER GUIDE
&Background
Most students don’t give electric power much thought until the power goes out. Electricity plays a giant role in our day-to-day lives. This activity demonstrates how electricity supply is transmitted on the electric grid to consumers. It also encourages students to explore the differences between baseload and peak demand power, and how power companies maintain supply to ensure customers have power as they need it.
Students will be introduced to the economics of electricity generation and supply and be able to see firsthand the financial challenges utilities must overcome to be able to provide the power demanded by consumers at the lowest cost. Figures, costs, and sources used in this activity are roughly based on current industry uses and costs but have been made into round figures for ease of implementation. In this simulation, students assume roles as “loads” or “generation.” Students will progress through several “rounds,” attempting first to balance, and then adding more challenges or components as they progress.
Objectives
Students will be able to differentiate between baseload and peak demand power.
Students will be able to explain the purpose of using a variety of sources to meet base and peak load power demand.
Students will be able to describe the challenges of using certain sources to meet base and peak load power demand.
Students will be able to describe how energy storage can be incorporated into demand management and how it can be beneficial for supporting renewables.
Materials
Scissors
String
Rope
Colored paper
Tape
Individual marker boards with erasers and markers
2Preparation
Baseload Balance Student Infosheet, pages 25-26
Load and Generation Parameters master, page 37
Hang Tag Cards, pages 28-33
Incident Cards, page 34
Cheat Sheet, page 35
Baseload Balance Student Worksheet, page 36
Familiarize yourself with the activity instructions and student background information before facilitating the game with students.
Make a copy of the Cheat Sheet for yourself.
Copy the hang tags and cut them apart. Attach the tags to four colors of paper or color the cards so that the generation, transmission, load, and storage cards are each a different color. Laminate, if desired, for future use.
Make a copy of the Incident Cards. Cut the cards apart and fold on the dotted line. Laminate, if desired, for future use.
Make a copy of the Student Worksheet and Student Infosheet for each student.
Prepare a copy of the Load and Generation Parameters master to project for discussion.
Designate an area of the room to be the Regional Transmission Organization (RTO). On one side of this area will be the generation group, and the other side will be the load group. Each side should have its own marker board, eraser, and marker.
Decide if a student will be the RTO leader, or if the teacher or another adult will assume this role. Having a student assume this position will create a more student-centered activity. Depending on the ability of the students in your group, using a student for this role may require more monitoring and time than if a teacher is in charge.
Instruct all students to read the infosheet prior to the activity.
22 ©2024 The NEED Project School Energy Managers Teacher Guide www.NEED.org
CONTINUED ON NEXT PAGE
Student Roles
Baseload demand – 3 students
Peak load demand – 8 students
Baseload generation – 8 students
Peak load generation – 8 students
Transmission – 3-5 students
RTO – 1-3 students or a teacher
Storage – 1-5 students (optional)
A Vocabulary SPECIFIC TO THE GAME
Baseload
Generation
Load
Transmission
Peak demand
Megawatt
NOTE: If your class size is smaller, you may elect to use “proxy” baseload demand cards and generator cards that are not assigned to students but sit “online” at all times.
Procedure
1. Assign each student a role that corresponds to each hang tag. If your class does not have enough students for each tag, the baseload tags can be tied to the rope because they are always in operation. A list of the roles can also be found above. The transmission roles are best assigned to students who are able to think quickly on their feet and have good math skills. Storage roles can be assigned after playing rounds one and two. If you do not have enough students to fill all required and optional roles, some baseload or storage roles can be “proxies” that are tied online as needed.
2. Allow time for students to research their roles and reread the background information. Students should be familiar with the vocabulary and information on their hang tags, including generating capacity, energy source, and power demand. Depending on the level of your students, you may choose to have them skip the section of the background information that discusses regional transmission organizations and independent system operators.
3. Project the Load and Generation Parameters master for the class. Discuss the relative cost for each source and plant type as well as the suggested reasoning for the cost of each. Explain that the cost figures are whole, round numbers for easy game play, and that realistically, costs are less round and can be more variable, depending on a number of factors. Discuss the Student Worksheet and explain how students should fill in the tables during the simulation. You may elect to have all students complete it during the simulation as they engage in their roles. Or you may choose to have unassigned students complete it and share the data with the class.
4. The activity begins with the transmission students gathering in the Regional Transmission Organization area, each holding onto the rope or string. The student on each end should have plenty of available rope or string onto which the generation students and load students will attach. These students will decide which peak load providers (plants) will be brought online to meet increasing demand as the activity progresses. They will also help the RTO by tabulating the current load or generation on their side of the line. They will display it on their marker board and update it as the activity progresses.
5. In the generation group, the residential baseload, commercial baseload, heavy industry baseload, and all baseload generation students all hold ends of the rope on their respective sides. They will be holding onto the rope during the entire activity because as baseload power or generation, they are providing or using power all the time.
6. At the appropriate time indicated on each hang tag, each load student will join the grid, increasing the load demand. Residential demand comes up (online) at about 7:00 a.m. as people begin to wake. Demand continues to rise as more residential, commercial, and industry come on the grid, pulling electricity or creating another load.
7. The transmission students will need to balance the generation against the load. They will choose the best generation students to come online to balance the load students. The RTO can monitor or assist the transmission group by announcing the time and reminding each load or role when to join. Be sure to pay attention to intermittent renewables, like solar, being online at the same time when the sun may not be up.
©2024 The NEED Project School Energy Managers Teacher Guide www.NEED.org 23
CONTINUED ON NEXT PAGE
8. After going through the activity once (one complete 24-hour period), reset the activity to early morning and run through a second round, balancing the generation against the load, while now using the cheapest available sources to run for the longest amount of time. You may also wish to reassign students to different roles depending on their command of the activity in the first round.
9. Run a third round, resetting as needed and incorporating storage as a new way to manage demand. Select one of the incident cards to set the stage for using storage.
10. Run a fourth round. RTOs usually require generation to be 15 percent above demand. Play the game again, accounting for the prescribed demand plus the additional 15 percent. Hold a class discussion about why this extra generation is required.
Discussion and Research
Roughly what time was the peak demand? When is the least amount of power needed?
Why did we choose our particular sources we did when balancing generation and demand?
How would knowledge of historical data and weather forecasts help in making decisions about which sources to use?
How did storage make the balancing easier/harder? What challenges would there be if using storage types like those in the game? What factors were not addressed in our game play?
What do you think the costs of the various storage types might be? How might that impact their use in tandem with renewable energy?
In addition to hourly changes in demand for electricity, there are seasonal differences in demand. Research these seasonal differences and explore reasons for a greater demand for electricity at different seasons of the year.
It is projected that the number of electric vehicles and hybrid electric vehicles in the U.S. will increase dramatically over the next decade. What impact do you think this will have on the demand for electricity? How might we adjust to any changes in demand?
The Coronavirus Pandemic of 2020 brought many changes. Businesses, industry, and schools closed for a period of time. People worked from home and left home less often. Explore the impact of the pandemic on the demand for electricity. Was there a change in the total demand for electricity? Was there a shift in the time of day that peak demands occurred? Will there be any lasting impacts on the demand for electricity, and how might the electrical generation industry react to any potential changes?
Extension
Ask students to write a persuasive letter in support of a certain type of power plant after playing the game. Letters should include information gleaned about the plant’s advantages and disadvantages, as well as the feasibility for use in generation of electricity at the lowest cost.
24 ©2024 The NEED Project School Energy Managers Teacher Guide www.NEED.org
Generators Storage (optional)
Transmission Loads
Baseload Balance
STUDENT INFOSHEET
Introduction
Four kinds of power plants produce most of the electricity in the United States: coal, natural gas, nuclear, and hydropower. Natural gas produces roughly 40 percent of the electricity we use, while nuclear and coal plants each generate about 19 percent. There are also wind, hydropower, geothermal, waste-to-energy, solar, and petroleum power plants, which together generate about ten percent of the electricity produced in the United States. All of this electricity is transmitted to customers, or loads, via the network of transmission lines we call the grid.
Wind Farms
Utility-scale wind turbines are often grouped together into what is called a wind farm. These turbines convert motion energy in the wind directly into electrical energy or electricity. Wind is among the fastest growing sources for electricity in the U.S. and across the globe. Wind turbines can be located on land or at sea. Wind turbines produce no emissions. Wind can sometimes be intermittent and may not always be available.
Solar Facilities
Solar power can be generated using photovoltaic (PV) arrays, often called solar panels. These facilities can be located in open fields, above parking lots, and on the surface of building structures. Solar power can also be generated by focusing the sun’s light on a reflective surface that reflects back onto a container storing fluid or molten materials. This material is then used to create steam to turn a turbine. In these instances, Concentrating Solar Power (CSP) is also considered a thermal power plant. CSP and PV technologies combine to make solar one of the fastest growing sources for electricity across the globe.
Fossil Fuel Power Plants
Fossil fuel plants burn coal, natural gas, or petroleum to produce electricity. These energy sources are called fossil fuels because they were formed from the remains of ancient sea plants and animals. Most of our electricity comes from fossil fuel plants in the form of coal and natural gas.
Power plants burn the fossil fuels and use the heat to boil water into steam. The steam is channeled through a pipe at high pressure to spin a turbine generator to make electricity. Fossil fuel power plants produce emissions and contribute to global climate change. The amount and type of emissions can vary based upon the type of fossil fuel and technologies used within the plant. Fossil fuel plants are sometimes called thermal power plants because they use heat energy to make electricity.
Nuclear Power Plants
Nuclear power plants are called thermal power plants, too. They produce electricity in much the same way as fossil fuel plants, except that the fuel they use is uranium, which isn’t burned. Uranium is
a mineral found in rocks underground. Uranium atoms are split to make smaller atoms in a process called fission that produces enormous amounts of thermal energy. The thermal energy is used to turn water into steam, which drives a turbine generator. Nuclear power plants do not produce carbon dioxide emissions, but their waste is radioactive. Nuclear waste must be stored carefully to prevent contamination of people and the environment.
Hydropower Plants
Hydropower plants use the energy in moving water to generate electricity. Fast-moving water is used to spin the blades of a turbine generator. Hydropower is called a renewable energy source because it is renewed by rainfall.
Waste-to-Energy (Biomass) Plants
Waste-to-energy facilities are thermal power plants that burn garbage and other waste to produce electricity. The heat from the incinerator creates steam in a boiler that drives a turbine generator. Facilities monitor and scrub their emissions and recycle ash to be environmentally friendly.
Cost of Electricity
The cost for generating electricity depends on several factors.
Fuel Cost
The major cost of generating electricity is the cost of the fuel. There are also other factors that tie into the cost of a fuel, including production cost, manufacturing or refining costs, cost of transporting the fuel, and more.
Building Cost
Another factor is the cost of building the power plant itself. A plant may be very expensive to build, but the low cost of the fuel can make the electricity economical to produce. Nuclear power plants, for example, are very expensive to build, but their fuel—uranium—is inexpensive.
Combined Cycle vs. Simple Cycle
In the most simple of thermal power plants, a fuel is burned and water is heated to form high-pressure steam. That steam is used to turn a single turbine. Thermal power plants running in this manner are about 35 percent efficient, meaning 35 percent of the energy in the fuel is actually transformed into useable electrical energy. The other 65 percent is “lost” to the surrounding environment as thermal energy.
Combined cycle power plants add a second turbine in the cycle, increasing the efficiency of the power plant to as much as 60 percent. By doing this, some of the energy that was being wasted to the environment is now being used to generate useful electricity.
©2024 The NEED Project School Energy Managers Teacher Guide www.NEED.org 25
Efficiency
When figuring cost, you must also consider a plant’s efficiency. Efficiency is the amount of useful energy you get out of a system. A totally efficient machine would change all the energy put in it into useful work. Changing one form of energy into another always involves a loss of usable energy. Efficiency of a power plant does not take into account the energy lost in production or transportation, only the energy lost in the generation of electricity.
In general, today’s power plants use three units of fuel to produce one unit of electricity. Most of the lost energy is waste heat. You can see this waste heat in the great clouds of steam pouring out of giant cooling towers on some power plants. For example, a typical coal plant burns about 4,500 tons of coal each day. The chemical energy in about two-thirds of the coal (3,000 tons) is lost as it is converted first to thermal energy, and then to motion energy, and finally into electrical energy. This degree of efficiency is mirrored in most types of power plants. Thermal power plants typically have between a 3040% efficiency rating. Wind is usually around the same range, with solar often falling below the 30% mark. The most efficient plant is a hydropower plant, which can operate with an efficiency of up to 95%.
Meeting Demand
We don’t use electricity at the same rate at all times during the day. There is a certain amount of power that we need all the time called baseload power. It is the minimum amount of electricity that is needed 24 hours a day, 7 days a week, and is provided by a power company. However, during the day at different times, and depending on the weather, the amount of power that we use increases by different amounts. We use more power during the week than on the weekends for offices and schools. We use more electricity during the summer than the winter because we need to keep our buildings cool. An increase in demand during specific times of the day or year is called peak demand. This peak demand represents the additional power above baseload power that a power company must be able to produce when needed.
Power plants can be used to meet baseload power, or peak demand, or both. Some power plants require a lot of time to be brought online — operating and producing power at full capacity. Others can be brought online and shut down fairly quickly.
Coal and nuclear power plants are slow, requiring 24 hours or more to reach full generating capacity, so they are used for baseload power generation. Natural gas is increasing in use for baseload generation because it is widely available, low in cost, can quickly reach full generating capacity, and is a cleaner-burning fuel.
Wind, hydropower, and solar can all be used to meet baseload capacity when the energy source is available. Wind is often best at night and drops down in its production just as the sun is rising. Offshore wind is more consistent. Solar power is not available at night, and is greatly diminished on cloudy days. Hydropower can produce electricity as long as there is enough water flow, which can be decreased in times of drought.
To meet peak demand, energy sources other than coal and uranium must be used. Natural gas is a good nonrenewable source to meet peak demand because it requires only 30 minutes to go from total shutdown to full capacity. Many hydropower stations have additional capacity using pumped storage. Some electricity is used to pump water into a storage tank or reservoir, where it can be released at a
later time to generate additional electricity as needed. Pumped storage hydropower can be brought fully online in as little as five minutes.
Some power plants, because of regulations or agreements with utilities, suppliers, etc., do not run at full capacity or year-round. These power plants may produce as little as 50 percent of maximum generating capacity but can increase their output if demand rises, supply from another source is suddenly reduced, or an emergency occurs.
Making Decisions
Someone needs to decide when, which, and how many additional generating locations need to be brought online when demand for electricity increases. This is the job of the Regional Transmission Organization (RTO) or Independent System Organization (ISO). RTOs and ISOs work together with generation facilities and transmission systems across many locations, matching generation to the load immediately so that supply and demand for electricity are balanced. The grid operators predict load and schedule generation to make sure that enough generation and backup power are available in case demand rises or a power plant or power line is lost.
Transmission Organizations
Besides making decisions about generation, RTOs and ISOs also manage markets for wholesale electricity. Participants can buy and sell electricity from a day early to immediately, as needed. These markets give electricity suppliers more options for meeting consumer needs for power at the lowest possible cost.
Several RTOs operate bulk electric power systems across much of North America. More than half of the electricity produced is managed by RTOs, with the rest under the jurisdiction of individual utilities or utility holding companies.
In the 1990s, the Federal Energy Regulatory Commission introduced a policy designed to increase competitive generation by requiring open access to transmission. Northeastern RTOs developed out of coordinated utility operations already in place. RTOs in other locations grew to meet new policies providing for open transmission access. Members of RTOs include the following: independent power generators; transmission companies; load-serving entities; integrated utilities that combine generation, transmission, and distribution functions; and other entities such as power marketers and energy traders.
RTOs monitor power supply, demand, and other factors such as weather and historical data. This information is input into complex software that optimizes for the best combination of generation and load. They then post large amounts of price data for thousands of locations on the system at time intervals as short as five minutes.
The Continental U.S. Electric Grid
26 ©2024 The NEED Project School Energy Managers Teacher Guide www.NEED.org
Baseload Balance LOAD AND GENERATION PARAMETERS
©2024 The NEED Project School Energy Managers Teacher Guide www.NEED.org 27 Fuel Capacity Type of Generation Time Required for Full Capacity Cost per Megawatt-hour Coal 40 MW Baseload 24 hours $50 Nuclear (Uranium) 50 MW Baseload 24 hours + $30 Natural Gas Combined Cycle (CC) 15-20 MW Baseload 30 minutes + $30-$40 Wind 5 MW Baseload Immediate when wind speed is sufficient; primarily at night or offshore $40 Solar 5 MW Baseload Immediate when solar intensity is sufficient; only during day $40 Hydropower 5 MW Baseload 5 minutes $30 Waste-to-Energy (Biomass) 10 MW Baseload 5 minutes $60 Hydropower 5-10 MW each site Peak load 5 minutes $50-90 Natural Gas Simple Cycle (SC) 5-10 MW each site Peak load 5 minutes $90-$600
Consumer Capacity Type Heavy Industry 60 MW Baseload Commercial 20 MW Baseload Residential 35 MW Baseload Residential 5-10 MW Peak Load Commercial 5-10 MW Peak Load Light Industry 5 MW Peak Load Generation Load
Baseload Balance Hang Tag Cards
28 ©2024 The NEED Project School Energy Managers Teacher Guide www.NEED.org
Generation Baseload Nuclear 50 MW $30 / MW-hour Generation Baseload Coal 40 MW $50 / MW-hour Generation Baseload Natural Gas CC 20 MW $30 / MW-hour Generation Baseload Hydro 5 MW $30 / MW-hour Generation Baseload Wind 5 MW $40 / MW-hour Generation Baseload Solar 5 MW $40 / MW-hour
Generation
Generation
Generation
Generation
Generation
Generation
©2024 The NEED Project School Energy Managers Teacher Guide www.NEED.org 29
Baseload
10 MW
Waste-to-Energy (Biomass)
MW-hour
$60 /
Natural Gas CC 15 MW
Baseload
$40 / MW-hour
Peak Load Natural Gas SC 10 MW
/ MW-hour Time to Full Capacity: 5 mins
$90
Peak Load Natural Gas SC 5 MW $90 / MW-hour Time to Full Capacity: 5 mins
Peak Load Natural Gas SC 10 MW $150 / MW-hour Time to Full Capacity: 5 mins
Peak Load Natural Gas SC 5 MW $200 / MW-hour Time to Full Capacity: 5 mins
Generation
Generation
Generation
Transmission Transmission
30 ©2024 The NEED Project School Energy Managers Teacher Guide www.NEED.org
Peak Load Natural Gas SC 5 MW $250 / MW-hour Time to Full Capacity: 5 mins
Peak Load Hydro 5 MW $50 / MW-hour Time to Full Capacity: 5 mins
Generation
Peak Load Hydro 10 MW $70 / MW-hour Time to Full Capacity: 5 mins
Peak Load Hydro 10 MW $90 / MW-hour Time to Full Capacity: 5 mins


©2024 The NEED Project School Energy Managers Teacher Guide www.NEED.org 31 Load Commercial 20 MW Baseload Load Heavy Industry 60 MW Baseload Load Residential 35 MW Baseload Load Residential 5 MW 7:00 am – 12:00 am Load Residential 10 MW 8:00 am – 11:00 pm Load Commercial 10 MW 9:00 am –9:00 pm


32 ©2024 The NEED Project School Energy Managers Teacher Guide www.NEED.org Load Commercial 5 MW 5:00 pm – 11:00 pm Load Light Industry 5 MW 8:00 am – 9:00 pm Load Light Industry 5 MW 9:00 am – 8:00 pm Load Residential 10 MW 3:00 pm – 1:00 am Load Light Industry 5 MW 10:00 am – 8:00 pm
Organization
Regional Transmission

©2024 The NEED Project School Energy Managers Teacher Guide www.NEED.org 33
Compressed Air 10 MW Storage Pumped Storage Hydro 20 MW maximum online 10 hours
Flywheel 5 MW maximum online 5 minutes Storage Solar Thermal 10 MW
Battery Storage 20 MW maximum online 4 hours
Storage
Storage
Storage
Baseload Balance
INCIDENT CARDS
INCIDENT
At 3:00 p.m. heavy cloud cover moves over the region, taking out your solar generation. If you can’t provide enough power to meet the load, RTO must choose who will lose power and be in blackout. How could a blackout have been avoided?
INCIDENT
At 2:00 p.m. a baseload coal unit trips, and you lose 10 MWs of baseload coal. If you can’t provide enough power to meet the load, RTO must choose who will lose power and be in blackout. How could a blackout have been avoided?
INCIDENT
At 5:00 p.m. a derecho hits, damaging power lines. You lose half your commercial and residential load. You must balance your load with generation. Could this have been predicted?
34 ©2024 The NEED Project School Energy Managers Teacher Guide www.NEED.org
Baseload Balance
TEACHER
CHEAT SHEET
7:00 AM-12:00 AM 5 MW RESIDENTIAL
AM-9:00
9:00 AM-9:00 PM 10 MW COMMERCIAL
10:00 AM-8:00 PM 5 MW LIGHT INDUSTRIAL
3:00 PM-1:00 AM 10 MW RESIDENTIAL
5:00 PM-11:00 PM 5 MW COMMERCIAL
PM 10 MW
10:00 AM-8:00 PM 5 MW
3:00 PM-1:00 AM 10 MW
5:00 PM-11:00 PM 5 MW
GAS BASELOAD
HYDROPOWER BASELOAD 5 MW $30/MW
SOLAR BASELOAD 5 MW $40/MW
WIND BASELOAD 5 MW $40/MW
NATURAL GAS BASELOAD 15 MW $40/MW
WASTE-TO-ENERGY BASELOAD 10 MW $60/MW
NATURAL GAS SIMPLE CYCLE 5 MW $250/MW 30 MIN
NATURAL GAS SIMPLE CYCLE 10 MW $90/MW 30 MIN
NATURAL GAS SIMPLE CYCLE 5 MW $90/MW 30 MIN
NATURAL GAS SIMPLE CYCLE 10 MW $150/MW 30 MIN
NATURAL GAS SIMPLE CYCLE 5 MW $200/MW 30 MIN
HYDROPOWER PEAK 10 MW $70/MW 5 MIN
HYDROPOWER PEAK 5 MW $50/MW 5 MIN
HYDROPOWER PEAK 10 MW $90/MW 5 MIN
©2024 The NEED Project School Energy Managers Teacher Guide www.NEED.org 35
BASELOAD DEMAND RESIDENTIAL 35 MW HEAVY INDUSTRIAL 60 MW COMMERCIAL 20 MW TOTAL 115 MW STORAGE OPTIONS COMPRESSED AIR 10 MW PUMPED STORAGE HYDRO 20 MW FLYWHEEL 5 MW SOLAR THERMAL 10 MW BATTERY 20 MW HANG TAGS 3 BASELOAD DEMAND 8 PEAK LOAD DEMAND 8 BASELOAD GENERATION 8 PEAK LOAD GENERATION 2 TO 5 TRANSMISSION 1 TO 3 RTO (REGIONAL TRANSMISSION ORGANIZATION) 30 TO 35 TOTAL GOING OFFLINE 8:00 PM LOSE 10 MW (2 TAGS) 9:00 PM LOSE 15 MW (2 TAGS) 11:00 PM LOSE 15 MW (2 TAGS) 12:00 AM LOSE 5 MW (1 TAG) 1:00 AM LOSE 10 MW (1 TAG) BASELOAD DEMAND PEAK COMING ONLINE 7:00 AM-12:00 AM 5 MW 8:00 AM-9:00 PM 5 MW 8:00 AM-11:00 PM 10 MW 9:00 AM-8:00 PM 5 MW 9:00 AM-9:00
PEAK DEMAND
INDUSTRIAL
8:00
PM 5 MW LIGHT
8:00 AM-11:00 PM 10 MW RESIDENTIAL 9:00 AM-8:00 PM 5 MW LIGHT INDUSTRIAL
TOTAL ONLINE +15% 115 MW 132 120 MW 138 125 MW 144 135 MW 155 140 MW 161 150 MW 173 155 MW 178 165 MW 190 170 MW 196 160 MW 184 145 MW 167 130 MW 150 125 MW 144 115 MW 132 pumped storage max 10 hours availability flywheel max 5 minute availability battery storage max 4 hours availability AVAILABLE GENERATION TIME TIME BASELOAD GENERATION ONLINE OFFLINE COAL BASELOAD 40 MW $50/MW NATURAL
20
MW $30/MW NUCLEAR BASELOAD 50 MW $30/MW
TIME TIME PEAK GENERATION ONLINE OFFLINE
Baseload Balance STUDENT WORKSHEET
In the box to the right, calculate the total baseload demand. In the column labeled TOTAL ONLINE, calculate the total demand for each hour of operation.
In the column labeled +15%, calculate the total demand required for an additional 15% demand.
BASELOAD PEAK COMING ONLINE DEMAND
7:00 AM-12:00 AM 5 MW
8:00 AM-9:00 PM 5 MW
8:00 AM-11:00 PM 10 MW
9:00 AM-8:00 PM 5 MW
9:00 AM-9:00 PM 10 MW
10:00 AM-8:00 PM 5 MW
3:00 PM-1:00 AM 10 MW
5:00 PM-11:00 PM 5 MW
BASELOAD DEMAND
RESIDENTIAL 35 MW
HEAVY INDUSTRIAL 60 MW COMMERCIAL 20 MW TOTAL
BASELOAD GENERATION
In the columns below, record the time that generation sources come online and go offline.
COAL BASELOAD 40 MW $50/MW
NATURAL GAS BASELOAD 20 MW $30/MW
NUCLEAR BASELOAD 50 MW $30/MW
HYDROPOWER BASELOAD 5 MW $30/MW
SOLAR BASELOAD 5 MW $40/MW
WIND BASELOAD 5 MW $40/MW
NATURAL GAS BASELOAD 15 MW $40/MW WASTE-TO-ENERGY BASELOAD 10 MW $60/MW
PEAK GENERATION
NATURAL GAS SIMPLE CYCLE 5 MW $250/MW 30 MIN
NATURAL GAS SIMPLE CYCLE 10 MW $90/MW 30 MIN
8:00 PM LOSE 10 MW (2 TAGS)
9:00 PM LOSE 15 MW (2 TAGS)
11:00 PM LOSE 15 MW (2 TAGS)
12:00 AM LOSE 5 MW (1 TAG)
1:00 AM LOSE 10 MW (1 TAG)
STORAGE OPTIONS COMPRESSED AIR 10 MW
PUMPED STORAGE HYDRO 20 MW FLYWHEEL 5 MW
SOLAR THERMAL 10 MW
BATTERY 20 MW GOING OFFLINE
pumped storage max 10 hours availability flywheel max 5 minute availability battery storage max 4 hours availability
NATURAL GAS SIMPLE CYCLE 5 MW $90/MW 30 MIN
NATURAL GAS SIMPLE CYCLE 10 MW $150/MW 30 MIN
NATURAL GAS SIMPLE CYCLE 5 MW $200/MW 30 MIN
HYDROPOWER PEAK 10 MW $70/MW 5 MIN
HYDROPOWER PEAK 5 MW $50/MW 5 MIN
HYDROPOWER PEAK 10 MW $90/MW 5 MIN
36 ©2024 The NEED Project School Energy Managers Teacher Guide www.NEED.org
TOTAL
TOTAL
ONLINE +15%
TIME TIME
ONLINE OFFLINE
TIME TIME
OFFLINE
ONLINE
Plug Loads Spreadsheet
A sample spreadsheet, with all of the calculations for several examples, is available for download at https:the-need-project.myshopify.com/ products/plug-loads. You may choose to distribute it to students for them to use, or you may want it for yourself for reference. To differentiate this lesson, you can make a list of your expectations on one tab of a spreadsheet file, then have varying levels of the spreadsheet built for your students according to their ability level. Capable students could be given a blank tab, moderately capable students can be given the first few rows of a spreadsheet, and the least capable students could be given the sample spreadsheet to use to input their data.
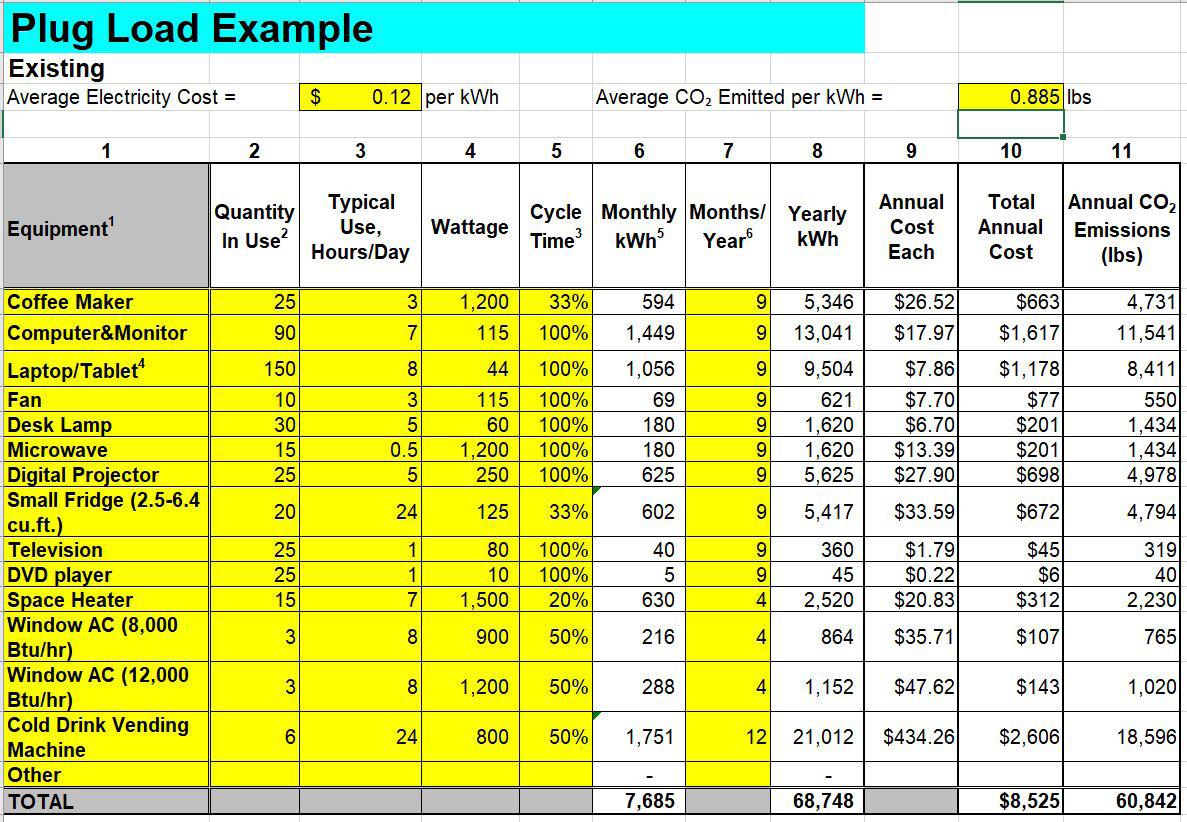
Sample Spreadsheet Description
Columns 1-5 contain areas for students to input description, number, cycle time, and wattage of the devices. The wattage can be taken from the UL label on the device if the Kill A Watt® meter cannot be used.
The non-shaded columns contain formulas that will make those calculations automatically as students add numbers to the other columns.
If students need more space, select a row, right click, and choose “insert.” Repeat for the number of rows needed. The formatting and formulas will copy down from the previous row.
If you decide to have students calculate carbon dioxide emissions, add another column. The 2022 average emissions is 0.885 pounds of CO2 per kilowatt-hour used.
©2024 The NEED Project School Energy Managers Teacher Guide www.NEED.org 37
e Forms of Energy
All forms of energy fall under two categories:

POTENTIAL
Stored energy and the energy of position (gravitational).
CHEMICAL ENERGY is the energy stored in the bonds between atoms in molecules. Gasoline and a piece of pizza are examples.
NUCLEAR ENERGY is the energy stored in the nucleus or center of an atom – the energy that holds the nucleus together. The energy in the nucleus of a plutonium atom is an example.
ELASTIC ENERGY is energy stored in objects by the application of force. Compressed springs and stretched rubber bands are examples.
GRAVITATIONAL POTENTIAL
ENERGY is the energy of place or position. A child at the top of a slide is an example.
KINETIC
The motion of waves, electrons, atoms, molecules, and substances.
RADIANT ENERGY is electromagnetic energy that travels in transverse waves. Light and x-rays are examples.
THERMAL ENERGY or heat is the internal energy in substances – the vibration or movement of atoms and molecules in substances. The heat from a fire is an example.
MOTION ENERGY is the energy of the movement of a substance from one place to another. Wind and moving water are examples.
SOUND ENERGY is the movement of energy through substances in longitudinal waves. Echoes and music are examples.
ELECTRICAL ENERGY is the movement of electrons. Lightning and electricity are examples.
38 ©2024 The NEED Project School Energy Managers Teacher Guide www.NEED.org
Data: Energy Information Administration
**Total does not add up to 100% due to independent rounding.
Uses:
©2024 The NEED Project School Energy Managers Teacher Guide www.NEED.org 39
BIOMASS 5.10%
heating, electricity,
COAL 10.40%
GEOTHERMAL 0.13%
heating, electricity HYDROPOWER 0.94% Uses: electricity PETROLEUM 37.29%
Uses:
transportation
Uses: manufacturingelectricity,
Uses:
transportation, manufacturingincludes propane PROPANE
heating,
URANIUM 8.50%
electricity WIND 1.57% Uses: electricity SOLAR 0.80% Uses: heating, electricity RENEWABLE NONRENEWABLE U.S. Energy Consumption by Source, 2022 NATURAL GAS 35.28%
heating,
includes propane
Uses:
manufacturing
Uses:
Uses:
manufacturing, electricity
*Propane consumption is included in petroleum and natural gas totals.
Anemometer
An anemometer measures the speed of moving air, most often wind speed. You will be using it to calculate the speed of air moving through a vent.
Operating Instructions
1. Turn the anemometer on by depressing and holding the “mode” button. The device should power up in a few seconds.
2. To change the units for measuring wind speed, depress and hold the “mode” button until the speed unit flashes.
3. Depress “set” to get the desired wind speed unit.
4. To change from ºC to ºF or vice -versa, remove the yellow cover from the device, turn it over, and use a push-pin or straightened paper clip to depress the “C/F” button on the back.
5. The device will also show the Beaufort Scale for the wind speed, as a series of pointed blocks stacking upon each other.
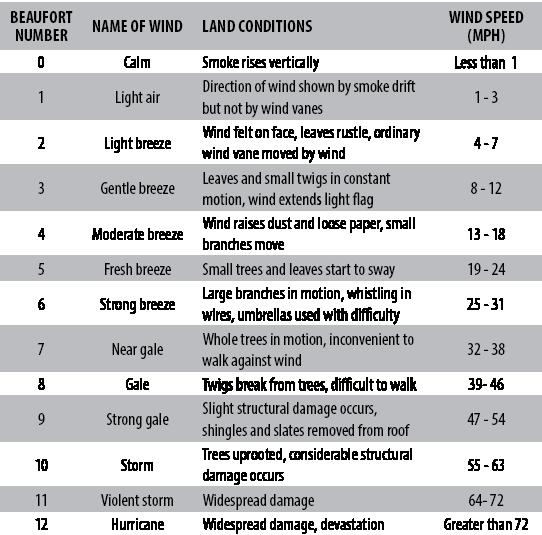
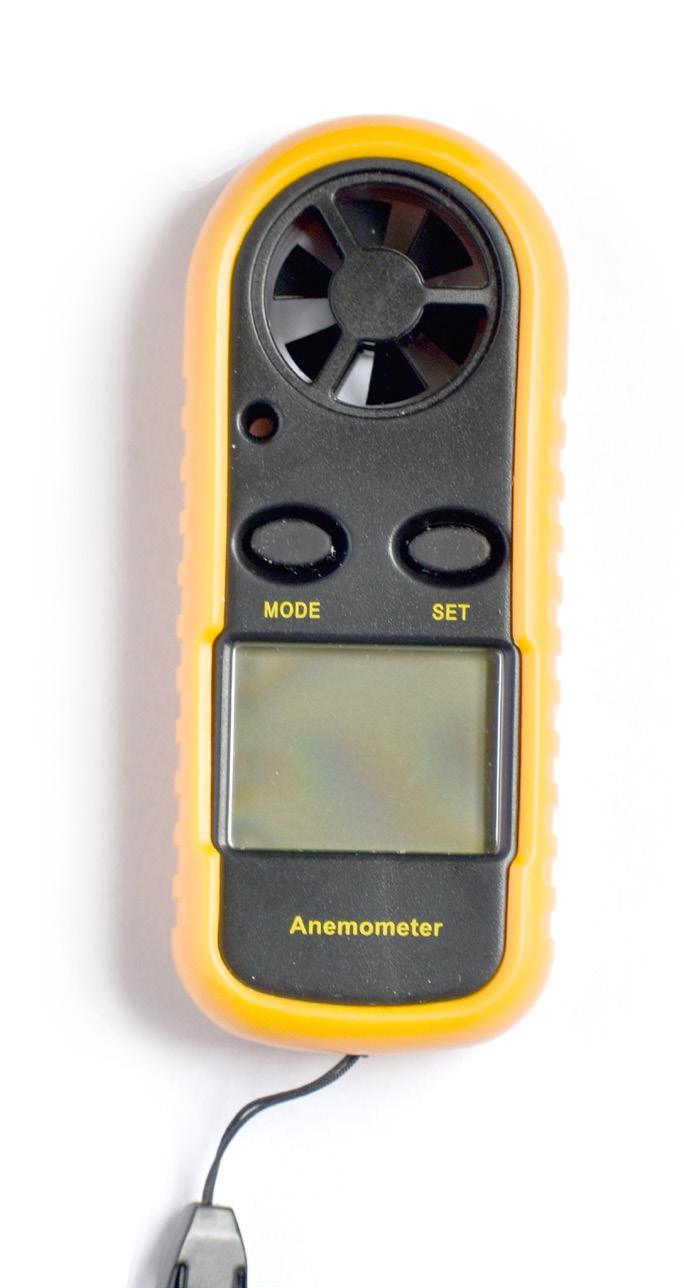
What is the Beaufort Scale?
In 1805, Sir Francis Beaufort of the Royal Navy developed the scale to help sailors estimate wind speed for settings sails based on visible effects of winds. The scale describes wind effects seen on land or at sea and assigns a value of 0 to 12 according to the force applied by the wind. The higher the number, the stronger (faster) the wind.
40 ©2024 The NEED Project School Energy Managers Teacher Guide www.NEED.org
Source: NOAA
Portrait by Stephen Pearce of Sir Francis Beaufort; c. 1855-1856, oil painiting
Kill A Watt® Meter
The Kill A Watt® meter allows users to measure and monitor the power consumption of any standard electrical device. You can obtain instantaneous readings of voltage (volts), current (amps), line frequency (Hz), and electric power being used (watts). You can also obtain the actual amount of power consumed in kilowatthours (kWh) by any electrical device over a period of time from one minute to 9,999 hours. A kilowatt is 1,000 watts.
Operating Instructions
1. Plug the Kill A Watt® meter into any standard grounded outlet or extension cord.
2. Plug the electrical device or appliance to be tested into the AC Power Outlet Receptacle of the Kill A Watt® meter.
3. The LCD displays all meter readings. The unit will begin to accumulate data and powered duration time as soon as the power is applied.
4. Press the Volt button to display the voltage (volts) reading.
5. Press the Amp button to display the current (amps) reading.
6. The Watt and VA button is a toggle function key. Press the button once to display the Watt reading; press the button again to display the VA (volts x amps) reading. The Watt reading, not the VA reading, is the value used to calculate kWh consumption.
7. The Hz and PF button is a toggle function key. Press the button once to display the Frequency (Hz) reading; press the button again to display the Power Factor (PF) reading.
8. The KWH and Hour button is a toggle function key. Press the button once to display the cumulative energy consumption. Press the button again to display the cumulative time elapsed since power was applied.
What is Power Factor?
The formula Volts x Amps = Watts is used to find the energy consumption of an electrical device. Many AC devices, however, such as motors and magnetic ballasts, do not use all of the power provided to them. The Power Factor (PF) has a value equal to or less than one, and is used to account for this phenomenon. To determine the actual power consumed by an AC device, the following formula is used:
Volts x Amps x PF = Watts Consumed

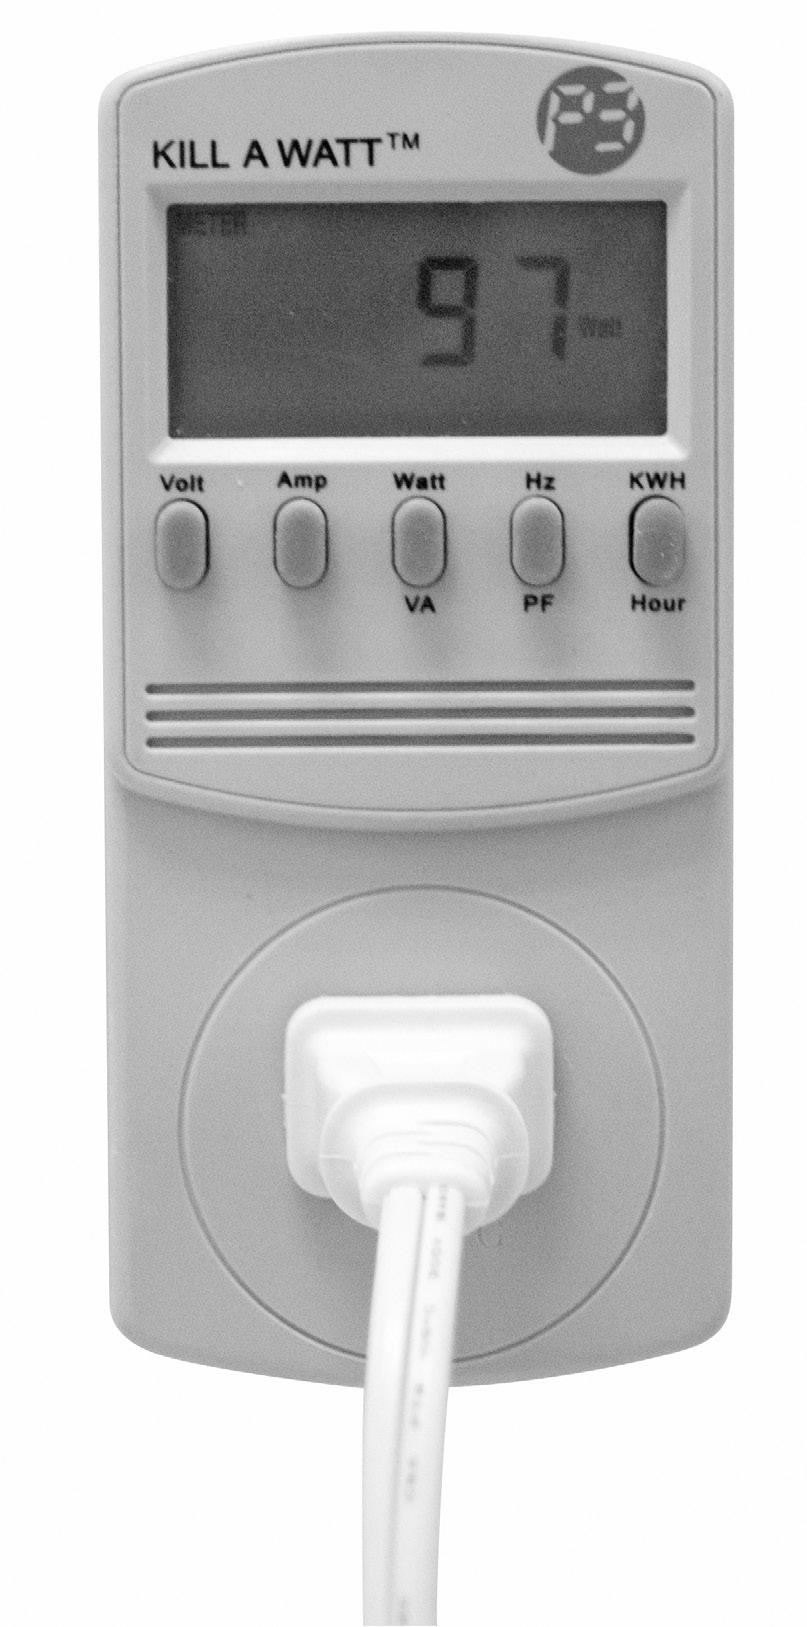
©2024 The NEED Project School Energy Managers Teacher Guide www.NEED.org 41
Interpreting an EnergyGuide Label
Big appliances—like refrigerators and dishwashers—use a lot of energy in homes, schools, and businesses. Some appliances cost more than others to buy. Some appliances use more energy than others. Usually, the more expensive models use less energy than the cheaper ones.
All appliances must have an EnergyGuide label that tells shoppers how much energy it uses. This way, people can compare the life cycle cost of the appliances, as well as the purchase price. The life cycle cost of an appliance is the purchase price plus the energy cost over the life of the appliance. An energy-saving refrigerator might cost more to buy, but it would use a lot less energy than a cheaper model.
Law requires EnergyGuide labels on all new refrigerators, freezers, water heaters, dishwashers, clothes washers, air conditioners, and furnaces. EnergyGuide labels list the manufacturer, the model, the capacity, the features, the amount of energy the appliance will use a year, its comparison with similar models, and the estimated yearly energy cost.
List of key features of the
and similar models in the same
The maker and model tell exactly what product the label is describing.
What you might pay to run the appliance for a year, based on its fuel or electricity consumption and the national average cost of the energy.
An estimate of the annual electricity consumption and cost if using natural gas to heat water, rather than electricity.
The cost range helps you compare the energy use of different models by showing the range of operating costs for similar models and features.

If you see the ENERGYSTAR logo, it means the product is better for the environment because it uses less energy than standard models.
42 ©2024 The NEED Project School Energy Managers Teacher Guide www.NEED.org ftc.gov/energy Cost Range of Similar Models Estimated Yearly Energy Cost (when used with an electric water heater) Your cost will depend on your utility rates and use. Cost range based only on standard capacity models. Estimated operating cost based on six wash loads a week and a national average electricity cost of 12 cents per kWh and natural gas cost of $1.09 per therm. l $7 Estimated Yearly Energy Cost (when used with a natural gas water heater) 102 kWh Estimated Yearly Electricity Use $10 $71 $12 Compare ONLY to other labels with yellow numbers. Labels with yellow numbers are based on the same test procedures. Federal law prohibits removal of this label before consumer purchase. U.S. Government Clothes Washer Capacity Class: Standard LG Electronics Models WM2350H*C Capacity (tub volume): 4 cubic feet
cost range.
appliance
The Light Meter
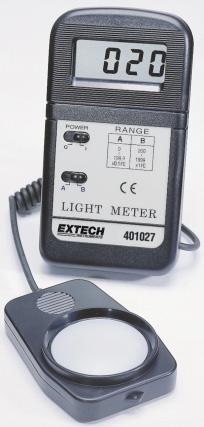
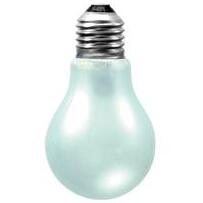
Operating Instructions
1. Insert the battery into the battery compartment in the back of the meter.
2. Slide the ON/OFF Switch to the ON position.
3. Slide the Range Switch to the B position.
4. On the back of the meter, pull out the meter’s tilt stand and place the meter on a flat surface in the area you plan to measure.
5. Hold the Light Sensor so that the white lens faces the light source to be measured or place the Light Sensor on a flat surface facing the direction of the light source. Make sure to hold or stand back from the meter to avoid any shadow on the light sensor.
6. Read the measurement on the LCD Display.
7. If the reading is less than 200 fc, slide the Range Switch to the A position and measure again.
Light Output or Luminous Flux
A lumen (lm) is a measure of the light output (or luminous flux) of a light source (bulb or tube). Light sources are labeled with output ratings in lumens. A T12 40-watt fluorescent tube light, for example, may have a rating of 3050 lumens.
Light Level or Illuminance
A foot-candle (fc) is a measure of the quantity of light (illuminance) that actually reaches the workplane on which the light meter is placed. Foot-candles are workplane lumens per square foot. The light meter can measure the quantity of light from 0 to 1000 fc.
Brightness or Luminance
Another measure of light is its brightness or luminance. Brightness is a measure of the light that is reflected from a surface in a particular direction. Brightness is measured in footlamberts (fL).
©2024 The NEED Project School Energy Managers Teacher Guide www.NEED.org 43
LCD Display ON/OFF Switch Range Switch Light Sensor
Digital Thermometer
A digital thermometer measures the temperature of a substance and displays the temperature reading on its face. It has a battery for power. Sometimes they are waterproof for measuring the temperature of a liquid.
This digital thermometer can measure the temperature in Fahrenheit or Celsius. It shows the temperature range of the thermometer. It can read temperatures from -40° to 392°F and -40° to 200°C.
It has three buttons. The button on the bottom left is the ON/ OFF switch. If the thermometer is not used for a few minutes, it turns itself off.
The C/F button on the bottom right switches from the Celsius scale to the Fahrenheit scale. The face of the thermometer will show a C or an F to indicate which scale is being used.
The mode button on the top holds the temperature reading when it is pushed. If you need the exact temperature of a liquid, you push the hold button while the thermometer is in the liquid, then remove the thermometer to read it. This button will also allow you to view the maximum and minimum temperatures measured when pushed two or three times.
The metal stem of the thermometer can measure the temperature of the air or the temperature of a liquid. The stem should be placed about halfway into a liquid to measure the temperature.
44 ©2024 The NEED Project School Energy Managers Teacher Guide www.NEED.org
Hygrometer
HUMIDITY/TEMPERATURE
PEN
Scientists measure the amount of water vapor in the air in terms of relative humidity—the amount of water vapor in the air relative to (compared to) the maximum amount it can hold at that temperature. Relative humidity changes as air temperature changes. The warmer the air is, the more water vapor it can hold.
Air acts like a sponge and absorbs water through the process of evaporation. Warm air is less dense and the molecules are further apart, allowing more moisture between them. Cooler air causes the air molecules to draw closer together, limiting the amount of water the air can hold.
It is important to control humidity in occupied spaces. Humidity levels that are too high can contribute to the growth and spread of unhealthy biological pollutants. This can lead to a variety of health effects, from common allergic reactions to asthma attacks and other health problems. Humidity levels that are too low can contribute to irritated mucous membranes, dry eyes, and sinus discomfort.
This digital humidity/temperature pen measures relative humidity and temperature and displays the readings on its face. It has a battery for power. It can display the temperature in Fahrenheit or Celsius. The reading shown on the right is 68.5°F. Devices that measure humidity are also called hygrometers.
The hygrometer displays relative humidity in terms of percentage. The hygrometer shown reads 35%. This means that the air contains 35 percent of the water vapor it can hold at the given air temperature. When the air contains a lot of water vapor, the weather is described as humid. If the air cannot carry any more water vapor, the humidity is 100 percent. At this point, the water vapor condenses into liquid water. Maintaining relative humidity between 40 and 60 percent helps control mold. Maintaining relative humidity levels within recommended ranges is a way of ensuring that a building’s occupants are both comfortable and healthy. High humidity is uncomfortable for many people. It is difficult for the body to cool down in high humidity because sweat cannot evaporate into the air.

Directions
ON/OFF KEY
Press the ON/OFF key to turn the power on or off.
°F/°C
Press the °F/°C key to select the temperature unit you want to use, Fahrenheit or Celsius.
MAX/MIN
Press the MAX/MIN key once to display the stored maximum readings for temperature and humidity.
An up arrow will appear on the left side of the display to indicate the unit is in the maximum recording mode.
Press the MAX/MIN key a second time to display the stored minimum readings for temperature and humidity. A down arrow will appear on the left side of the display to indicate the unit is in the minimum recording mode.
Press the MAX/MIN key a third time to return to normal operation.
CLEAR
If an up or down arrow is displayed, press the CLEAR key until - - - appears on the display. The memory is cleared. New maximum or minimum values will be recorded within 3 seconds.
©2024 The NEED Project School Energy Managers Teacher Guide www.NEED.org 45
OFF
ENERGY EFFICIENCY
BINGO
A. Can name two ways to increase a car’s MPG
E. Knows the definition of energy efficiency
I. Knows a type of bulb that uses one-quarter of the energy of incandescents
M. Sets this item differently at day and night and for the season
B. Can name three ways to save energy at home
F. Knows the definition of energy conservation
J. Knows where to find an EnergyGuide label
N. Knows the number one use of energy in the home
C. Can name three ways to save energy at school
G. Knows what an ENERGY STAR® label means
K. Can name one appliance that should be run only when fully loaded
O. Has an energy conservation team at school
D. Has at least one ENERGY STAR® appliance at home
H. Knows what SEER is
L. Uses day lighting in the classroom instead of overhead lights
P. Knows whether energy is the first, second, or third highest expenditure in a school district (choose one)
46 ©2024 The NEED Project School Energy Managers Teacher Guide www.NEED.org
NAME NAME NAME NAME NAME NAME NAME NAME NAME NAME NAME NAME NAME NAME NAME NAME A E I M B F J N C G K O D H L P
I have kilowatt-hour.
Who has a light bulb that produces more heat than light?
I have an incandescent.
Who has energy is neither created nor destroyed?
I have the Law of Conservation of Energy.
Who has the number one use of energy in the home?
I have heating and cooling.
I have landscaping.
Who has the most effective way for consumers to reduce the amount of energy used by industry?
I have reduce, reuse, repair, recycle.
Who has any behavior that results in using less energy?
I have conservation.
Who has the length of time you use an energy efficient appliance before you begin to save money?
Who has the label designating energy efficient home appliances? I have payback period.
Who has the nation’s leading recycled product?
I have ENERGY STAR ®.
Who has a way to reduce energy use by planting trees to block wind and provide shade?
I have steel.
Who has a material that resists the flow of heat?
©2024 The NEED Project School Energy Managers Teacher Guide www.NEED.org 47
I have insulation.
Who has a way to use gasoline more efficiently?
I have keep tires properly inflated.
Who has solar, hydropower, geothermal, biomass, and wind?
I have renewables.
Who has a light bulb that uses less than one-fourth the energy of an old-fashioned, incandescent bulb?
I have a light emitting diode (LED).
Who has the leading source of air pollution?
I have energy efficiency.
Who has a digital meter installed in your home that communicates with your utility company to monitor and control energy usage?
I have Smart Meter.
Who has a way to learn how a building can use energy more efficiently?
I have energy audit.
Who has the label that shows an appliance’s annual energy use and operating cost?
I have EnergyGuide.
Who has the flow of electrons?
I have vehicle emissions.
Who has using technology that needs less energy to perform the same function?
I have electricity.
Who has caulking, sealing, and weatherstripping cracks around doors and windows?
48 ©2024 The NEED Project School Energy Managers Teacher Guide www.NEED.org
I have ways to reduce air infiltration.
Who has an alternative mode of transportation?
I have riding a bicycle.
Who has the concept that a society should meet its energy needs without compromising the needs of future generations?
I have take short showers. Who has an energy intensive industry?
I have energy sustainability.
Who has the sector of the economy that uses the most petroleum?
I have petroleum refining.
Who has a device that allows you to control the temperature in your home?
I have transportation.
Who has the kitchen appliance that uses the most energy?
I have programmable thermostat.
Who has a renewable transportation fuel?
I have ethanol.
Who has the nonrenewable energy source that is used to generate most of the nation’s electricity?
I have refrigerator.
Who has a way to reduce the cost of heating water?
I have natural gas.
Who has a measure of electricity consumption?
©2024 The NEED Project School Energy Managers Teacher Guide www.NEED.org 49
Youth Energy Conference & Awards
The NEED Youth Energy Conference and Awards gives students more opportunities to learn about energy and to explore energy in STEM (science, technology, engineering, and math). The annual June conference has students from across the country working in groups on an Energy Challenge designed to stretch their minds and energy knowledge. The conference culminates with the Youth Awards Ceremony recognizing student work throughout the year and during the conference.
For More Info: www.need.org/youthenergyconference/
Youth AWards Program for Energy Achievement
All NEED schools have outstanding classroom-based programs in which students learn about energy. Does your school have student leaders who extend these activities into their communities? To recognize outstanding achievement and reward student leadership, The NEED Project conducts the National Youth Awards Program for Energy Achievement.
Share Your Energy Outreach with The NEED Network! This program combines academic competition with recognition to acknowledge everyone involved in NEED during the year—and to recognize those who achieve excellence in energy education in their schools and communities.
What’s involved?
Students and teachers set goals and objectives and keep a record of their activities. Students create a digital project to submit for judging. In April, digital projects are uploaded to the online submission site.
Check out:
https://youthawards.need.org/project-guidelines/ for more project and application information. Be sure to explore the remainder of the site to learn more about the Awards weekend, see past winner sample projects, and more!
50 ©2024 The NEED Project School Energy Managers Teacher Guide www.NEED.org
School Energy Managers Evaluation Form
1. Did you conduct the entire unit?
No 2. Were the instructions clear and easy to follow?
3. Did the activities meet your academic objectives?
4. Were the activities age appropriate?
5. Were the allotted times sufficient to conduct the activities?
6. Were the activities easy to use?
7. Was the preparation required acceptable for the activities?
8. Were the students interested and motivated?
9. Was the energy knowledge content age appropriate?
10. Would you teach this unit again?
Please explain any ‘no’ statement below.
What would make the unit more useful to you?
Yes
Yes
No
No
Other Comments:
©2024 The NEED Project School Energy Managers Teacher Guide www.NEED.org 51
State: ___________ Grade Level: ___________ Number of Students: __________
Yes
Yes
No
Yes
No
Yes
No
Yes
No
Yes
No
Yes
No
Yes
No
How
you rate the unit overall? excellent good fair poor How
rate the unit overall? excellent good fair poor
would
would your students
Please fax
to: The NEED Project 8408 Kao Circle FAX: 1-800-847-1820 Manassas, VA 20110 Email: info@need.org
or mail
AES
AES Clean Energy Development
American Electric Power Foundation
Appalachian Voices
Arizona Sustainability Alliance
Atlantic City Electric
Baltimore Gas & Electric
Berkshire Gas - Avangrid
BP America Inc.
Bob Moran Charitable Giving Fund
Cape Light Compact–Massachusetts
Celanese Foundation
Central Alabama Electric Cooperative CITGO
The City of Cuyahoga Falls
Clean Virginia CLEAResult
ComEd
Con uence
ConocoPhillips
Constellation
Delmarva Power and Light
Department of Education and Early Childhood
Development - Government of New Brunswick, Canada
Dominion Energy, Inc.
Dominion Energy Charitable Foundation
DonorsChoose
East Baton Rouge Parish Schools
East Kentucky Power Cooperative
EcoCentricNow
EDP Renewables
EduCon Educational Consulting
Enel Green Power North America
ENGIE
Entergy
Equinix
Eversource
Exelon
Exelon Foundation
Foundation for Environmental Education
FPL
Generac
Georgia Power
Gerald Harrington, Geologist
Government of Thailand–Energy Ministry
Greater New Orleans STEM
GREEN Charter Schools
Green Power EMC
Guilford County Schools–North Carolina
Honeywell
National Sponsors and Partners
Iowa Governor’s STEM Advisory Council -
Scale Up
Iowa Lakes Community College
Iowa State University
Illinois Clean Energy Community Foundation
Illinois International Brotherhood of Electrical
Workers Renewable Energy Fund
Independent Petroleum Association of New Mexico
Intuit
Iron Mountain Data Centers
Kansas Corporation Energy Commission
Kansas Energy Program – K-State Engineering Extension
Katy Independent School District
Kentucky Environmental Education Council
Kentucky O ce of Energy Policy
Kentucky Power–An AEP Company
Liberty Utilities
Llano Land and Exploration
Louisiana State Energy O ce
Louisiana State University – Agricultural Center
LUMA
Marshall University
Mercedes Benz USA
Minneapolis Public Schools
Mississippi Development Authority–Energy Division
Motus Experiential
National Fuel
National Grid
National Hydropower Association
National Ocean Industries Association
National Renewable Energy Laboratory
NC Green Power
Nebraskans for Solar
NextEra Energy Resources
Nicor Gas
NCi – Northeast Construction
North Shore Gas
O shore Technology Conference
Ohio Energy Project
Oklahoma Gas and Electric Energy Corporation
Omaha Public Power District
Ormat
Paci c Gas and Electric Company
PECO
Peoples Gas
Pepco
Performance Services, Inc.
Permian Basin Petroleum Museum
Phillips 66
PowerSouth Energy Cooperative
PPG
Prince George’s County O ce of Human Resource Management (MD)
Prince George’s County O ce of Sustainable Energy (MD)
Providence Public Schools
Public Service of Oklahoma - AEP
Quarto Publishing Group
The Rapha Foundation
Renewable Energy Alaska Project
Rhoades Energy
Rhode Island O ce of Energy Resources
Salal Foundation/Salal Credit Union
Salt River Project
Salt River Rural Electric Cooperative
Schneider Electric
C.T. Seaver Trust
Secure Solar Futures, LLC
Shell USA, Inc.
SMUD
Society of Petroleum Engineers
South Carolina Energy O ce
Southern Company Gas
Snohomish County PUD
SunTribe Solar
TXU Energy
United Way of Greater Philadelphia and Southern New Jersey
Unitil
University of Iowa
University of Louisville
University of North Carolina
University of Northern Iowa
University of Rhode Island
U.S. Department of Energy
U.S. Department of Energy–O ce of Energy
E ciency and Renewable Energy
U.S. Department of Energy - Solar Decathlon
U.S. Department of Energy - Water Power
Technologies O ce
U.S. Department of Energy–Wind for Schools
U.S. Energy Information Administration
United States Virgin Islands Energy O ce
Virginia Cooperative Extension
Vistra Energy
We Care Solar
West Virginia O ce of Energy
West Warwick Public Schools
©2024 The NEED Project 8408 Kao Circle, Manassas, VA 20110 1.800.875.5029 www.NEED.org
