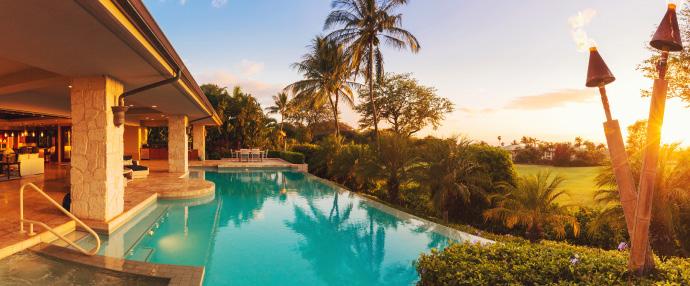
If you are looking for a REALTOR® or Brokerage who will fully communicate; promptly, professionally, and in detail with you, to help you with all your Real Estate needs, then look no further. By helping local, national and international customers; both sellers and buyers, from answering questions to having utility / contractor lists and any other information available through the transaction & after closing; I’m here for you and I’m always available to help.
My top priority is going beyond the expected to deliver an exceptional and fully satisfying one-stop, full-service real estate experience for home buyers and sellers. I will work with you throughout your entire home search or sale process, and assist in finalizing the details.
As a highly trained professional, I will use my technology, marketing, presentation, communication, negotiation and sales tools to help you find the home that matches your criteria.
If you are selling your property, I will ensure it reaches a global audience and is sold quickly for the highest price possible, with the least amount of inconvenience to you.
To help all my customers in the best possible way, I have worked to achieve many designations and affiliations: ABR® (Accredited Buyer’s Representative), AHWD (At Home with Diversity), CIPS (Certified International Property Specialist), CLHMS (Certified Luxury Home Marketing, CNE, (Certified Negotiation Expert), CRS (Certified Residential Specialist), GRI (Graduate of the Realtor Institute), MCNE (Master Certified Negotiation Expert), RSPS (Resort and Second Home Property Specialist), SFR (Short sales and Foreclosure Resource Certified), Smart Home, SRES®, (Senior Real Estate Specialist), SRS (Seller Representative Specialist) REALTOR® (active member of our local board of Realtors; NABOR (Naples Area Board of Realtors), Member of MIAAOR (Marco Island Area Association of Realtors), Member of RALSC / Stellar MLS, Member of Sanibel and Captiva Islands Association of Realtors), Member of Florida Realtors & Member of NAR (National Association of Realtors). I continue to be an active member of the Institute for Luxury Home Marketing.
I am a Preferred Agent on a number of popular online Real Estate websites and magazines; which means that I will be able to promote your listing much better to a local, national and international clientele. Through the additional cutting edge tools and technologies which enables additional marketing I have a large local, national and international clientele which I keep fully updated on changes in the market, etc.
Because 90% of home shoppers now search for homes on the Internet, our systems offers unmatched property marketing and technology to generate interest in your property.
My vision is to continue to be the preferred gateway for an exceptional Real Estate experience, for you.
TABLE OF CONTENTS
PAGE 4 LUXURY REPORT EXPLAINED
PAGE 5 WELCOME MESSAGE
PAGE 6-9 NORTH AMERICAN LUXURY MARKET REVIEW
PAGE 10 13 MONTH MARKET TRENDS
PAGE 11 SINGLE FAMILY HOMES MONTHLY OVERVIEW
PAGE 12 ATTACHED HOMES MONTHLY OVERVIEW
PAGE 13-16 MONTHLY STATISTICS BY CITY
PAGE 17 NAPLES LUXURY MARKET REVIEW
PAGE 22 MARCO ISLAND LUXURY MARKET REVIEW
PAGE 27 LEE COUNTY LUXURY MARKET REVIEW
PAGE 32 THANK YOU
– LUXURY REPORT EXPLAINED –
The Institute for Luxury Home Marketing has analyzed a number of metrics — including sales prices, sales volumes, number of sales, sales-price-to-list-price ratios, days on market and price-per-square-foot – to provide you a comprehensive North American Luxury Market report.
Additionally, we have further examined all of the individual luxury markets to provide both an overview and an in-depth analysis - including, where data is sufficient, a breakdown by luxury single-family homes and luxury attached homes.
It is our intention to include additional luxury markets on a continual basis. If your market is not featured, please contact us so we can implement the necessary qualification process. More in-depth reports on the luxury communities in your market are available as well.
Looking through this report, you will notice three distinct market statuses, Buyer's Market, Seller's Market, and Balanced Market. A Buyer's Market indicates that buyers have greater control over the price point. This market type is demonstrated by a substantial number of homes on the market and few sales, suggesting demand for residential properties is slow for that market and/or price point.
By contrast, a Seller's Market gives sellers greater control over the price point. Typically, this means there are few homes on the market and a generous demand, causing competition between buyers who ultimately drive sales prices higher.
A Balanced Market indicates that neither the buyers nor the sellers control the price point at which that property will sell and that there is neither a glut nor a lack of inventory. Typically, this type of market sees a stabilization of both the list and sold price, the length of time the property is on the market as well as the expectancy amongst homeowners in their respective communities – so long as their home is priced in accordance with the current market value.
REPORT GLOSSARY
DAYS ON MARKET: Measures the number of days a home is available on the market before a purchase offer is accepted.
LUXURY BENCHMARK PRICE: The price point that marks the transition from traditional homes to luxury homes.
NEW LISTINGS: The number of homes that entered the market during the current month.
PRICE PER SQUARE FOOT: Measures the dollar amount of the home's price for an individual square foot.
SALES RATIO: Sales Ratio defines market speed and determines whether the market currently favors buyers or sellers. A Buyer's Market has a Sales Ratio of less than 12%; a Balanced Market has a ratio of 12% up to 21%; a Seller's Market has a ratio of 21% or higher. A Sales Ratio greater than 100% indicates the number of sold listings exceeds the number of listings available at the end of the month.
SP/LP RATIO: The Sales Price/List Price Ratio compares the value of the sold price to the value of the list price.
REMAINING INVENTORY: The total number of homes available at the close of a month.
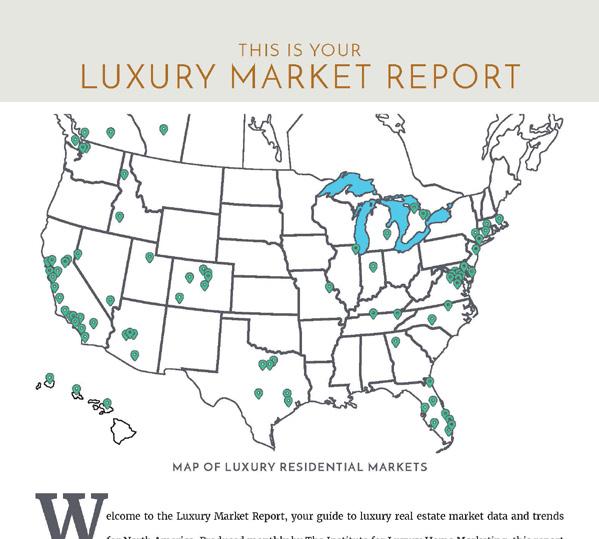
MAP OF LUXURY RESIDENTIAL MARKETS
elcome to the Luxury Market Report, your guide to luxury real estate market data and trends for North America. Produced monthly by The Institute for Luxury Home Marketing, this report provides an in-depth look at the top residential markets across the United States and Canada. Within the individual markets, you will find established luxury benchmark prices and detailed survey of luxury active and sold properties designed to showcase current market status and recent trends. The national report illustrates a compilation of the top North American markets to review overall standards and trends.
The Luxury Market Report is a monthly analysis provided by The Institute for Luxury Home Marketing. Luxury benchmark prices are determined by The Institute. This active and sold data has been provided by REAL Marketing, who has compiled the data through various sources, including local MLS boards, local tax records and Realtor.com. Data is deemed reliable to the best of our knowledge, but is not guaranteed.
NORTH AMERICAN LUXURY REVIEW
Trends for the Fall 2024
In continuation of last month’s report, we analyze the trends for the upcoming Fall 2024 season.
In general, the market remains statistically favorable to sellers despite the increase in inventory. However, buyers, especially those looking to purchase with cash, recognize that the current market offers more opportunities as well as some additional negotiation leverage.
Sales Trends
Overall, the first six months of 2024 continued to show an upward trajectory in sales for both the single-family and attached markets, with the numbers adjusting in July and August to account for the typically slower summer months.
However, of greater significance is the continued uptick in sales compared to 2023, with only June showing a decline, while July showed an unusual increase. As of the end of August, the total number of sales for 2024 has increased by 13.0% for single-family homes and 10.0% for condominiums and townhomes compared to 2023.
The increase in available inventory has certainly been a factor in creating more opportunities for buyers. Similarly, the stability of both the economy and interest rates, coupled with a strengthening stock market over the last eight months, has allowed affluent buyers to feel more confident in making property decisions.
Price Trends
Interestingly, the overall median sold price has started to decline slightly over the past eight months. While median monthly sold prices have held steady compared to the same months in 2023, this trend raises the question of whether prices are now feeling downward pressure.
Typically, increased inventory would be expected to place downward pressure on prices. However, as we’ve noted over the past year, this pressure has been mostly mitigated by the lack of new and
desirable inventory entering the market each month.
The decline in median monthly prices may also result from an increase in the number of sales in the lower luxury price brackets. When we look at the list prices of sold properties, a similar trend emerges, with the median list price declining each month, while the list prices for remaining inventory have seen little change.
Mortgage Rate Trends
As mortgage rates drop, there is an expectation that sales will increase significantly in September. If rates fall further in October, we may see homeowners who were previously hesitant to sell due to high mortgage rates start to put their homes on the market.
We could see a strong fall market with affluent buyers taking advantage of softening prices and lowering mortgage rates.
Preference Trends
For homeowners looking to sell this fall, it’s important to recognize that location, customization, innovation, and “the experience” are driving sales in today’s luxury market and are expected to remain constant regardless of external factors.
Location
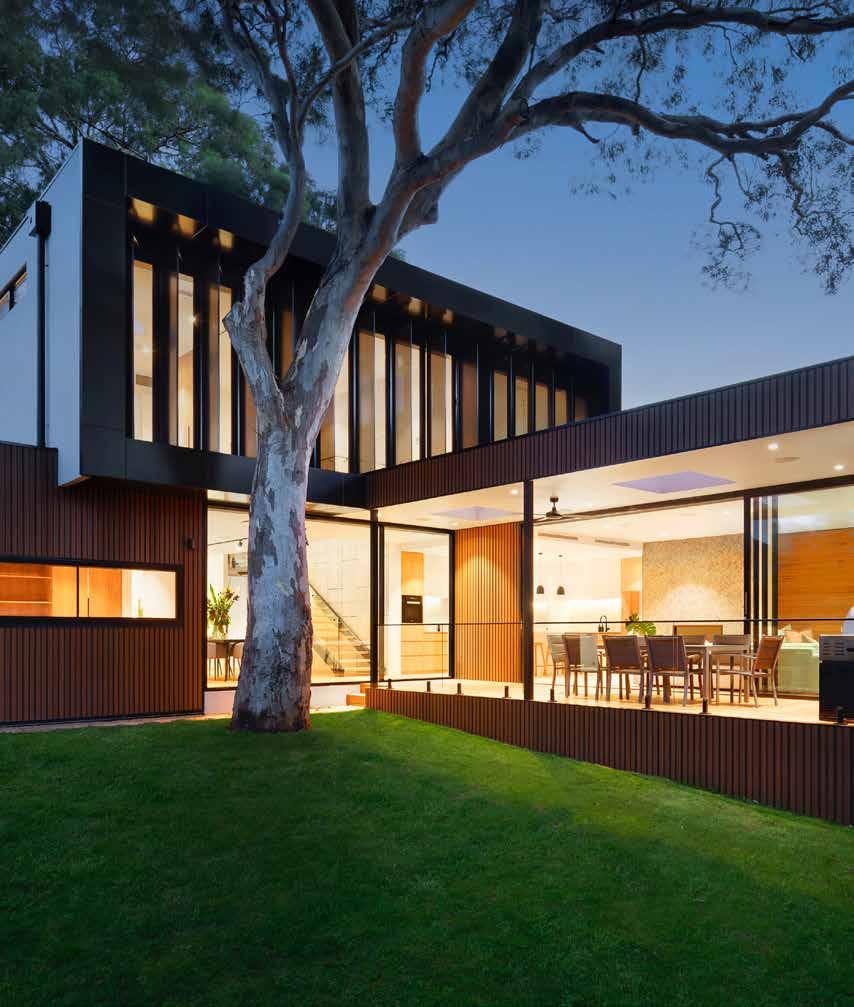
Luxury buyer preferences have moved towards properties offering privacy, space, and lifestyle amenities. Proximity to nature, high-quality living, and access to exclusive services like golf courses, marinas, and private communities are top priorities, highlighting the need for spacious, multifunctional homes.
Non-urban luxury markets continue to experience a notable shift, with high-networth individuals increasingly investing in suburban, rural, and resort areas like beach spots, mountain retreats, and countryside getaways. These buyers prioritize privacy, tranquility, and scenic surroundings, seeking properties that offer both luxury and an escape from city life. The trend reflects a desire for balance and serenity in more remote, picturesque locations.
While these buyers seek space and tranquility, they still want access to luxury amenities like fine dining, shopping, golf courses, and cultural experiences.
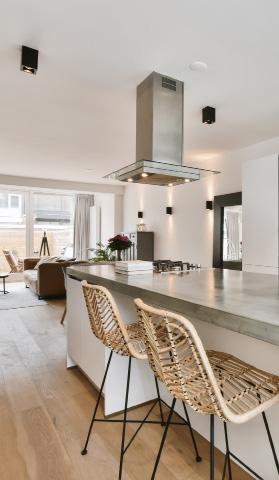
Customized and Personalized Homes
Luxury buyers now demand personalized homes with custom features, from tailored layouts and materials like rare stones and hardwoods to unique spaces like wine cellars, theaters, and hobby rooms. These bespoke touches reflect individual tastes and needs.
Custom kitchens and bathrooms are top priorities for affluent buyers, often featuring stateof-the-art appliances, custom cabinetry, and spa-like bathrooms with steam showers, soaking tubs, and heated floors.
Many luxury homes also include recreation spaces such as home theaters, gyms, and bars, designed to entertain homeowners without leaving the property. These spaces are often highly customized to suit client preferences, including tennis and pickleball courts, music rooms, and wine cellars.
Modern developments are blending privacy with community living. Buyers seek secure, exclusive homes with shared spaces like gardens and lounges, allowing for social connectivity while maintaining personal retreats.
Innovation
High-end buyers expect integrated smart home systems for lighting, security, and entertainment. These features enhance convenience, security, and energy efficiency, emphasizing luxury through functionality and sustainability.
Luxury homes must balance aesthetics with functionality. Buyers demand multiple utility spaces like laundry rooms and butler’s pantries. Home offices are also essential, especially for high-level executives working remotely, often requiring at least two offices.
Outdoor spaces are now as luxurious as indoor areas, featuring outdoor kitchens, heated pools, and beautifully landscaped gardens. These spaces are designed for relaxation and entertainment, with features like fire pits, bars, and dining areas enhancing the overall experience.
Health and wellness have become central to luxury living, with clients increasingly seeking
homes equipped with amenities that rival high-end gyms and spas. From private fitness centers and spa-like spaces to saltwater pools and e-workout pods, the emphasis is on creating exclusive, health-focused environments. This trend reflects a growing desire for holistic wellbeing, where luxury is not just about opulence but about fostering a healthy, balanced lifestyle.
Curb appeal is crucial for luxury buyers, who are willing to invest in sophisticated landscaping, lighting, and exterior finishes. High-end driveways and elegant outdoor features like uplighting add lasting visual appeal.
The ‘Experience’
While each market will be affected by its own nuances, “the experience” a home offers has become a significant factor in the decision-making process of the wealthy.
In luxury homes, “the experience” combines ambiance, comfort, and personalization to elevate daily living. It’s more than just premium materials—it’s about tailoring design, convenience, and exclusivity to the owner’s lifestyle. Key aspects include personalized spaces, integrated smart technology, wellness-focused amenities, effortless entertainment options, and exclusive features like pools and spas.
Overall, “the experience” transforms a home into a unique, luxurious environment that enhances everyday life. Equally important is preserving the essence of the natural surroundings while ensuring that all aspects of lifestyle, health, privacy, and security are seamlessly incorporated.
The 2024 luxury real estate market is defined by cutting-edge technology, personalized living spaces, and wellness-focused amenities. As buyer preferences evolve, these features are shaping modern luxury living. For sellers, staying ahead of these trends is essential to meet the changing demands of high-net-worth clients and remain competitive in the market.
Successfully navigating today’s market requires a critical, analytical approach. Understanding current realities and setting realistic expectations are key to achieving your goals. For homeowners looking to buy or sell, we recommend partnering with a Realtor who can leverage the latest trends, preferences, and demands in this fast-changing environment.
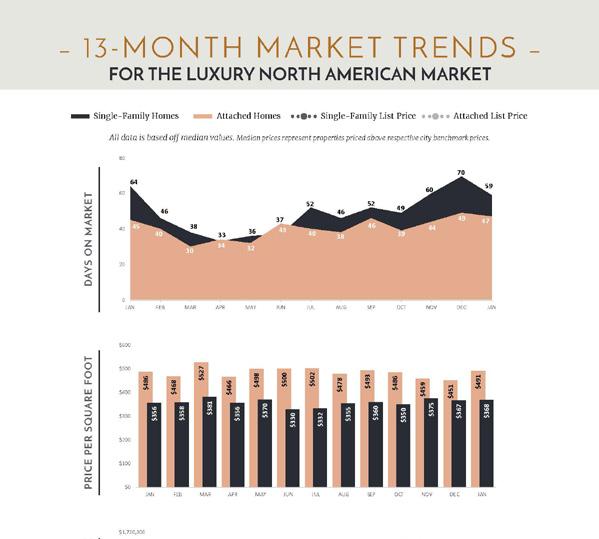
– 13 - MONTH MARKET TRENDS –
FOR THE LUXURY NORTH AMERICAN MARKET
Single-Family Homes Attached Homes Single-Family List Price Attached List Price
All data is based off median values. Median prices represent properties priced above respective city benchmark prices.
$1,900,000
$1,700,000
$1,500,000
$1,300,000
$1,100,000
$900,000
$700,000
$500,000
– LUXURY MONTHLY MARKET REVIEW –
A Review of Key Market Differences Year over Year
August 2023 | August 2024
SINGLE-FAMILY HOMES
6.73%
SINGLE-FAMILY HOMES MARKET SUMMARY | AUGUST 2024
• Official Market Type: Seller's Market with a 25.44% Sales Ratio.1
• Homes are selling for an average of 98.43% of list price.
• The median luxury threshold2 price is $912,500, and the median luxury home sales price is $1,316,250.
• Markets with the Highest Median Sales Price: Telluride ($5,442,500), Paradise Valley ($5,125,000), Vail ($4,423,000), and Los Angeles Beach Cities ($4,145,000).
• Markets with the Highest Sales Ratio: Cleveland Suburbs (115.2%), Howard County, MD (101.4%), Central Connecticut (85.8%), and Westchester County (80.6%).
1
– LUXURY MONTHLY MARKET REVIEW –
A Review of Key Market Differences Year over Year
August 2023 | August 2024
• Official Market Type: Balanced Market with a 19.77% Sales Ratio. 1
• Attached homes are selling for an average of 98.66% of list price.
• The median luxury threshold2 price is $700,000, and the median attached luxury sale price is $925,000
• Markets with the Highest Median Sales Price: Vail ($3,225,000), Telluride ($2,950,000), San Francisco ($2,624,000), and Maui ($2,500,000).
• Markets with the Highest Sales Ratio: Fairfax County, VA (119.5%), Arlington & Alexandria (112.1%), Anne Arundel County (101.4%), and Howard County (94.3%).
– LUXURY MONTHLY MARKET REVIEW –
– LUXURY MONTHLY MARKET REVIEW –
– LUXURY MONTHLY MARKET REVIEW –
– LUXURY MONTHLY MARKET REVIEW –
NAPLES FLORIDA
LUXURY INVENTORY VS. SALES | AUGUST 2024
Buyer's Market Total
$20,000,000+
$15,000,000 - $19,999,999
$10,000,000 - $14,999,999
$9,000,000 - $9,999,999
$8,000,000 - $8,999,999
$7,000,000 - $7,999,999
$6,000,000 - $6,999,999
$5,000,000 - $5,999,999
$4,000,000 - $4,999,999
$3,500,000 - $3,999,999
$3,000,000 - $3,499,999
$2,800,000 - $2,999,999
$2,600,000 - $2,799,999
$2,500,000 - $2,599,999
$2,400,000 - $2,499,999
13 - MONTH LUXURY MARKET TREND 4
MEDIAN DATA REVIEW | AUGUST
VARIANCE: 29 % 358463 Aug. 2023Aug. 2024
VARIANCE: 21 % $954 $1,156 SALE PRICE PER SQFT. Aug. 2023Aug. 2024 Aug. 2023Aug. 2024
VARIANCE: 0 % 93.75% 93.49% SALE TO LIST PRICE RATIO
$3.66m SALES PRICE
VARIANCE: 25 % 7189 DAYS ON MARKET
NAPLES MARKET SUMMARY | AUGUST 2024
• The single-family luxury market is a Buyer's Market with a 6% Sales Ratio.
• Homes sold for a median of 93.49% of list price in August 2024.
• The most active price band is $2,400,000-$2,499,999, where the sales ratio is 17%
• The median luxury sales price for single-family homes is $3,656,663.
• The median days on market for August 2024 was 89 days, up from 71 in August 2023.
3Square foot table does not account for listings and solds where square foot data is not disclosed.
Data reported includes Active and Sold properties and does not include Pending properties.
$4,100,000
LUXURY INVENTORY VS. SALES | AUGUST 2024
Buyer's Market
$1,700,000
$1,600,000
$1,500,000
Luxury Benchmark Price 1: $1,275,000
13 - MONTH LUXURY MARKET TREND
Median Sales Price Inventory
Solds
4
MEDIAN DATA REVIEW | AUGUST
TOTAL INVENTORY TOTAL SOLDS
• The attached luxury market is a Buyer's Market with a 11% Sales Ratio.
• Homes sold for a median of 95.61% of list price in August 2024.
• The most active price band is $2,000,000-$2,099,999, where the sales ratio is 60%
• The median luxury sales price for attached homes is $2,250,000.
• The median days on market for August 2024 was 87 days, up from 38 in August 2023.
MARCO ISLAND FLORIDA
MARCO ISLAND SINGLE
LUXURY
INVENTORY
VS. SALES | AUGUST 2024
Buyer's Market
$5,000,000+
$4,400,000 - $4,999,999
$4,100,000 - $4,399,999
$3,800,000 - $4,099,999
$3,500,000 - $3,799,999
$3,200,000 - $3,499,999
$2,900,000 - $3,199,999
$2,600,000
$2,000,000
$1,800,000 - $1,999,999
$1,700,000 - $1,799,999
$1,600,000 - $1,699,999
$1,500,000 - $1,599,999
MARCO ISLAND SINGLE -
FAMILY HOMES
13 - MONTH LUXURY MARKET TREND 4
MEDIAN DATA REVIEW | AUGUST
Aug. 2023 Aug. 2024
VARIANCE: 0 % $1,014 $1,019 SALE PRICE PER SQFT.
$2.53m $2.08m SALES PRICE VARIANCE: - 70 % 73 22 DAYS ON MARKET VARIANCE: 1 % 93.91% 94.74% SALE TO LIST PRICE RATIO
MARCO ISLAND MARKET SUMMARY | AUGUST 2024
• The single-family luxury market is a Buyer's Market with a 11% Sales Ratio.
• Homes sold for a median of 94.74% of list price in August 2024.
• The most active price band is $2,000,000-$2,199,999, where the sales ratio is 33%
• The median luxury sales price for single-family homes is $2,075,000.
• The median days on market for August 2024 was 22 days, down from 73 in August 2023.
3Square foot table does not account for listings and solds where square foot data is not disclosed.
Data reported includes Active and Sold properties and does not include Pending properties.
MARCO ISLAND ATTACHED
LUXURY INVENTORY VS. SALES | AUGUST 2024
Buyer's Market
$2,900,000
$1,300,000
$1,200,000
MARCO ISLAND ATTACHED
Luxury Benchmark Price 1: $1,000,000
13 - MONTH LUXURY MARKET TREND 4
Median Sales Price Inventory
Solds
MEDIAN DATA REVIEW | AUGUST
Aug. 2023Aug. 2024 Aug. 2023Aug. 2024 Aug. 2023Aug. 2024 Aug. 2023Aug. 2024 Aug. 2023Aug. 2024 Aug. 2023Aug. 2024
• The attached luxury market is a Buyer's Market with a 10% Sales Ratio.
• Homes sold for a median of 94.78% of list price in August 2024.
• The most active price band is $1,000,000-$1,099,999, where the sales ratio is 67%
• The median luxury sales price for attached homes is $1,397,500.
• The median days on market for August 2024 was 79 days, up from 50 in August 2023.
LEE COUNTY FLORIDA
LUXURY
INVENTORY
VS. SALES | AUGUST 2024
Buyer's Market
$7,500,000+
$6,400,000 - $7,499,999
$5,400,000 - $6,399,999
$4,600,000 - $5,399,999
$3,800,000 - $4,599,999
$3,200,000 - $3,799,999
$2,600,000 - $3,199,999
$2,200,000
$1,400,000 - $1,599,999
$1,200,000 - $1,399,999
$1,100,000 - $1,199,999
$1,000,000 - $1,099,999
$925,000 - $999,999
Luxury Benchmark Price 1: $925,000
VARIANCE: 37 % 739 1,015 Aug. 2023 Aug. 2024 TOTAL INVENTORY VARIANCE: - 18 % 100 82 TOTAL SOLDS
|
$460 $487 SALE PRICE PER SQFT. Aug. 2023 Aug. 2024 Aug. 2023 Aug. 2024
VARIANCE: 6 %
SALES PRICE VARIANCE: 85 % 40 74 DAYS ON MARKET VARIANCE: - 1 % 94.75% 94.14% SALE TO LIST PRICE RATIO
Aug. 2023 Aug. 2024 Aug. 2023 Aug. 2024 Aug. 2023 Aug. 2024
LEE COUNTY MARKET SUMMARY | AUGUST 2024
• The single-family luxury market is a Buyer's Market with an 8% Sales Ratio. • Homes sold for a median of 94.14% of list price in August 2024.
• The most active price band is $1,200,000-$1,399,999, where the sales ratio is 15%
• The median luxury sales price for single-family homes is $1,250,000.
• The median days on market for August 2024 was 74 days, up from 40 in August 2023.
$2,200,000
$1,900,000
LUXURY INVENTORY VS. SALES | AUGUST 2024
$650,000
$600,000
13 - MONTH LUXURY MARKET TREND 4
Median Sales Price
Inventory
Solds
MEDIAN DATA REVIEW | AUGUST
LEE COUNTY MARKET SUMMARY | AUGUST 2024
• The attached luxury market is a Buyer's Market with an 8% Sales Ratio.
• Homes sold for a median of 95.24% of list price in August 2024.
• The most active price band is $1,000,000-$1,099,999, where the sales ratio is 33%
• The median luxury sales price for attached homes is $800,000.
• The median days on market for August 2024 was 95 days, up from 24 in August 2023.