2 minute read
Marriage 43.1 43.8

from MIGRATION PATTERNS AND ITS IMPACT ON URBANIZATION AND URBAN HOUSING - A STUDY OF HYDERABAD METROPOLI

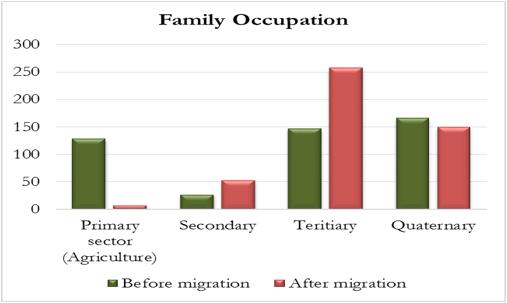
Figure 10: Employment sector of family
7.6 Regression analysis:
Advertisement
An attempt to predict a relation between Reasons for migration and Gender, Education status, Generation in which respondent migrated, and employment opportunity soon after moving to Hyderabad.
From the equation it can be observed that people who are pursing or pursued higher level of education are willing to migrate to a metropolitan city. 58 percent of the post-graduation population and almost 50 % of the under graduate students have moved to Hyderabad in search of education or employment. Equation is inconclusive in terms of Generation to which the migrants belong and the reason of migration, this could imply, irrespective of generation population is been floating to Hyderabad. Equation shows that increase in employment, education and business opportunities will increase the willingness to migrate. As their native places are lacking in better opportunities in terms of both higher/ quality education and employment opportunities.
Reason formigration= 1.756 + 0.2989 Gender(male)+ 0.575 PG & above education qualification+ 0.474 UnderGraduation - 0.338 Senior (till 12) + 0.371 Millennial (1980 - 1994) - 0.089 iGen /Gen Z (1995 - 2012) - 0.191 Gen Alpha (2013-2025) + 0.973 Employed (F/T) + 0.622 Student + 0.773 Self
Employed
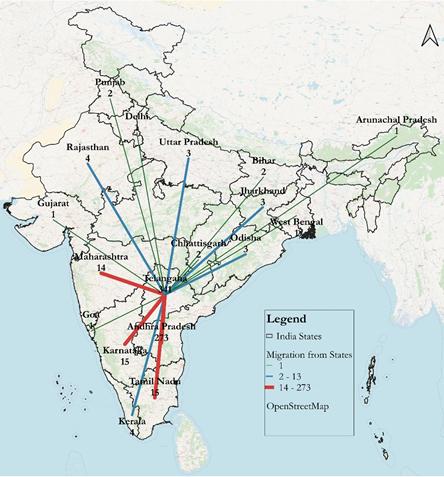
7.7 Migration patterns at India level (Interstate migration):
An attempt has been made to derive patterns of migration within India across the states and districts within Telangana.
Map 1 shows; at the national level, majority of the share is received from Andhra Pradesh followed by neighboring states such as Maharashtra, Karnataka, and Tamil Nadu. 1. Concentration of resources, such as second largest Software sector (first being Bangalore), availability of educational facilities, various employment opportunities being a Metropolitan city by itself.
2. Hyderabad is considered as south central, regional similarities offer a sense of belongingness and comfort, encouraging from southern parts the most.
7.7.1 Migration patterns at district level within Telangana:
Following the state level migration details, next attempt was made to understand the migration patterns from all the districts of Telangana. Map 2 shows; at district level, Hyderabad is absorbing immigration from eastern and southern districts of itself.
It is interesting to observe that, majority of the migrants are from Tier 2 cities, i.e., potentially upcoming cities like Nalgonda, Warangal, Karimnagar, Rangareddy, Mahbubnagar, and Khammam are the major epicenters for emigration. The observed reasons are in search of Education, Employment, high rates of employability and Empowerment.
8. CONCLUSION:
From the above analysis and interpretations, it has been shortlisted that the following Tier II cities can be developed with modern education and employment opportunities. Once these areas improve their infrastructure, migration from these districts will automatically reduce to Hyderabad. Map 3 shows the list of districts that can be developed phase wise to minimize the immigration into state capital. Identified districts are; Nizamabad, Karimnagar, Warangal, Khammam, Nalgonda, Mahbubnagar, and Rangareddy.