
16 minute read
US tissue: still leading the race, but pedalling harder to keep ahead
short tonnes of production capacity on three mill sites in Oklahoma, Ohio, and Florida. The mills in Inola, OK, and Circleville, OH, have both been built since 2018 and each houses two tissue machines with integrated converting operations. Circleville investment cost estimates have ranged around $300m, while the more recent Inola project has been reported to have a $360m budget, which is consistent with the observed growing capex requirement trend with tissue mill investments..
The crucial role of fibre costs for the tissue sector
To change gears from investment costs to operating costs, fibre costs represent 60-80% of market pulp and about half of recovered fibre-based tissue product manufacturing costs, and hence are a significant driver for tissue companies’ performance. 2019 brought relief to tissue companies’ cost environment. The record high pulp prices in 2018 turned into decline in 2019, falling by close to 30% from peak pulp prices only a year earlier. The developments in recovered fibre markets and recovered fibre prices have been even more dramatic than in market pulp over the past year. Sorted Office Paper (SOP) price fell close to 60%. As a result, tissue companies were able to show improving EBITDA performance throughout 2019.
Over the past years we have observed tissue companies adjusting their fibre furnish slowly away from recovered fibre. Based on AFRY’s estimates, in mature markets recovered fibre has lost 5% share of tissue furnish over the past decade. The change has been driven both by growing product quality needs, but also due to concerns over continued high quality recovered fibre availability driven by declining consumption of office papers and printed media overall. However, China’s implementation of the National Sword programme to limit imports of recycled materials to China, including recovered fibre, has brought a dramatic change to recovered fibre availability and prices in North America.
If SOP prices declined by close to 60% in 2019, the value of Mixed Paper collected typically from residential recycling bins plummeted to worthless after China stopped buying it in early 2018. Over the past decade, Mixed Paper prices typically fluctuated between $50 and $100/tonne, but currently Mixed Paper is offered to domestic paper mills practically for free. Hence, both the packaging and tissue mills have shown interest in increasing use of
FIGURE 1: TISSUE CAPACITY EXPANSIONS & CLOSURES 2019-2023
mixed paper in fibre furnish. In a tissue manufacturing context, mixed fibre use could work especially in the brown AfH product context and could be possible with relatively low capex upgrades and modifications in tissue mill recovered fibre screener and washer systems.
US retailers have been expanding their private label tissue product portfolios with recycled fiber content product line additions. Both Target and Albertsons launched 100% recycled fibre content private label tissue products in 2019, following Walmart’s footsteps from a year earlier. Although still a small segment of the market, most of the leading US supermarkets do offer recycled fibre content private label products. Interestingly, there appears to be only a few main sources for recycled fibre based private label tissue products in North America – Cascades, Georgia-Pacific, Kruger and Soundview.
Aligned with the search of more fibre raw material options, the map of tissue capacity changes [FIGURE 1] includes one interesting tissue mill plan on the Pacific Northwest in Dallas, OR. Mint Valley Paper might have a unique approach to tissue product fibre raw material in the North American context. The company has disclosed interest in exploring alternative fibre sources for the mill, potentially using wheat straw pulp from the close-by Columbia Pulp wheat straw pulp mill in Eastern Washington.
Future directions
Capacity growth risk. 2020 will see three times the volume of new capacity entering the market than in 2019. While the demand growth rate is not expected to triple, the tissue sector might face some short term over capacity, unless closures of older high cost capacity relieve the supply pressures. Another risk factor for the capacity growth
plans is the apparent project cost inflation, which has added, order of magnitude, 20% on original project cost estimates.
Low likelihood of mega mergers. The tissue sector top suppliers chart 2021 edition is likely to look very similar to the 2020 edition in this article. The sector will likely continue to favour capacity build up and asset renewal over radical M&A. We are most likely to see M&A activity relating to vertical integration.
Opportunities with recovered fibre. The Chinese exit from the global recovered fibre market has created a domestic recovered fibre surplus, which offers opportunities for tissue mills to innovate with low cost and positive environmental image raw material. Although it is yet to be seen to what extent the US consumer market – where product quality, softness and bulk is king - is ready for recovered or alternative fibre content tissue products.
IF SOP PRICES DECLINED BY CLOSE TO 60% IN 2019, THE VALUE OF MIXED PAPER COLLECTED TYPICALLY FROM RESIDENTIAL RECYCLING BINS PLUMMETED TO WORTHLESS AFTER CHINA STOPPED BUYING IT IN EARLY 2018. OVER THE PAST DECADE, MIXED PAPER PRICES TYPICALLY FLUCTUATED BETWEEN $50 AND $100/ TONNE, BUT CURRENTLY MIXED PAPER IS OFFERED TO DOMESTIC PAPER MILLS PRACTICALLY FOR FREE.
US TISSUE: STILL LEADING THE RACE, BUT PEDALLING HARDER TO KEEP AHEAD Americans have the highest expectation of all tissue consumers for range of choice and quality. Bruce Janda, senior consultant, Fisher International, takes a comprehensive look at the history of tissue production in the US, and the powerful dynamics shaping the future market.
Today’s United States consumer tissue industry appears to be an anomaly when compared to other domestic paper grades and the international pulp and paper business in general. At a time when major players are actively consolidating in mature markets, the US is attracting new entrants into tissue production.
The beginning of the 21st-century marks a new dynamic for US tissue production. In the 1970s it was concentrated among four large players: Kimberly-Clark (K-C), Procter & Gamble (P&G), Scott Tissue, and American Can (James River). These four controlled an overwhelming majority of the nationallybranded tissue share.
Television advertising was costly and could only be supported with large share, and brand owners had the power to dictate terms to tissue retailers. Many stores and chains tended to use one of the notable brands to manage their paper aisle and choose competitive brand placement.
Each producer had its own TAD technology for producing advanced structured tissue. Private labels were a small share of total tissue sold and tended to be considered generic quality. At the same time, the commercial tissue segment consolidated to only three major players that had well over 80% market share: Georgia-Pacific (GP) Commercial Tissue, Kimberly-Clark (K-C) Professional, and Essity (SCA, Wausau/Bay West).
In the last 25 years, K-C acquired Scott Tissue and GP acquired Fort James (consisting of James River and Fort Howard with some legacy GP Tissue), and P&G built a new mill in Utah to better serve the west coast, giving the big three consumer
NOW IN 2020, WE STILL HAVE THE AMERICAN COMMERCIAL TISSUE MARKET DOMINATED BY THREE LARGE COMMERCIAL PRODUCERS (GP, K-C, AND ESSITY). BRANDED CONSUMER TISSUE IS STILL DOMINATED BY THE SAME THREE CONSUMER PRODUCERS (GP, K-C, AND P&G). BUT MANY NEW PRODUCERS HAVE ARISEN TO MAKE CONSUMER PRIVATE LABEL TISSUE FOR LARGE CHAINS.

Bruce Janda
Senior consultant, Fisher International
tissue producers global or multi-regional production.
The stage was set for a very consolidated American tissue industry with three large consumer tissue manufacturers and three sizeable commercial tissue manufacturers.
Now in 2020, we still have the American commercial tissue market dominated by three large commercial producers (GP, K-C, and Essity). Branded consumer tissue is still dominated by the same three consumer producers (GP, K-C, and P&G). But many new producers have arisen to make consumer private label tissue for large chains and club warehouse stores.
Source: FisherSolve Next ©2020 Fisher International, Inc.
Source: FisherSolve Next ©2020 Fisher International, Inc.
P&G and GP withdrew from their European mills making K-C the only American-based tissue company operating outside of the United States.
Meanwhile, producers from Canada and China have acquired and built tissue assets in the US.
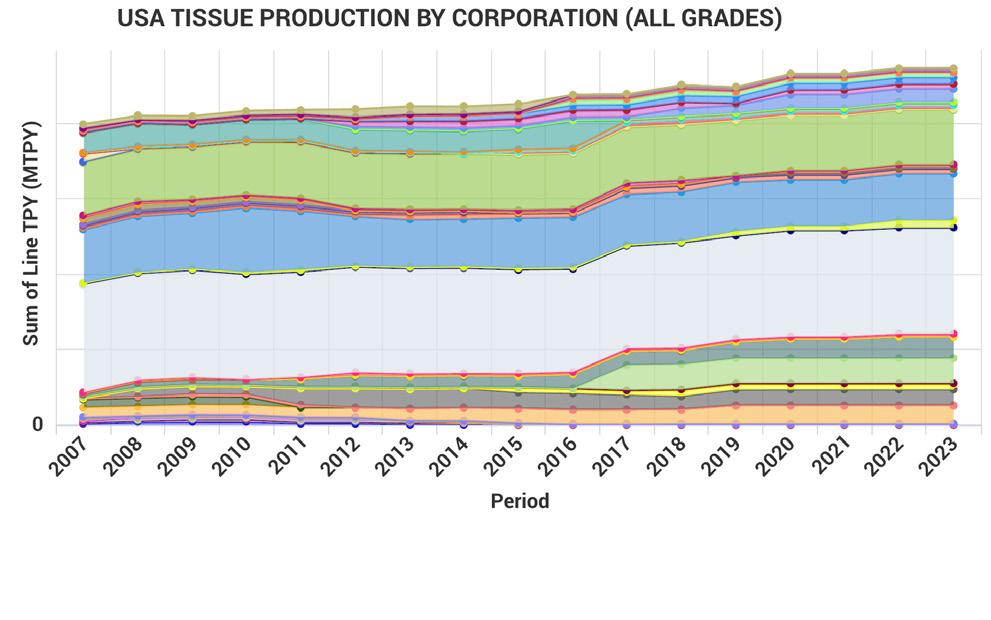
Figure 1 shows the production by each American tissue company from 2007 to 2023 based on announced capacity changes. Each colour represents a different company.
Several companies came into or went out of existence during this period. US production volume of all tissue grades increased at a CAGR of 0.96% over this time and is projected to grow at 1.07% through 2023.
Two of the big three producers appear to have experienced share erosion as K-C and P&G have not added any new machines in this period (breaking news from the Box Elder, Utah paper that suggests that P&G could be adding a second machine soon).
However, production numbers don't tell the whole story.
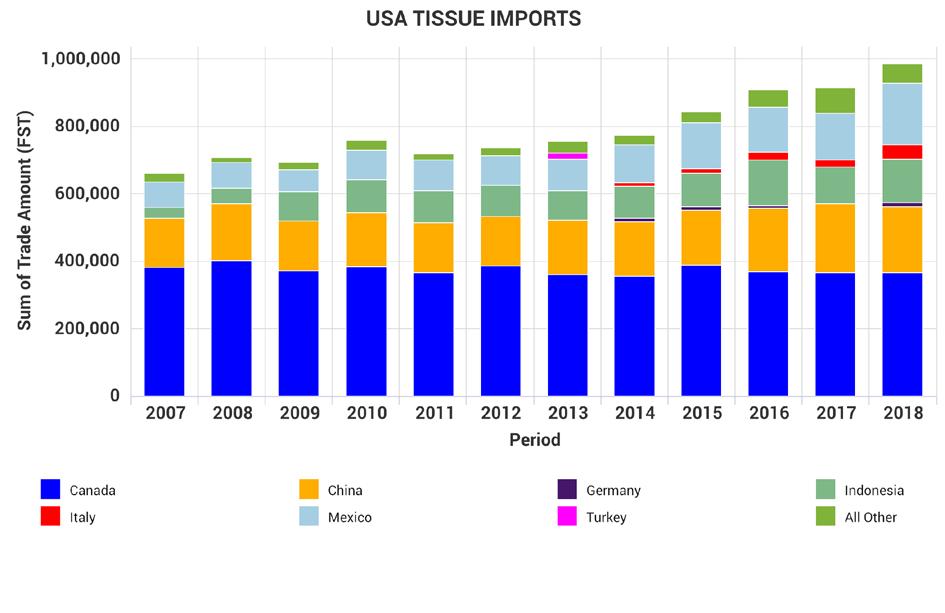
Figure 2 shows the evolution of US tissue imports from 2007 through 2018. These have been trending up significantly. Canada is the largest supplier, followed by China, Indonesia, and Mexico, with small growth from Italy.
US tissue exports are shown in Figure 3. Again, Canada is the largest, trading with a virtual balance in trade either way. Japan and Mexico are the other main customers of USAID tissue production.
The US is a net tissue importer, with exports representing about 60% of the average import volume.
The United States tissue grade structure is shown in Figure 4.
Consumer tissue represents 65% of the total volume produced and 34% of production, while speciality tissue remains very small at 1% of the total.
Americans have the highest expectation of any consumers for tissue product range and availability when travelling or at work. The product designs for AfH products are significantly different and driven by expectations of the facility host for the performance, quality, and cost that match the business strategy.
Most commercial tissue products are designed for very high capacity, quick change, and to prevent waste or misuse.
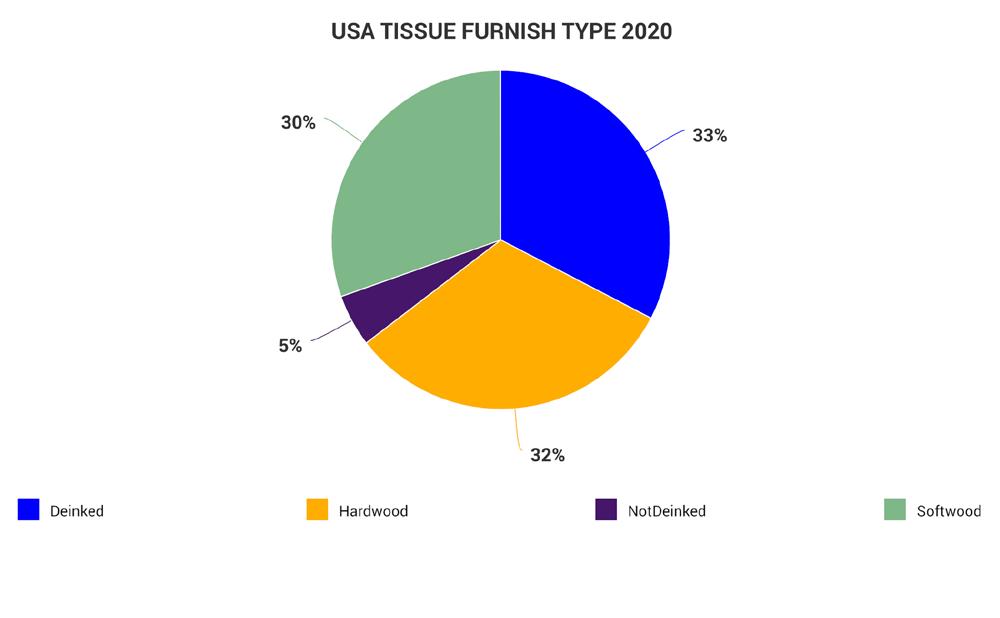
Figure 5 shows the USA tissue furnish breakdown by source type.
Source: FisherSolve Next ©2020 Fisher International, Inc.
Deinked fibre makes up 33% of the total tissue production, and not deinked texture adds another 5%. The combined total of 38% recycled fibre is one of the highest recycled tissue fractions in the world. This is largely driven by the highly recycled content in the commercial tissue segment.
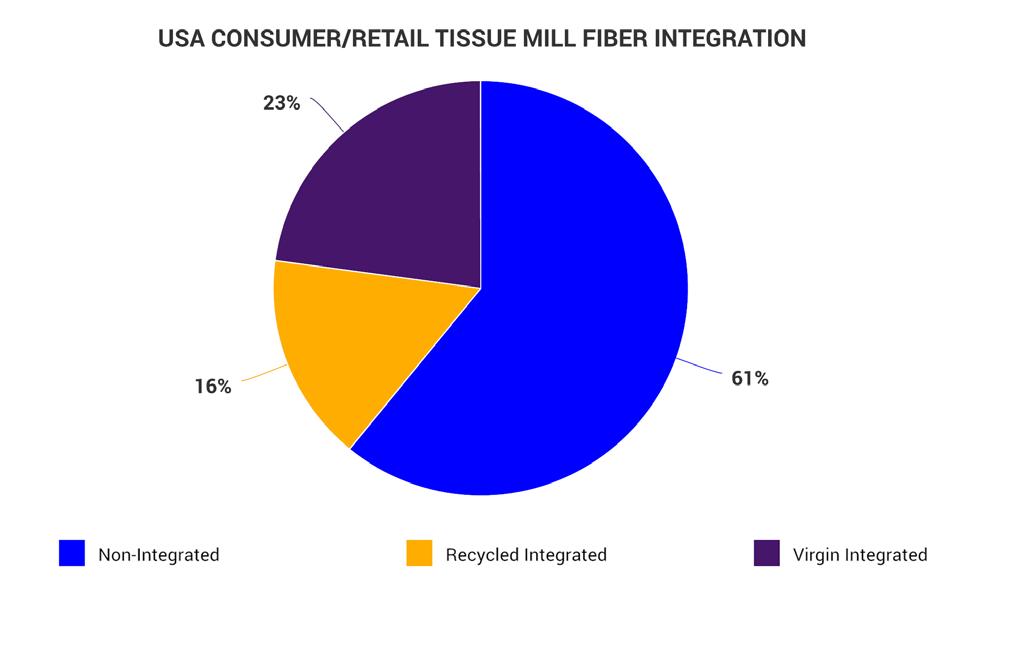
Tissue fibre integration with pulp supply has become a significant driver of cost in the tissue business. The amount of integration for consumer or retail tissue production is shown in Figure 6.
About 23% of consumer tissue production is integrated with virgin pulp production, and 16% is integrated with recycled fibre production. Baled pulp represents 61% of production, much of this is imported, including eucalyptus pulp from Brazil for increased softness.
Figure 7 shows the same analysis of integration for the commercial or AfH tissue mills.
Some 84% of all fibre comes from integrated recycled plants co-located with the tissue machines. Only 7% of production comes from virgin fibre integrated sites.
Comparing Figures 6 and 7 illustrates one of the significant differences between the consumer and commercial tissue grades in
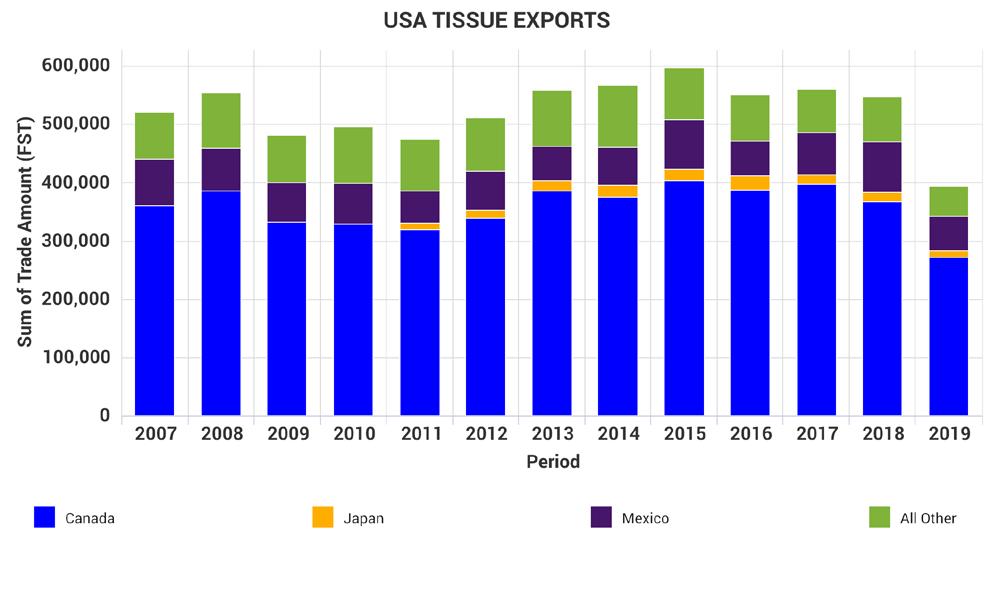
Figure 3

Source: FisherSolve Next ©2020 Fisher International, Inc.
Figure 4
Source: FisherSolve Next ©2020 Fisher International, Inc.
Source: FisherSolve Next ©2020 Fisher International, Inc.
Source: FisherSolve Next ©2020 Fisher International, Inc.
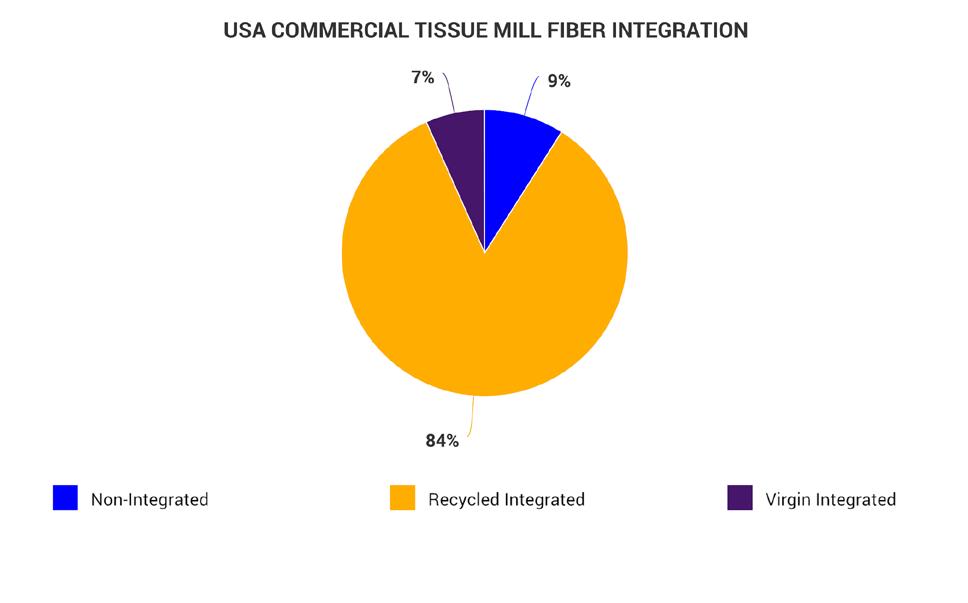
Figure 7

Source: FisherSolve Next ©2020 Fisher International, Inc.
Figure 8
Source: FisherSolve Next ©2020 Fisher International, Inc.
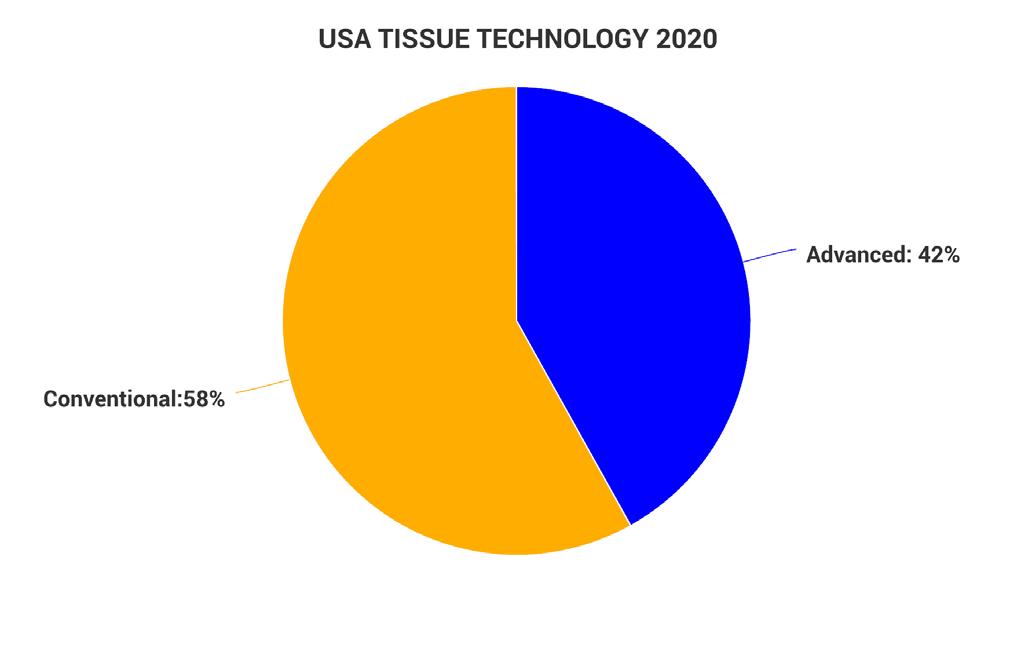
Figure 9
the United States.
Figure 8 provides another way of looking at USA tissue furnished deployment.
Consumer bath tissue contains a significant amount of eucalyptus fibre, while consumer towel includes a considerable percentage of northern softwood fibre. Again, the commercial product formats are heavily based on recovered papers, brown fibre, and pulp substitutes.
Another unique area is the adoption of advanced technology for structuring the tissue. This structure is wet-shaped and then dried into place to create persistent, three-dimensional topography that is resistant to crushing and maintains its form when re-wet.
The three-dimensional aspect of dryembossed tissue is created in converting and does not retain its shape under compression wet or dry. Dry-embossed tissue can appear softer at the expense of strength, but it cannot create the absorbency or softness gains at increased strength that we see with advanced wetshaped technology.
The most prevalent advanced tissue technology is TAD. This technology was
Source: FisherSolve Next ©2020 Fisher International, Inc.
Figure 10
developed by P&G at its Green Bay, Wisconsin, facility in the early 1960s. TAD was also picked up by Scott tissue and K-C and spread around the world by these three companies.
By the end of the 20th century, enough patents had expired to allow machine builders to sell turnkey TAD systems just at the time private label and warehouse club tissue brands were taking off.
TAD requires higher initial capital expenditure and increased electrical power for vacuum pumps and air blowers. It also requires increased natural gas consumption to make up for the lack of mechanical water removal seen in conventional tissue processes.
European tissue machine builders have answered with several technologies intended to create TAD-like products with lower capital investment and energy consumption.
The first of these was Voith's ATMOS process that was applied in Europe, North America, and South America. This process could be changed from normal tissue making to structured and back in 24-hours. Sample sheets from this process show a
significant structured character, but this tissue product never seemed to take off.
Some of these machines are still running in a structured mode.
Valmet answered with several iterations that became the NTT process. This process uses a textured press belt that can be changed in one hour to create varying degrees of structure. Again, this process allows swinging from conventional dry crepe to structure, and it's difficult to tell which mode each of the machine is operating.
GP developed its own in-house structured tissue process called eTAD, although there is no TAD dryer associated with the process. This process is unique in that fabric creping, another critical technology included in TAD, is added to drive further structuring effects.
After an initial rollout, GP seems to be backing away as they deploy additional new TAD machines. They have also sold the rights to this process to Valmet. The little talked about QRT process appears to be a combination of eTAD and NTT.
Figure 9 shows the current deployment of advanced structuring technologies in the USA tissue machine fleet. Over 40% of
production is now advanced technology.
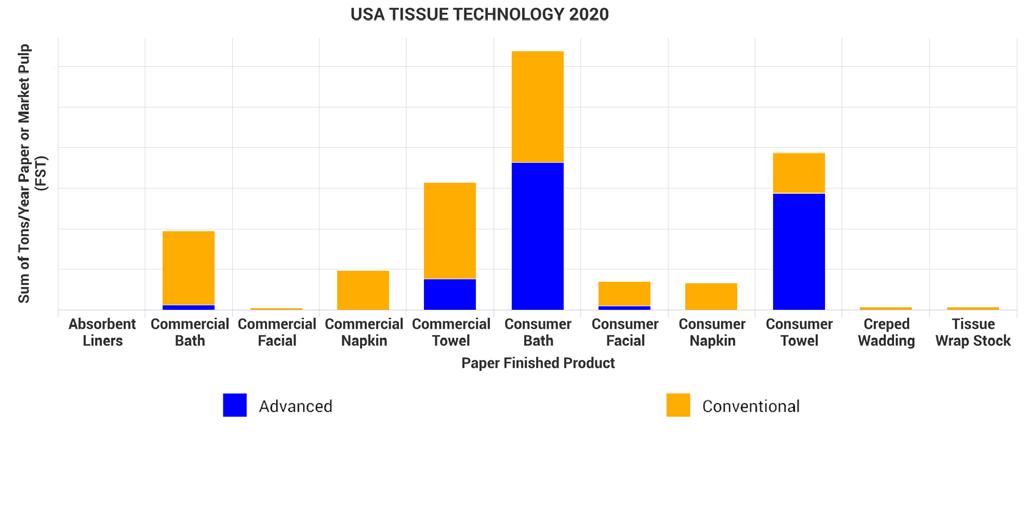
Figure 10 shows the deployment of technology firmly on the consumer side representing slightly more than half of consumer bath and about 80% of consumer towel. Commercial bath tissue has less application as high count roles are needed to minimise the labour cost of servicing facilities.
It's interesting to note structured technology is having an impact on commercial hand towels because of increased absorbency, softer feel, and a vastly upgraded customer experience versus the old brown wet creped hand towels.
Despite this technology, the average American tissue machine is relatively old compared to current or potential sources of tissue imports to the United States.
Figure 11 shows both Canada and the United States lag in the average tissue machine technical age. However, the average throughput per inch of machine width on the y-axis remains competitive.
China has the newest average machine age, but the machines are relatively narrow.
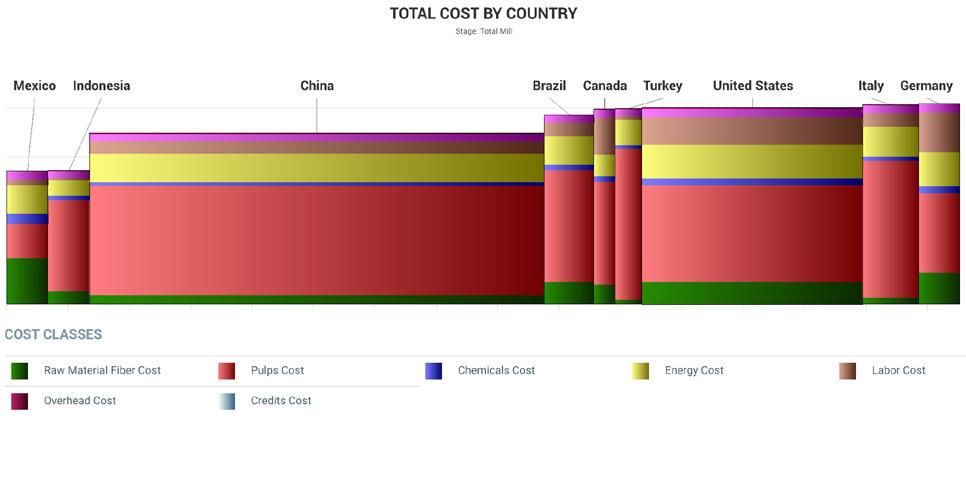
The same set of current and potential tissue trade partners is shown in Figure 12 in a cash cost curve.
Brazil, Canada, Turkey, United States, Italy, and Germany all have similar cash costs per tonne of tissue. Indonesia and Mexico have lower labour and fibre costs that tend to give them a cost advantage.
This analysis doesn't consider shipping costs. Transporting tissue is a notoriously expensive way to ship air in boxes. High bulk structured tissue is even worse. Mexico's proximity to the United States and favourable trade agreements provides a unique advantage.
However, the cost per tonne to
manufactured tissue doesn't tell the whole story.
Figure 13 shows the same cash cost curve expressed as equivalent statistical cases. This considers the extra bulk, and therefore reduced fibre content, of the structured technologies to produce a comparable use case of product for sale.
The United States, with 42% advanced technology, shifts to third place in low cost next to Mexico and Indonesia. The effect is even more significant than this as consumers tend to pay higher prices for rolls of structured tissue with less fibre.
The FisherSolve Next viability curve (Figure 14) provides a more in-depth analysis of tissue machine quality than the average technical age shown in Figure 11.
This ranking shows a combination of factors for the average tissue machine in each of the countries in the comparison group. In this case, transportation to Chicago was also included in the analysis. Again, the United States tissue fleet compares well on average and is surpassed only by Mexico and Turkey.
The final benchmark chart is carbon emissions per tonne shown in Figure 15. This is a crucial indicator of sustainability in the future and is being incorporated into some country’s environmental rules and leading companies environmental reporting.
The results show the United States securely in last place for this metric. Two factors probably contribute to this performance. The country has been blessed with very cheap energy, especially natural gas, that has reduced the economic drive to conserve energy. Natural gas in the United States is so cheap that it’s being flared at the wellhead in places without infrastructure for distribution.
Source: FisherSolve Next ©2020 Fisher International, Inc. Source: FisherSolve Next ©2020 Fisher International, Inc.

The higher cost of energy per tonne required for TAD production also plays a part in this analysis. However, the reduced fibre weight of a case of the equivalent product was not considered by this curve. The United States tissue industry should expect pressure from both international activists and domestic consumers if this performance continues.
Figure 16 provides another look at energy use by tissue mill configuration in the United States. Both advanced and conventional technology are shown in the bars for the integrated and non-integrated mills.
Advanced technology has a higher energy cost per tonne as expected. However, the potential advantage of virgin integrated mills with on-site bioenergy potential is clearly shown for both types of tissue technology.
So far, this analysis doesn’t show where competition is going or why the number of American tissue producers has increased instead of consolidating.
Porter's Five Forces analysis of market competition provides some ideas.


