
2023 county Kootenai MarketReport MonthlyMarketReportforKootenaiCounty August 2023
Monthly Mortgage Rates

Average Sales Price Current Listing Inventory Average Days On Market $724,785 Up 6.0% Median Sales Price $550,000 Up 2.2% 1,283 Up 2.6 % 287 Down 17.3% Closed Sales 81 Up 15.7% 2,027 Down 17.6% Annual Residential Sales Kootenai County Market Report | August 2023 2 81 85 95 99 109 104 101 85 79 78 76 81 50 60 70 80 90 100 110 120 Sep '22 Oct '22 Nov '22 Dec '22 Jan '23 Feb '23 Mar '23 Apr '23 May '23 June '23 July '23 Aug '23 Average Days On Market 12 - month comparison, highlighting current month.
Monthly 30 - year fixed mortgage rates highlighting the week ending Thursday, August 31, 2023. 5.66% 6.70% 7.08% 6.49% 6.42% 6.13% 6.50% 6.32% 6.43% 6.79% 6.71% 6.81% 7.18% 5.00% 5.50% 6.00% 6.50% 7.00% 7.50% Aug '22 Sep '22 Oct '22 Nov '22 Dec '22 Jan '23 Feb '23 Mar '23 Apr '23 May '23 June '23 July '23 Aug '23 Information pulled on 09/05/2023 The information in this report is compiled from a report given by the Coeur d’Alene Association of REALTORS® and to the best of our knowledge is accurate and current.
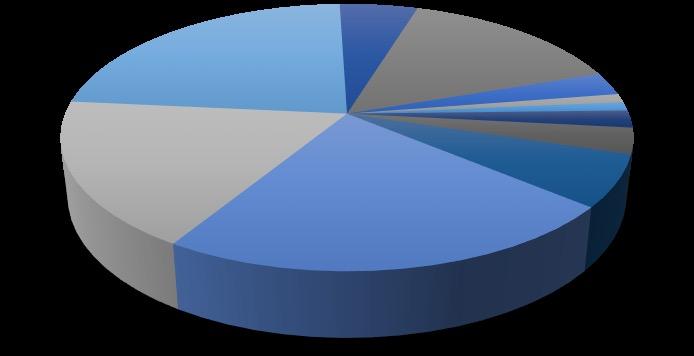
Active Listings By Price Range
0-$150K$150-200K200K-$250K$250K-300K$300K-$350K$350K-$400K$400K-$500K$500K-$600K$600K-$800K$800K-$1M
Sold Listings By Price Range

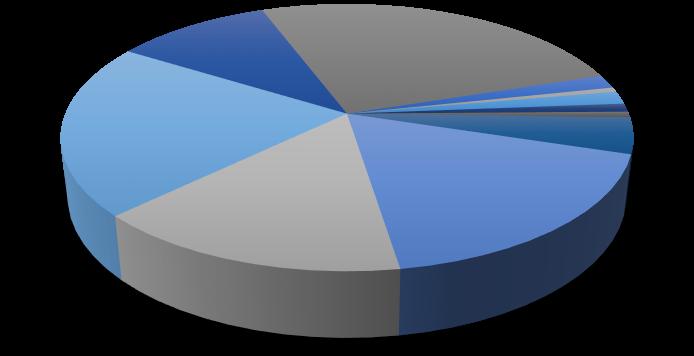
0-$150K$150-200K200K-$250K$250K-300K$300K-$350K$350K-$400K$400K-$500K$500K-$600K$600K-$800K$800K-$1M

Kootenai County Market Report | August 2023 3
As of 8/15/2023, month/year comparison.
Active Residential Listings
Year - over - year comparison as of 8/15/2023. 1187 1160 1005 860 720 673 754 873 1015 1167 1216 1283 600 800 1000 1200 1400 Sep '22 Oct '22 Nov '22 Dec '22 Jan '23 Feb '23 Mar '23 Apr '23 May '23 June '23 July '23 Aug '23 25 16 9 19 23 72 186 185 258 168 291 21 7 20 13 9 56 227 196 270 134 330 0 50 100 150 200 250 300 350
$1M+ 2022 2023 0-$150K 2% $150-200K 0% 200K-$250K 2% $250K-300K 1% $300K-$350K 1% $350K-$400K 4% $400K-$500K 18% $500K-$600K 15% $600K-$800K 21% $800K-$1M 10% $1M+ 26%
Year - over - year comparison for the month of August. 11 3 3 7 13 25 94 59 59 29 44 8 3 3 6 9 18 65 51 66 15 43 0 20 40 60 80 100
$1M+ 2022 2023 0-$150K 3% $150-200K 1% 200K-$250K 1% $250K-300K 2% $300K-$350K 3% $350K-$400K 6% $400K-$500K 23% $500K-$600K 18% $600K-$800K 23% $800K-$1M 5% $1M+ 15%
cbspokane.com
TheinformationinthisreportiscompiledfromareportgivenbytheCoeurd’AleneAssociationofREALTORS®andtothebestofourknowledgeisaccurateandcurrent. ©ColdwellBankerRealEstateLLC.AllRightsReserved.ColdwellBanker®andtheColdwellBankerLogoareregisteredservicemarksownedbyColdwellBankerRealEstate LLC.ColdwellBankerRealEstateLLCfullysupportstheprinciplesoftheFairHousingActandtheEqualOpportunityAct.Eachof ceisindependentlyownedandoperated. Notintendedasasolicitationifyourpropertyisalreadylistedbyanotherbroker.Informationdeemedreliablebutnotguaranteedandshouldbeindependentlyveri ed.
