
2023 county Kootenai MarketReport MonthlyMarketReportforKootenaiCounty July 2023
Monthly Mortgage Rates

Average Sales Price Current Listing Inventory Average Days On Market $673,887 Down 4.2% Median Sales Price $557,000 Down 0. 5 % 1,216 Down 1. 5 % 301 Up 8.7% Closed Sales 76 Up 13. 4 % 1,721 Down 18. 6 % Annual Residential Sales Kootenai County Market Report | July 2023 2 71 81 85 95 99 109 104 101 85 79 78 76 50 60 70 80 90 100 110 120 Aug '22 Sep '22 Oct '22 Nov '22 Dec '22 Jan '23 Feb '23 Mar '23 Apr '23 May '23 June '23 July '23 Average Days On Market 12 - month comparison, highlighting current month.
Monthly 30 - year fixed mortgage rates highlighting the week ending Thursday, July 27, 2023. 5.30% 5.66% 6.70% 7.08% 6.49% 6.42% 6.13% 6.50% 6.32% 6.43% 6.79% 6.71% 6.81% 5.00% 5.50% 6.00% 6.50% 7.00% July '22 Aug '22 Sep '22 Oct '22 Nov '22 Dec '22 Jan '23 Feb '23 Mar' 23 Apr' 23 May' 23 June' 23 July' 23 Information pulled on 08/01/2023 The information in this report is compiled from a report given by the Coeur d’Alene Association of REALTORS® and to the best of our knowledge is accurate and current.
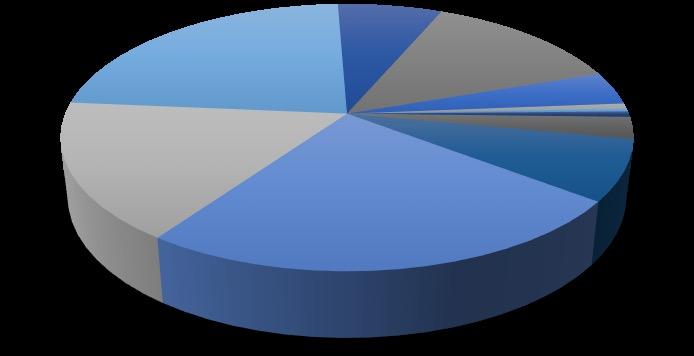
Active Listings By Price Range
0-$150K$150-200K200K-$250K$250K-300K$300K-$350K$350K-$400K$400K-$500K$500K-$600K$600K-$800K$800K-$1M
Sold Listings By Price Range

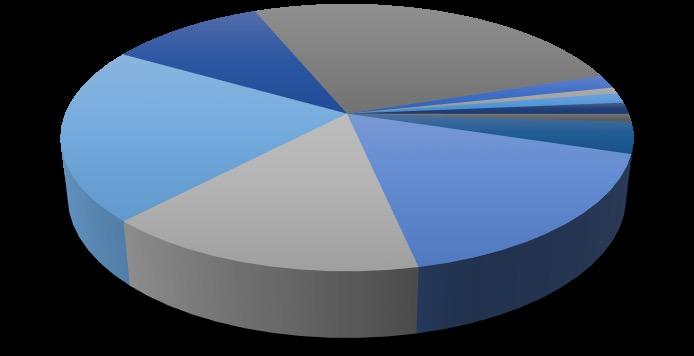
0-$150K$150-200K200K-$250K$250K-300K$300K-$350K$350K-$400K$400K-$500K$500K-$600K$600K-$800K$800K-$1M

Kootenai County Market Report | July 2023 3
As of 7/15/2023 , month/year comparison.
Active Residential Listings
Year - over - year comparison as of 7/15/2023 . 1234 1187 1160 1005 860 720 673 754 873 1015 1167 1216 200 400 600 800 1000 1200 1400 Aug '22 Sep '22 Oct '22 Nov '22 Dec '22 Jan '23 Feb '23 Mar '23 Apr '23 May '23 June '23 July '23 25 12 7 21 18 56 203 187 250 165 290 20 9 15 17 12 46 205 188 258 127 319 0 50 100 150 200 250 300 350
$1M+ 2022 2023 0-$150K 2% $150-200K 1% 200K-$250K 1% $250K-300K 1% $300K-$350K 1% $350K-$400K 4% $400K-$500K 17% $500K-$600K 16% $600K-$800K 21% $800K-$1M 10% $1M+ 26%
Year - over - year comparison for the month of July. 10 6 3 1 7 23 48 54 60 31 34 12 2 1 2 8 22 73 50 69 21 40 0 20 40 60 80 100
$1M+ 2022 2023 0-$150K 4% $150-200K 1% 200K-$250K 0% $250K-300K 1% $300K-$350K 3% $350K-$400K 7% $400K-$500K 24% $500K-$600K 17% $600K-$800K 23% $800K-$1M 7% $1M+ 13%
cbspokane.com
TheinformationinthisreportiscompiledfromareportgivenbytheCoeurd’AleneAssociationofREALTORS®andtothebestofourknowledgeisaccurateandcurrent. ©ColdwellBankerRealEstateLLC.AllRightsReserved.ColdwellBanker®andtheColdwellBankerLogoareregisteredservicemarksownedbyColdwellBankerRealEstate LLC.ColdwellBankerRealEstateLLCfullysupportstheprinciplesoftheFairHousingActandtheEqualOpportunityAct.Eachof ceisindependentlyownedandoperated. Notintendedasasolicitationifyourpropertyisalreadylistedbyanotherbroker.Informationdeemedreliablebutnotguaranteedandshouldbeindependentlyveri ed.
