
2023 county Kootenai MarketReport MonthlyMarketReportforKootenaiCounty March 2023
Monthly Mortgage Rates

Average Sales Price Current Listing Inventory Average Days On Market $647,723 Down 0. 8 % Median Sales Price $500,000 Down 9. 1 % 754 Up 89. 9 % 245 Down 24.4% Closed Sales 101 Up 60. 3 % 578 Down 28. 3 % Annual Residential Sales Kootenai County Market Report | March 2023 2 60 59 57 66 71 81 85 95 99 109 104 101 50 60 70 80 90 100 110 120 Apr '22 May '22 June '22 July '22 Aug '22 Sep '22 Oct '22 Nov '22 Dec '22 Jan '23 Feb '23 Mar '23 Average Days On Market 12 - month comparison, highlighting current month.
Monthly 30 - year fixed mortgage rates highlighting the week ending Thursday, March 30, 2023. 4.67% 5.10% 5.10% 5.70% 5.30% 5.66% 6.70% 7.08% 6.49% 6.42% 6.13% 6.50% 6.32% 2.50% 3.25% 4.00% 4.75% 5.50% 6.25% 7.00% Mar '22 Apr '22 May '22 June '22 July '22 Aug '22 Sep '22 Oct '22 Nov '22 Dec '22 Jan '23 Feb '23 Mar' 23 Information pulled on 04/05/2023 The information in this report is compiled from a report given by the Coeur d’Alene Association of REALTORS® and to the best of our knowledge is accurate and current.
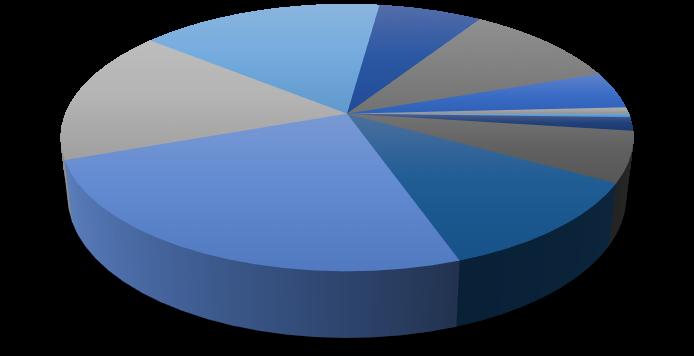
Active Listings By Price Range
0-$150K$150-200K200K-$250K$250K-300K$300K-$350K$350K-$400K$400K-$500K$500K-$600K$600K-$800K$800K-$1M
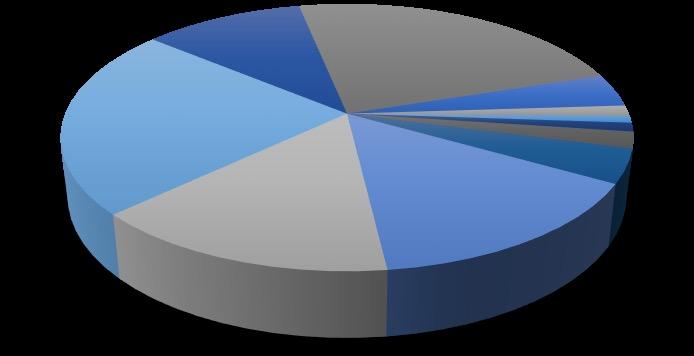
Sold Listings By Price Range

0-$150K$150-200K200K-$250K$250K-300K$300K-$350K$350K-$400K$400K-$500K$500K-$600K$600K-$800K$800K-$1M

Kootenai County Market Report | March 2023 3
As of 3/15/2023 , month/year comparison.
Active Residential Listings
Year - over - year comparison as of 3/15/2023 . 511 681 936 1204 1234 1187 1160 1005 860 720 673 754 200 400 600 800 1000 1200 1400 Apr '22 May '22 June '22 July '22 Aug '22 Sep '22 Oct '22 Nov '22 Dec '22 Jan '23 Feb '23 Mar '23 10 8 3 5 5 5 36 82 72 48 123 30 10 6 8 15 31 112 112 174 81 175 0 25 50 75 100 125 150 175
$1M+ 2022 2023 0-$150K 4% $150-200K 1% 200K-$250K 1% $250K-300K 1% $300K-$350K 2% $350K-$400K 4% $400K-$500K 15% $500K-$600K 15% $600K-$800K 23% $800K-$1M 11% $1M+ 23%
Year - over - year comparison for the month of March. 10 5 9 3 7 8 67 86 71 23 35 11 2 1 4 15 28 61 40 40 17 26 0 20 40 60 80 100
$1M+ 2022 2023 0-$150K 5% $150-200K 1% 200K-$250K 0% $250K-300K 2% $300K-$350K 6% $350K-$400K 11% $400K-$500K 25% $500K-$600K 16% $600K-$800K 16% $800K-$1M 7% $1M+ 11%
cbspokane.com
TheinformationinthisreportiscompiledfromareportgivenbytheCoeurd’AleneAssociationofREALTORS®andtothebestofourknowledgeisaccurateandcurrent. ©ColdwellBankerRealEstateLLC.AllRightsReserved.ColdwellBanker®andtheColdwellBankerLogoareregisteredservicemarksownedbyColdwellBankerRealEstate LLC.ColdwellBankerRealEstateLLCfullysupportstheprinciplesoftheFairHousingActandtheEqualOpportunityAct.Eachof ceisindependentlyownedandoperated. Notintendedasasolicitationifyourpropertyisalreadylistedbyanotherbroker.Informationdeemedreliablebutnotguaranteedandshouldbeindependentlyveri ed.
