
2023 county Kootenai MarketReport MonthlyMarketReportforKootenaiCounty September 2023
Monthly Mortgage Rates

Average Sales Price Current Listing Inventory Average Days On Market $737,869 Up 8. 0 % Median Sales Price $550,000 Up 4. 8 % 1,317 Up 9. 1 % 255 Down 23. 0 % Closed Sales 88 Up 8. 6 % 2,289 Down 18. 0 % Annual Residential Sales Kootenai County Market Report | September 2023 2 85 95 99 109 104 101 85 79 78 76 81 88 50 60 70 80 90 100 110 120 Oct '22 Nov '22 Dec '22 Jan '23 Feb '23 Mar '23 Apr '23 May '23 June '23 July '23 Aug '23 Sep '23 Average Days On Market 12 - month comparison, highlighting current month.
Monthly 30 - year fixed mortgage rates highlighting the week ending Thursday, September 28, 2023. 6.70% 7.08% 6.49% 6.42% 6.13% 6.50% 6.32% 6.43% 6.79% 6.71% 6.81% 7.18% 7.31% 6.00% 6.25% 6.50% 6.75% 7.00% 7.25% 7.50% Sep '22 Oct '22 Nov '22 Dec '22 Jan '23 Feb '23 Mar '23 Apr '23 May '23 June '23 July '23 Aug '23 Sep '23 Information pulled on 10/03/2023 The information in this report is compiled from a report given by the Coeur d’Alene Association of REALTORS® and to the best of our knowledge is accurate and current.
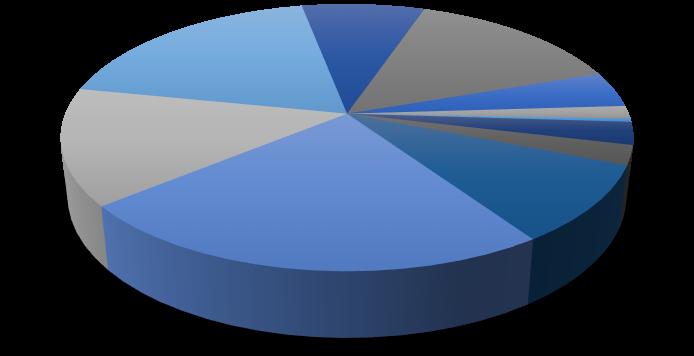
Active Listings By Price Range
0-$150K$150-200K200K-$250K$250K-300K$300K-$350K$350K-$400K$400K-$500K$500K-$600K$600K-$800K$800K-$1M
Sold Listings By Price Range

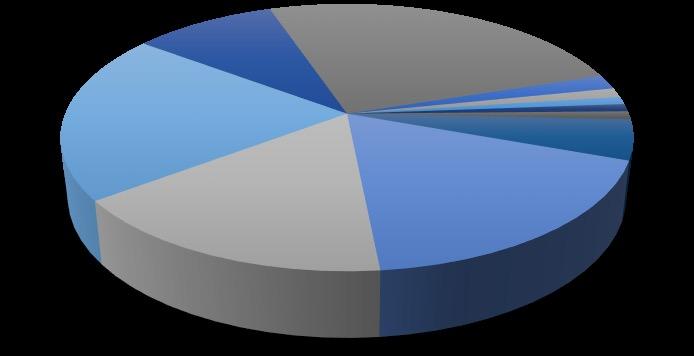
0-$150K$150-200K200K-$250K$250K-300K$300K-$350K$350K-$400K$400K-$500K$500K-$600K$600K-$800K$800K-$1M

Kootenai County Market Report | September 2023 3
As of 9/15/2023 , month/year comparison.
Active Residential Listings
Year - over - year comparison as of 9/15/2023 . 1160 1005 860 720 673 754 873 1015 1167 1216 1283 1317 600 800 1000 1200 1400 Oct '22 Nov '22 Dec '22 Jan '23 Feb '23 Mar '23 Apr '23 May '23 June '23 July '23 Aug '23 Sep '23 32 10 8 15 24 90 168 177 236 168 279 23 15 12 12 13 64 236 214 271 126 332 0 50 100 150 200 250 300 350
$1M+ 2022 2023 0-$150K 2% $150-200K 1% 200K-$250K 1% $250K-300K 1% $300K-$350K 1% $350K-$400K 5% $400K-$500K 18% $500K-$600K 16% $600K-$800K 21% $800K-$1M 9% $1M+ 25%
Year - over - year comparison for the month of Septembe r . 14 6 4 9 7 37 73 53 60 24 44 11 4 1 7 6 24 60 36 48 21 37 0 20 40 60 80 100
$1M+ 2022 2023 0-$150K 4% $150-200K 2% 200K-$250K 0% $250K-300K 3% $300K-$350K 2% $350K-$400K 9% $400K-$500K 24% $500K-$600K 14% $600K-$800K 19% $800K-$1M 8% $1M+ 15%
cbspokane.com
TheinformationinthisreportiscompiledfromareportgivenbytheCoeurd’AleneAssociationofREALTORS®andtothebestofourknowledgeisaccurateandcurrent. ©ColdwellBankerRealEstateLLC.AllRightsReserved.ColdwellBanker®andtheColdwellBankerLogoareregisteredservicemarksownedbyColdwellBankerRealEstate LLC.ColdwellBankerRealEstateLLCfullysupportstheprinciplesoftheFairHousingActandtheEqualOpportunityAct.Eachof ceisindependentlyownedandoperated. Notintendedasasolicitationifyourpropertyisalreadylistedbyanotherbroker.Informationdeemedreliablebutnotguaranteedandshouldbeindependentlyveri ed.
