
2023 county Spokane MarketReport MonthlyMarketReportforSpokaneCounty April 2023
The information in this report is compiled from a report given by the Spokane Association of REALTORS® and to the best of our knowledge is accurate and current.
Median Days On Market
As of 5/1/2023. By month dating from January 2019 to April 2023. Days on Market is the median number of days between when a property is listed and the contract date.
Annual Median Sales Price

Year - to - date as of April. Median Sales Price is the mid - point (median) value where the price for half of the closed sales is higher and half is lower.

$220 $245 $277 $337 $413 $396 $200K $250K $300K $350K $400K $450K 2018 2019 2020 2021 2022 2023 Average Sales Price Current Listing Inventory Median Days On Market $427,101 Up 0.9% from prior month Down 4.2% from prior year Median Sales Price $415,000 Up 3.8% from prior month Down 2.4% from prior year 658 Up 6.1% from prior month Up 56.7% from
year 377 Down 21.5% from
month Down 38.1% from
year Residential Closed Sales 6 Down 14.3% from prior month Up 50.0% from
year
Down 26.7% from prior year Annual Residential Closed Sales Spokane County Market Report | December 2022 2 Information pulled on 05/01/2023
prior
prior
prior
prior
1,460
28 24 19 17 18 20 23 14 9 12 15 17 12 5 4 6 5 4 5 5 5 6 6 5 4 3 4 4 4 4 5 5 5 7 8 7 4 4 4 4 5 6 10 14 17 16 22 31 23 9 7 6 0 10 20 30 40 50 2019-01 2019-04 2019-07 2019-10 2020-01 2020-04 2020-07 2020-10 2021-01 2021-04 2021-07 2021-10 2022-01 2022-04 2022-07 2022-10 2023-01 2023-04
Spokane County Market Report | April 2023 2
Months Supply of Inventory
As of 5/1/2023. By month dating from January 2019 to April 2023. Months Supply of Inventory is the number of months it would take to sell the available inventory at the current rate.
Sale-to-List Price Ratio


As of 5/1/2023. By month dating from January 2019 to April 2023. Sale - to - List Price Ratio is the average of sales price divided by the final list price expressed as a percentage.
Monthly Mortgage Rates
Monthly 30 - year fixed mortgage rates highlighting the week ending Thursday, April 27, 2023.
2.3 2 1.9 1.9 1.8 1.8 1.7 1.3 1.4 1.2 1.4 0.9 1.3 1.2 1.2 1.3 1.3 0.8 0.7 0.7 0.7 0.6 0.5 0.3 0.5 0.4 0.4 0.4 0.4 0.4 0.6 0.6 0.8 0.8 0.6 0.4 0.5 0.6 0.5 0.7 0.8 1.1 1.7 1.6 1.8 2.1 2.1 1.7 2.3 2 1.3 1.7 0 0.3 0.6 0.9 1.2 1.5 1.8 2.1 2.4 2019-01 2019-04 2019-07 2019-10 2020-01 2020-04 2020-07 2020-10 2021-01 2021-04 2021-07 2021-10 2022-01 2022-04 2020-07 2022-10 2023-01 2023-04
99.6% 101.3% 101.2% 100.3% 99.4% 101.3% 101.5% 101.7% 101.2% 105.4% 105.3% 103.0% 101.4% 105.0% 101.2% 99.4% 98.7% 99.8% 98.0% 99.0% 100.0% 101.0% 102.0% 103.0% 104.0% 105.0% 106.0% 2019-01 2019-04 2019-07 2019-10 2020-01 2020-04 2020-07 2020-10 2021-01 2021-04 2021-07 2021-10 2022-01 2022-04 2022-07 2022-10 2023-01 2023-04 Spokane County Market Report | April 2023 3
5.10% 5.10% 5.70% 5.30% 5.66% 6.70% 7.08% 6.49% 6.42% 6.13% 6.50% 6.32% 6.43% 4.50% 5.25% 6.00% 6.75% 7.50% Apr '22 May '22 June '22 July '22 Aug '22 Sep '22 Oct '22 Nov '22 Dec '22 Jan '23 Feb '23 Mar '23 Apr '23
Active Residential Listings
As of 5/1/2023. By month dating from January 2019 to April 2023. Active Inventory is the number of properties for sales at the end of the month, based on the contract date.
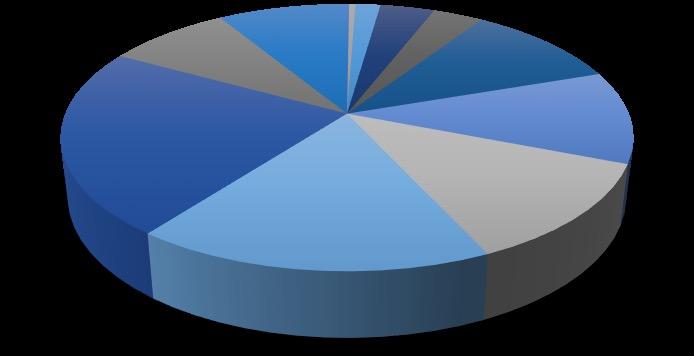
Active Listings By Price Range
0-$150K$150-200K200K-$250K$250K-300K$300K-$350K$350K-$400K$400K-$450K$450K-$500K$500K-$600K$600K-$800K$800K-$1M
New Residential Listings
As of 5/1/2023. By month dating from January 2019 to April 2023.
the number of properties listed regardless of current status.


Spokane County Market Report | April 2023 4
As of 5/1/2023. 838 1090 1437 1053 583 709 677 521 225 276 500 563 224 412 1008 1048 566 658 0 200 400 600 800 1000 1200 1400 1600 2019-01 2019-04 2019-07 2019-10 2020-01 2020-04 2020-07 2020-10 2021-01 2021-04 2021-07 2021-10 2022-01 2022-04 2022-07 2022-10 2023-01 2023-04 21 7 10 26 23 26 39 47 67 82 49 56 1 3 12 26 24 75 80 87 123 162 59 62 0 30 60 90 120 150 180
$1M+ 2022 2023 0-$150K 0% $150-200K 0% 200K-$250K 2% $250K-300K 4% $300K-$350K 3% $350K-$400K 11% $400K-$450K 11% $450K-$500K 12% $500K-$600K 17% $600K-$800K 23% $800K-$1M 8% $1M+ 9%
Listings is
614 976 1055 819 638 686 1001 805 509 782 981 789 483 861 1001 658 517 748 200 400 600 800 1000 1200 2019-01 2019-04 2019-07 2019-10 2020-01 2020-04 2020-07 2020-10 2021-01 2021-04 2021-07 2021-10 2022-01 2022-04 2022-07 2022-10 2023-01 2023-04
New
Residential
Closed Sales
As of 5/1/2023. By month dating from January 2019 to April 2023.
Sold Listings By Price Range
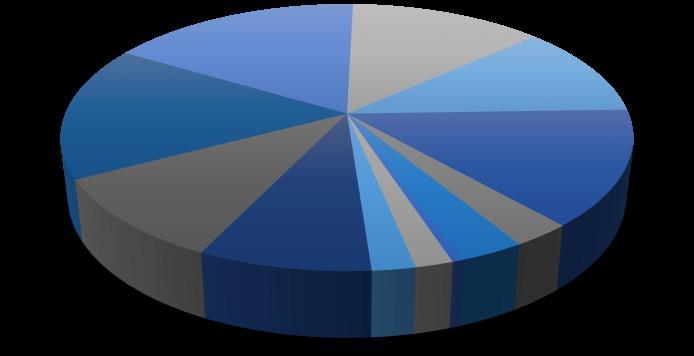
Year - over - year comparison for the month of April.
0-$150K$150-200K200K-$250K$250K-300K$300K-$350K$350K-$400K$400K-$450K$450K-$500K$500K-$600K$600K-$800K$800K-$1M
Annual Residential Closed Sales
Spokane County Market Report | April 2023 5
Closed Sales is the number of properties sold. 368 574 860 851 458 548 928 870 465 654 849 732 432 607 604 456 250 452 377 200 300 400 500 600 700 800 900 1000 2019-01 2019-04 2019-07 2019-10 2020-01 2020-04 2020-07 2020-10 2021-01 2021-04 2021-07 2021-10 2022-01 2022-04 2022-07 2022-10 2023-01 2023-04
Year - to - date as of April. Closed Sales is the number of properties sold. 2107 1811 2047 2165 1992 1460 1200 1400 1600 1800 2000 2200 2400 2018 2019 2020 2021 2022 2023 19 19 20 51 68 72 81 76 75 93 27 17 2 7 8 32 39 63 65 50 43 54 11 12 0 20 40 60 80 100
$1M+ 2022 2023 0-$150K 1% $150-200K 2% 200K-$250K 2% $250K-300K 8% $300K-$350K 10% $350K-$400K 16% $400K-$450K 17% $450K-$500K 13% $500K-$600K 11% $600K-$800K 14% $800K-$1M 3%
Annual Residential Closed Sales
Annual Median Sales Price
Median Price Per Square Foot
As of 5/1/2023. Monthly Re - Sale vs New Construction comparison. Price per Square Foot is the mid - point (median) PPSF of all closed listings.
242 230 322 342 277 238 1865 1581 1725 1823 1715 1222 0 400 800 1200 1600 2000 2400 2018 2019 2020 2021 2022 2023 New Re-Sale
Year - to - date Re - Sale vs New Construction as of April. Closed Sales is the number of properties sold.
Year - to - date Re - Sale vs New Construction as of April. Sales Price is the mid - point (median) value where the price for half of the closed sales is higher and half is lower. $210 $231 $263 $323 $390 $370 $325 $355 $344 $406 $495 $490 $150K $200K $250K $300K $350K $400K $450K $500K $550K 2018 2019 2020 2021 2022 2023 Re-Sale New
$218 $221 $206 $206 $202 $195 $193 $182 $181 $190 $198 $205 $265 $269 $270 $267 $267 $258 $256 $256 $241 $266 $250 $247 $150 $175 $200 $225 $250 $275 $300 May '22 June '22 July '22 Aug '22 Sep '22 Oct '22 Nov '22 Dec '22 Jan '23 Feb '23 Mar '23 Apr '23 Re-Sale New Spokane County Market Report | April 2023 6


cbspokane.com
TheinformationinthisreportiscompiledfromareportgivenbytheSpokaneAssociationofREALTORS®andtothebestofourknowledgeisaccurateandcurrent.
©ColdwellBankerRealEstateLLC.AllRightsReserved.ColdwellBanker®andtheColdwellBankerLogoareregisteredservicemarksownedbyColdwellBankerRealEstate LLC.ColdwellBankerRealEstateLLCfullysupportstheprinciplesoftheFairHousingActandtheEqualOpportunityAct.Eachof ceisindependentlyownedandoperated. Notintendedasasolicitationifyourpropertyisalreadylistedbyanotherbroker.Informationdeemedreliablebutnotguaranteedandshouldbeindependentlyveri ed.
