
2023 county Spokane MarketReport MonthlyMarketReportforSpokaneCounty August 2023
The information in this report is compiled from a report given by the Spokane Association of REALTORS® and to the best of our knowledge is accurate and current.
Median Days On Market
As of 9/5/2023 . By month dating from January 2019 to August 2023. Days on Market is the median number of days between when a property is listed and the contract date.
Annual Median Sales Price
Year - to - date as of August.

Median Sales Price is the mid - point (median) value where the price for half of the closed sales is higher and half is lower.

$234 $260 $290 $365 $425 $410 $200K $250K $300K $350K $400K $450K 2018 2019 2020 2021 2022 2023 Average Sales Price Current Listing Inventory Median Days On Market $453,519 Down 1.6% from prior month Up 2.1% from prior year Median Sales Price $420,000 Eve n 0.0% from prior month Up 0.9% from prior year 1,064 Up 1.9% from prior month Down 2.3% from
year 522 U p 4. 6 % from prior month Down 22.4% from prior year Residential Closed Sales 14 Up 12. 5 % from prior month Up 3. 8 % from prior year 3,760 Down 20.3% from prior year Annual Residential Closed Sales Spokane County Market Report | December 2022 2 Information pulled on 09/05/2023
prior
28 24 19 17 18 20 23 14 9 12 15 17 12 5 4 6 5 4 5 5 5 6 6 5 4 3 4 4 4 4 5 5 5 7 8 7 4 4 4 4 5 6 10 14 17 16 22 31 23 9 7 6 7 8 12 14 0 10 20 30 40 50 2019-01 2019-04 2019-07 2019-10 2020-01 2020-04 2020-07 2020-10 2021-01 2021-04 2021-07 2021-10 2022-01 2022-04 2022-07 2022-10 2023-01 2023-04 2023-07
Spokane County Market Report | August 2023 2
Months Supply of Inventory
As of 9/5/2023 . By month dating from January 2019 to August 2023. Months Supply of Inventory is the number of months it would take to sell the available inventory at the current rate.
Sale-to-List Price Ratio


As of 9 /5/2023 . By month dating from January 2019 to August 2023.
is the average of sales price divided by the final list price expressed as a percentage.
Monthly Mortgage Rates
2.3 2 1.91.91.81.81.7 1.31.41.21.4 0.9 1.31.21.21.31.3 0.80.70.70.70.60.5 0.30.50.40.40.40.40.40.60.6 0.80.8 0.60.40.50.60.50.70.8 1.1 1.71.61.8 2.12.1 1.7 2.3 2 1.3 1.7 1.5 1.7 2.3 2 0 0.3 0.6 0.9 1.2 1.5 1.8 2.1 2.4 2019-01 2019-04 2019-07 2019-10 2020-01 2020-04 2020-07 2020-10 2021-01 2021-04 2021-07 2021-10 2022-01 2022-04 2020-07 2022-10 2023-01 2023-04 2023-07
99.6% 101.3% 101.2% 100.3% 99.4% 101.3% 101.5% 101.7% 101.2% 105.4% 105.3% 103.0% 101.4% 105.0% 101.2% 99.4% 98.7% 99.8% 99.8% 99.7% 98.0% 99.0% 100.0% 101.0% 102.0% 103.0% 104.0% 105.0% 106.0% 2019-012019-042019-072019-102020-012020-042020-072020-102021-012021-042021-072021-102022-012022-042022-072022-102023-012023-042023-07 Spokane County Market Report | August 2023 3
Sale - to - List Price
Ratio
Monthly 30 - year fixed mortgage rates highlighting the week ending Thursday, August 31, 2023. 5.66% 6.70% 7.08% 6.49% 6.42% 6.13% 6.50% 6.32% 6.43% 6.79% 6.71% 6.81% 7.18% 5.00% 5.50% 6.00% 6.50% 7.00% 7.50% Aug '22 Sep '22 Oct '22 Nov '22 Dec '22 Jan '23 Feb '23 Mar '23 Apr '23 May '23 June '23 July '23 Aug '23
Active Residential Listings


As of 9/5/2023 . By month dating from January 2019 to August 2023. Active Inventory is the number of properties for sales at the end of the month, based on the contract date.
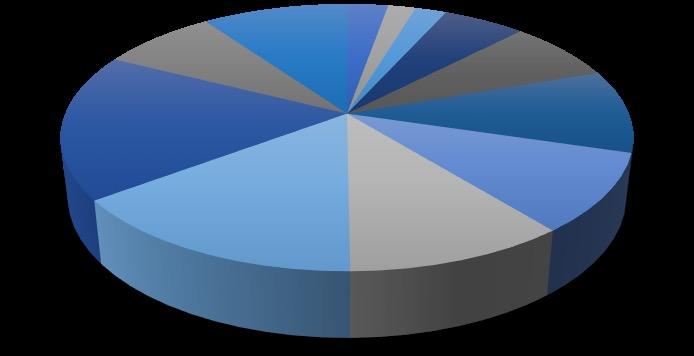
Active Listings By Price Range
0-$150K$150-200K200K-$250K$250K-300K$300K-$350K$350K-$400K$400K-$450K$450K-$500K$500K-$600K$600K-$800K$800K-$1M
New Residential Listings
As of 9 /5/2023 . By month dating from January 2019 to August 2023. New Listings is the number of properties listed regardless of current status
Spokane County Market Report | August 2023 4
As of 9 /5/2023 838 1090 1437 1053 583 709 677 521 225 276 500 563 224 412 1008 1048 566 658 1,014 1064 0 200 400 600 800 1000 1200 1400 1600 2019-01 2019-04 2019-07 2019-10 2020-01 2020-04 2020-07 2020-10 2021-01 2021-04 2021-07 2021-10 2022-01 2022-04 2022-07 2022-10 2023-01 2023-04 2023-07 28 21 43 89 115 144 136 115 187 233 90 88 37 25 28 74 99 135 128 143 200 238 104 131 0 30 60 90 120 150 180 210 240 270
$1M+ 2022 2023 0-$150K 3% $150-200K 2% 200K-$250K 2% $250K-300K 5% $300K-$350K 7% $350K-$400K 10% $400K-$450K 9% $450K-$500K 11% $500K-$600K 15% $600K-$800K 18% $800K-$1M 8% $1M+ 10%
614 976 1055 819 638 686 1001 805 509 782 981 789 483 861 1001 658 517 748 798 805 200 400 600 800 1000 1200 2019-01 2019-04 2019-07 2019-10 2020-01 2020-04 2020-07 2020-10 2021-01 2021-04 2021-07 2021-10 2022-01 2022-04 2022-07 2022-10 2023-01 2023-04 2023-07
Residential
Closed Sales
As of 9 /5/2023 . By month dating from January 2019 to August 2023.
Sold Listings By Price Range
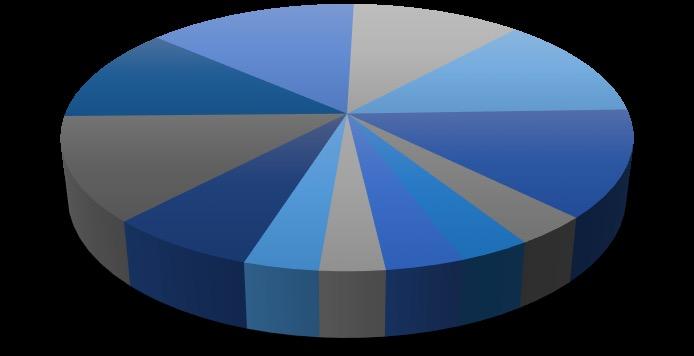
Year - over - year comparison for the month of August.
0-$150K$150-200K200K-$250K$250K-300K$300K-$350K$350K-$400K$400K-$450K$450K-$500K$500K-$600K$600K-$800K$800K-$1M
Annual Residential Closed Sales
Spokane County Market Report | August 2023 5
Closed Sales is
number
properties
368 574 860 851 458 548 928 870 465 654 849 732 432 607 604 456 250 377 444 522 200 300 400 500 600 700 800 900 1000 2019-01 2019-04 2019-07 2019-10 2020-01 2020-04 2020-07 2020-10 2021-01 2021-04 2021-07 2021-10 2022-01 2022-04 2022-07 2022-10 2023-01 2023-042023-07
the
of
sold.
Year - to - date as of August. Closed Sales is the number of properties sold. 5641 5014 5083 5324 4720 3760 3000 3400 3800 4200 4600 5000 5400 5800 2018 2019 2020 2021 2022 2023 24 13 22 71 97 98 69 94 82 86 24 19 24 20 23 46 81 75 90 73 81 83 23 22 0 20 40 60 80 100 120 140
$1M+ 2022 2023 0-$150K 4% $150-200K 3% 200K-$250K 3% $250K-300K 7% $300K-$350K 13% $350K-$400K 12% $400K-$450K 14% $450K-$500K 11% $500K-$600K 13% $600K-$800K 13% $800K-$1M 4%
Annual Residential Closed Sales
Annual Median Sales Price
Median Price Per Square Foot
As of 9/5/2023 . Monthly Re - Sale vs New Construction comparison. Price per Square Foot is the mid - point (median) PPSF of all closed listings.
569 543 659 679 556 531 5072 4471 4424 4645 4164 3229 0 1000 2000 3000 4000 5000 6000 2018 2019 2020 2021 2022 2023 New Re-Sale
- to - date Re - Sale vs New Construction
of August. Closed Sales is the number of properties sold.
Year
as
the
point
$224 $250 $278 $355 $410 $395 $327 $350 $356 $432 $500 $480 $150K $200K $250K $300K $350K $400K $450K $500K $550K 2018 2019 2020 2021 2022 2023 Re-Sale New
Year - to - date Re - Sale vs New Construction as of August. Sales Price is
mid -
(median) value where the price for half of the closed sales is higher and half is lower.
$202 $195 $193 $182 $181 $190 $197 $203 $209 $205 $211 $202 $267 $258 $256 $256 $241 $266 $250 $243 $266 $258 $270 $256 $150 $175 $200 $225 $250 $275 $300 Sep '22 Oct '22 Nov '22 Dec '22 Jan '23 Feb '23 Mar '23 Apr '23 May '23 June '23 July '23 Aug '23 Re-Sale New Spokane County Market Report | August 2023 6
Exciting updates to our First Time Homebuyer Loan Programs

Ø Lowered credit score requirements to 700
Ø Student loan debt calculated more favorably
Ø Still no mortgage insurance
Ø Still up to 100% financing (w/min $1000 and reserves)
Even Non-First Time Homebuyers can participate in this program with 5% down and minimum credit score of 720
cbspokane.com
TheinformationinthisreportiscompiledfromareportgivenbytheSpokaneAssociationofREALTORS®andtothebestofourknowledgeisaccurateandcurrent.
©ColdwellBankerRealEstateLLC.AllRightsReserved.ColdwellBanker®andtheColdwellBankerLogoareregisteredservicemarksownedbyColdwellBankerRealEstate LLC.ColdwellBankerRealEstateLLCfullysupportstheprinciplesoftheFairHousingActandtheEqualOpportunityAct.Eachof ceisindependentlyownedandoperated. Notintendedasasolicitationifyourpropertyisalreadylistedbyanotherbroker.Informationdeemedreliablebutnotguaranteedandshouldbeindependentlyveri ed.
