
2023 county Spokane MarketReport MonthlyMarketReportforSpokaneCounty July 2023
The information in this report is compiled from a report given by the Spokane Association of REALTORS® and to the best of our knowledge is accurate and current.
Median Days On Market
As of 8/1/2023 . By month dating from January 2019 to June 2023. Days on Market is the median number of days between when a property is listed and the contract date.
Annual Median Sales Price

Year - to - date as of July. Median Sales Price is the mid - point (median) value where the price for half of the closed sales is higher and half is lower.

$231 $259 $285 $360 $425 $410 $200K $250K $300K $350K $400K $450K 2018 2019 2020 2021 2022 2023 Average Sales Price Current Listing Inventory Median Days On Market $470,543 Up 1. 8 % from prior month U p 1.9% from prior year Median Sales Price $ 429,950 Up 1. 2 % from prior month Up 2. 4 % from prior year 1,014 Up 5 .3 % from prior month Down 5. 0 % from prior year 444 Down 27. 8 % from prior month Down 27.3% from prior year Residential Closed Sales 12 Up 50.0% from prior month Up 20. 0 % from prior year 3,17 6 Down 21.5% from prior year Annual Residential Closed Sales Spokane County Market Report | December 2022 2 Information
08/01/2023
pulled on
28 24 19 17 18 20 23 14 9 12 15 17 12 5 4 6 5 4 5 5 5 6 6 5 4 3 4 4 4 4 5 5 5 7 8 7 4 4 4 4 5 6 10 14 17 16 22 31 23 9 7 6 7 8 12 0 10 20 30 40 50 2019-01 2019-04 2019-07 2019-10 2020-01 2020-04 2020-07 2020-10 2021-01 2021-04 2021-07 2021-10 2022-01 2022-04 2022-07 2022-10 2023-01 2023-04 2023-07
Spokane County Market Report | July 2023 2
Months Supply of Inventory
As of 8/1/2023 . By month dating from January 2019 to July 2023. Months Supply of Inventory is the number of months it would take to sell the available inventory at the current rate.
Sale-to-List Price Ratio


As of 8/1/2023 . By month dating from January 2019 to July 2023.
Sale - to - List Price Ratio is the average of sales price divided by the final list price expressed as a percentage.
Monthly Mortgage Rates
Monthly 30 - year fixed mortgage rates highlighting the week ending Thursday, July 27, 2023.
2.3 2 1.9 1.9 1.8 1.8 1.7 1.3 1.4 1.2 1.4 0.9 1.3 1.2 1.2 1.3 1.3 0.8 0.7 0.7 0.7 0.6 0.5 0.3 0.5 0.4 0.4 0.4 0.4 0.4 0.6 0.6 0.8 0.8 0.6 0.4 0.5 0.6 0.5 0.7 0.8 1.1 1.7 1.6 1.8 2.1 2.1 1.7 2.3 2 1.3 1.7 1.5 1.7 2.3 0 0.3 0.6 0.9 1.2 1.5 1.8 2.1 2.4 2019-01 2019-04 2019-07 2019-10 2020-01 2020-04 2020-07 2020-10 2021-01 2021-04 2021-07 2021-10 2022-01 2022-04 2020-07 2022-10 2023-01 2023-04 2023-07
99.6% 101.3% 101.2% 100.3% 99.4% 101.3% 101.5% 101.7% 101.2% 105.4% 105.3% 103.0% 101.4% 105.0% 101.2% 99.4% 98.7% 99.8% 99.8% 98.0% 99.0% 100.0% 101.0% 102.0% 103.0% 104.0% 105.0% 106.0% 2019-01 2019-04 2019-07 2019-10 2020-01 2020-04 2020-07 2020-10 2021-01 2021-04 2021-07 2021-10 2022-01 2022-04 2022-07 2022-10 2023-01 2023-04 2023-07 Spokane County Market Report | July 2023 3
5.30% 5.66% 6.70% 7.08% 6.49% 6.42% 6.13% 6.50% 6.32% 6.43% 6.79% 6.71% 6.81% 5.00% 5.50% 6.00% 6.50% 7.00% 7.50% July '22 Aug '22 Sep '22 Oct '22 Nov '22 Dec '22 Jan '23 Feb '23 Mar '23 Apr '23 May '23 June '23 July '23
Active Residential Listings


As of 8/1/2023 . By month dating from January 2019 to July 2023. Active Inventory is the number of properties for sales at the end of the month, based on the contract date.
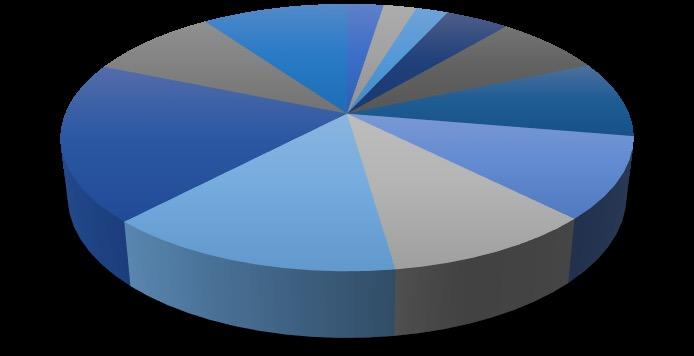
Active Listings By Price Range
0-$150K$150-200K200K-$250K$250K-300K$300K-$350K$350K-$400K$400K-$450K$450K-$500K$500K-$600K$600K-$800K$800K-$1M
New Residential Listings
As of 8/1/2023 . By month dating from January 2019 to July 2023. New Listings is the number of properties listed regardless of current status.
Spokane County Market Report | July 2023 4
As of 8/1/2023 838 1090 1437 1053 583 709 677 521 225 276 500 563 224 412 1008 1048 566 658 1,014 0 200 400 600 800 1000 1200 1400 1600 2019-01 2019-04 2019-07 2019-10 2020-01 2020-04 2020-07 2020-10 2021-01 2021-04 2021-07 2021-10 2022-01 2022-04 2022-07 2022-10 2023-01 2023-04 2023-07 31 23 27 65 108 134 137 133 183 246 92 99 32 29 28 56 96 121 129 133 187 252 116 128 0 30 60 90 120 150 180 210 240 270
$1M+ 2022 2023 0-$150K 3% $150-200K 2% 200K-$250K 2% $250K-300K 4% $300K-$350K 8% $350K-$400K 9% $400K-$450K 10% $450K-$500K 10% $500K-$600K 14% $600K-$800K 19% $800K-$1M 9% $1M+ 10%
614 976 1055 819 638 686 1001 805 509 782 981 789 483 861 1001 658 517 748 798 200 400 600 800 1000 1200 2019-01 2019-04 2019-07 2019-10 2020-01 2020-04 2020-07 2020-10 2021-01 2021-04 2021-07 2021-10 2022-01 2022-04 2022-07 2022-10 2023-01 2023-04 2023-07
Residential
Closed Sales
As of 8/1/2023 . By month dating from January 2019 to July 2023.
Sold Listings By Price Range
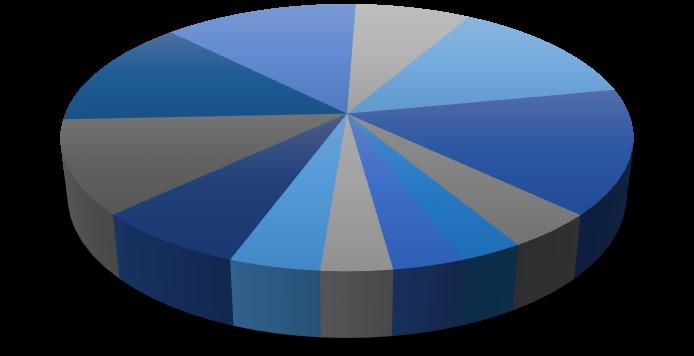
Year - over - year comparison for the month of July.
0-$150K$150-200K200K-$250K$250K-300K$300K-$350K$350K-$400K$400K-$450K$450K-$500K$500K-$600K$600K-$800K$800K-$1M
Annual Residential Closed Sales
Spokane County Market Report | July 2023 5
Closed Sales is the number of properties sold. 368 574 860 851 458 548 928 870 465 654 849 732 432 607 604 456 250 377 444 200 300 400 500 600 700 800 900 1000 2019-01 2019-04 2019-07 2019-10 2020-01 2020-04 2020-07 2020-10 2021-01 2021-04 2021-07 2021-10 2022-01 2022-04 2022-07 2022-10 2023-01 2023-042023-07
Year - to - date as of July. Closed Sales is the number of properties sold. 4725 4146 4294 4532 4047 3176 3000 3400 3800 4200 4600 5000 2018 2019 2020 2021 2022 2023 38 8 18 54 83 105 73 66 75 98 35 19 18 18 23 39 60 70 69 41 72 80 23 16 0 20 40 60 80 100 120 140
$1M+ 2022 2023 0-$150K 4% $150-200K 4% 200K-$250K 4% $250K-300K 7% $300K-$350K 11% $350K-$400K 13% $400K-$450K 13% $450K-$500K 8% $500K-$600K 14% $600K-$800K 15% $800K-$1M 4%
Annual Median Sales Price
Median Price Per Square Foot
483 465 578 601 496 467 4242 3681 3716 3931 3551 2709 0 1000 2000 3000 4000 5000 2018 2019 2020 2021 2022 2023 New Re-Sale
Sales Year - to - date Re - Sale vs New Construction as of July. Closed Sales is the number of properties sold.
Year - to - date Re - Sale vs New Construction as of July. Sales Price is the mid - point (median) value where the price for half of the closed sales is higher and half is lower. $220 $248 $375 $350 $410 $390 $326 $350 $356 $430 $501 $480 $150K $200K $250K $300K $350K $400K $450K $500K $550K 2018 2019 2020 2021 2022 2023 Re-Sale New
Annual Residential Closed
of 8/1/2023 . Monthly Re - Sale vs New Construction comparison. Price per Square Foot is the mid - point (median) PPSF of all closed listings. $206 $202 $195 $193 $182 $181 $190 $197 $203 $209 $205 $211 $267 $267 $258 $256 $256 $241 $266 $250 $243 $266 $258 $270 $150 $175 $200 $225 $250 $275 $300 Aug '22 Sep '22 Oct '22 Nov '22 Dec '22 Jan '23 Feb '23 Mar '23 Apr '23 May '23 June '23 July '23 Re-Sale New Spokane County Market Report | July 2023 6
As
Exciting updates to our First Time Homebuyer Loan Programs

Ø Lowered credit score requirements to 700
Ø Student loan debt calculated more favorably
Ø Still no mortgage insurance
Ø Still up to 100% financing (w/min $1000 and reserves)
Even Non-First Time Homebuyers can participate in this program with 5% down and minimum credit score of 720
cbspokane.com
TheinformationinthisreportiscompiledfromareportgivenbytheSpokaneAssociationofREALTORS®andtothebestofourknowledgeisaccurateandcurrent.
©ColdwellBankerRealEstateLLC.AllRightsReserved.ColdwellBanker®andtheColdwellBankerLogoareregisteredservicemarksownedbyColdwellBankerRealEstate LLC.ColdwellBankerRealEstateLLCfullysupportstheprinciplesoftheFairHousingActandtheEqualOpportunityAct.Eachof ceisindependentlyownedandoperated. Notintendedasasolicitationifyourpropertyisalreadylistedbyanotherbroker.Informationdeemedreliablebutnotguaranteedandshouldbeindependentlyveri ed.
