
2023 county Spokane MarketReport MonthlyMarketReportforSpokaneCounty March 2023
The information in this report is compiled from a report given by the Spokane Association of REALTORS® and to the best of our knowledge is accurate and current.
Median Days On Market
As of 4/5/2023 . By month dating from January 2019 to March 2023. Days on Market is the median number of days between when a property is listed and the contract date.
Annual Median Sales Price
Year - to - date as of Marc h
Median Sales Price is the mid - point (median) value where the price for half of the closed sales is higher and half is lower.


$215 $240 $275 $330 $401 $385 $150K $200K $250K $300K $350K $400K 2018 2019 2020 2021 2022 2023 Average Sales Price Current Listing Inventory Median Days On Market $435,408 Up 4.2% from prior month Down 4. 7 % from prior year Median Sales Price $399,547 Up 6. 5 % from prior month Down 7. 1 % from prior year 589 Up 16. 4 % from prior month Up 106.7% from prior year 452 Up 51. 2 % from prior month Down 22.9% from prior year Residential Closed Sales 7 Down 22. 2 % from prior month Up 7 5 .0 % from prior year 1,054 Down 23. 8 % from prior year Annual Residential Closed Sales Spokane County Market Report | December 2022 2 Information
04/05/2023
pulled on
28 24 19 17 18 20 23 14 9 12 15 17 12 5 4 6 5 4 5 5 5 6 6 5 4 3 4 4 4 4 5 5 5 7 8 7 4 4 4 4 5 6 10 14 17 16 22 31 23 9 7 0 10 20 30 40 50 2019-01 2019-04 2019-07 2019-10 2020-01 2020-04 2020-07 2020-10 2021-01 2021-04 2021-07 2021-10 2022-01 2022-04 2022-07 2022-10 2023-01
Spokane County Market Report | March 2023 2
Months Supply of Inventory
As of 4/5/2023 . By month dating from January 2019 to Marc h 2023. Months Supply of Inventory is the number of months it would take to sell the available inventory at the current rate.
Sale-to-List Price Ratio

As of 4/5/2023 . By month dating from January 2019 to March 2023. Sale - to - List Price Ratio is the average of sales price divided by the final list price expressed as a percentage.

Monthly Mortgage Rates
2.3 2 1.9 1.9 1.8 1.8 1.7 1.3 1.4 1.2 1.4 0.9 1.3 1.2 1.2 1.3 1.3 0.8 0.7 0.7 0.7 0.6 0.5 0.3 0.5 0.4 0.4 0.4 0.4 0.4 0.6 0.6 0.8 0.8 0.6 0.4 0.5 0.6 0.5 0.7 0.8 1.1 1.7 1.6 1.8 2.1 2.1 1.7 2.3 2 1.3 0 0.3 0.6 0.9 1.2 1.5 1.8 2.1 2.4 2019-01 2019-04 2019-07 2019-10 2020-01 2020-04 2020-07 2020-10 2021-01 2021-04 2021-07 2021-10 2022-01 2022-04 2020-07 2022-10 2023-01
99.6% 101.3% 101.2% 100.3% 99.4% 101.3% 101.5% 101.7% 101.2% 105.4% 105.3% 103.0% 101.4% 105.0% 101.2% 99.4% 98.7% 99.4% 98.0% 99.0% 100.0% 101.0% 102.0% 103.0% 104.0% 105.0% 106.0% 2019-01 2019-04 2019-07 2019-10 2020-01 2020-04 2020-07 2020-10 2021-01 2021-04 2021-07 2021-10 2022-01 2022-04 2022-07 2022-10 2023-01 Spokane County Market Report | March 2023 3
Monthly 30 - year fixed mortgage rates highlighting the week ending Thursday, March 30, 2023. 4.67% 5.10% 5.10% 5.70% 5.30% 5.66% 6.70% 7.08% 6.49% 6.42% 6.13% 6.50% 6.32% 4.50% 5.25% 6.00% 6.75% 7.50% Mar '22 Apr '22 May '22 June '22 July '22 Aug '22 Sep '22 Oct '22 Nov '22 Dec '22 Jan '23 Feb '23 Mar '23
Active Residential Listings
As of 4/5/2023 . By month dating from January 2019 to March 2023.
Inventory is the number of properties for sales at the end of the month, based on the contract date.
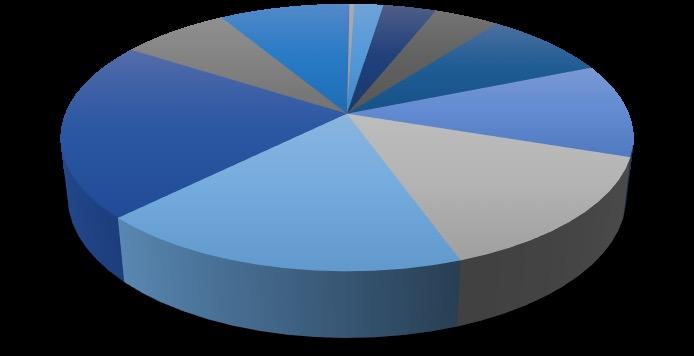
Active Listings By Price Range
0-$150K$150-200K200K-$250K$250K-300K$300K-$350K$350K-$400K$400K-$450K$450K-$500K$500K-$600K$600K-$800K$800K-$1M
New Residential Listings
As of 4/5/2023 . By month dating from January 2019 to March 2023.
the number of properties listed regardless of current status.


Spokane County Market Report | March 2023 4
Active
As of 4/5/2023 838 1090 1437 1053 583 709 677 521 225 276 500 563 224 412 1008 1048 566 589 0 200 400 600 800 1000 1200 1400 1600 2019-01 2019-04 2019-07 2019-10 2020-01 2020-04 2020-07 2020-10 2021-01 2021-04 2021-07 2021-10 2022-01 2022-04 2022-07 2022-10 2023-01 25 5 13 18 19 29 30 27 65 61 38 45 1 2 12 22 27 52 70 89 111 133 45 53 0 20 40 60 80 100 120 140
$1M+ 2022 2023 0-$150K 0% $150-200K 0% 200K-$250K 2% $250K-300K 4% $300K-$350K 4% $350K-$400K 9% $400K-$450K 11% $450K-$500K 14% $500K-$600K 18% $600K-$800K 22% $800K-$1M 7% $1M+ 9%
New Listings
614 976 1055 819 638 686 1001 805 509 782 981 789 483 861 1001 658 517 696 200 400 600 800 1000 1200 2019-01 2019-04 2019-07 2019-10 2020-01 2020-04 2020-07 2020-10 2021-01 2021-04 2021-07 2021-10 2022-01 2022-04 2022-07 2022-10 2023-01
is
Residential Closed Sales
As of 4/5/2023 . By month dating from January 2019 to March 2023.
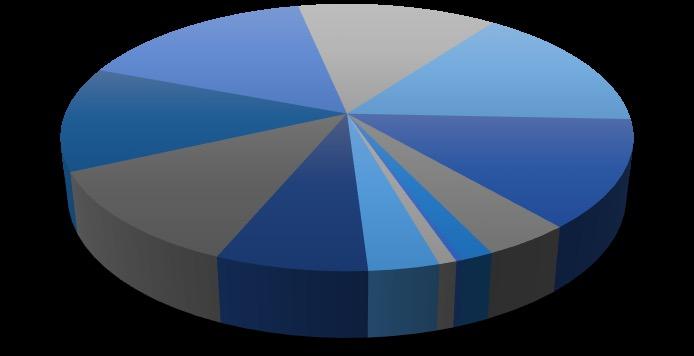
Sold Listings By Price Range
Year - over - year comparison for the month of March.
0-$150K$150-200K200K-$250K$250K-300K$300K-$350K$350K-$400K$400K-$450K$450K-$500K$500K-$600K$600K-$800K$800K-$1M
Annual Residential Closed Sales
Spokane County Market Report | March 2023 5
Closed Sales is the number of properties sold. 368 574 860 851 458 548 928 870 465 654 849 732 432 607 604 456 250 452 200 300 400 500 600 700 800 900 1000 2019-01 2019-04 2019-07 2019-10 2020-01 2020-04 2020-07 2020-10 2021-01 2021-04 2021-07 2021-10 2022-01 2022-04 2022-07 2022-10 2023-01
Year - to - date as of March. Closed Sales is the number of properties sold. 1486 1237 1499 1511 1383 1054 1000 1100 1200 1300 1400 1500 1600 2018 2019 2020 2021 2022 2023 16 10 24 47 72 77 86 77 88 68 25 7 2 5 20 43 70 75 94 79 92 77 25 9 0 20 40 60 80 100 120
$1M+ 2022 2023 0-$150K 0% $150-200K 1% 200K-$250K 3% $250K-300K 7% $300K-$350K 12% $350K-$400K 13% $400K-$450K 16% $450K-$500K 13% $500K-$600K 16% $600K-$800K 13% $800K-$1M 4%
Annual Median Sales Price
Median Price Per Square Foot
175 155 255 266 200 159 1311 1082 1244 1245 1183 895 0 200 400 600 800 1000 1200 1400 1600 2018 2019 2020 2021 2022 2023 New Re-Sale
Year - to - date Re - Sale vs New Construction as of March. Closed Sales is the number of properties sold.
Annual Residential Closed Sales
Year - to - date Re - Sale vs New Construction as of March. Sales Price is the mid - point (median) value where the price for half of the closed sales is higher and half is lower. $203 $230 $260 $311 $385 $360 $322 $364 $334 $390 $497 $510 $150K $200K $250K $300K $350K $400K $450K $500K $550K 2018 2019 2020 2021 2022 2023 Re-Sale New
$223 $218 $221 $206 $206 $202 $195 $193 $182 $181 $190 $195 $273 $265 $269 $270 $267 $267 $258 $256 $256 $241 $266 $254 $150 $175 $200 $225 $250 $275 $300 Apr '22 May '22 June '22 July '22 Aug '22 Sep '22 Oct '22 Nov '22 Dec '22 Jan '23 Feb '23 Mar '23 Re-Sale New Spokane County Market Report | March 2023 6
As of 4/5/2023 . Monthly Re - Sale vs New Construction comparison. Price per Square Foot is the mid - point (median) PPSF of all closed listings.


cbspokane.com
TheinformationinthisreportiscompiledfromareportgivenbytheSpokaneAssociationofREALTORS®andtothebestofourknowledgeisaccurateandcurrent.
©ColdwellBankerRealEstateLLC.AllRightsReserved.ColdwellBanker®andtheColdwellBankerLogoareregisteredservicemarksownedbyColdwellBankerRealEstate LLC.ColdwellBankerRealEstateLLCfullysupportstheprinciplesoftheFairHousingActandtheEqualOpportunityAct.Eachof ceisindependentlyownedandoperated. Notintendedasasolicitationifyourpropertyisalreadylistedbyanotherbroker.Informationdeemedreliablebutnotguaranteedandshouldbeindependentlyveri ed.
