
2023 county Spokane MarketReport MonthlyMarketReportforSpokaneCounty May 2023
The information in this report is compiled from a report given by the Spokane Association of REALTORS® and to the best of our knowledge is accurate and current.
Median Days On Market
As of 6/1/2023 . By month dating from January 2019 to Ma y 2023. Days on Market is the median number of days between when a property is listed and the contract date.
Annual Median Sales Price


Year - to - date as of Ma y
Sales Price is the mid - point (median) value where the price for half of the closed sales is higher and half is lower.
$225 $250 $280 $347 $423 $400 $200K $250K $300K $350K $400K $450K 2018 2019 2020 2021 2022 2023 Average Sales Price Current Listing Inventory Median Days On Market $441,779 Up 0.3% from prior month Down 8. 7 % from prior year Median Sales Price $ 412,750 Dow n 0. 5 % from prior month Down 8. 3 % from prior year 74 9 Up 9. 0 % from prior month Up 34. 0 % from prior year 49 6 Up 12. 7 % from prior month Down 26. 8 % from prior year Residential Closed Sales 7 Up 8. 3 % from prior month Up 62. 5 % from prior year 2,024 Down 24. 2 % from prior year Annual Residential Closed Sales Spokane County Market Report | December 2022 2 Information
06/01/2023
pulled on
Median
28 24 19 17 18 20 23 14 9 12 15 17 12 5 4 6 5 4 5 5 5 6 6 5 4 3 4 4 4 4 5 5 5 7 8 7 4 4 4 4 5 6 10 14 17 16 22 31 23 9 7 6 7 0 10 20 30 40 50 2019-01 2019-04 2019-07 2019-10 2020-01 2020-04 2020-07 2020-10 2021-01 2021-04 2021-07 2021-10 2022-01 2022-04 2022-07 2022-10 2023-01 2023-04
Spokane County Market Report | May 2023 2
Months Supply of Inventory
As of 6/1/2023 . By month dating from January 2019 to M ay 2023. Months Supply of Inventory is the number of months it would take to sell the available inventory at the current rate.
Sale-to-List Price Ratio
As of 6/1/2023 . By month dating from January 2019 to Ma y 2023.
Price Ratio is the average of sales price divided by the final list price expressed as a percentage.


Monthly Mortgage Rates
Monthly 30 - year fixed mortgage rates highlighting the week ending Thursday, Ma y 1, 2023.
2.3 2 1.9 1.9 1.8 1.8 1.7 1.3 1.4 1.2 1.4 0.9 1.3 1.2 1.2 1.3 1.3 0.8 0.7 0.7 0.7 0.6 0.5 0.3 0.5 0.4 0.4 0.4 0.4 0.4 0.6 0.6 0.8 0.8 0.6 0.4 0.5 0.6 0.5 0.7 0.8 1.1 1.7 1.6 1.8 2.1 2.1 1.7 2.3 2 1.3 1.7 1.5 0 0.3 0.6 0.9 1.2 1.5 1.8 2.1 2.4 2019-01 2019-04 2019-07 2019-10 2020-01 2020-04 2020-07 2020-10 2021-01 2021-04 2021-07 2021-10 2022-01 2022-04 2020-07 2022-10 2023-01 2023-04
99.6% 101.3% 101.2% 100.3% 99.4% 101.3% 101.5% 101.7% 101.2% 105.4% 105.3% 103.0% 101.4% 105.0% 101.2% 99.4% 98.7% 99.8% 100.7% 98.0% 99.0% 100.0% 101.0% 102.0% 103.0% 104.0% 105.0% 106.0% 2019-01 2019-04 2019-07 2019-10 2020-01 2020-04 2020-07 2020-10 2021-01 2021-04 2021-07 2021-10 2022-01 2022-04 2022-07 2022-10 2023-01 2023-04 Spokane County Market Report | April 2023 3
to
Sale -
- List
5.10% 5.70% 5.30% 5.66% 6.70% 7.08% 6.49% 6.42% 6.13% 6.50% 6.32% 6.43% 6.79% 4.50% 5.25% 6.00% 6.75% 7.50% May '22 June '22 July '22 Aug '22 Sep '22 Oct '22 Nov '22 Dec '22 Jan '23 Feb '23 Mar '23 Apr '23 May '23
Active Residential Listings


As of 6/1/2023 . By month dating from January 2019 to Ma y 2023. Active Inventory is the number of properties for sales at the end of the month, based on the contract date.
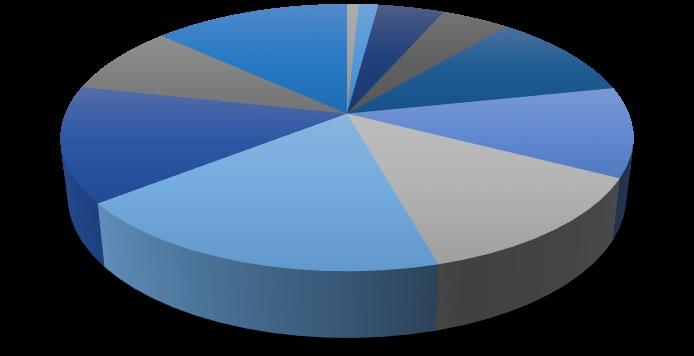
Active Listings By Price Range
0-$150K$150-200K200K-$250K$250K-300K$300K-$350K$350K-$400K$400K-$450K$450K-$500K$500K-$600K$600K-$800K$800K-$1M
New Residential Listings
As of 6/1/2023 . By month dating from January 2019 to Ma y 2023. New Listings is the number of properties listed regardless of current status.
Spokane County Market Report | May 2023 4
As of 6/1/2023 838 1090 1437 1053 583 709 677 521 225 276 500 563 224 412 1008 1048 566 658 749 0 200 400 600 800 1000 1200 1400 1600 2019-01 2019-04 2019-07 2019-10 2020-01 2020-04 2020-07 2020-10 2021-01 2021-04 2021-07 2021-10 2022-01 2022-04 2022-07 2022-10 2023-01 2023-04 18 8 13 31 52 48 59 81 90 129 65 83 0 6 10 34 35 81 83 100 143 107 64 101 0 30 60 90 120 150
$1M+ 2022 2023 0-$150K 0% $150-200K 1% 200K-$250K 1% $250K-300K 4% $300K-$350K 5% $350K-$400K 11% $400K-$450K 11% $450K-$500K 13% $500K-$600K 19% $600K-$800K 14% $800K-$1M 8% $1M+ 13%
614 976 1055 819 638 686 1001 805 509 782 981 789 483 861 1001 658 517 748 809 200 400 600 800 1000 1200 2019-01 2019-04 2019-07 2019-10 2020-01 2020-04 2020-07 2020-10 2021-01 2021-04 2021-07 2021-10 2022-01 2022-04 2022-07 2022-10 2023-01 2023-04
Residential Closed Sales
As of 6/1/2023 . By month dating from January 2019 to Ma y 2023.
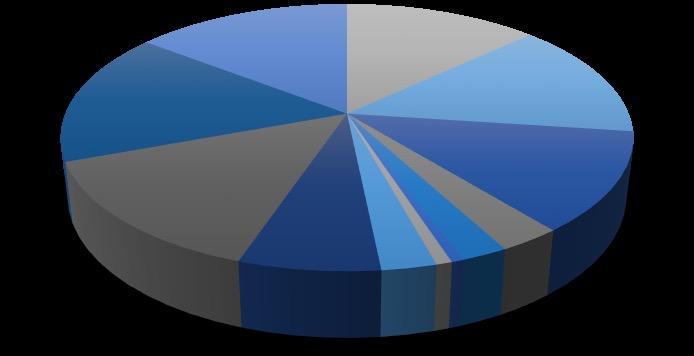
Sold Listings By Price Range
Year - over - year comparison for the month of Ma y
0-$150K$150-200K200K-$250K$250K-300K$300K-$350K$350K-$400K$400K-$450K$450K-$500K$500K-$600K$600K-$800K$800K-$1M
Annual Residential Closed Sales
Spokane County Market Report | May 2023 5
Closed Sales is
number
properties sold. 368 574 860 851 458 548 928 870 465 654 849 732 432 607 604 456 250 452 377 496 200 300 400 500 600 700 800 900 1000 2019-01 2019-04 2019-07 2019-10 2020-01 2020-04 2020-07 2020-10 2021-01 2021-04 2021-07 2021-10 2022-01 2022-04 2022-07 2022-10 2023-01 2023-04
the
of
Year - to - date as of Ma y Closed Sales is the number of properties sold. 2880 2510 2584 2878 2670 2024 1800 2000 2200 2400 2600 2800 3000 2018 2019 2020 2021 2022 2023 16 14 22 37 64 90 98 104 109 99 40 25 3 4 14 36 75 86 77 69 75 64 16 12 0 20 40 60 80 100 120
$1M+ 2022 2023 0-$150K 1% $150-200K 1% 200K-$250K 3% $250K-300K 7% $300K-$350K 14% $350K-$400K 16% $400K-$450K 14% $450K-$500K 13% $500K-$600K 14% $600K-$800K 12% $800K-$1M 3%
Annual Median Sales Price
Median Price Per Square Foot
As of 6/1/2023 . Monthly Re - Sale vs New Construction comparison. Price per Square Foot is the mid - point (median) PPSF of all closed listings.
312 311 379 434 358 322 2568 2199 2205 2444 2312 1702 0 400 800 1200 1600 2000 2400 2800 3200 2018 2019 2020 2021 2022 2023 New Re-Sale
Year - to - date Re - Sale vs New Construction as of Ma y Closed Sales is the number of properties sold.
Annual Residential Closed Sales
- to - date Re - Sale vs New Construction as of Ma y Sales Price is the mid - point (median) value where the price for half of the closed sales is higher and half is lower. $215 $240 $267 $330 $402 $380 $328 $348 $346 $420 $497 $486 $150K $200K $250K $300K $350K $400K $450K $500K $550K 2018 2019 2020 2021 2022 2023 Re-Sale New
Year
$221 $206 $206 $202 $195 $193 $182 $181 $190 $197 $203 $209 $269 $270 $267 $267 $258 $256 $256 $241 $266 $250 $243 $269 $150 $175 $200 $225 $250 $275 $300 June '22 July '22 Aug '22 Sep '22 Oct '22 Nov '22 Dec '22 Jan '23 Feb '23 Mar '23 Apr '23 May '23 Re-Sale New Spokane County Market Report | May 2023 6


Equal Housing Lender. CYNDEE WOOD | (360) 460-8790 www.iccu.com/cyndee | NMLS: 1619044 CHERIE WELCH | (509) 672-5021 ww.iccu.com/cherie | NMLS: 650265 JESSICA SHEW | (509) 672-5019 www.iccu.com/jessica | NMLS: 582946 TERRI PETERSON | (509) 939-1955 www.iccu.com/terri | NMLS: 191625 DON’T GO TO JUST ANYONE. Connect with one of our local Mortgage Loan O cers today. Whether building, buying, or moving up, Idaho Central Credit Union has the home loan to fit your needs. KARI OLSEN | (509) 672-5018 www.iccu.com/kari | NMLS: 742356 • Fas t a pproval s a nd clo s in g s • S peci a l first-ti m e homeb u yer lo a n s • N o-fee a nd lo w -co s t lo a n option s • IHFA, FHA, VA, & Rural Housing loans • Local under w riting a nd s ervicin g YOU FIND THE HOME WE’VE GOT THE LOAN AARON MARSH | (509) 672-5011 www.iccu.com/aaron | NMLS: 485285
cbspokane.com
TheinformationinthisreportiscompiledfromareportgivenbytheSpokaneAssociationofREALTORS®andtothebestofourknowledgeisaccurateandcurrent.
©ColdwellBankerRealEstateLLC.AllRightsReserved.ColdwellBanker®andtheColdwellBankerLogoareregisteredservicemarksownedbyColdwellBankerRealEstate LLC.ColdwellBankerRealEstateLLCfullysupportstheprinciplesoftheFairHousingActandtheEqualOpportunityAct.Eachof ceisindependentlyownedandoperated. Notintendedasasolicitationifyourpropertyisalreadylistedbyanotherbroker.Informationdeemedreliablebutnotguaranteedandshouldbeindependentlyveri ed.
