2023 county Spokane MarketReport MonthlyMarketReportforSpokaneCounty September 2023
The information in this report is compiled from a report given by the Spokane Association of REALTORS® and to the best of our knowledge is accurate and current.
Median Days On Market
As of 10/3/2023 . By month dating from January 2019 to September 2023. Days on Market is the median number of days between when a property is listed and the contract date.
Annual Median Sales Price
Year - to - date as of September.

Median Sales Price is the mid - point (median) value where the price for half of the closed sales is higher and half is lower.

$235 $260 $295 $368 $425 $411 $200K $250K $300K $350K $400K $450K 2018 2019 2020 2021 2022 2023 Average Sales Price Current Listing Inventory Median Days On Market $440,847 Down 3. 4 % from prior month Down 3. 4
Median Sales Price $ 410,000 Dow n 3. 1 % from prior month Eve n 0.0% from prior year 1,130 Up 3. 9 % from prior month Down 0. 5 % from
year 482 Down 15. 7 % from prior month Down 24.8% from
year Residential Closed Sales 15 Up 7. 1 % from prior month Up 7. 1 % from prior year 4,305 Down 19. 7
year Annual Residential Closed Sales Spokane County Market Report | December 2022 2 Information
10/03/2023
% from prior year
prior
prior
% from prior
pulled on
28 24 19 17 18 20 23 14 9 12 15 17 12 5 4 6 5 4 5 5 5 6 6 5 4 3 4 4 4 4 5 5 5 7 8 7 4 4 4 4 5 6 10 14 17 16 22 31 23 9 7 6 7 8 12 14 15 0 10 20 30 40 50 2019-012019-042019-072019-102020-012020-042020-072020-102021-012021-042021-072021-102022-012022-042022-072022-102023-012023-042023-07
Spokane County Market Report | September 2023 2
Months Supply of Inventory
As of 1 0 /3/2023 . By month dating from January 2019 to September 2023. Months Supply of Inventory is the number of months it would take to sell the available inventory at the current rate.
Sale-to-List Price Ratio


As of 1 0 /3/2023 . By month dating from January 2019 to September
is the average of sales price divided by the final list price expressed as a percentage.
Monthly Mortgage Rates
2.3 2 1.91.91.81.81.7 1.31.41.21.4 0.9 1.31.21.21.31.3 0.80.70.70.70.60.5 0.30.50.40.40.40.40.40.60.6 0.80.8 0.60.40.50.60.50.70.8 1.1 1.71.61.8 2.12.1 1.7 2.3 2 1.3 1.7 1.5 1.7 2.3 2 2.3 0 0.3 0.6 0.9 1.2 1.5 1.8 2.1 2.4 2019-012019-042019-072019-102020-012020-042020-072020-102021-012021-042021-072021-102022-012022-042020-072022-102023-012023-042023-07
99.6% 101.3% 101.2% 100.3% 99.4% 101.3% 101.5% 101.7% 101.2% 105.4% 105.3% 103.0% 101.4% 105.0% 101.2% 99.4% 98.7% 99.8% 99.8%99.8% 98.0% 99.0% 100.0% 101.0% 102.0% 103.0% 104.0% 105.0% 106.0% 2019-012019-042019-072019-102020-012020-042020-072020-102021-012021-042021-072021-102022-012022-042022-072022-102023-012023-042023-07 Spokane County Market Report | September 2023 3
Sale - to - List Price
2023.
Ratio
Monthly
Septembe
28, 2023. 6.70% 7.08% 6.49% 6.42% 6.13% 6.50% 6.32% 6.43% 6.79% 6.71% 6.81% 7.18% 7.31% 6.00% 6.25% 6.50% 6.75% 7.00% 7.25% 7.50% Sep '22 Oct '22 Nov '22 Dec '22 Jan '23 Feb '23 Mar '23 Apr '23 May '23 June '23 July '23 Aug '23 Sep '23
30 - year fixed mortgage rates highlighting the week ending Thursday,
r
Active Residential Listings


As of 1 0 /3/2023 . By month dating from January 2019 to September 2023. Active Inventory is the number of properties for sales at the end of the month, based on the contract date.
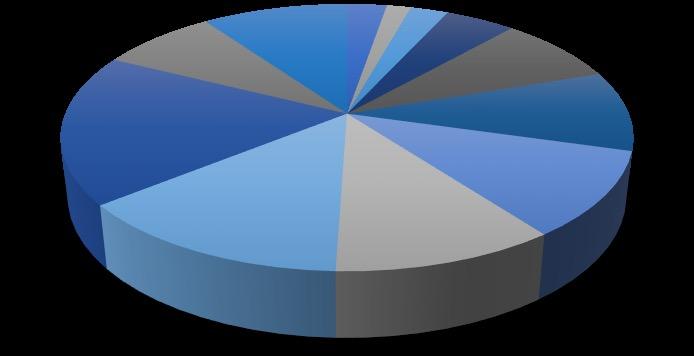
Active Listings By Price Range
0-$150K$150-200K200K-$250K$250K-300K$300K-$350K$350K-$400K$400K-$450K$450K-$500K$500K-$600K$600K-$800K$800K-$1M
New Residential Listings
As of 1 0 /3/2023 . By month dating from January 2019 to September 2023. New Listings is the number of properties listed regardless of current status

Spokane County Market Report | September 2023 4
As of 10/3/2023 838 1090 1437 1053 583 709 677 521 225 276 500 563 224 412 1008 1048 566 658 1,014 1130 0 200 400 600 800 1000 1200 1400 1600 2019-012019-042019-072019-102020-012020-042020-072020-102021-012021-042021-072021-102022-012022-042022-072022-102023-012023-042023-07 35 20 51 89 122 169 116 153 183 212 108 92 38 23 36 67 117 138 147 153 194 260 111 139 0 30 60 90 120 150 180 210 240 270
$1M+ 2022 2023 0-$150K 3% $150-200K 1% 200K-$250K 2% $250K-300K 5% $300K-$350K 8% $350K-$400K 10% $400K-$450K 10% $450K-$500K 11% $500K-$600K 14% $600K-$800K 18% $800K-$1M 8% $1M+ 10%
614 976 1055 819 638 686 1001 805 509 782 981 789 483 861 1001 658 517 748 798 829 200 400 600 800 1000 1200 2019-012019-042019-072019-102020-012020-042020-072020-102021-012021-042021-072021-102022-012022-042022-072022-102023-012023-042023-07
Residential


Closed Sales
As of 1 0 /3/2023 . By month dating from January 2019 to September 2023.

sold.
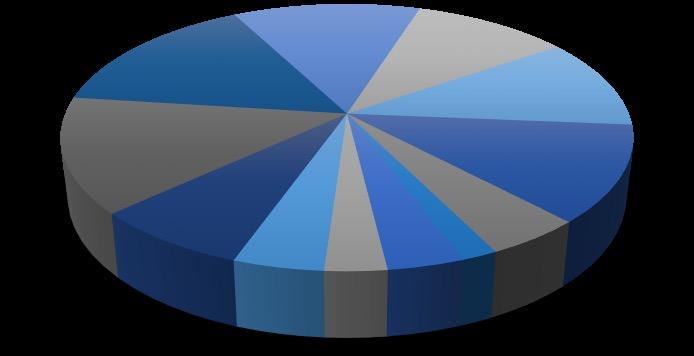
Sold Listings By Price Range
Year - over - year comparison for the month of September.
0-$150K$150-200K200K-$250K$250K-300K$300K-$350K$350K-$400K$400K-$450K$450K-$500K$500K-$600K$600K-$800K$800K-$1M
Annual Residential Closed Sales
Spokane County Market Report | September 2023 5
Closed Sales is the number
properties
368 574 860 851 458 548 928 870 465 654 849 732 432 607 604 456 250 377 444 482 200 300 400 500 600 700 800 900 1000 2019-01 2019-04 2019-07 2019-10 2020-01 2020-04 2020-07 2020-10 2021-01 2021-04 2021-07 2021-10 2022-01 2022-04 2022-07 2022-10 2023-01 2023-042023-07
of
Year - to - date as of September. Closed Sales is the number of properties sold. 6386 5818 5916 6176 5361 4305 4000 4500 5000 5500 6000 6500 2018 2019 2020 2021 2022 2023 23 12 21 62 91 99 88 60 80 76 28 21 21 17 25 44 80 88 72 60 63 67 27 10 0 20 40 60 80 100 120 140
$1M+ 2022 2023 0-$150K 4% $150-200K 3% 200K-$250K 4% $250K-300K 8% $300K-$350K 14% $350K-$400K 15% $400K-$450K 12% $450K-$500K 10% $500K-$600K 11% $600K-$800K 12% $800K-$1M 5%
Annual Residential Closed Sales
Annual Median Sales Price


Median Price Per Square Foot
As of 1 0 /3/2023 . Monthly Re - Sale vs New Construction comparison. Price per Square Foot is the mid - point (median) PPSF of all closed listings.
633 633 767 773 628 628 5753 5185 5149 5403 4733 3677 0 1000 2000 3000 4000 5000 6000 7000 2018 2019 2020 2021 2022 2023 New Re-Sale
- to - date Re - Sale vs New Construction
of September. Closed Sales is the number of properties sold.
Year
as
New
Sales Price is the mid - point (median) value
$225 $250 $280 $357 $405 $395 $330 $352 $356 $435 $500 $476 $150K $200K $250K $300K $350K $400K $450K $500K $550K 2018 2019 2020 2021 2022 2023 Re-Sale New
Year - to - date Re - Sale vs
Construction as of September.
where the price for half of the closed sales is higher and half is lower.
$195 $193 $182 $181 $190 $197 $203 $209 $205 $210 $202 $202 $258 $256 $256 $241 $266 $250 $243 $266 $256 $266 $255 $257 $150 $175 $200 $225 $250 $275 $300 Oct '22 Nov '22 Dec '22 Jan '23 Feb '23 Mar '23 Apr '23 May '23 June '23 July '23 Aug '23 Sep '23 Re-Sale New Spokane County Market Report | September 2023 6


• Local underwriting—we know the market • Local servicing—we service most of our loans • Fast approvals and closings with same-day funding • First-time homebuyer and low-to-zero down programs • Low fees to save you money • Extended rate-lock options • Yearly free re-amortization • Wide variety of portfolio products Why choose ICCU for your mortgage loan? Kari Olson | Mortgage Loan O cer d: (509) 672-5018 | c: (509) 994-5179 kaolsen@iccu.com | NMLS: 742356 [apply today at www.iccu.com/kari] FIRST HOME OR FOREVER HOME, WE’VE GOT THE LOAN. Federally insured by NCUA. Equal Housing Lender.
cbspokane.com
TheinformationinthisreportiscompiledfromareportgivenbytheSpokaneAssociationofREALTORS®andtothebestofourknowledgeisaccurateandcurrent.
©ColdwellBankerRealEstateLLC.AllRightsReserved.ColdwellBanker®andtheColdwellBankerLogoareregisteredservicemarksownedbyColdwellBankerRealEstate LLC.ColdwellBankerRealEstateLLCfullysupportstheprinciplesoftheFairHousingActandtheEqualOpportunityAct.Eachof ceisindependentlyownedandoperated. Notintendedasasolicitationifyourpropertyisalreadylistedbyanotherbroker.Informationdeemedreliablebutnotguaranteedandshouldbeindependentlyveri ed.


