

Quad Cities

Today’s Real Estate Market in the Quad Cities Region

Q2–2024 Market Summary
The first half of 2024 is in the books and the market has continued to be slow, but signs continue to be trending in the right direction higher inventory levels and increased sales in comparison to recent years.
In the Latah County, closed transactions were up10.6% from this same last year, with new listings also increased by 26.7% compared to Q2 2023. In this same time frame, the median sales price showed a slight decrease by 3.8% to $422,500, with average sales price also decreasing by just 2.2% to $435,709.
The Whitman County market was once again showed the biggest increase in the amount of new listings in comparison to Q2 2023, with 247 properties listed in the quarter. This was an increase of 43.6% from last year, and a 24.7% increase from last quarter. Home sale prices have continued an decreasing trend over the past year, loweing 7.3% from Q2 2023 to a median home sale price of $379,000.
The Nez Perce County market realized a decrease in both closed sales and new listings in relation to the previous year, with closed sales down 12.1% with 116 properties sold in Q2 of 2024. The amount of new listings was down 3.1% from this same time last year. The median home sale price also decreased by 1.1% to $367,000. The median days on market also decreased to 13 days, compared to 16 days in previous year.
The market west of the state line in Asotin County market saw a notable increase in closed sales, rising 19.2% from last year with 62 closed sales. There was also a notable increase in active listings, with 57 active listings at the time of this report, a 103.6% increase from last year.
Despite the varied performance across different regions, there are indications of increased activity continuing through 2024, accompanied by a surge in buyer inquiries. As we navigate through the summer and fall, we’ll continue to keep a close eye on interest rates along with inventory levels as the peak selling seasons continue.
Jason Brown Designated Broker / Regional Manager
Latah County

What’s in the Latah County Data?
In Quarter 2 2024, Latah County median home prices were down 3.8% compared to last year and up 8.6% compared to last quarter, selling for a median price of $422,500. There were 94 homes sold in Q2 2024 this year, up from 85 at this same time last year.
On median, homes in Latah County sell after 14 days on the market, up 75.0% from this same time last year. There were 133 new listings to go live last quarter and there are a total of 58 active listings at the time of this report.
Latah County

Closed Sales
As of 07/08/2024. By quarter dating from Q1 2019 to Q2 2024. Closed Sales is the number of properties sold.
Closed Sales By Price Range
As of 07/08/2024. Year-over-year comparison for Q2 2024 and Q2 2023. Closed Sales By Price Range is the number and percentage of
Average and Median Sales Price
As of 07/08/2024. By quarter dating from Q1 2019 to Q2 2024. Median Sales Price is the mid-point (median) value where the price for half of the closed sales is higher and half is lower. Average Sales Price is the sum of the sold dollar volume divided by the number of units sold.
Median Days on Market
As of 07/08/2024. By
from Q1 2019 to Q2 2024.
New Listings
As of 07/08/2024. By quarter dating from Q1 2019 to Q2 2024. New Listings is the number of properties listed regardless of current status.
Sale-to-List Price Ratio
As of 07/08/2024. By quarter dating from Q1 2019 to Q2 2024. Sale-to-List Price Ratio is the average of sales price
by
Supply and Demand
As of 07/08/2024. Year-over-year comparison of Closed Sales and Active Inventory for Q2 2024 and Q2 2023.
$0-$199,999
$200,000-$249,999
$250,000-$299,999
$300,000-$399,999
$400,000-$499,999
$500,000+
Whitman County

What’s in the Whitman County Data?
In Quarter 2 2024, Whitman County median home prices were down 7.3% compared to last year and down 4.1% compared to last quarter, selling for a median price of $379,000. There were 141 homes sold in Q2 2024 this year, down from 115 at this same time last year.
On median, homes in Whitman County sell after 19 days on the market, up 58.3% from this same time last year. There were 247 new listings to go live last quarter and there are a total of 133 active listings at the time of this report.
Whitman County

Closed Sales
As of 07/08/2024. By quarter dating from Q1 2019 to Q2 2024. Closed Sales is the number of properties sold.
Closed Sales By Price Range
As of 07/08/2024. Year-over-year comparison for Q2 2024 and Q2 2023. Closed Sales By Price Range is the number and
Average and Median Sales Price
As of 07/08/2024. By quarter dating from Q1 2019 to Q2 2024. Median Sales Price is the mid-point (median) value where the price for half of the closed sales is higher and half is lower. Average Sales Price is the sum of the sold dollar volume divided by the number of units sold.
Median Days on Market
As of 07/08/2024. By
from Q1 2019 to Q2 2024.
New Listings
As of 07/08/2024. By quarter dating from Q1 2019 to Q2 2024. New Listings is the number of properties listed regardless of current status.
Sale-to-List Price Ratio
As of 07/08/2024. By quarter dating from Q1 2019 to Q2 2024. Sale-to-List Price Ratio is the average of sales price divided by the final list
Supply and Demand
As of 07/08/2024. Year-over-year comparison of Closed Sales and Active Inventory for Q2 2024 and Q2 2023.
$0-$199,999
$200,000-$249,999
$250,000-$299,999
$300,000-$399,999
$400,000-$499,999
$500,000+
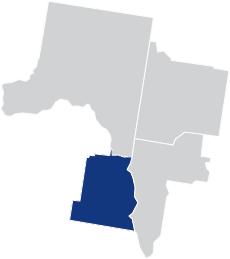
Nez Perce County

What’s in the Nez Perce County Data?
In Quarter 2 2024, Nez Perce County median home prices were down 1.1% compared to last year and up 8.1% compared to last quarter, selling for a median price of $367,000. There were 116 homes sold in Q2 2024 this year, down from 132 at this same time last year.
On median, homes in Nez Perce County sell after 13 days on the market, down 18.8% from this same time last year. There were 154 new listings to go live last quarter and there are a total of 80 active listings at the time of this report.
Q2 2024 Market data
Nez Perce County
At a Glance

Closed Sales
As of 07/08/2024. By quarter dating from Q1 2019 to Q2 2024. Closed Sales is the number of properties sold.
Closed Sales By Price Range
As of 07/08/2024. Year-over-year comparison for Q2 2024 and Q2 2023. Closed Sales By Price Range is the number and
Average and Median Sales Price
As of 07/08/2024. By quarter dating from Q1 2019 to Q2 2024. Median Sales Price is the mid-point (median) value where the price for half of the closed sales is higher and half is lower. Average Sales Price is the sum of the sold dollar volume divided by the number of units sold.
Median Days on Market
As of 07/08/2024. By
dating from Q1 2019 to Q2 2024.
New Listings
As of 07/08/2024. By quarter dating from Q1 2019 to Q2 2024. New Listings is the number of properties listed regardless of current status.
Sale-to-List Price Ratio
As of 07/08/2024. By quarter dating from Q1 2019 to Q2 2024. Sale-to-List Price Ratio is the
Supply and Demand
As of 07/08/2024. Year-over-year comparison of Closed Sales and Active Inventory for Q2 2024 and Q2 2023.
$0-$199,999
$200,000-$249,999
$250,000-$299,999
$300,000-$399,999
$400,000-$499,999
$500,000+
Asotin County

What’s in the Asotin County Data?
In Quarter 2 2024, Asotin County median home prices were down 0.5% compared to last year and up 14.0% compared to last quarter, selling for a median price of $347,800. There were 62 homes sold in Q2 2024 this year, up from 52 at this same time last year.
On median, homes in Asotin County sell after 15 days on the market, down 16.7% from this same time last year. There were 74 new listings to go live last quarter and there are a total of 57 active listings at the time of this report.
Asotin County
At a Glance
Closed Sales
As of 07/08/2024. By quarter dating from Q1 2019 to Q2 2024. Closed Sales is the number of properties sold.
Closed Sales By Price Range
As of 07/08/2024. Year-over-year comparison for Q2 2024 and Q2 2023. Closed Sales By Price Range is the number and percentage of properties sold in different
Average and Median Sales Price
As of 07/08/2024. By quarter dating from Q1 2019 to Q2 2024. Median Sales Price is the mid-point (median) value where the price for half of the closed sales is higher and half is lower. Average Sales Price is the sum of the sold dollar volume divided by the number of units sold.
Median Days on Market
As of 07/08/2024. By quarter dating from Q1 2019 to Q2 2024.
between when a
New Listings
As of 07/08/2024. By quarter dating from Q1 2019 to Q2 2024. New Listings is the number of properties listed regardless of current status.
Sale-to-List Price Ratio
As of 07/08/2024. By quarter dating from Q1 2019 to Q2 2024. Sale-to-List Price Ratio is the average of sales price divided by the final list price expressed as a percentage.
Supply and Demand
As of 07/08/2024. Year-over-year comparison of Closed Sales and Active Inventory for Q2 2024 and Q2 2023.
$0-$199,999
$200,000-$249,999
$250,000-$299,999
$300,000-$399,999
$400,000-$499,999
$500,000+
Totals
Mortgage Rates
30-year fixed mortgage rates dating from January 2019 to the week ending Thursday, July 3, 2024.