Tuli Bhattacharjee
COMPUTATIONAL DESIGN PORTFOLIO
CONTENTS:
The work showcased in this portfolio is produced by the author in different academic & professional setups (group & individual) with a focus on computational design thinking process.
APPLICATION OF COMPUTATION IN:
1 2 3
FABRICATION & INSTALLATIONS
Robotic Fabrication | Clay Printing, Thermoplastic Printing & Wooden Assembly
Acadia Workshop | Robotic Fabrication for Building Components
Breathing Fabric | A Hybridization of Machine Knitted Textiles with Inflatables
ARCHITECTURAL DESIGN & ANALYSIS
Coding Geometric Systems | Systematic Design Computing
Form Explorations | Using Minimal Surfaces
Chinchwad City Centre | Congruence of Mixed-Uses
Workplace Design Project | Human-Centered Professional Research
DIGITAL TOOLS
Form Sketcher 2D | Precise 3D Model from 2D Shape Sketch 2
Fabrication & Installations
3
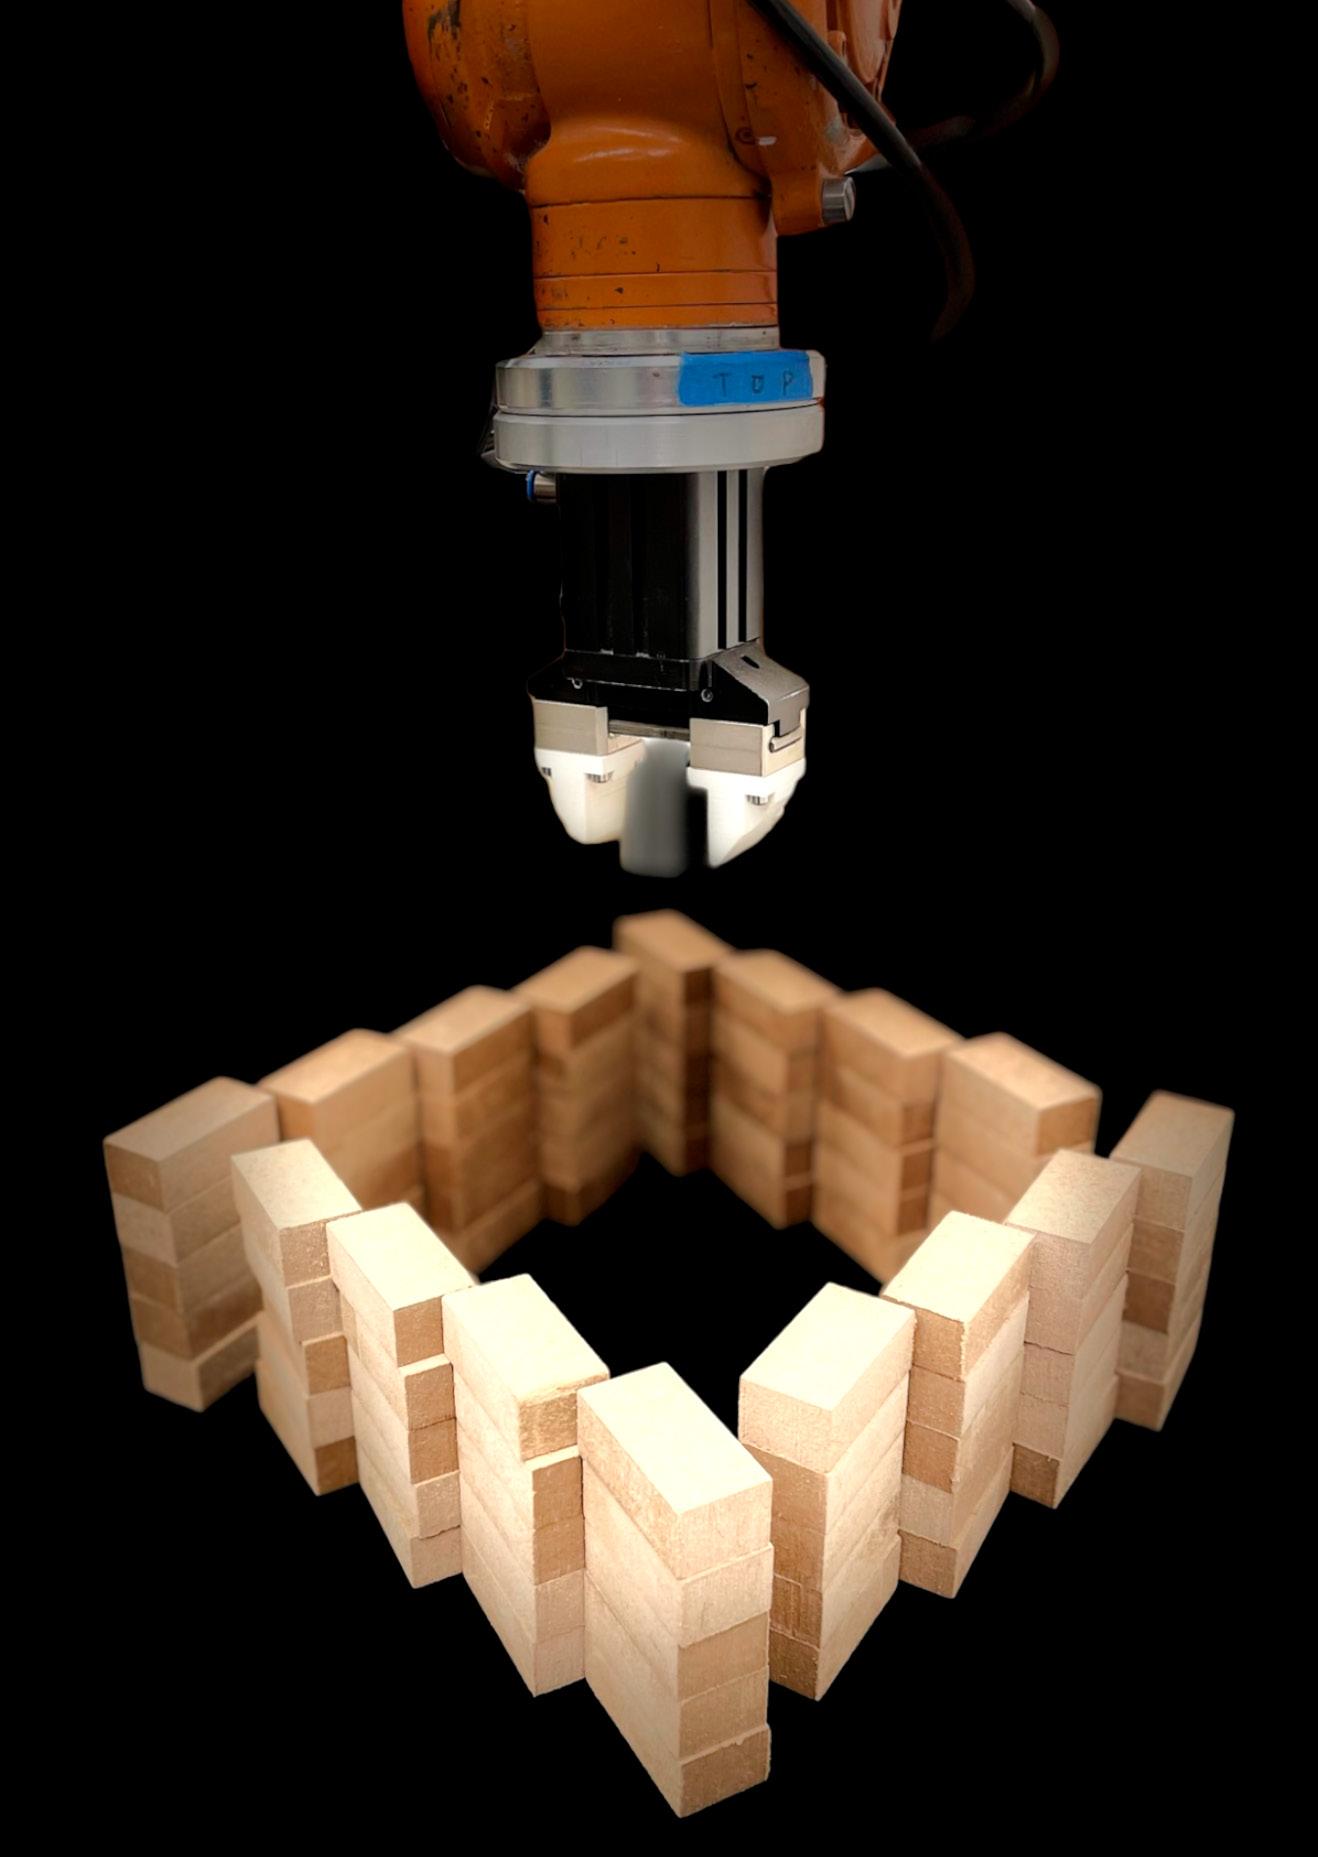
Robotic Fabrication
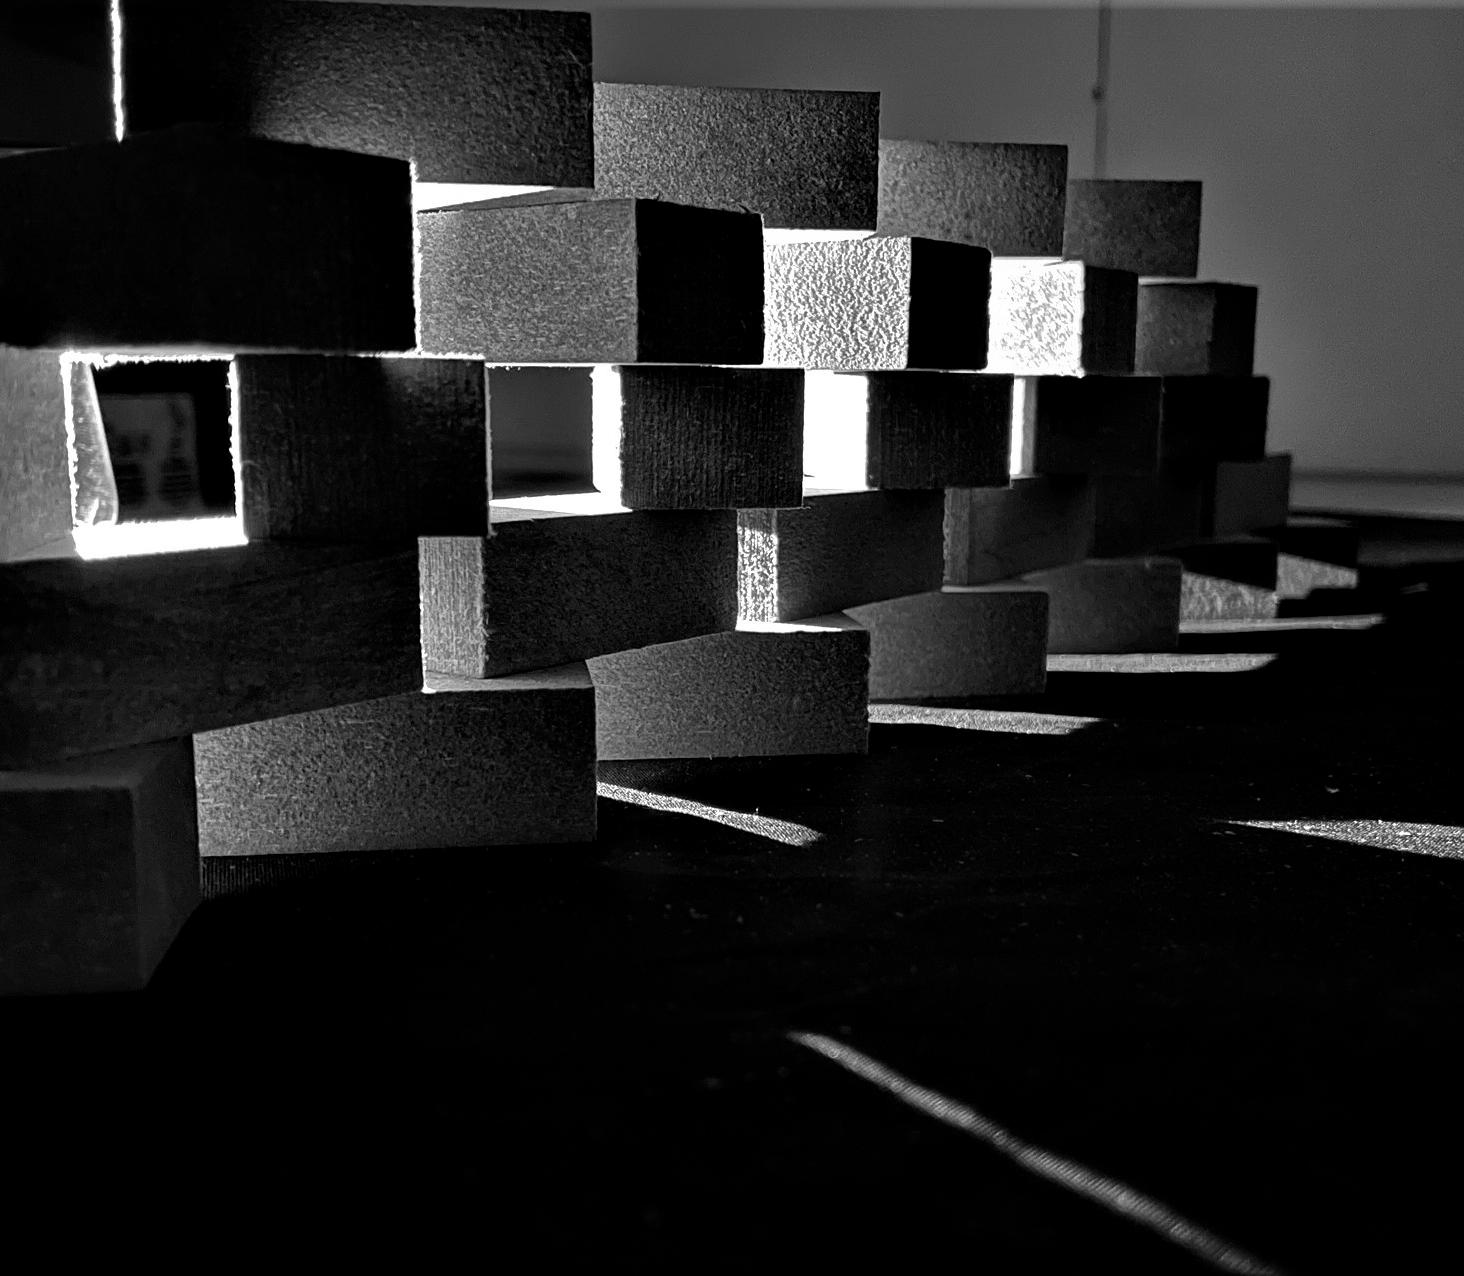
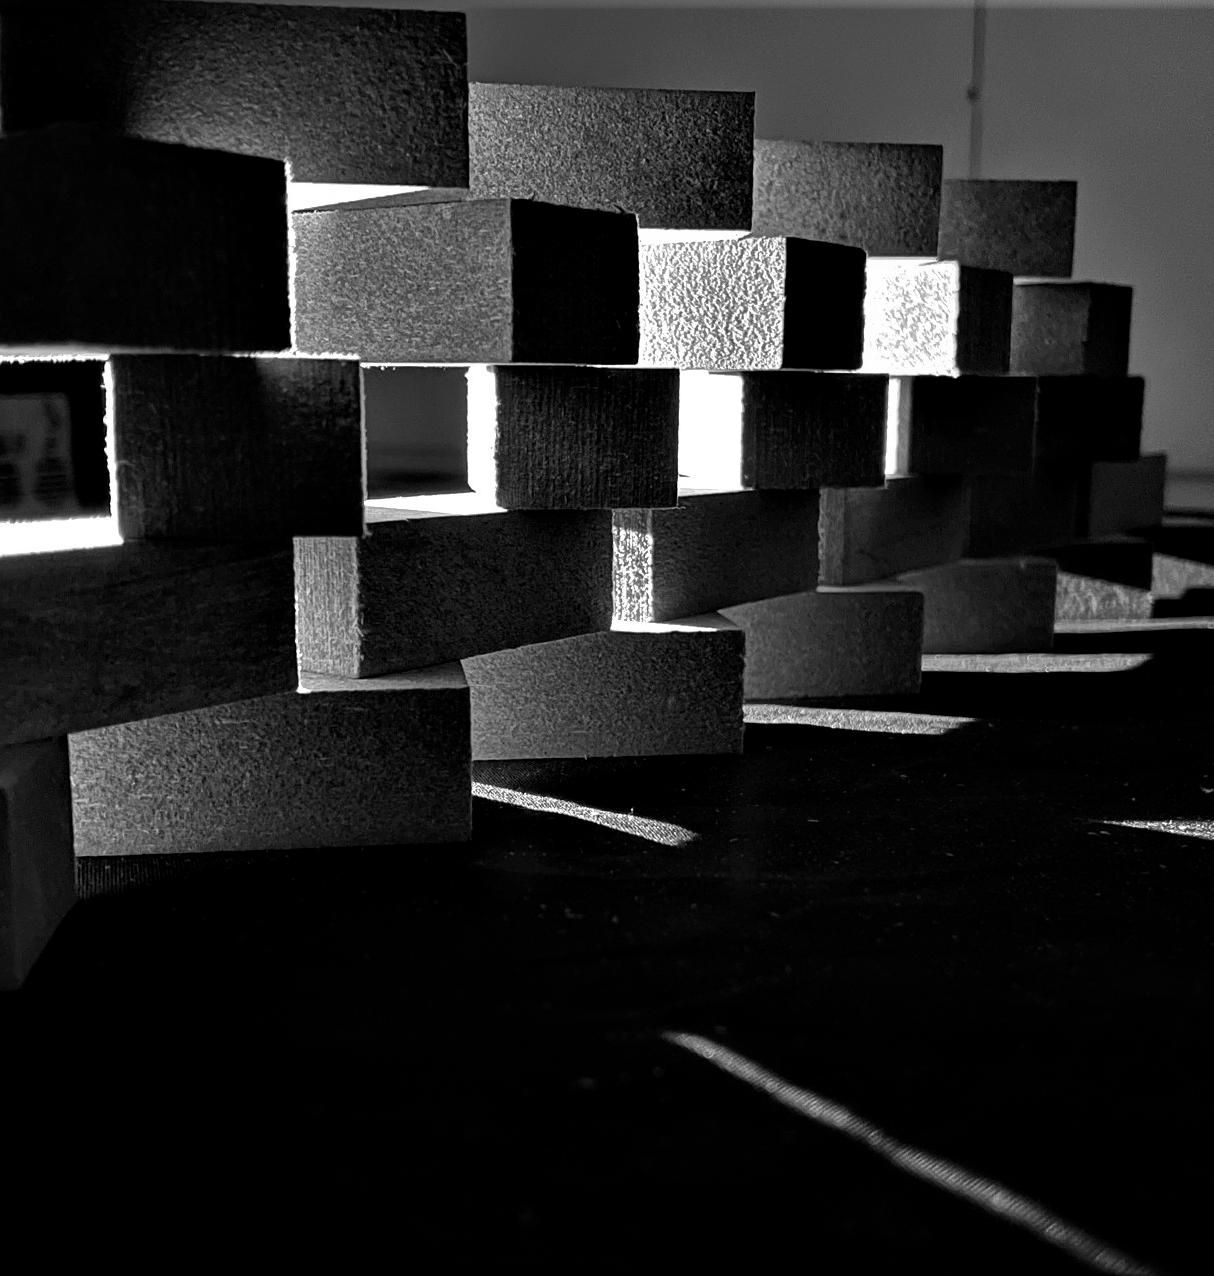
Clay Printing, Thermoplastic Printing & Assembling Wooden Blocks
Ann Arbor, Michigan, United States
July, 2022 - March, 2023
Consecutive Academic Projects (During Masters, University of Michigan) Teams of 3-4 People each
Role: As a Computational Designer, my contribution to the projects was to work on the design ideation and logic for generating the toolpaths for fabrication and improvement based on fabrication tests
Supervisors: Clay Printing - Prof. Catie Newell (cnewell@umich.edu), Thermoplastic Printing - Prof. Wes McGee (wesmcgee@umich.edu), Assembling Wooden Blocks - Dr. Arash Adel (aaadel@umich.edu)
Aim: To understand the workflow from design to computation to robotic fabrication using KUKAs. Also, understand the constraints involved and learn to debug and solve material and technical problems based on continuous experimentation and tests
Summary:
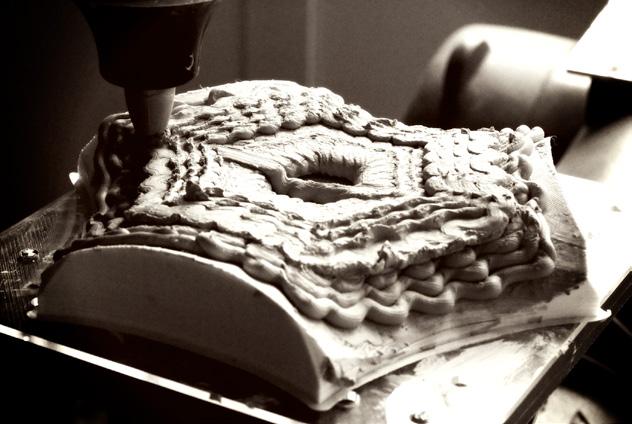
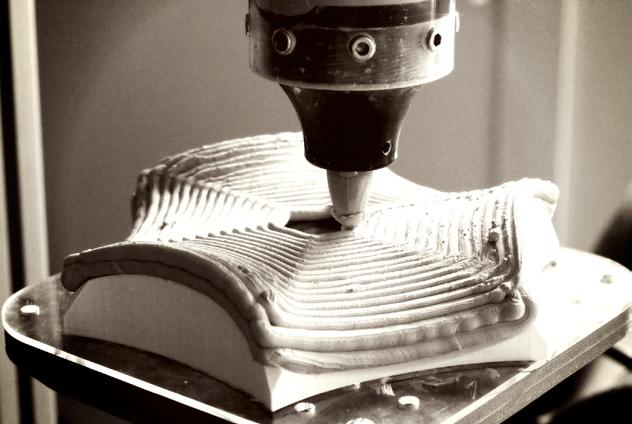
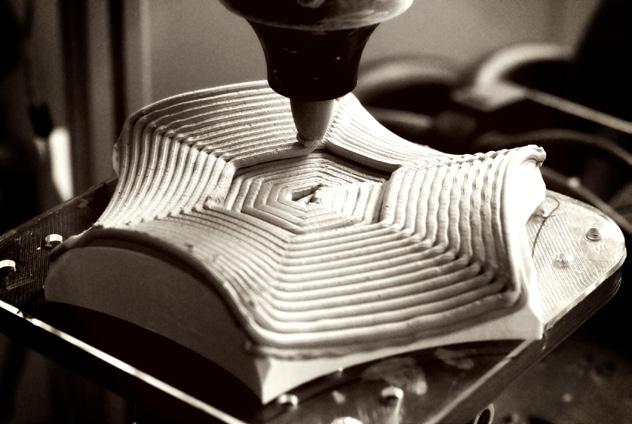
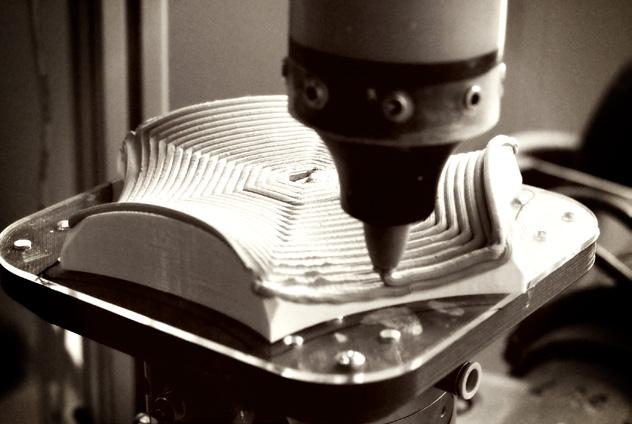
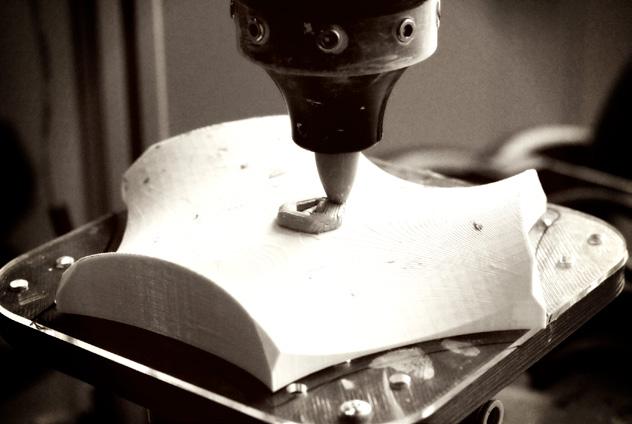
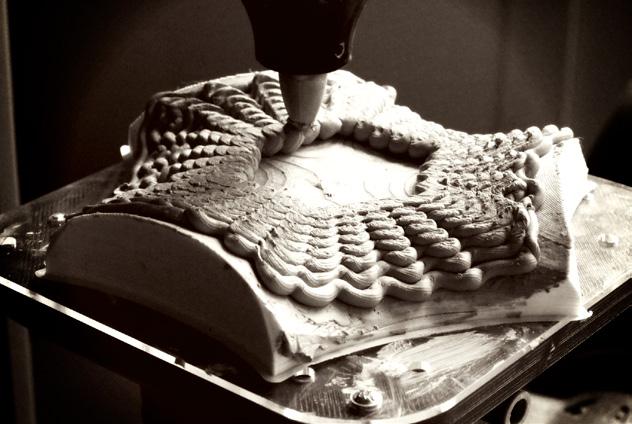
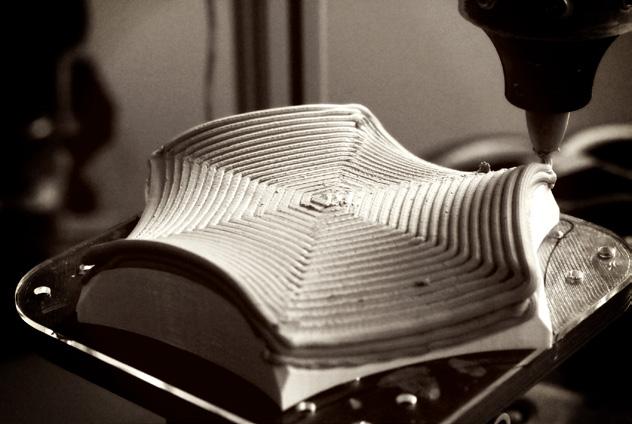
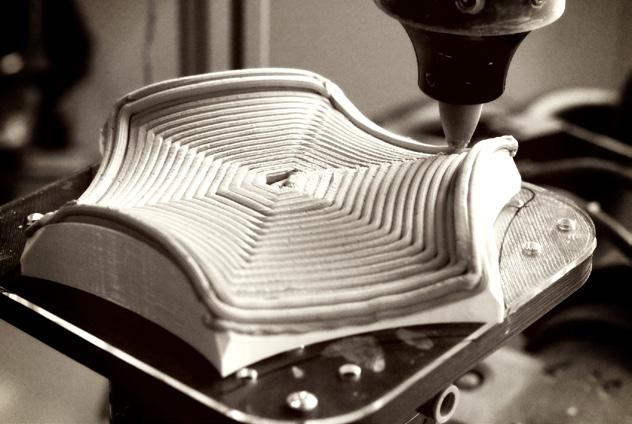
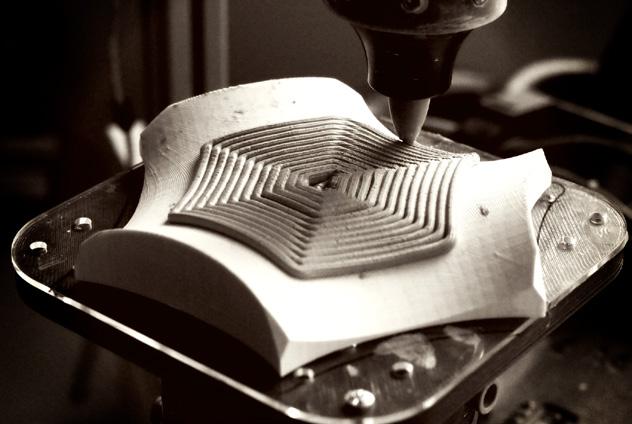
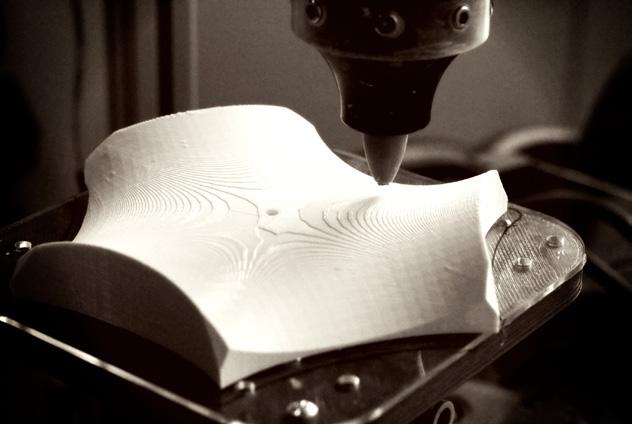
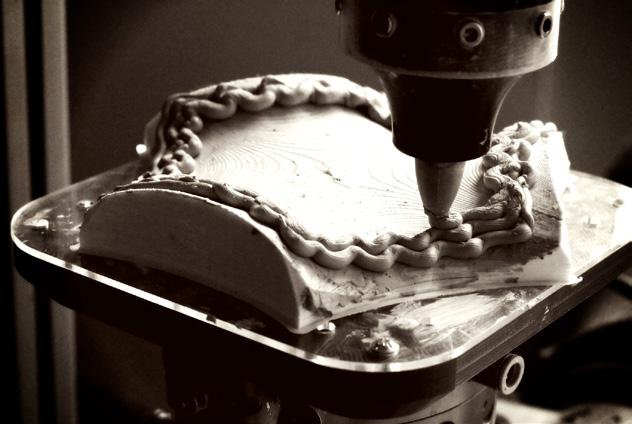
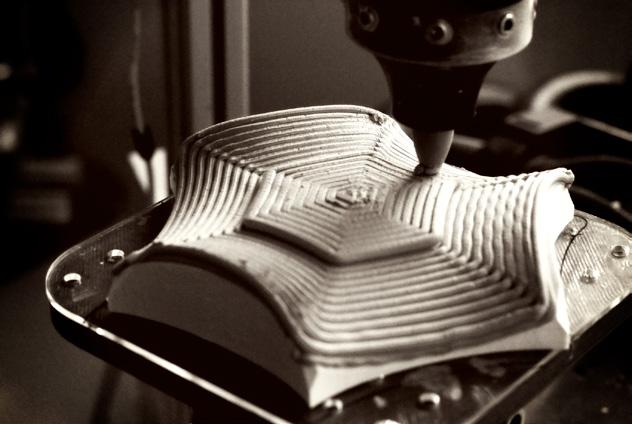
1. The Clay Printing Project was done on a KUKA-3 axis with a focus on understanding clay as a 3D-Printing material. Also, exploring how to do NonPlanar Printing using a 3-Axis robot
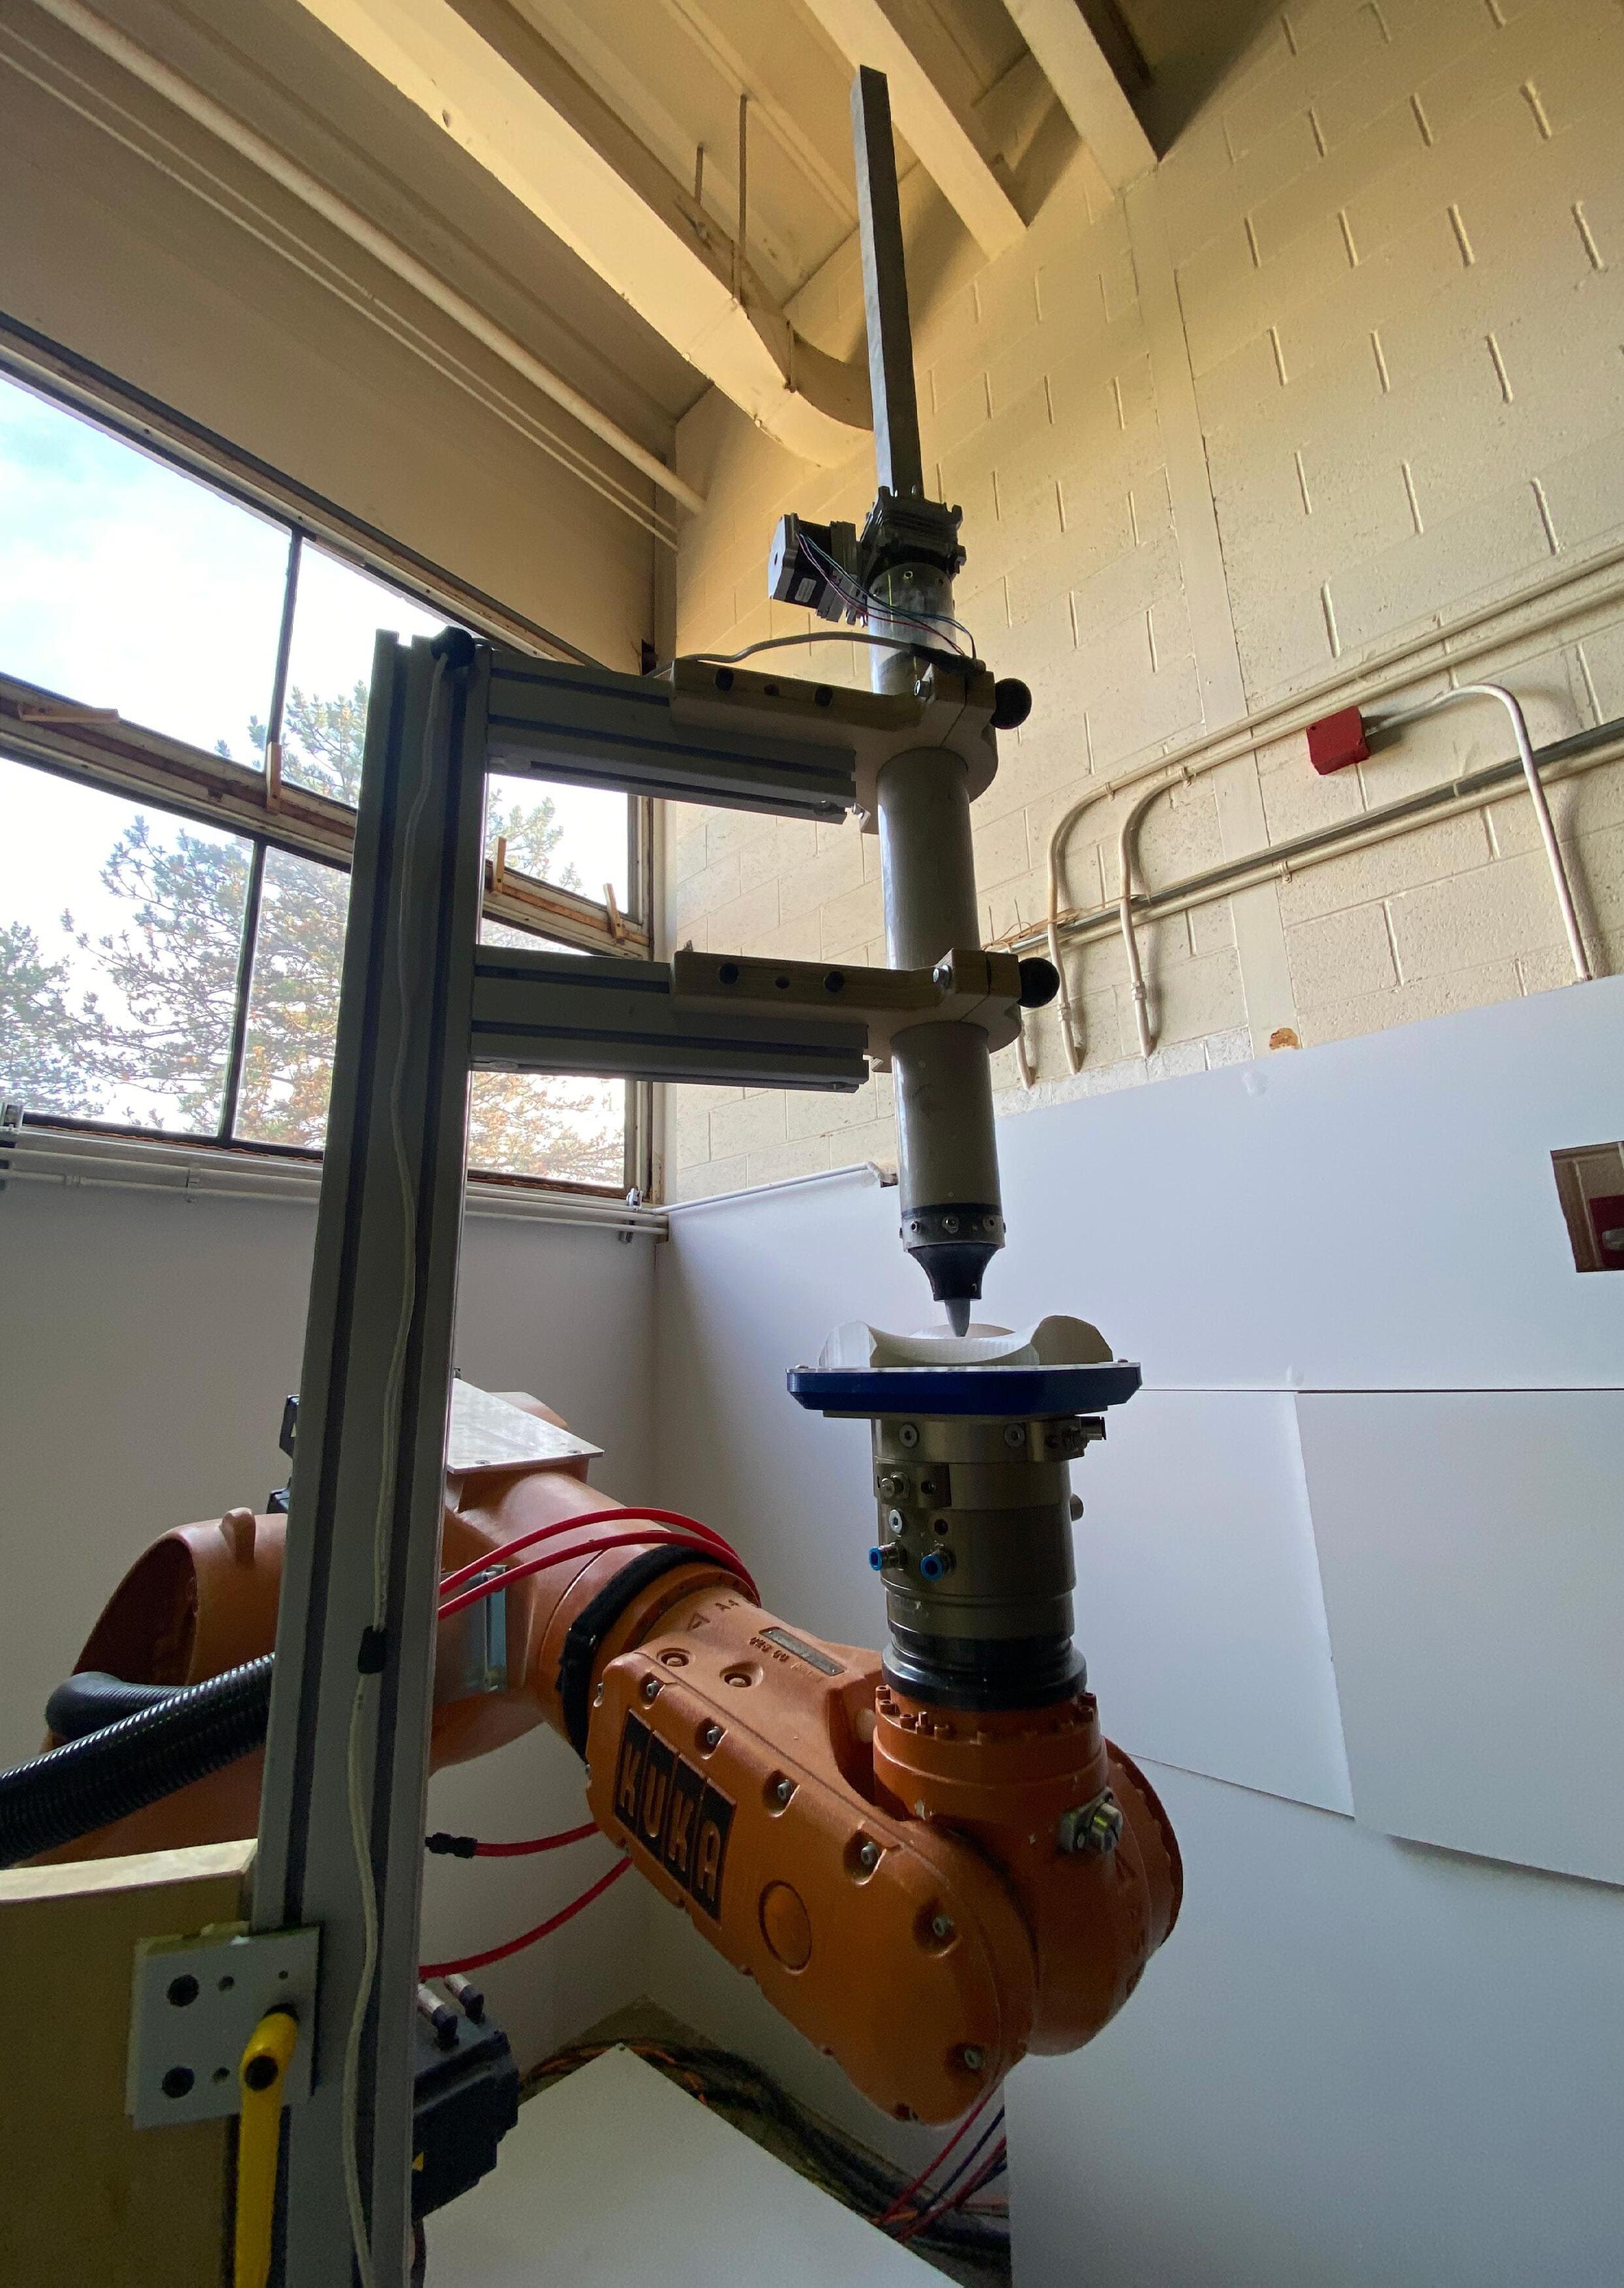
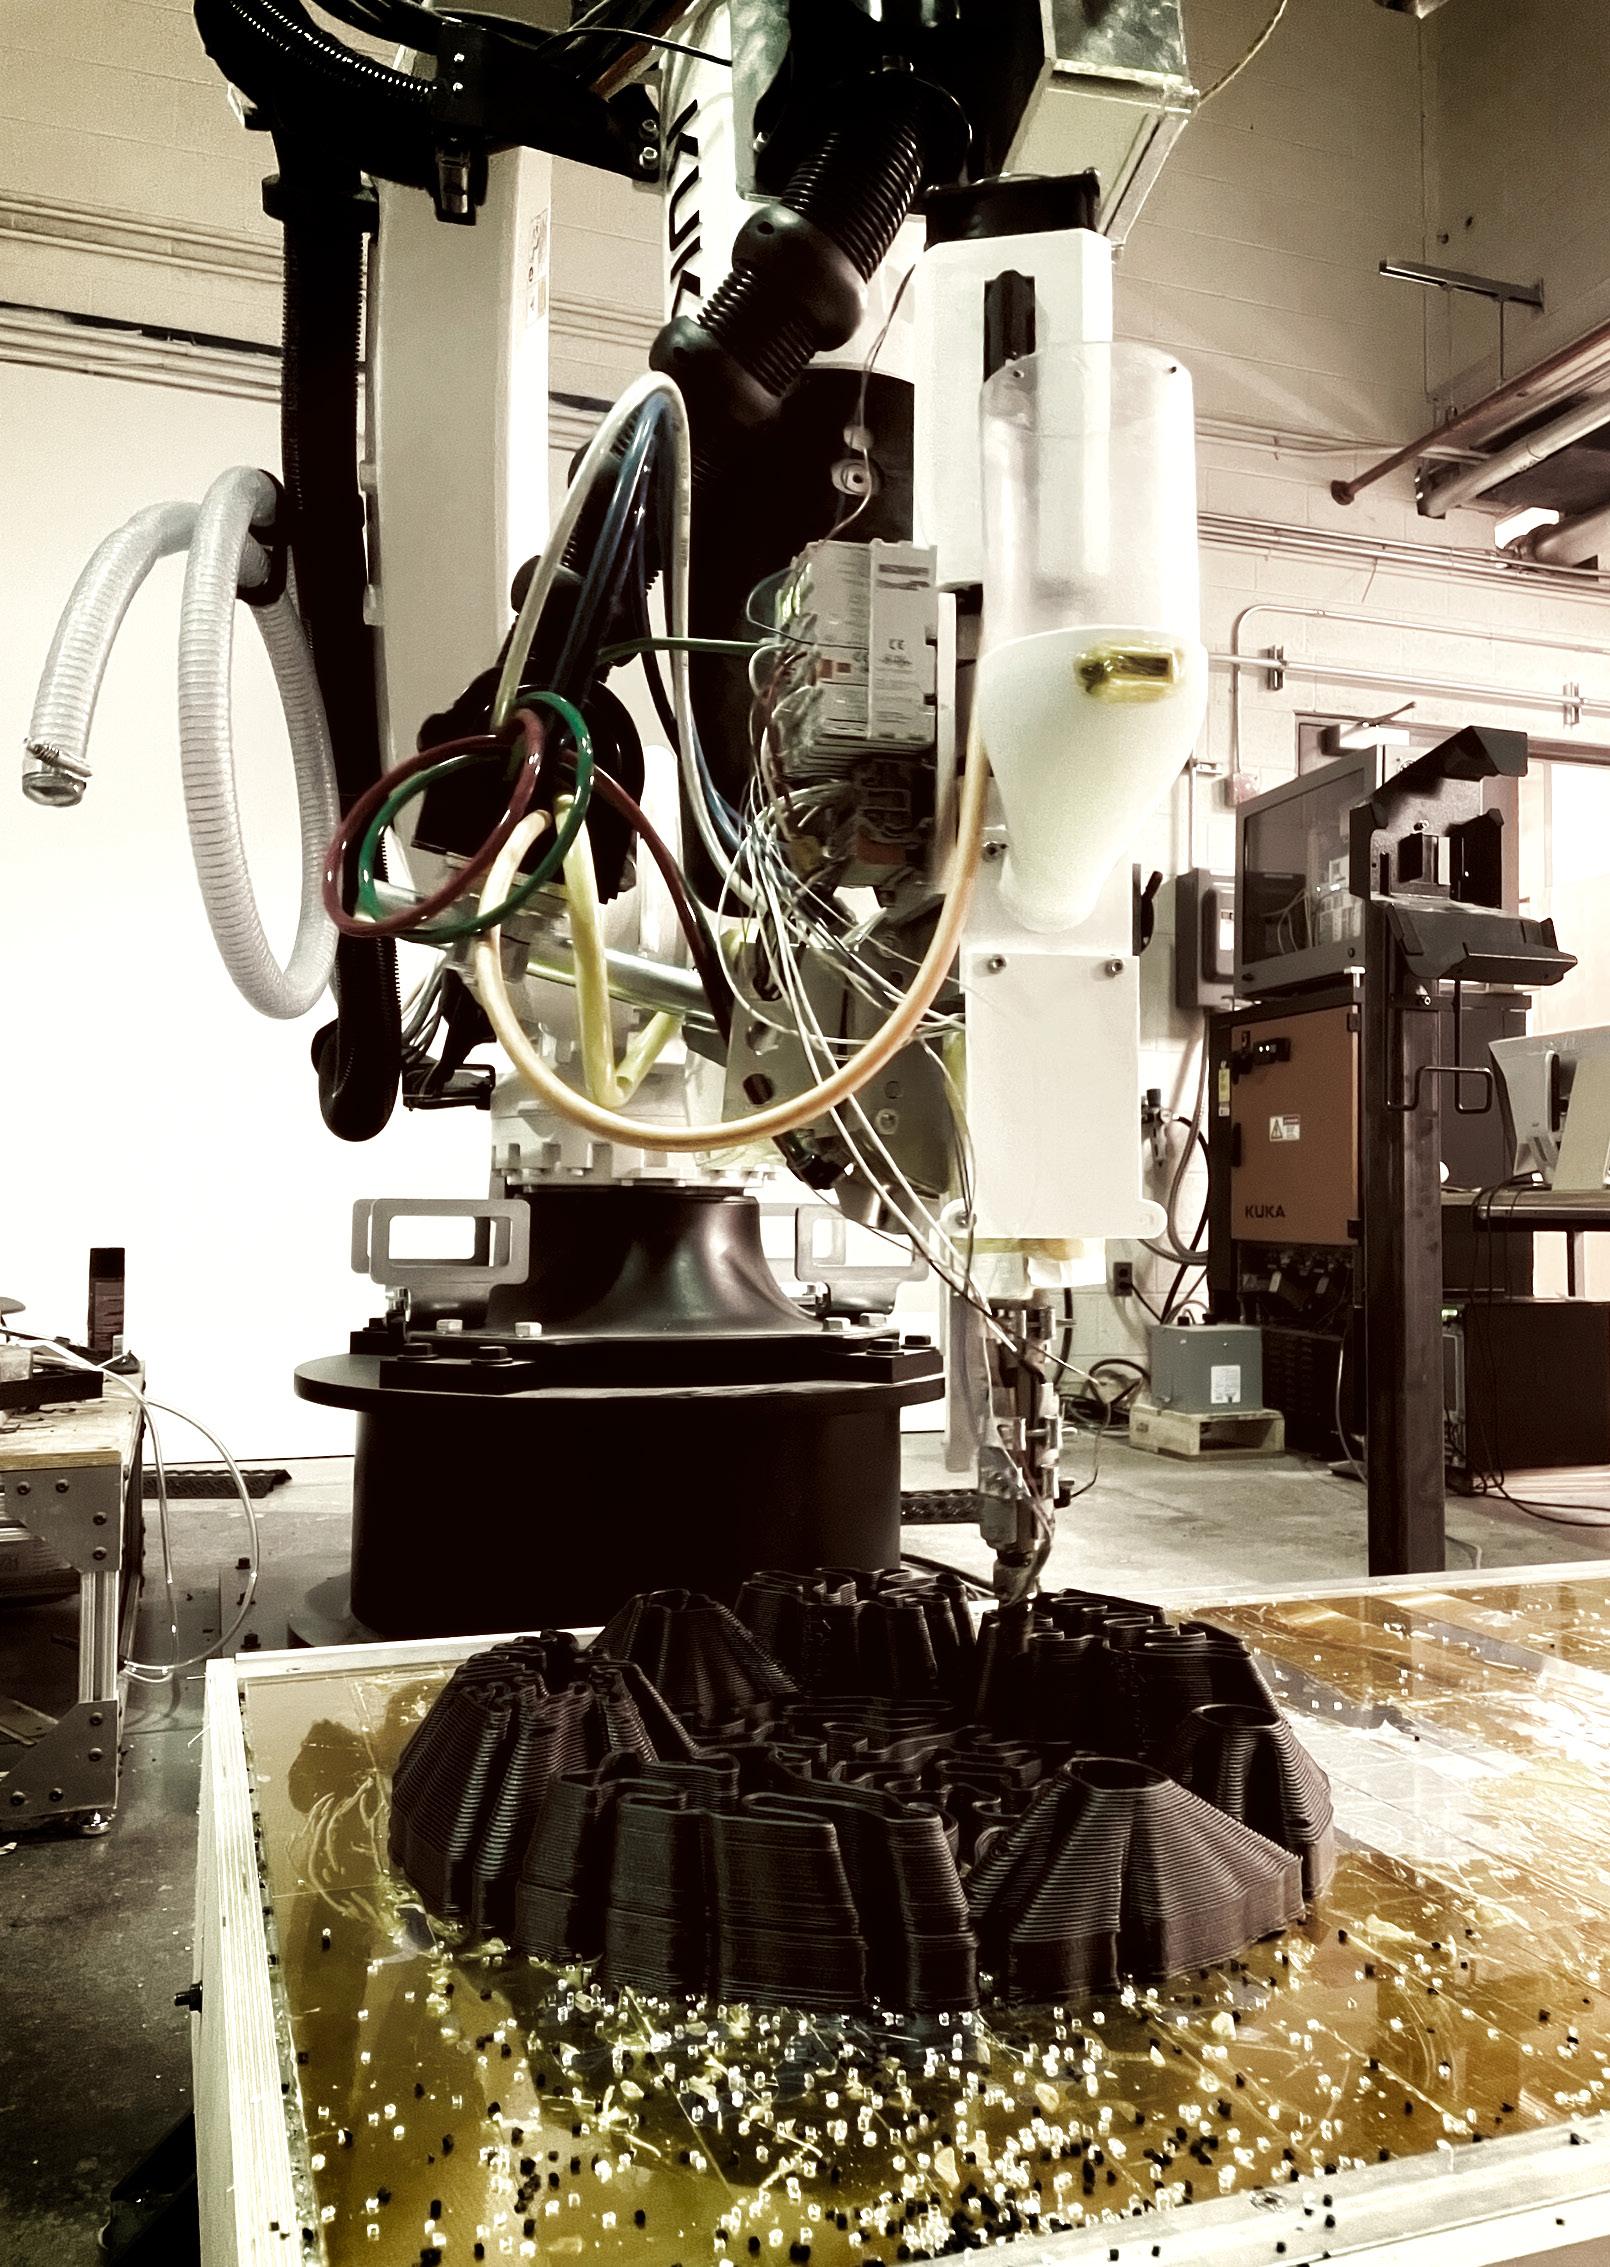
2. The Thermoplastic Printing Project was a more in-depth transition into understanding the various methodologies in Additive Manufacturing using Super Matter Tools (Developed by Prof. Wes McGee for Robotic Fabrication). Also, getting comfortable with using a KUKA-6 Axis
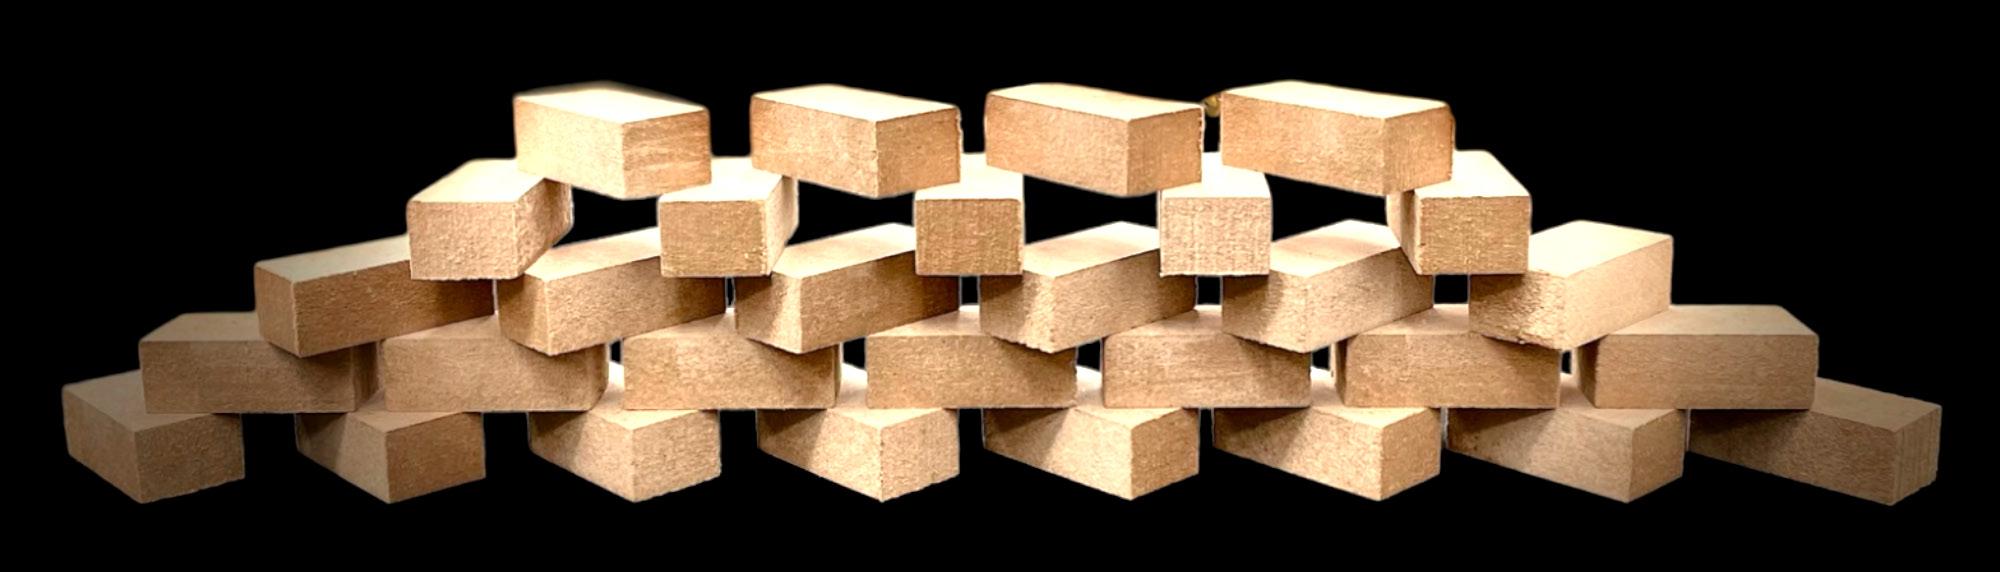
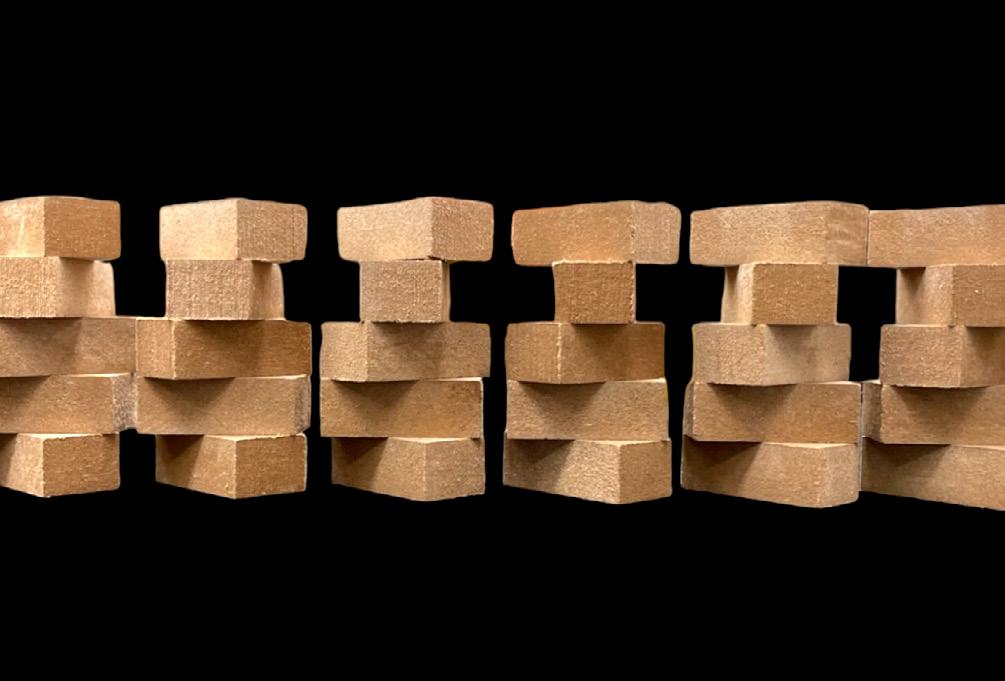
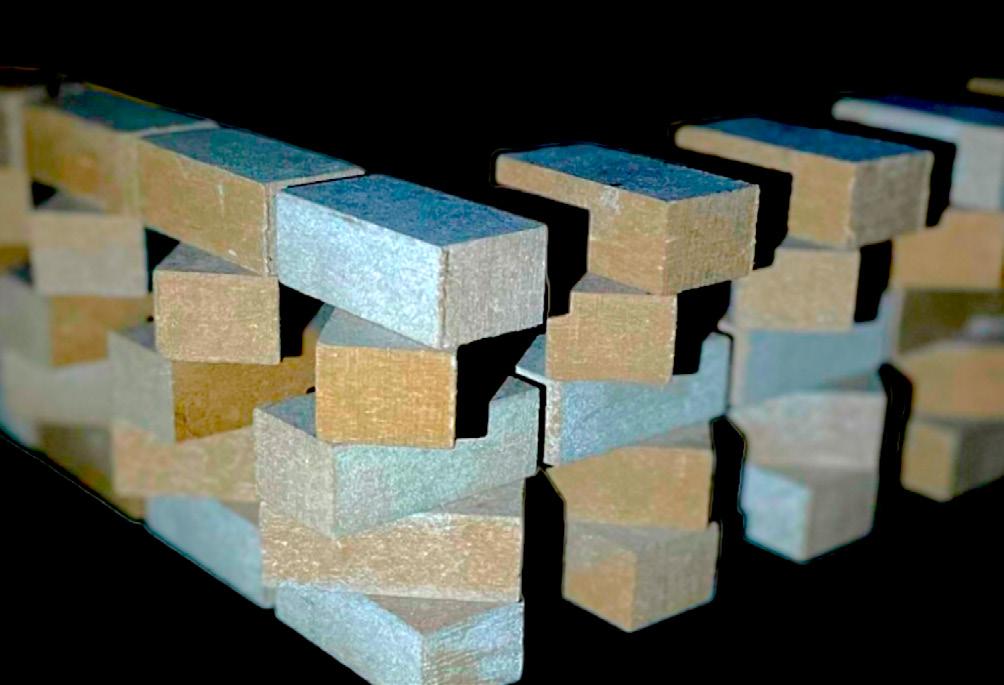
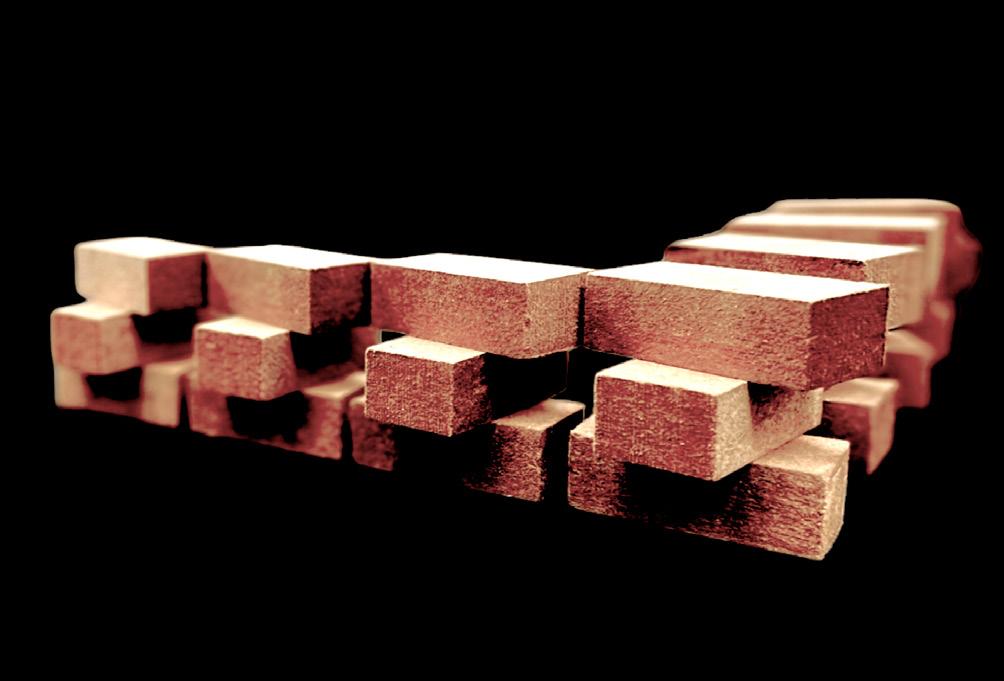
3. The Assembly of Wooden Blocks focused on understanding in detail the creation of toolpaths using joints, different motion techniques and affordances on KUKA-6 Axes
Keywords: Robotic Fabrication, Additive Manufacturing, Robotic Assembling Process, Toolpath Generation
Softwares Used: Rhino, Grasshopper, Python, KRL (Kuka Robot Language), Adobe Creative Suite
4
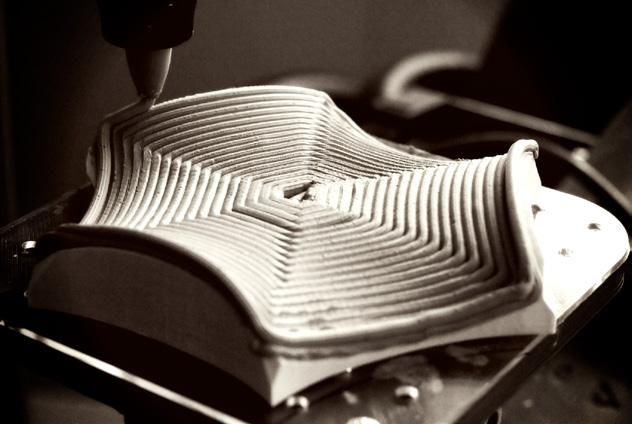
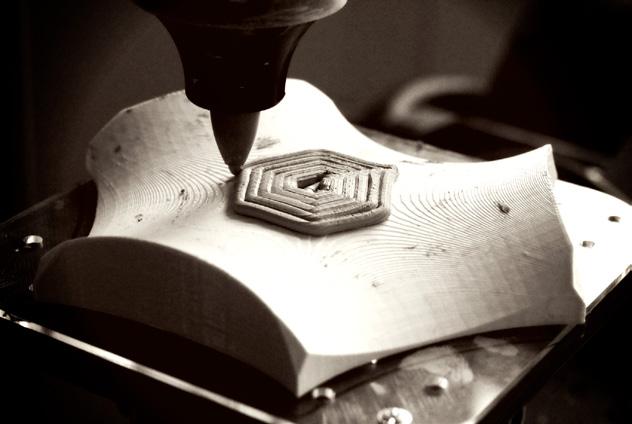
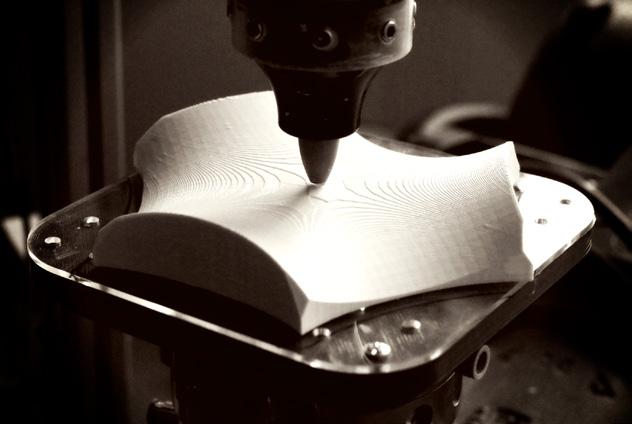
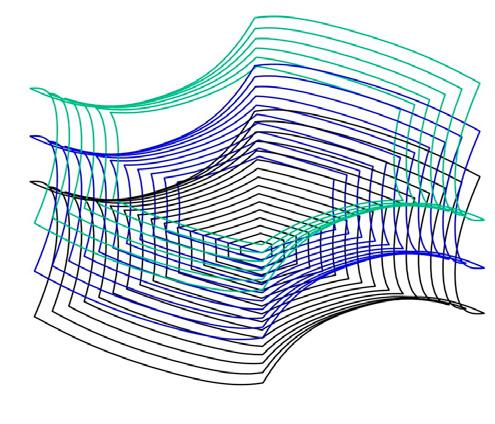
CLAY PRINTING ITERATIONS ON THE 3-AXIS ROBOT
5
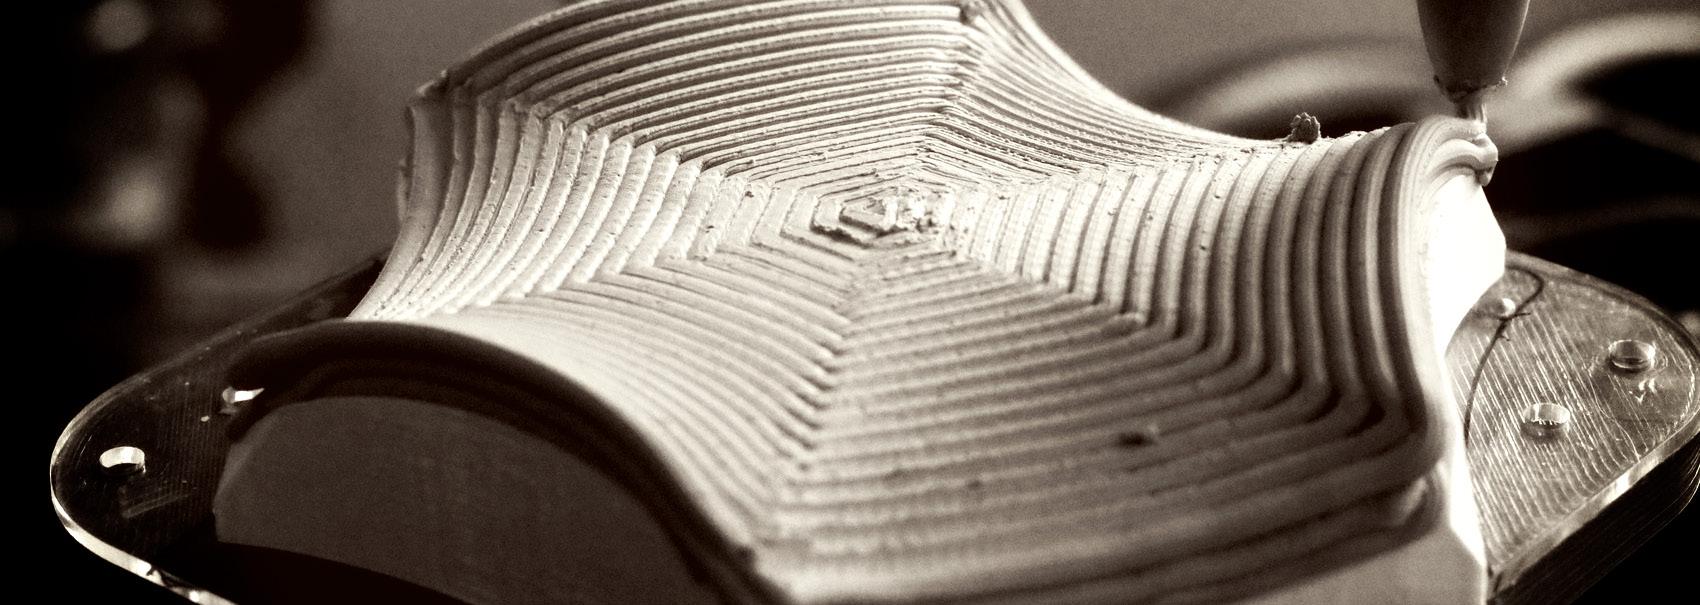
As the base was flat, we 3D-Printed a non-planar jig to put on the base for the object to be clay printed where the toolpath follows the topology of the jig
WORKFLOW
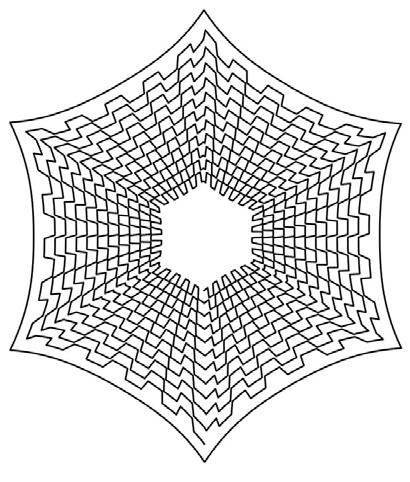
The idea was to explore a part of a Geometric Minimal Surface and print that out using Clay. The shape was modelled and traced to generate toolpath patterns that were workable on the robot using rhino and grasshopper. Extrusion thicknesses and layers were added. The final file to be run on the robot was simulated and generated using KUKA-Prc plugin in grasshopper


6
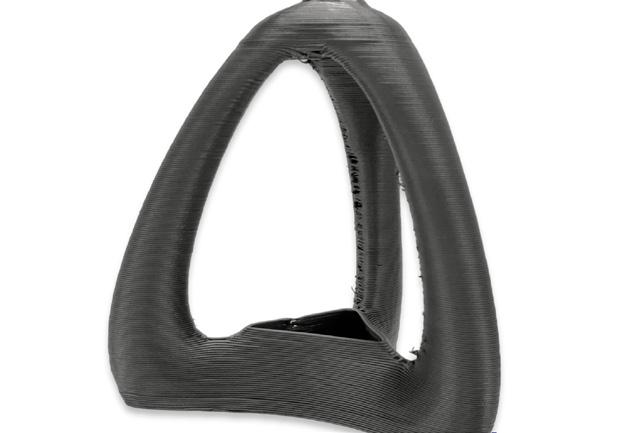
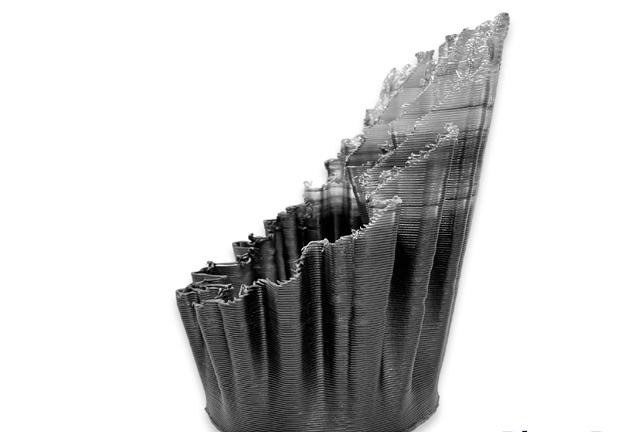
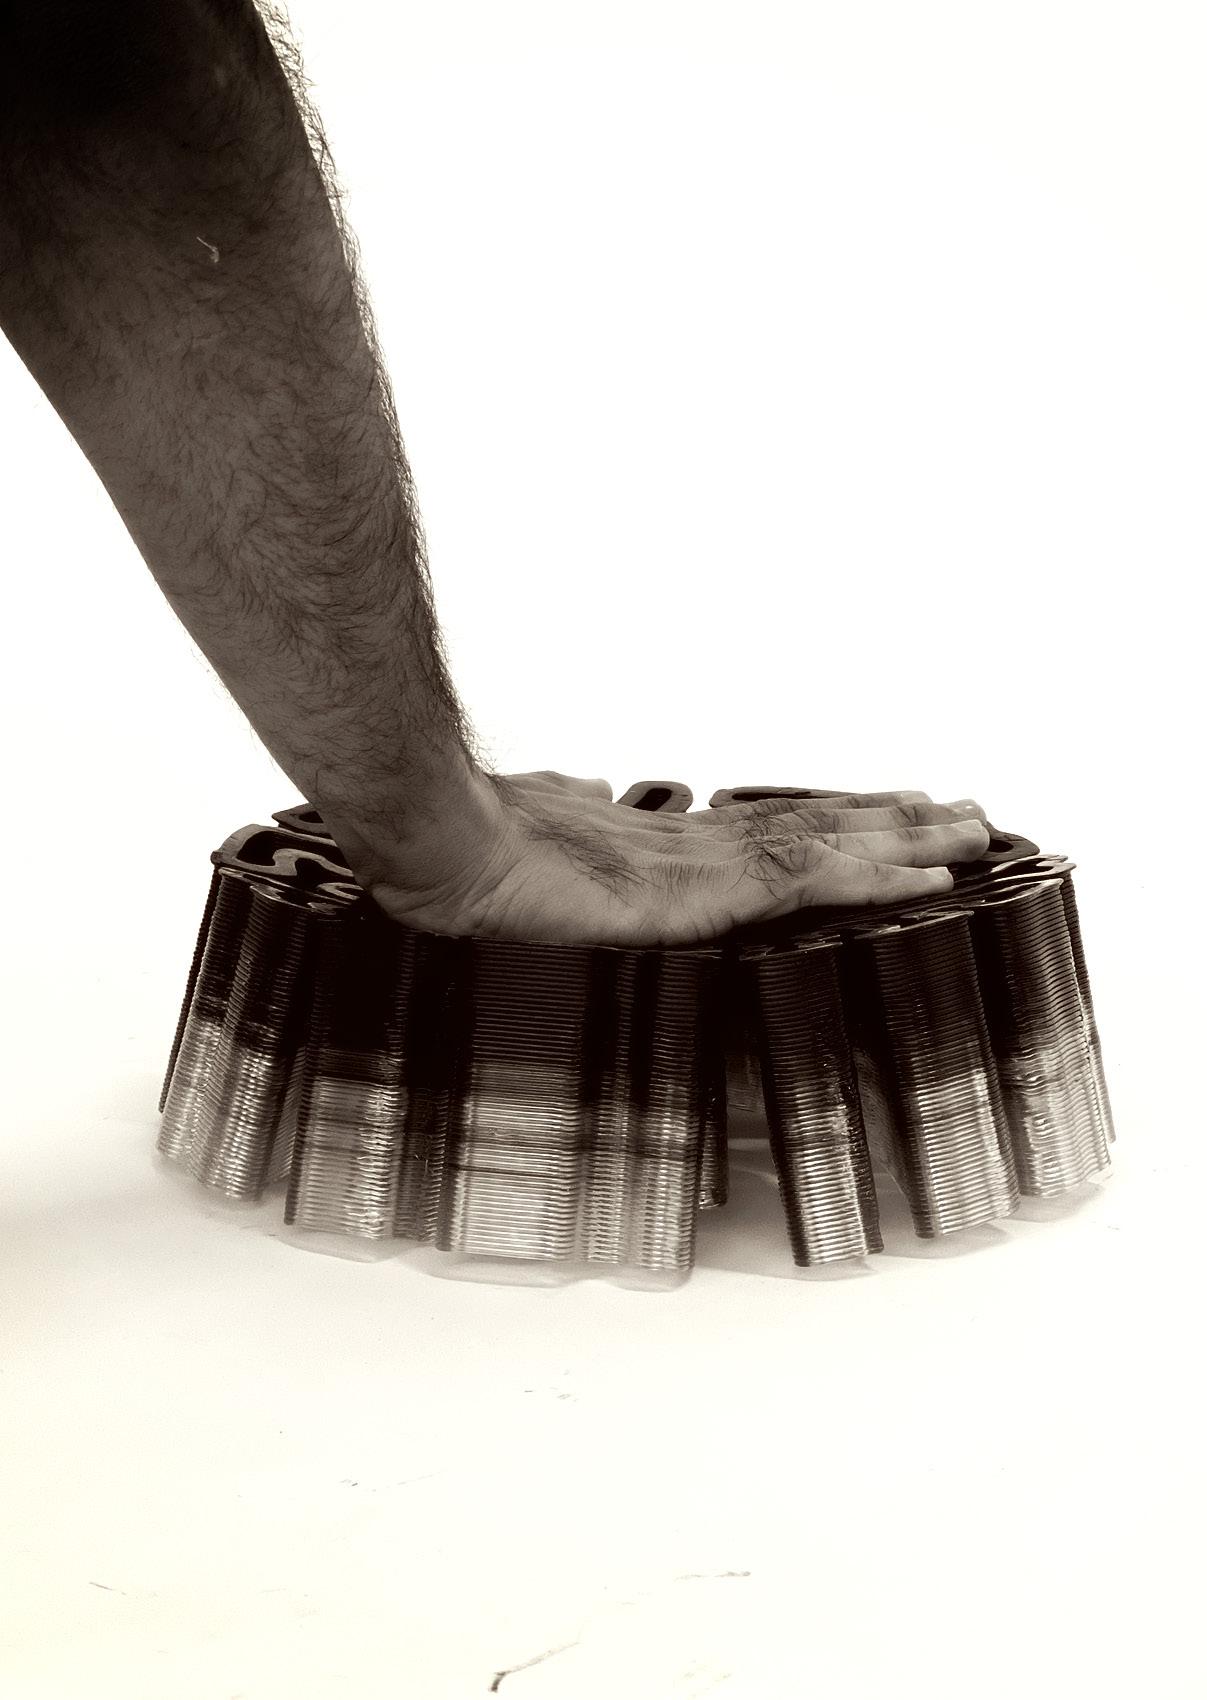
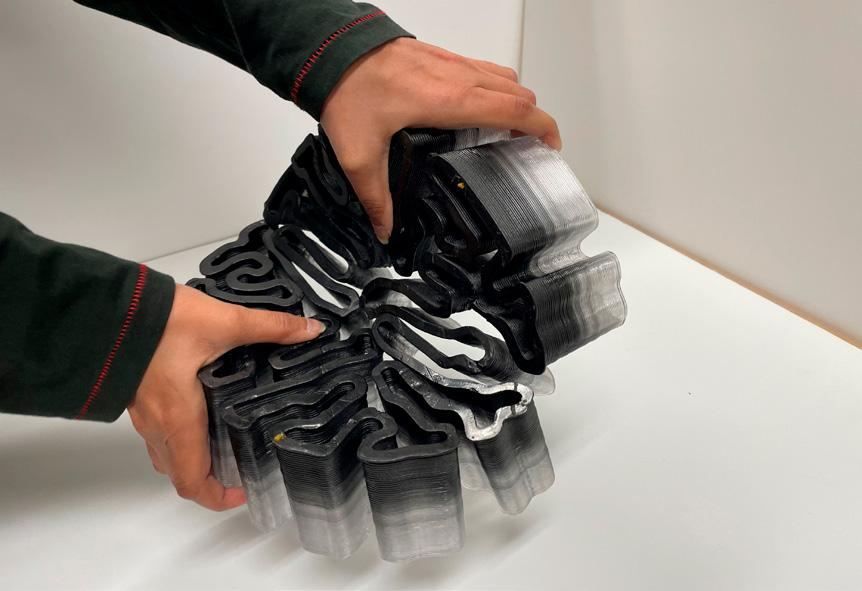
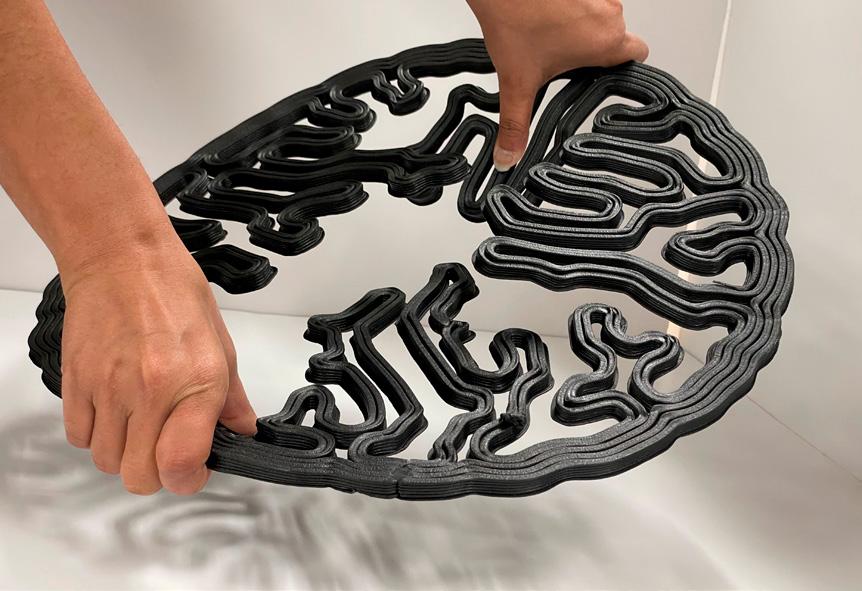
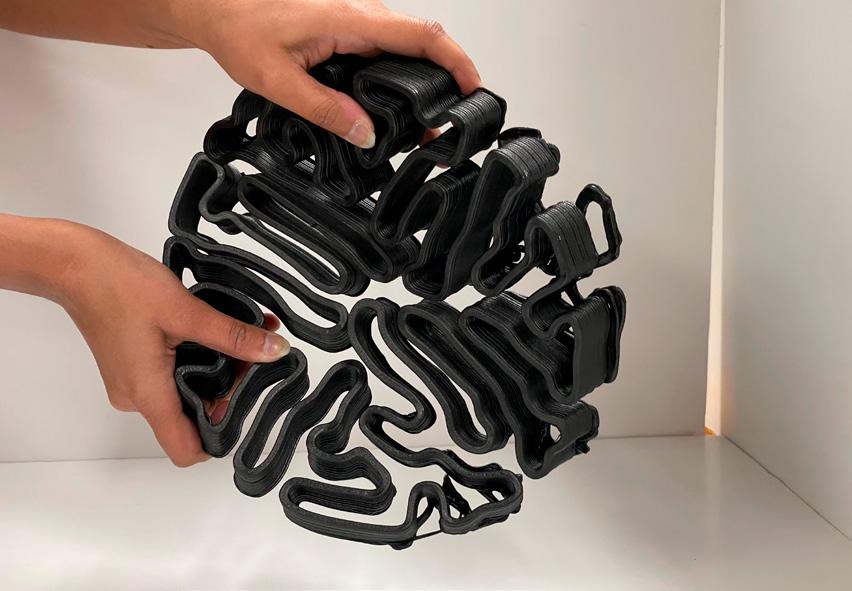
THERMOPLASTIC EXPLORATIONS
1. Do intersecting or non-intersecting coral patterns have the potential for creating flexible structures?
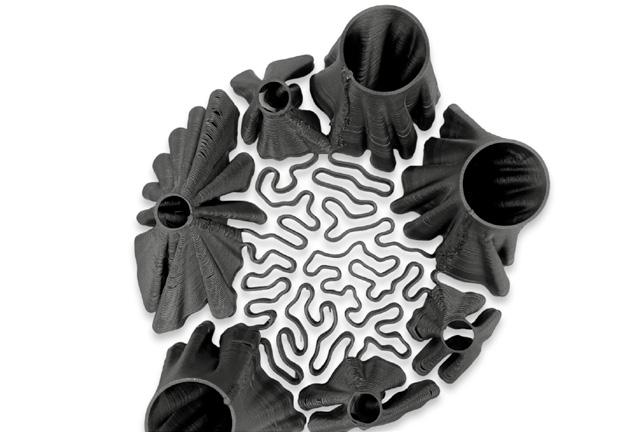
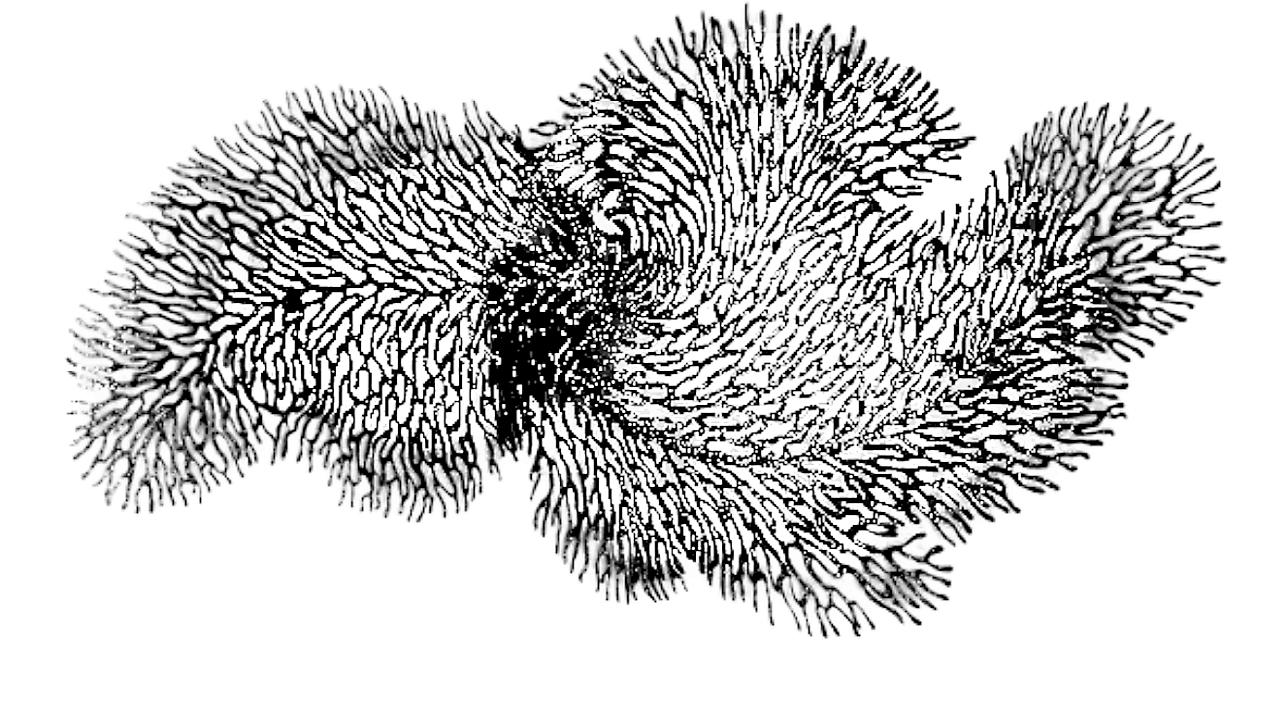
2. How to use these patterns to give plastics more flexible material behavior combined with its inherent strength?


3. How to utilize robotic thermoplastic additive printing to test and achieve the above results?
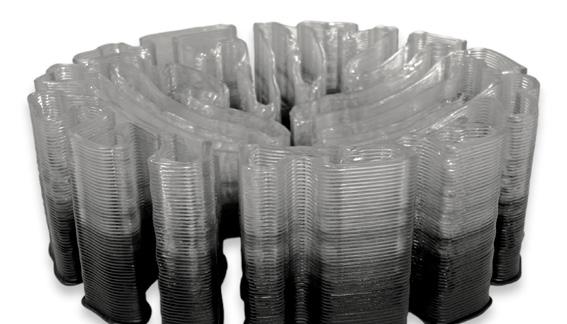
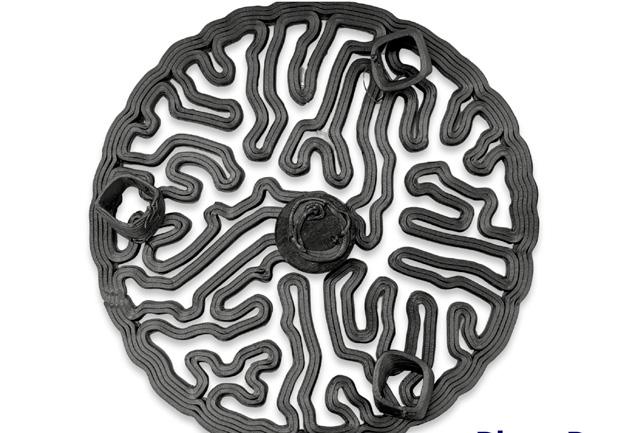
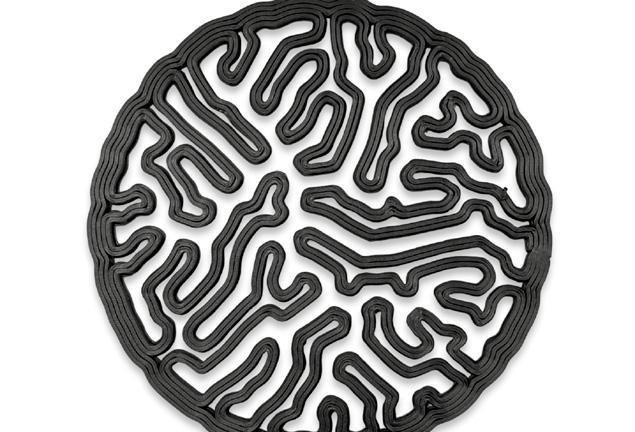

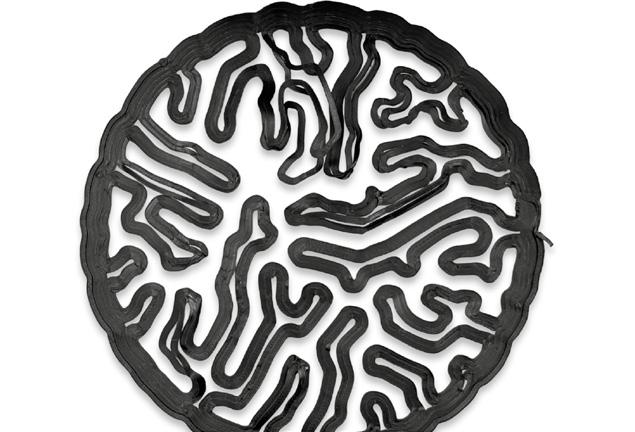
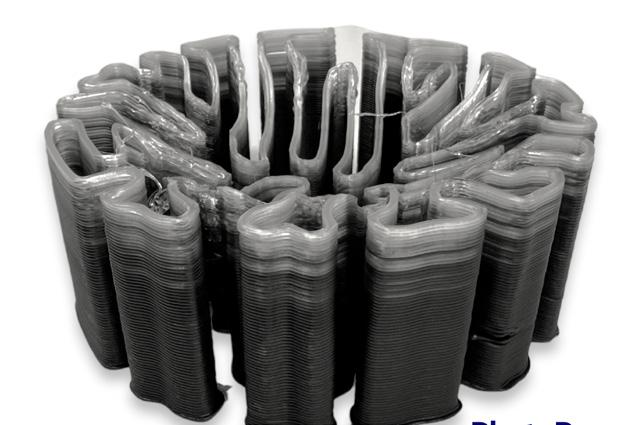
TESTS & ITERATIONS
Various experimental tests were done using Super Matter Tools (SMT) in Rhino and a KUKA-6 Axis robot. Methods explored were mainly planar or non-planar slicing (Tween in SMT)
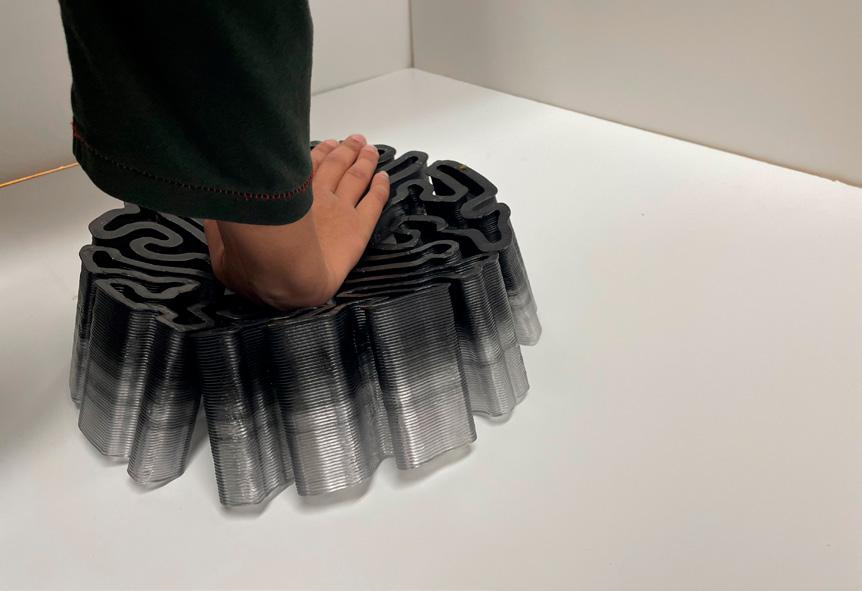
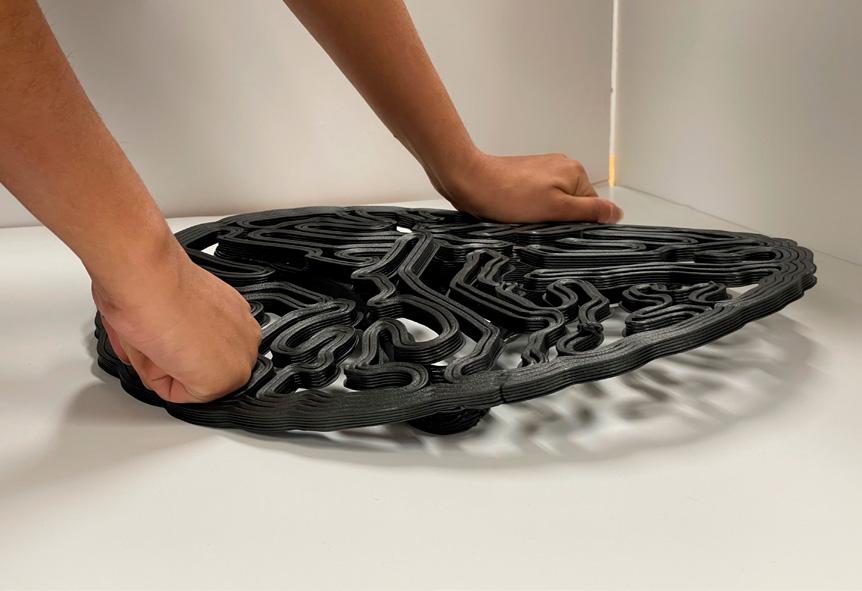
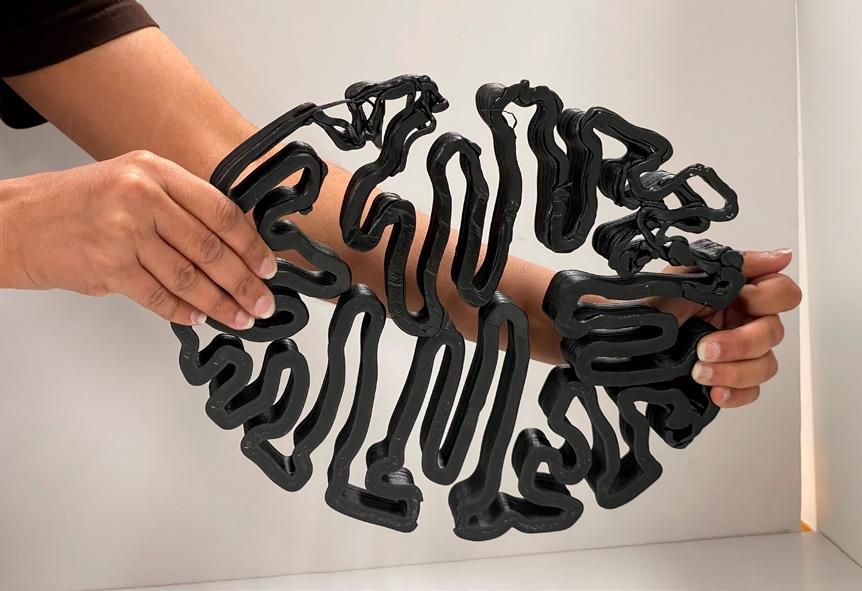
PATTERN 7
CORAL
TESTING THE FLEXIBILITY AND DURABILITY OF THE PRINTS
8
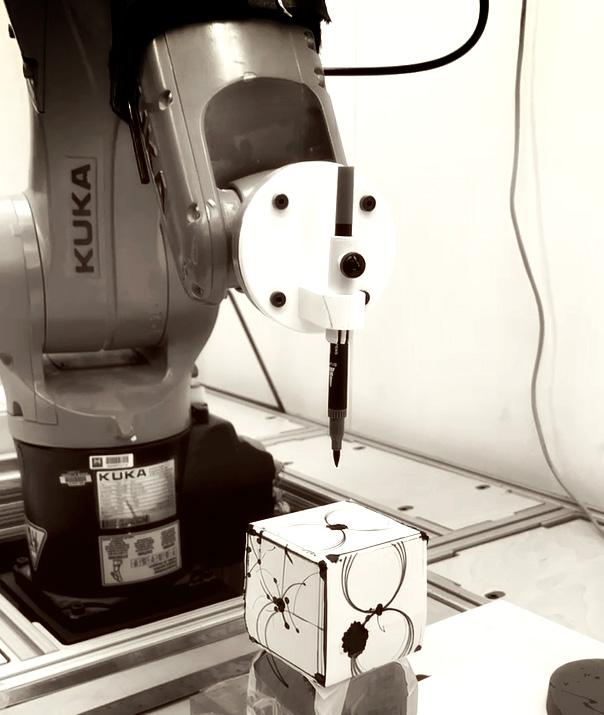
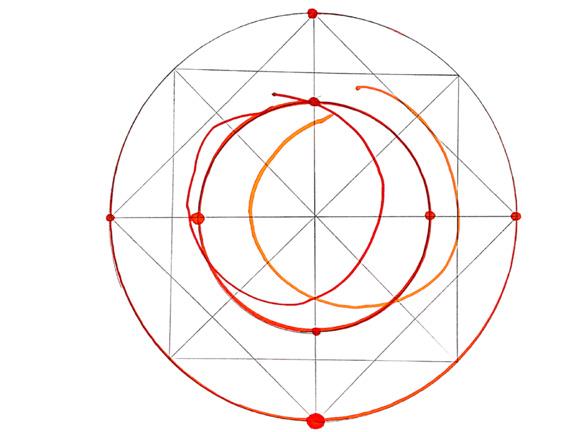
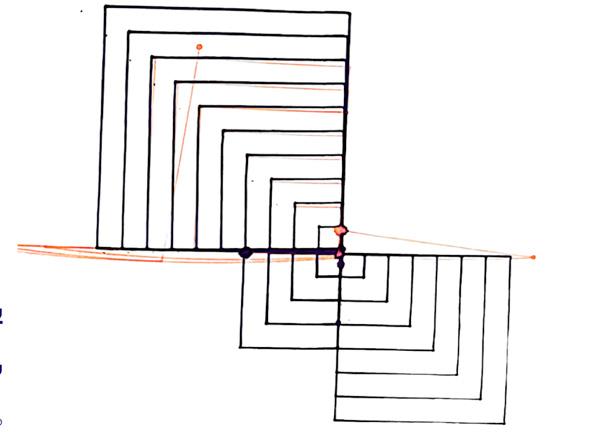
ROBOTIC DRAWING ITERATIONS
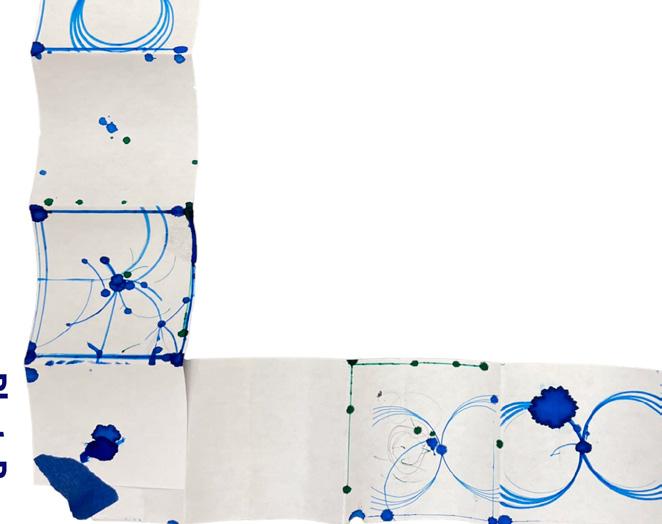
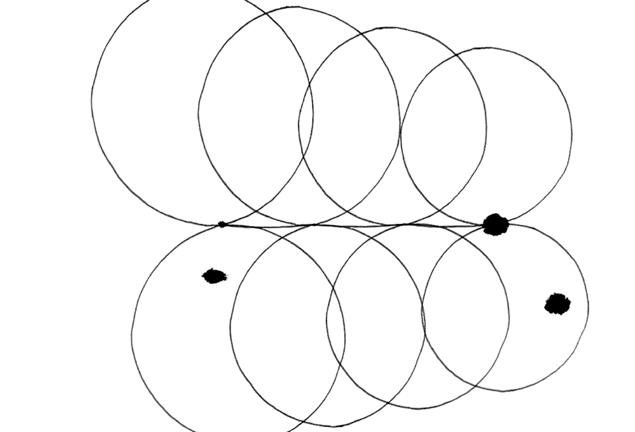
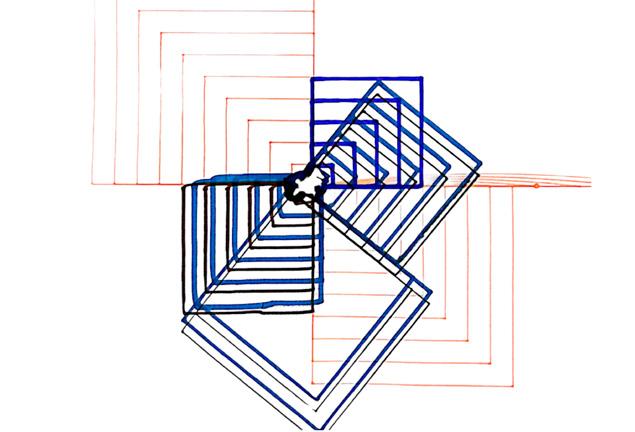
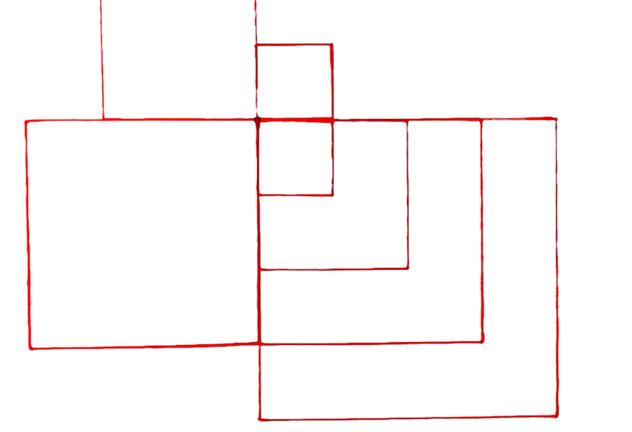
Understanding how to generate toolpaths on a KUKA-6 Axis using KRL (Kuka Robot Language)
9
CODE SNIPPET (KRL)
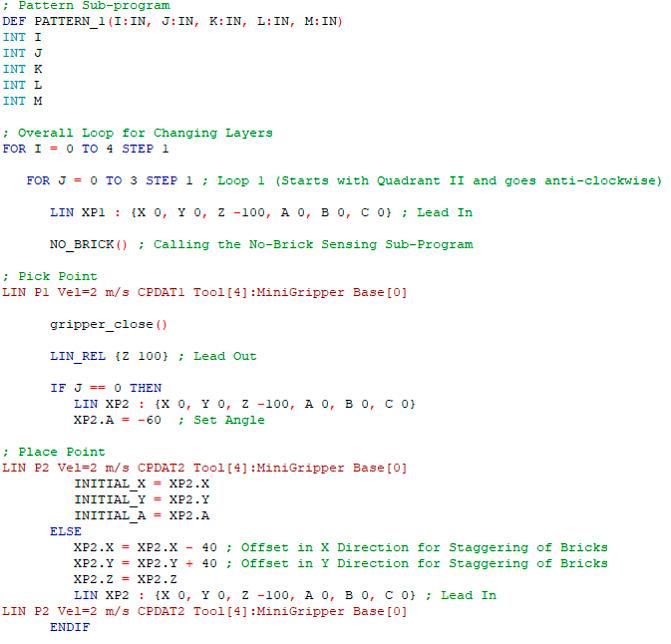
Using the learnings from Robotic Drawing Explorations to create a code that assembles wooden blocks in certain patterns using Point to Point (PTP) and Linear (LIN) robotic motion techniques along with Axis Joint angle manipulations while avoiding singularity constraints
10

11
ACADIA Workshop
Fabrication for Building Components
Philadelphia, United States
October, 2022 Workshop Project 8 people workshop
Role: Contributed to Design Ideation, Development and Installation
Supervisors: Cesar Fragachan and Tim Fu (From Zaha Hadid Architects Computational Design Group, London)
Aim: To understand how to design fluid forms that can be structurally panelled and fabricated in real world scenarios
Summary: Using Rhinovault in Rhino, fluid forms were modelled and analysed for stresses to create panelled structures and then fabricated on the ABB Robot using Robots plugin in grasshopper
Keywords: Robotic Fabrication, Structural Panelling

Softwares Used: Rhino, Grasshopper, Rhinovault, Maya, Adobe Creative Suite
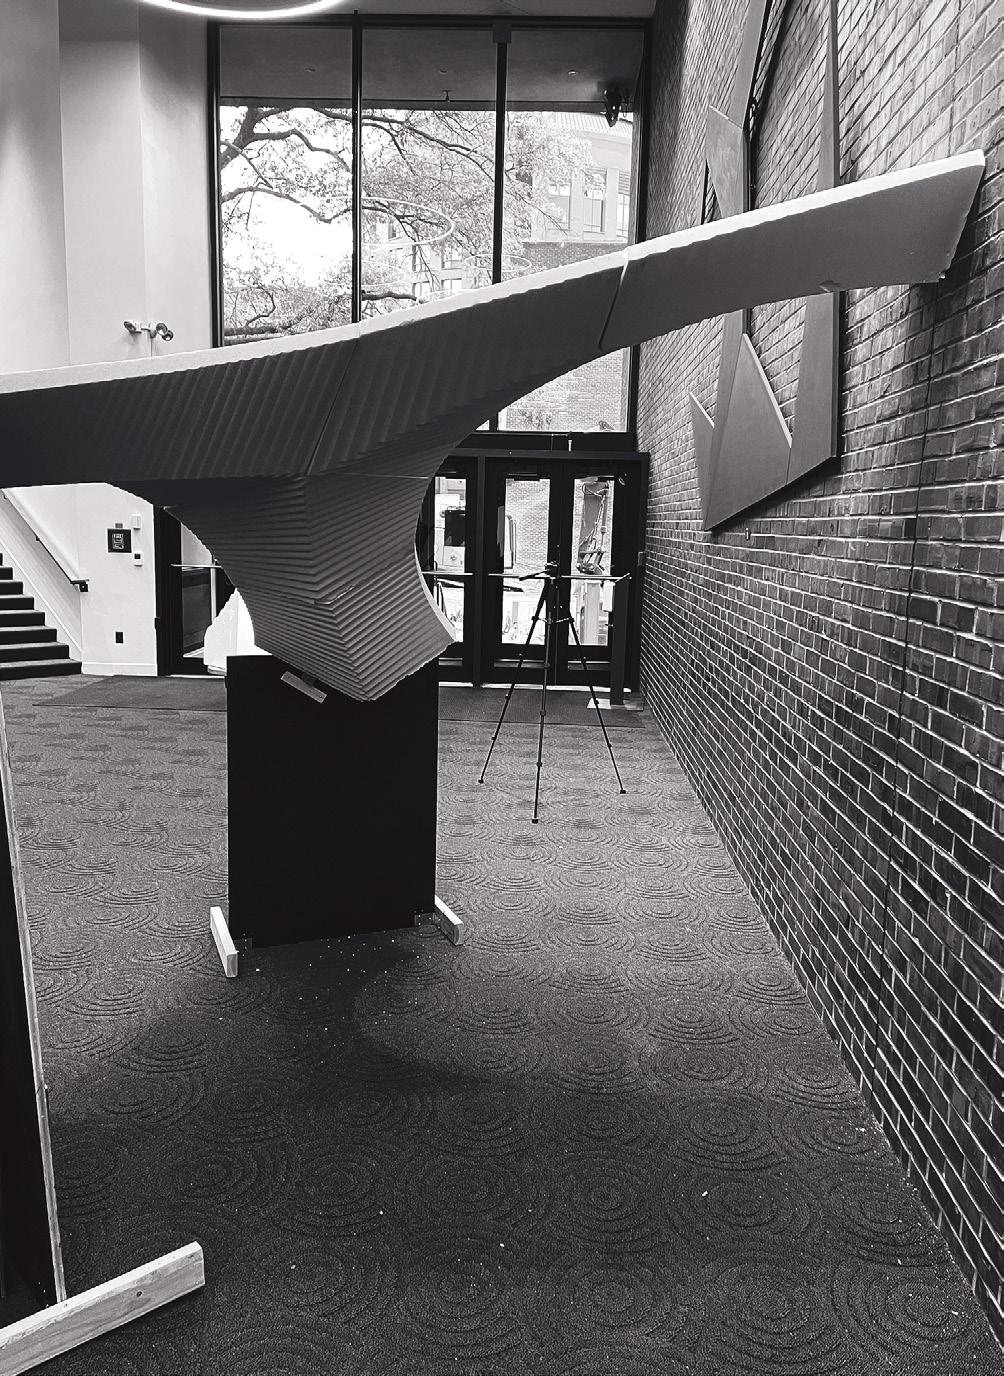
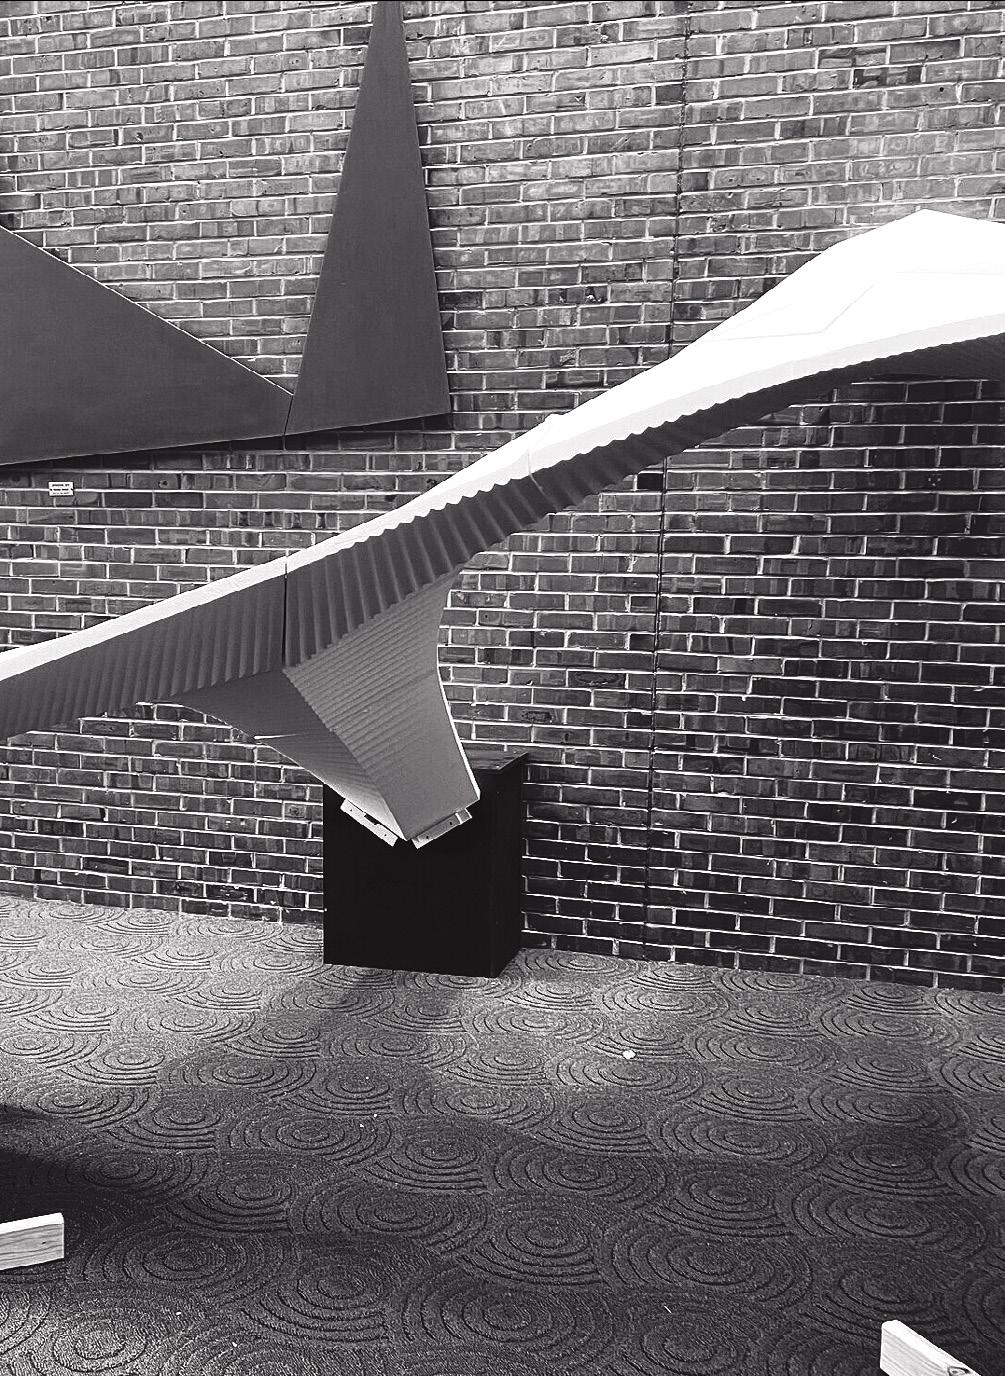
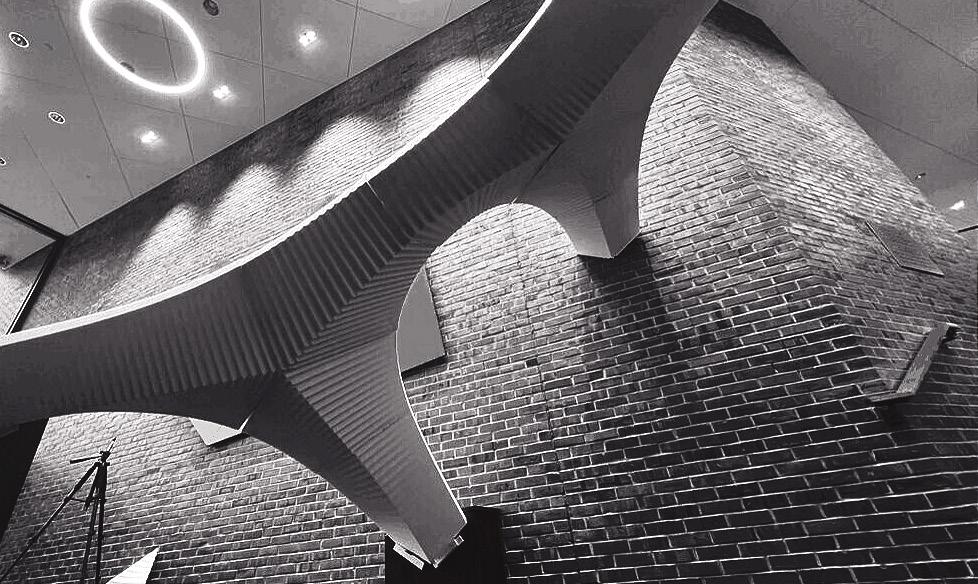 ACADIA WORKSHOP, 2022
12
Part of fabricating and assembling this installation at the Weitzmann School of Design, University of Pennsylvania
SYSTEMATIC EXPLORATIONS
A series of steps on the right depict the workflow of generating a panelled structure from a set of lines, which are analysed for stresses and stability using rhinovault before taking a part of it for robotic fabrication and installation
1 5 2 6 3 7 4 8 13
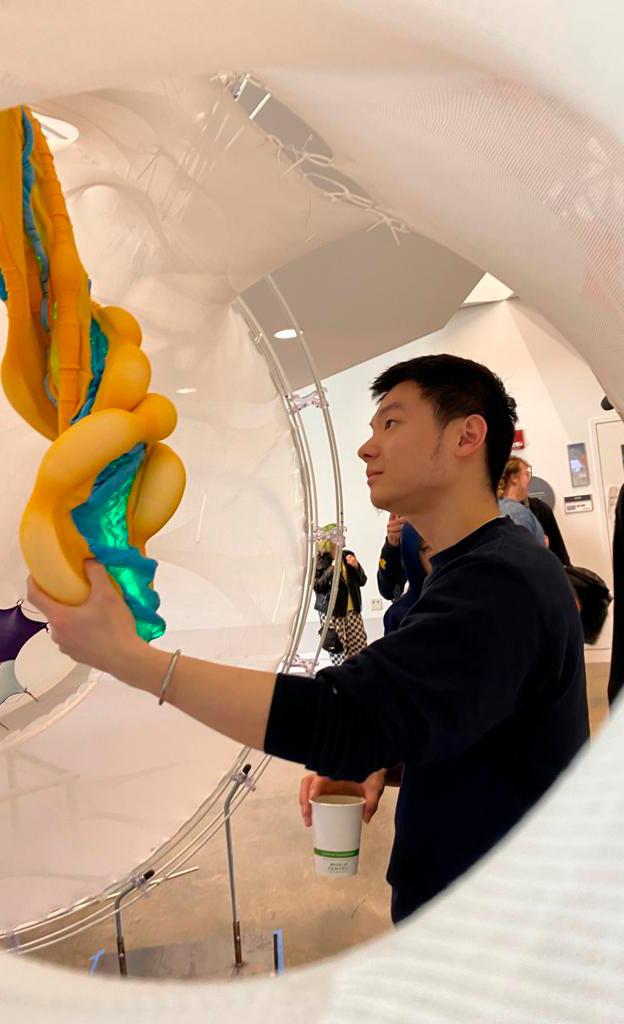
Breathing Fabric
A Hybridization of Machine Knitted Textiles with Inflatables
Ann Arbor, Michigan, United States
August, 2022 - Ongoing
Academic Project (During Masters, University of Michigan) Team of 3 People
Role: Contributed to user studies and observations, material explorations, computational workflow, creating knitting logics and installation
Supervisor: Prof. Sean Ahlquist (ahlquist@umich.edu)
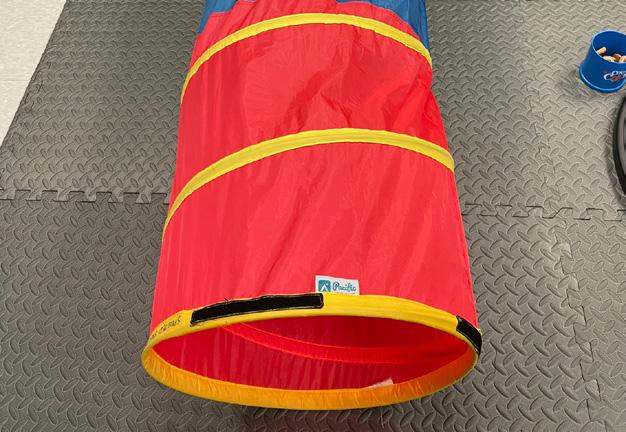
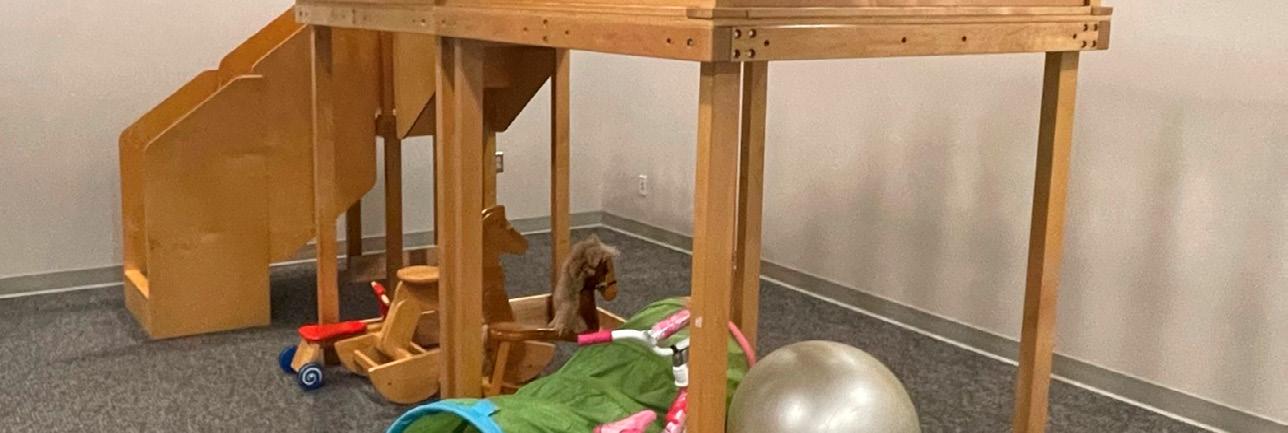
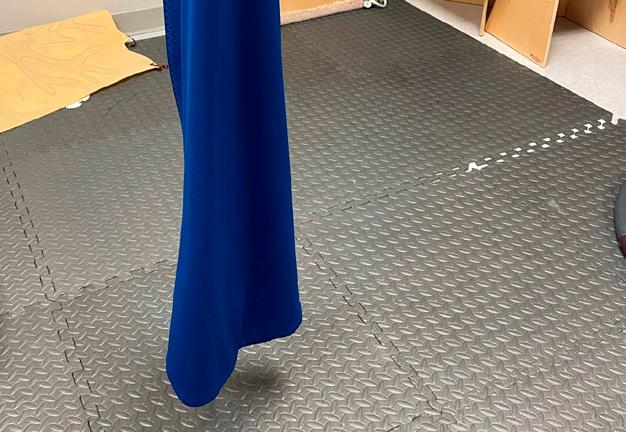
Aim: To design for children with Neurological Autism Spectrum Disorder (ASD) using soft and flexible materials such as textiles and inflatables
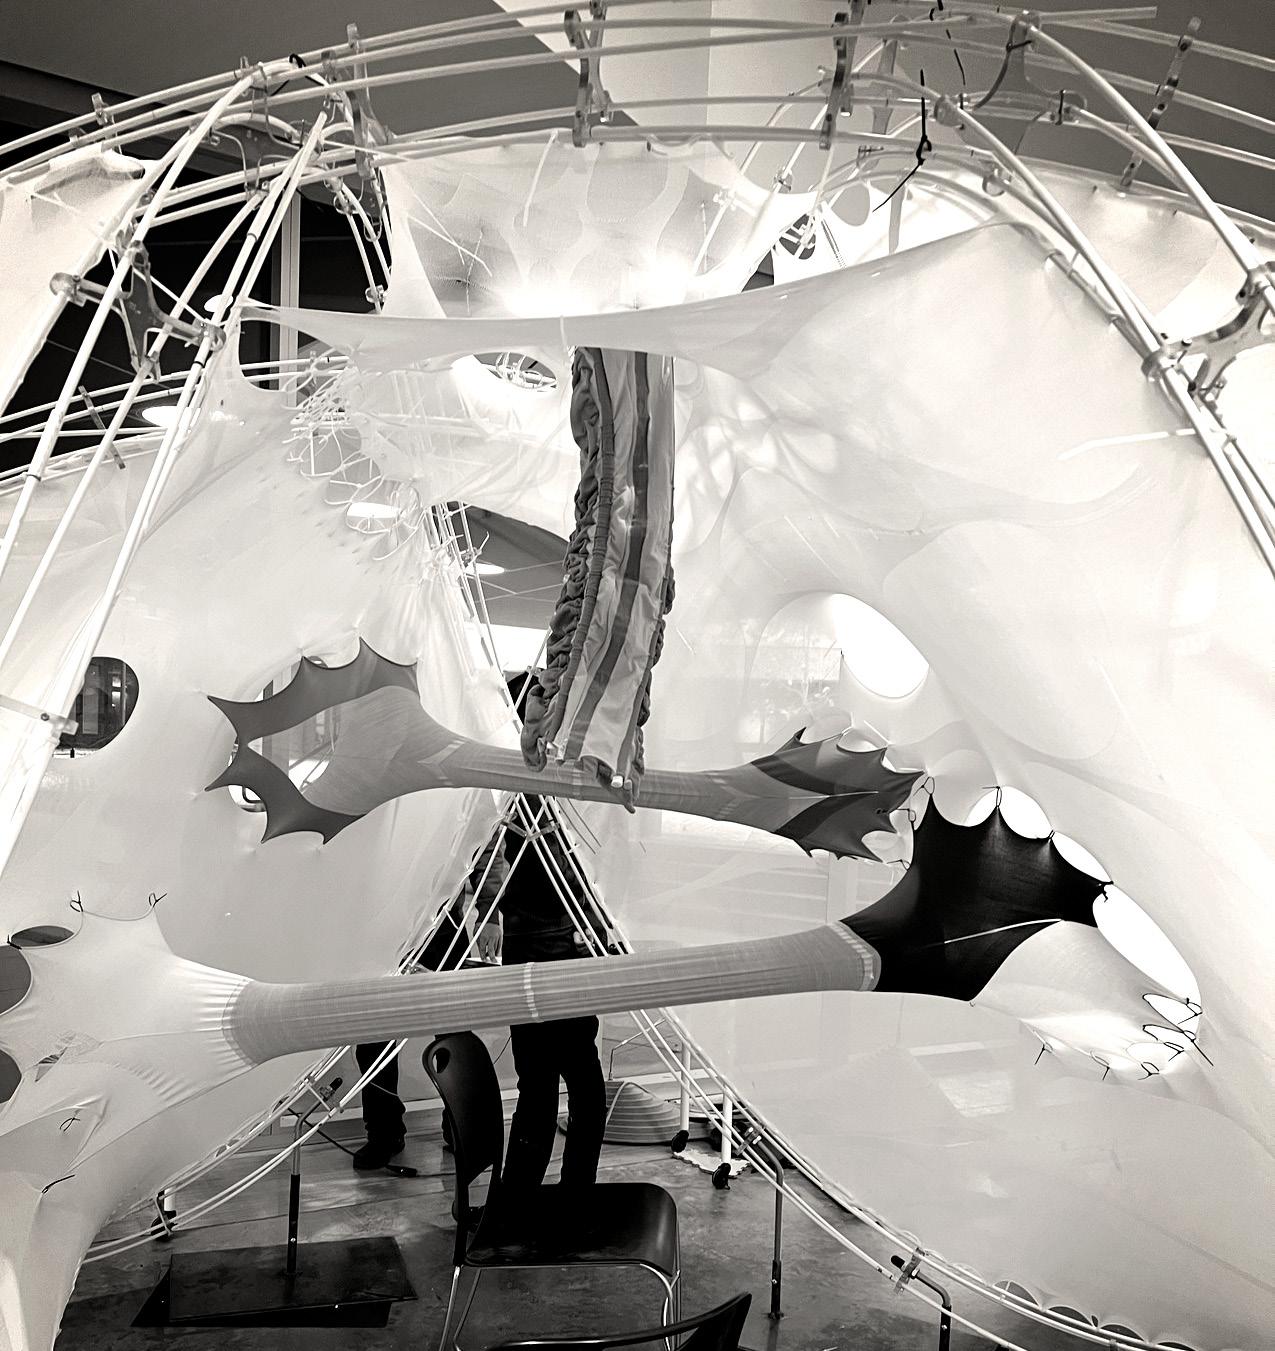
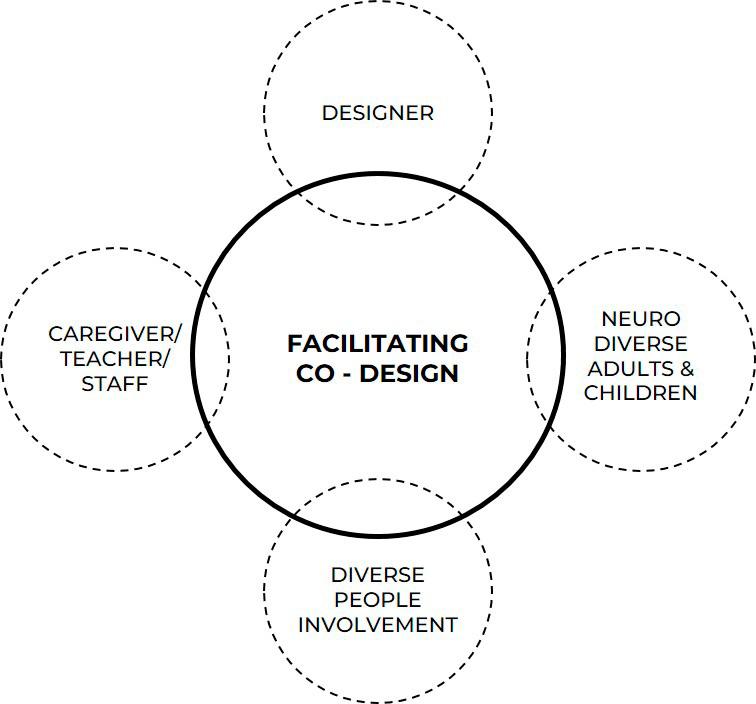
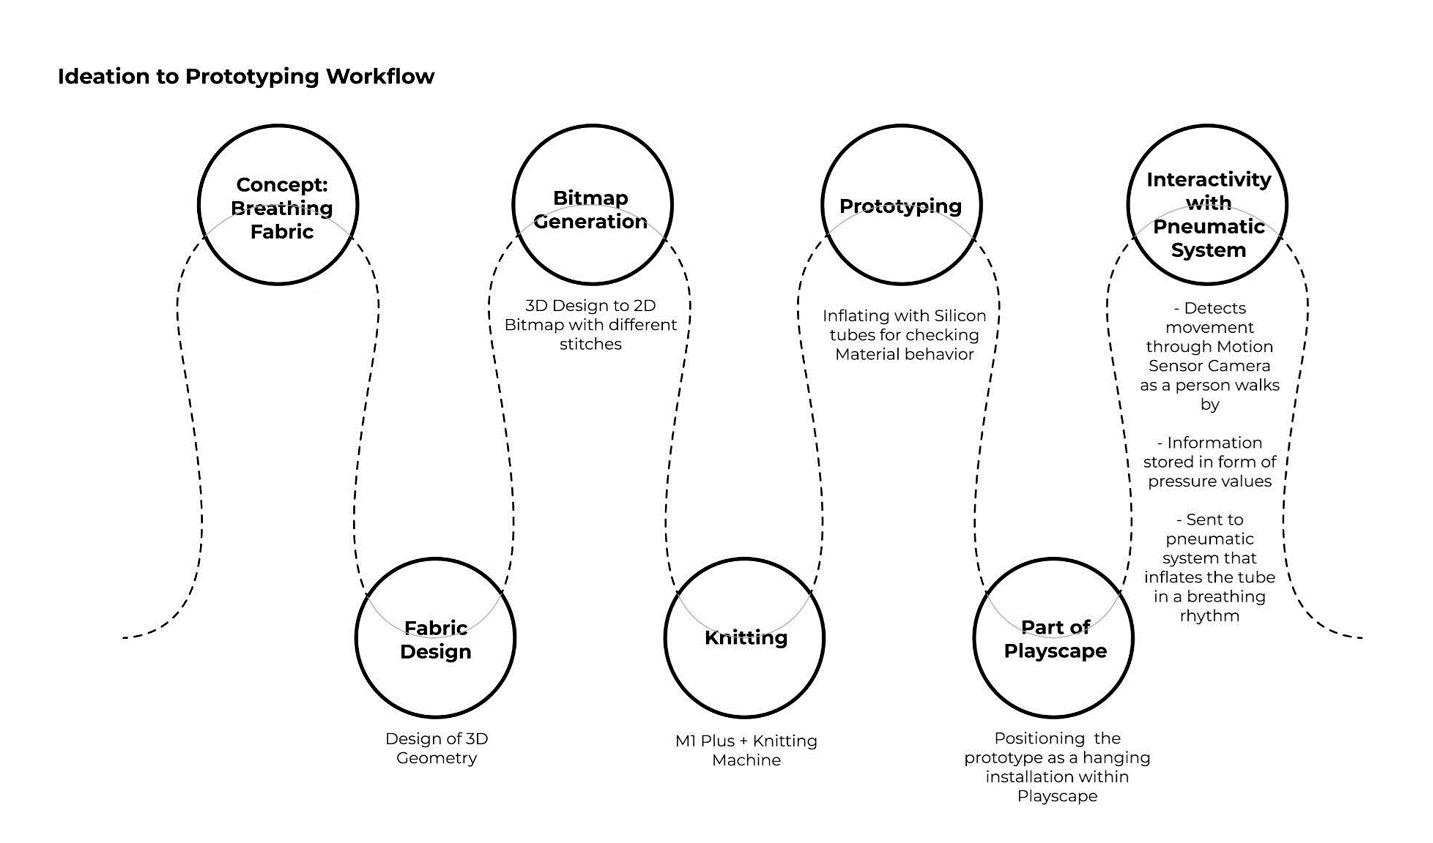
Summary: The idea is to look at material prototyping and fabrication through the lens of a human-centered design approach. Various observations and studies were conducted at an Autism Therapy Centre and a high school for Neuro Diverse Children which were the juxtaposed with textile knitting and pneumatic inflatable system explorations
Keywords: Human-Centered Design, CNC Knitting, Inflated Textile Pneumatic Systems
Softwares Used: Rhino, Grasshopper, p5js, Adobe Creative Suite
14
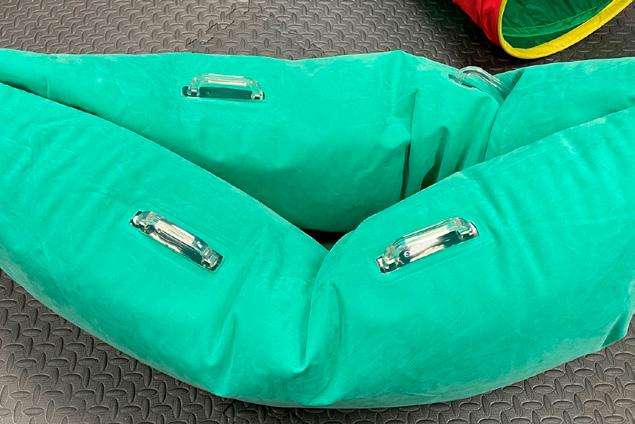
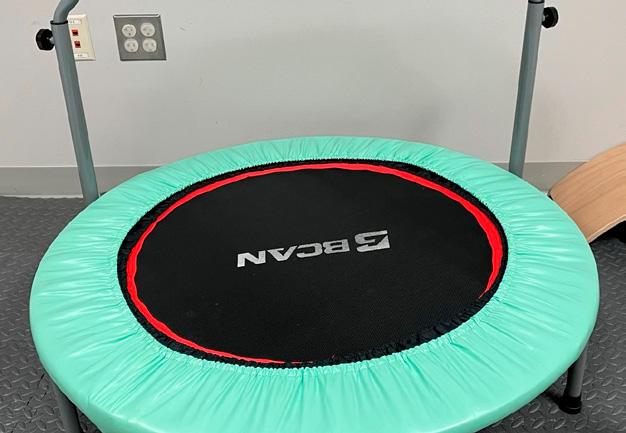
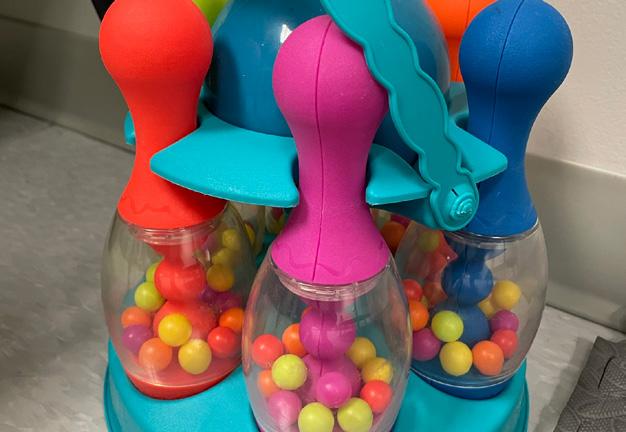
STUDIES & OBSERVATIONS
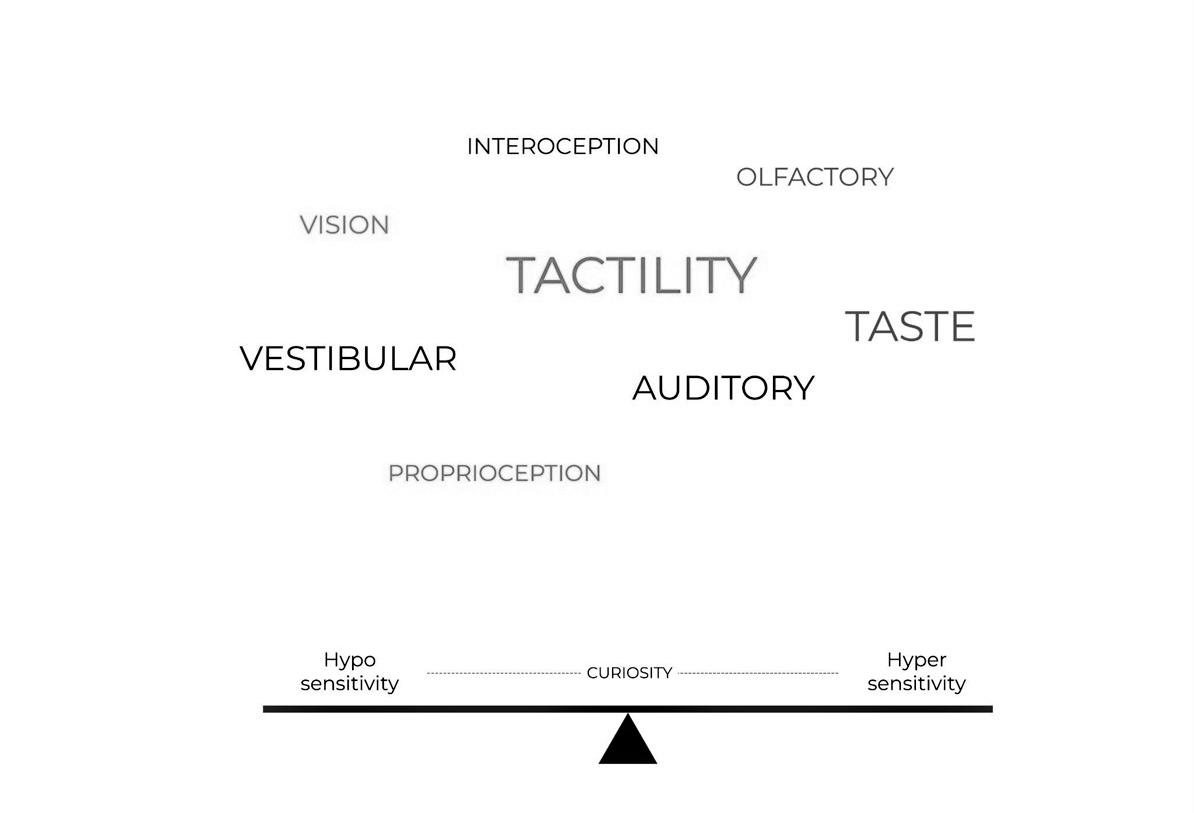
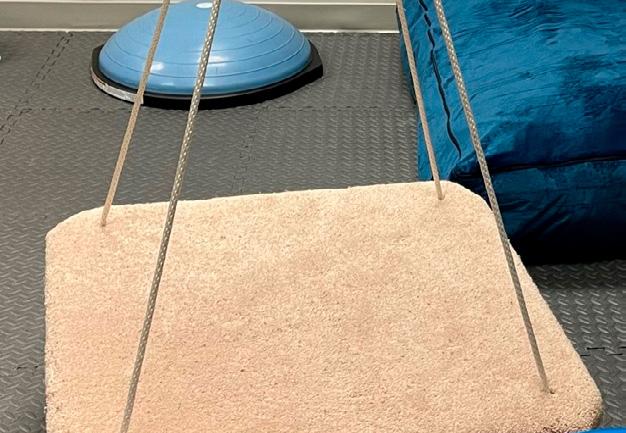
Playful soft toys and objects are used during occupational therapy sessions to engage the children to carry out different tasks for their sensory, motor and vestibular improvement which provide precedents for design
15
16
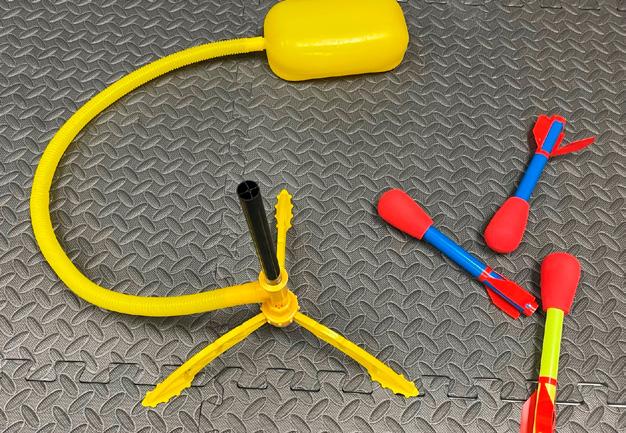
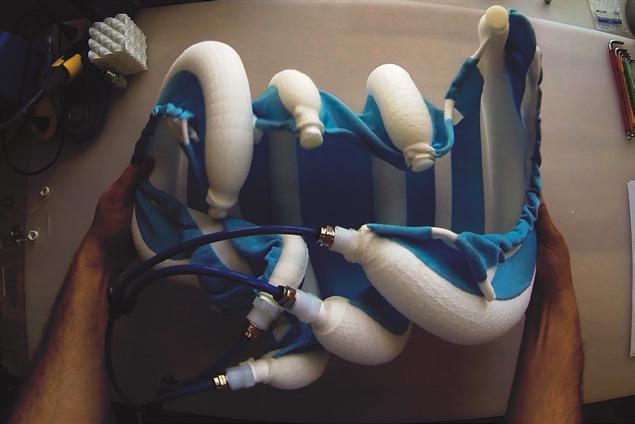
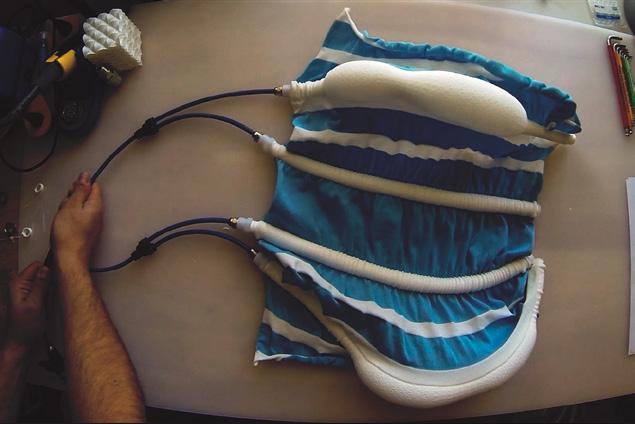
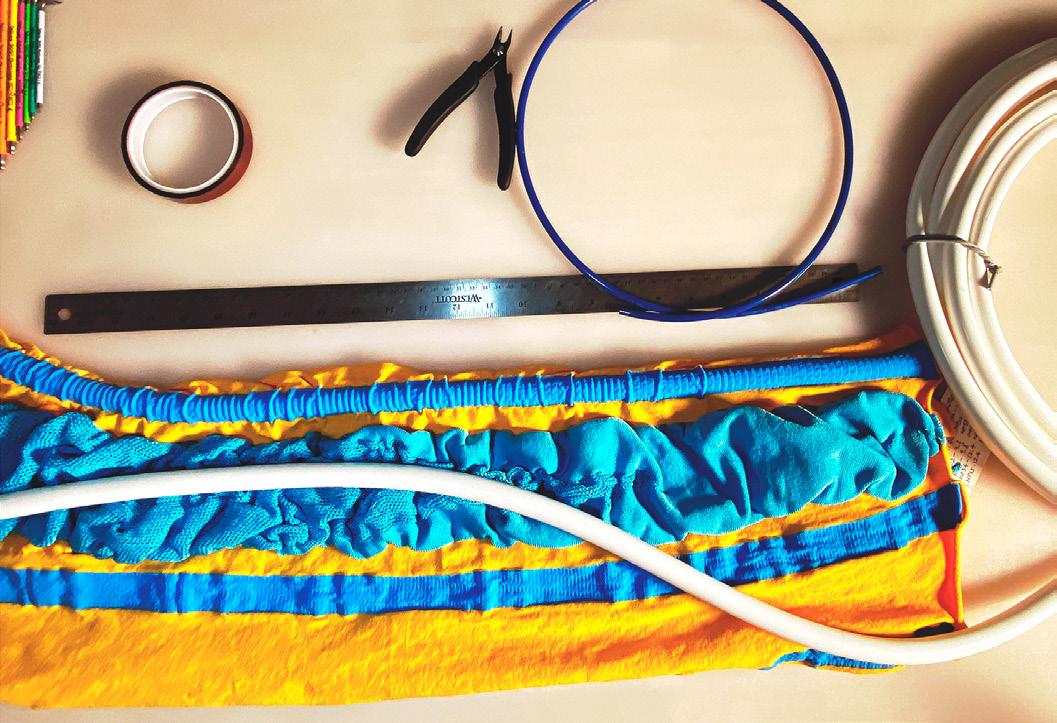
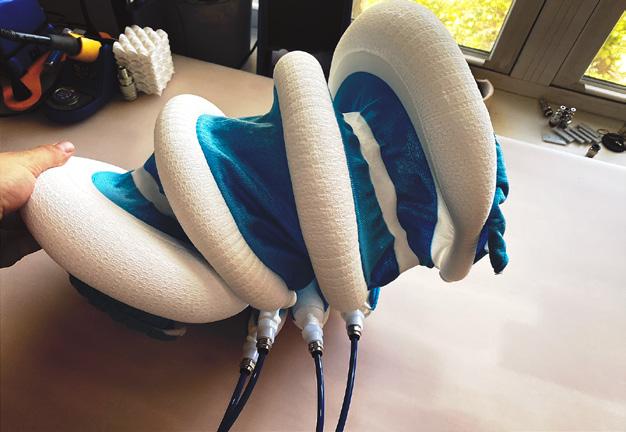
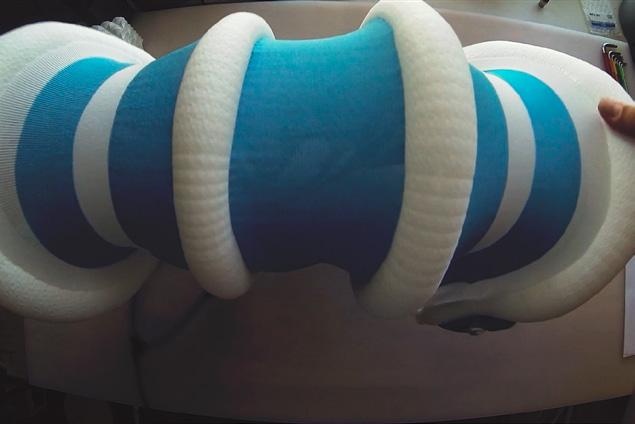
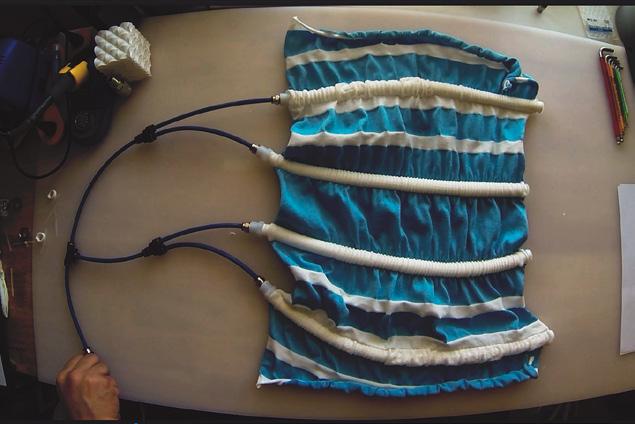
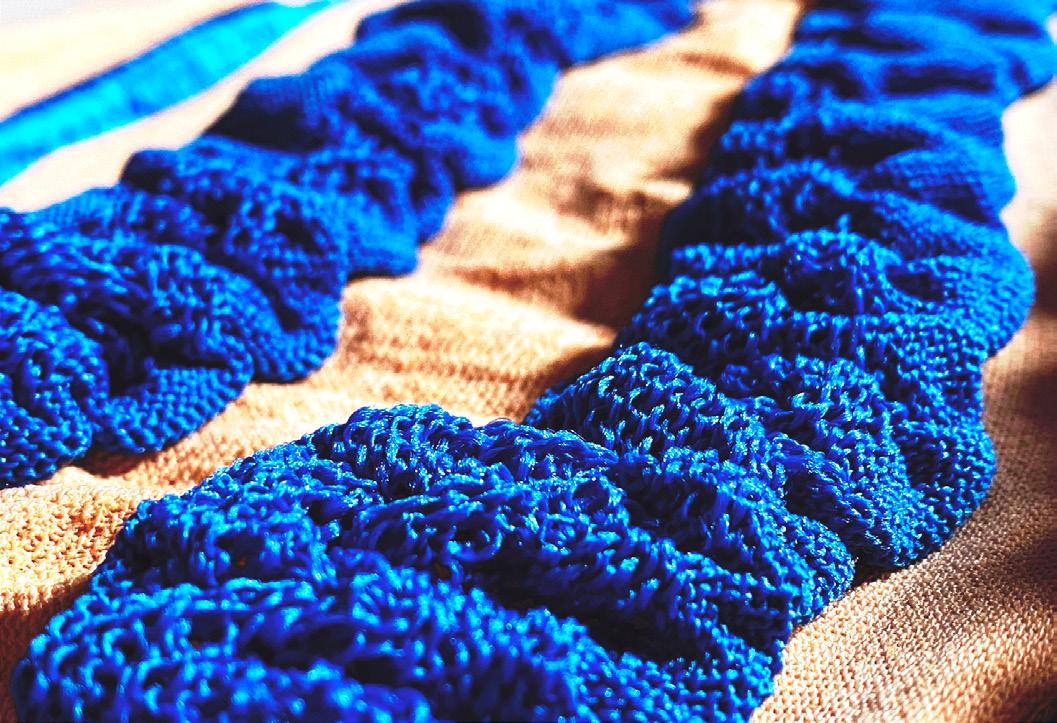
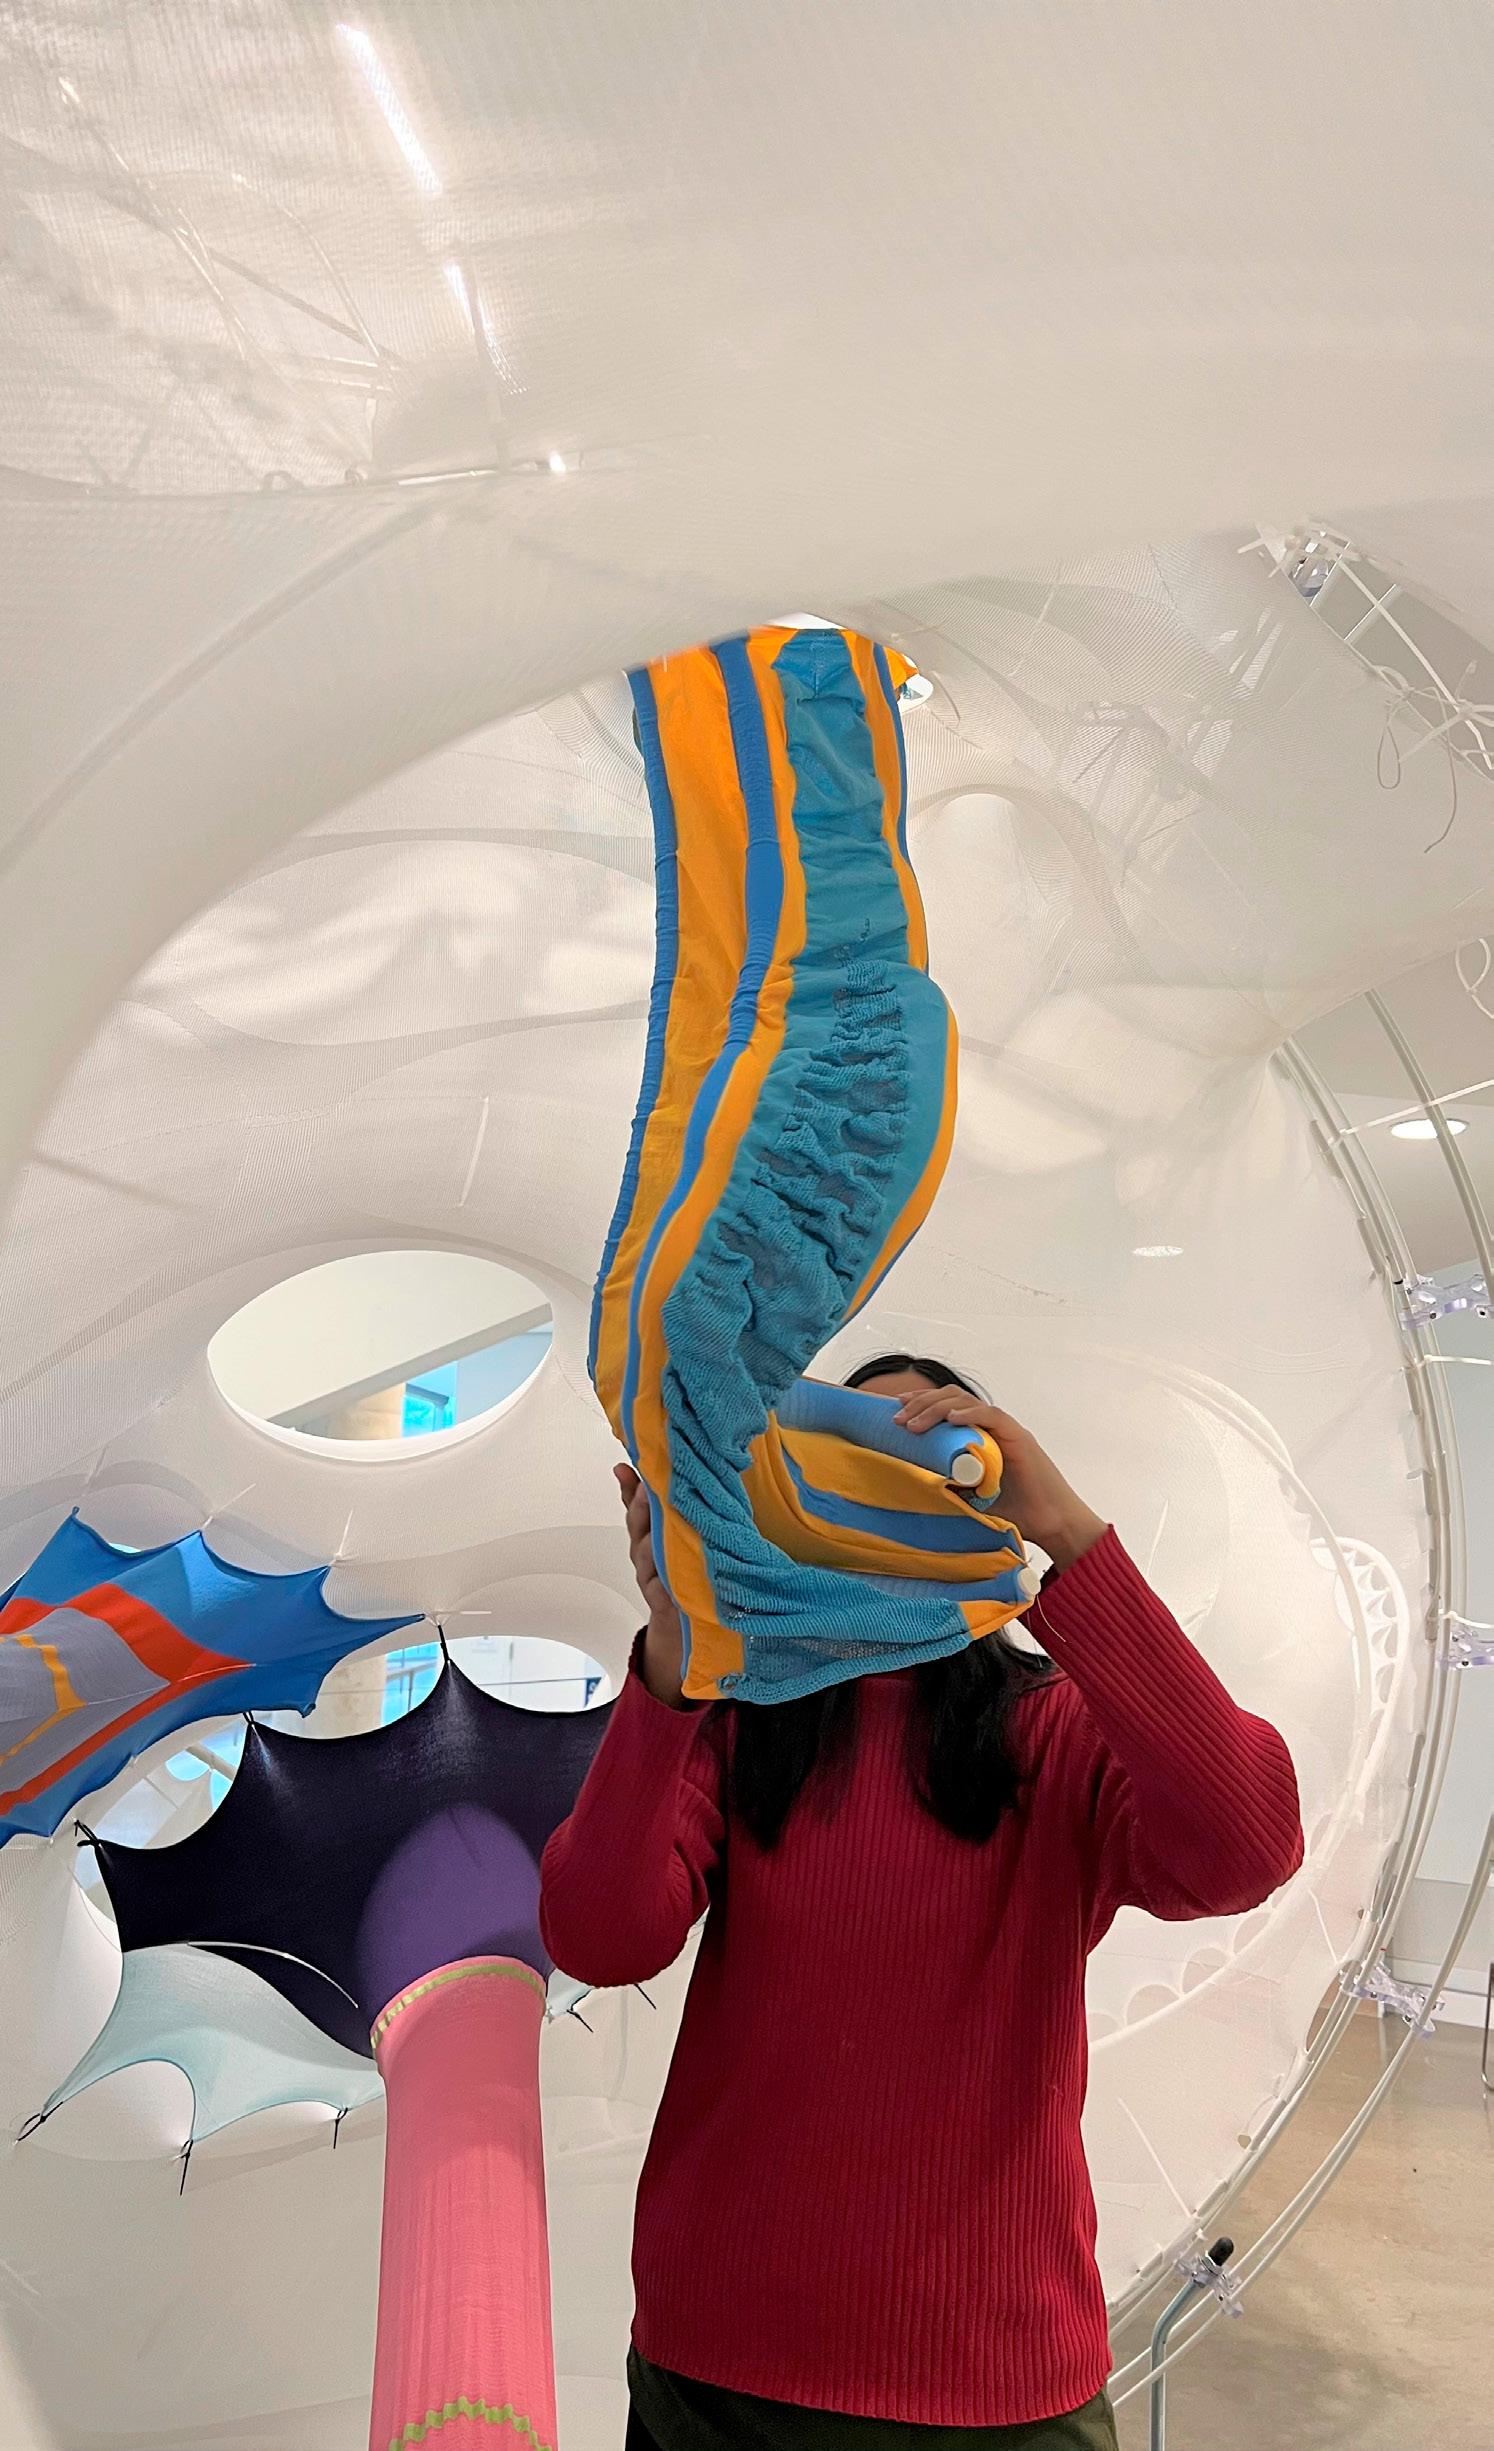
MATERIAL BEHAVIOR EXPLORATIONS
Using Knitted Stretchable Textiles with Silicon Tubes embedded inside for Inflation
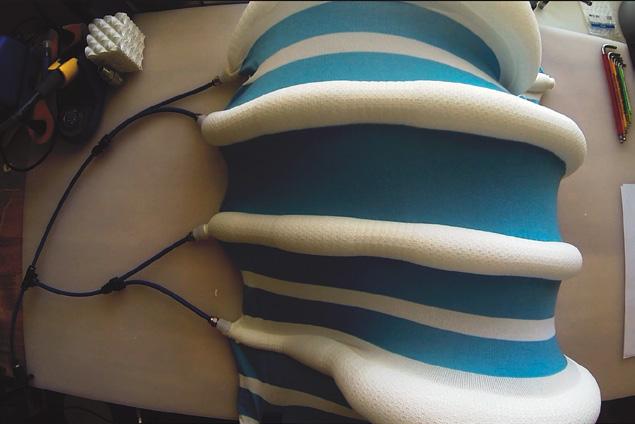
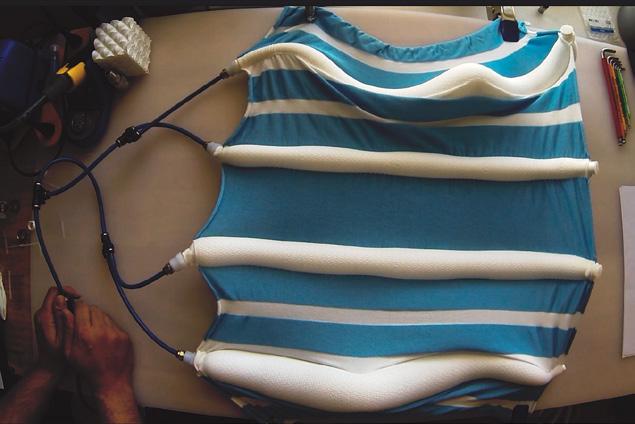
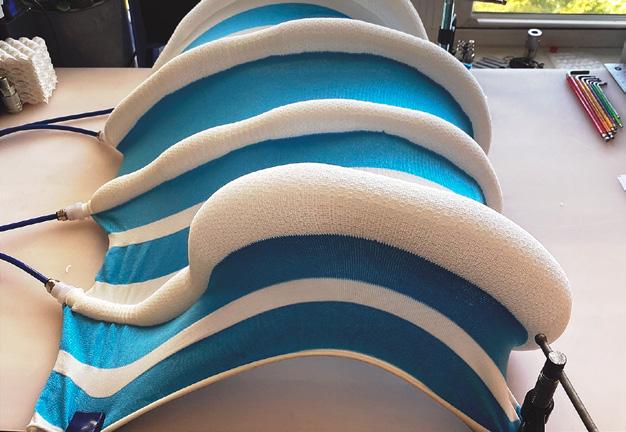
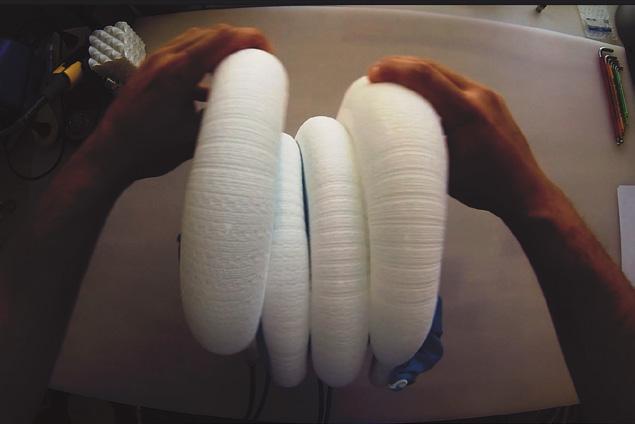
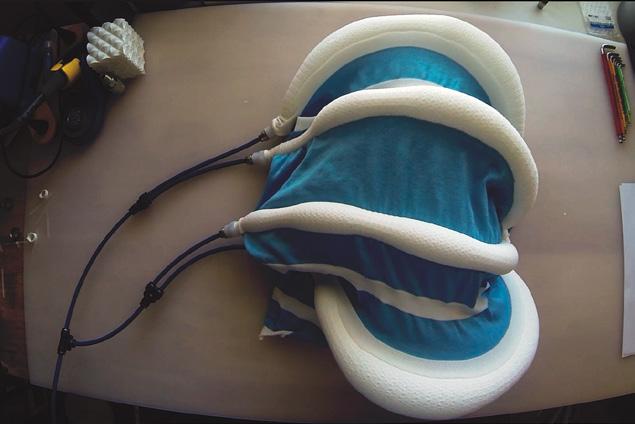
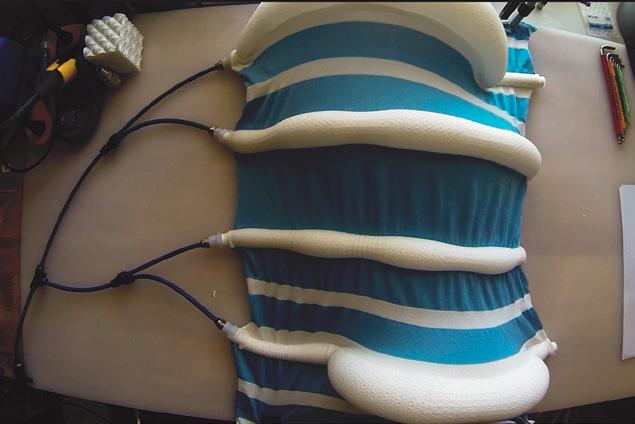
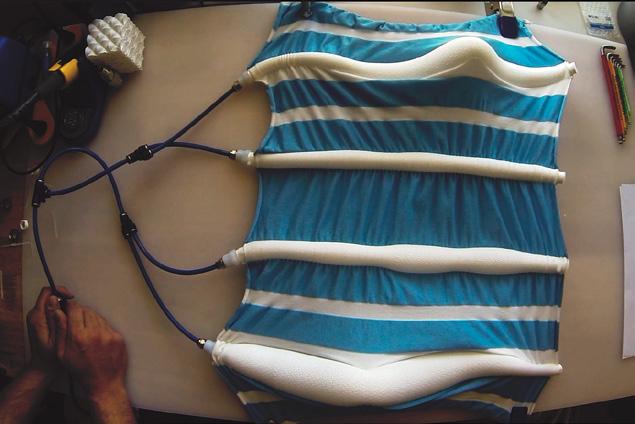
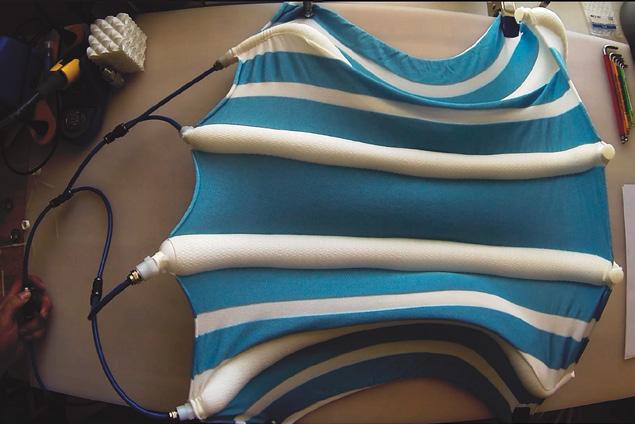
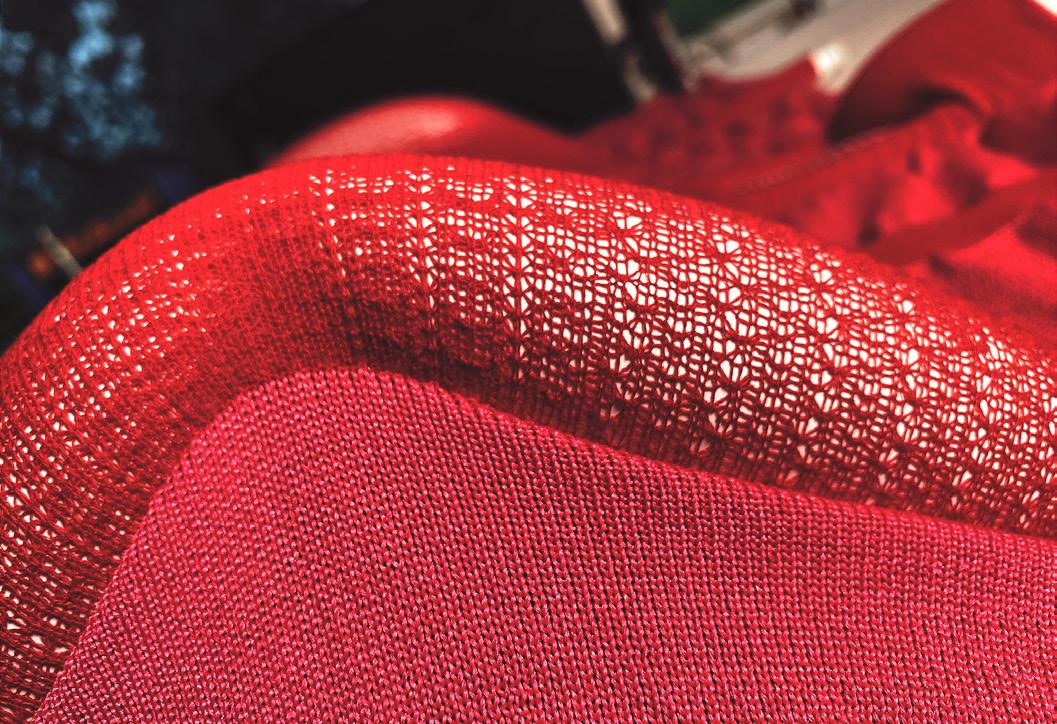
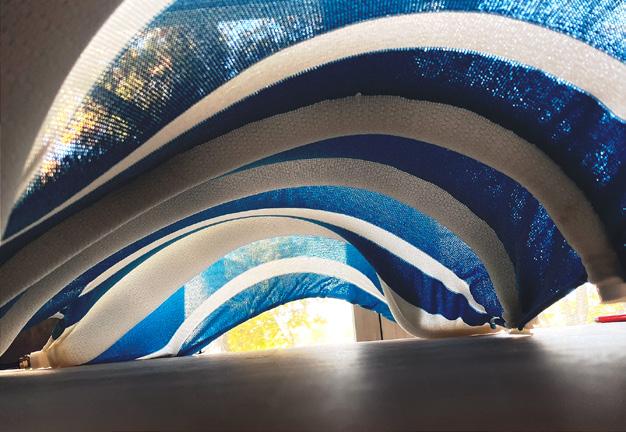
TEXTURE & PATTERN EXPLORATIONS
For enhanced Tactile Effects - Acts as an engaging element for Neuro Diverse Children
17
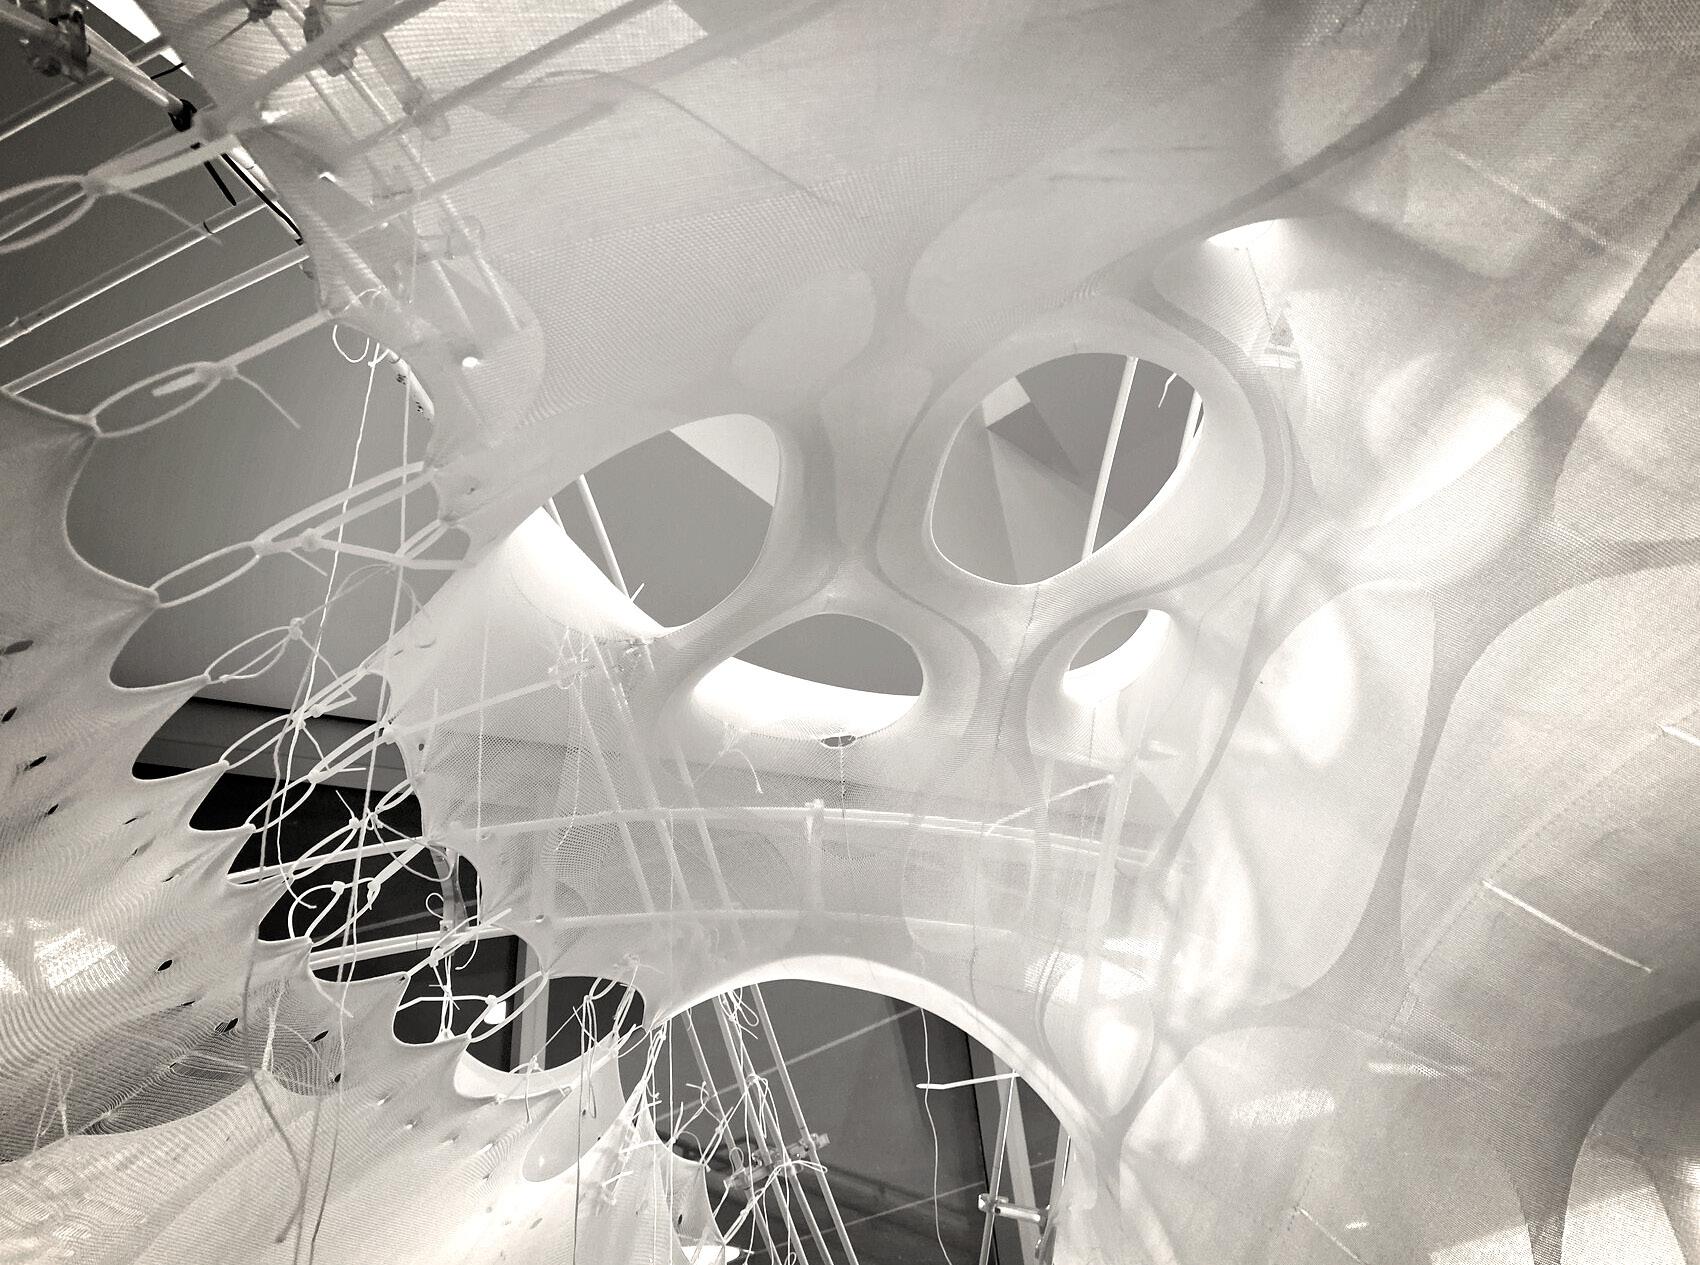
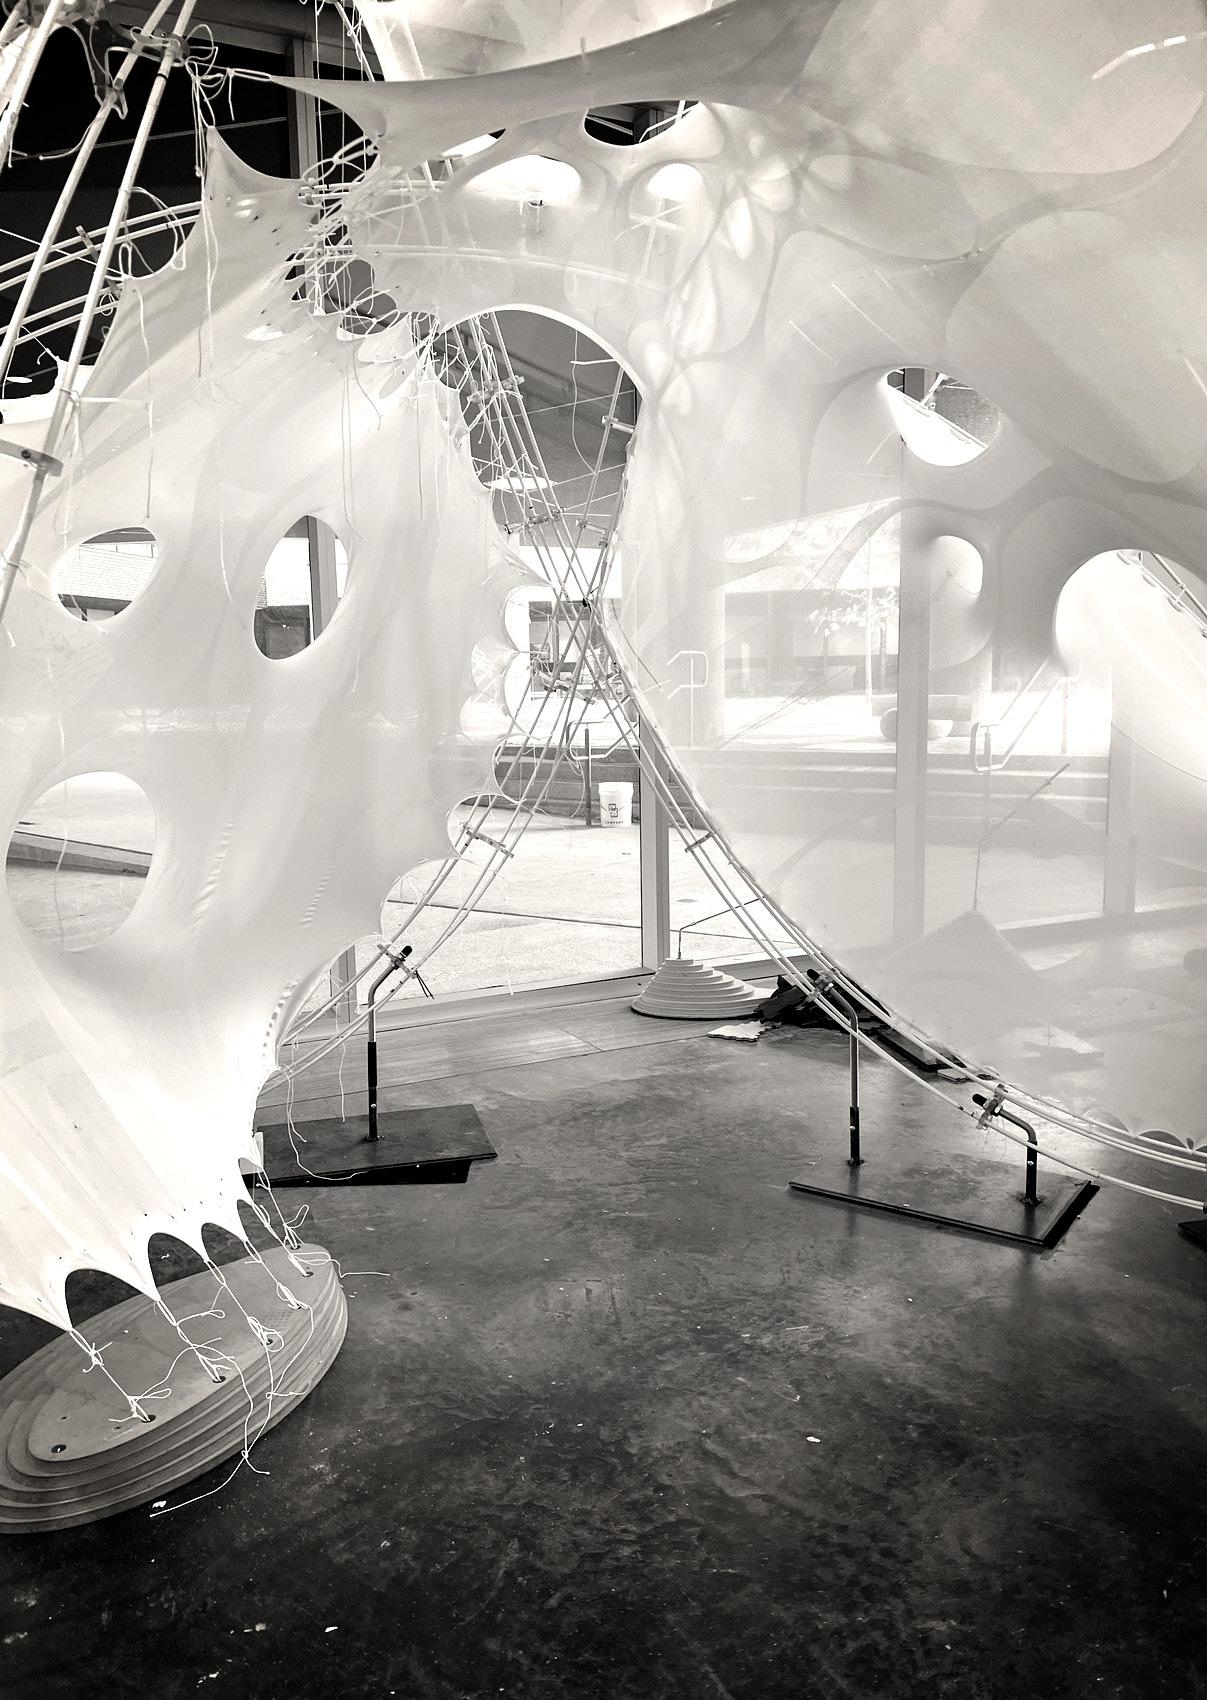
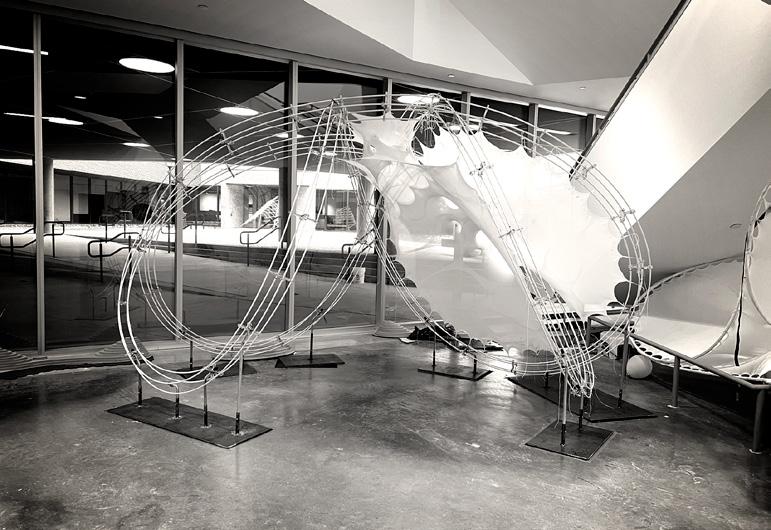
INSTALLATION OF THE MAIN PLAYSCAPE STRUCTURE
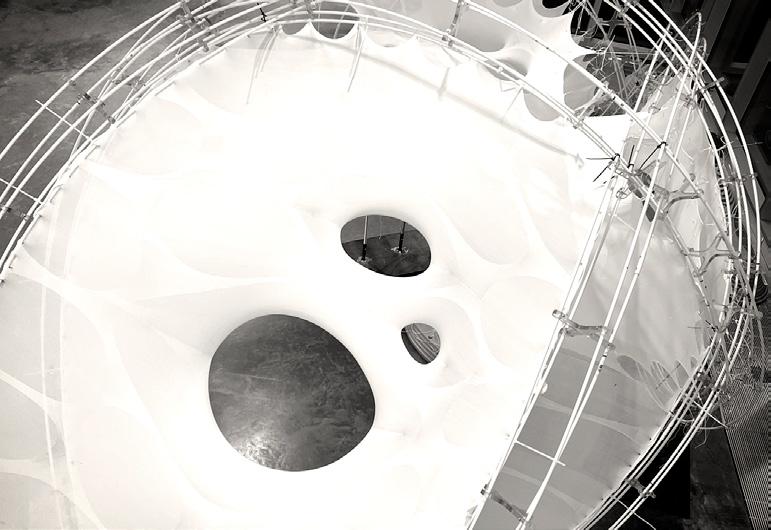
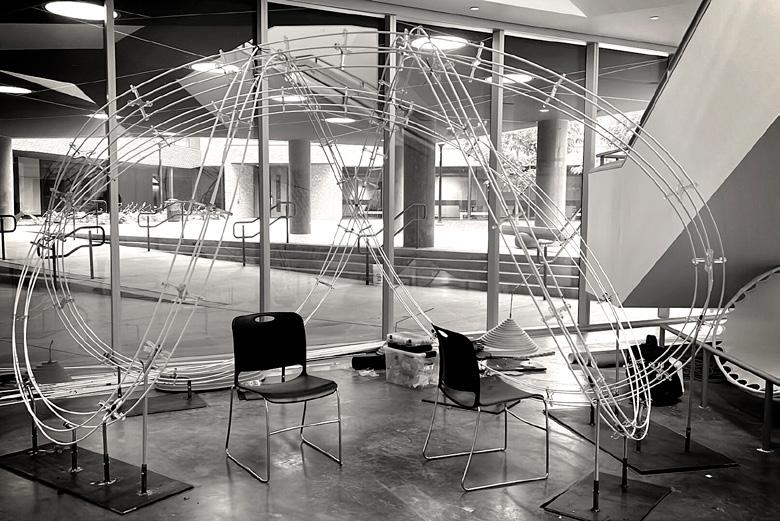
18
The Structure Design is done by Prof. Sean Ahlquist and the installation is done by us
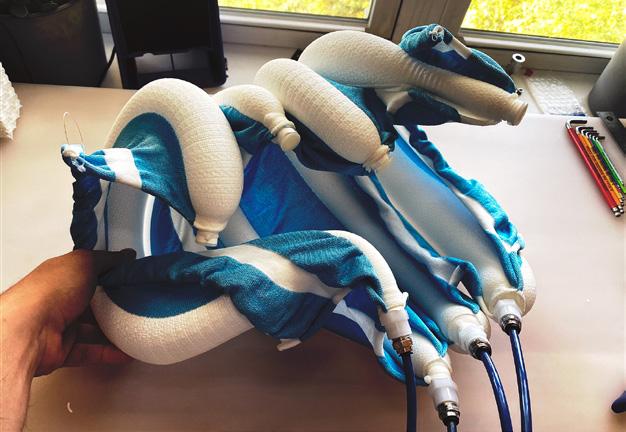
PROTOTYPE DESIGN AND WORKFLOW
Object designed by our team fitted inside the main playscape from the previous page
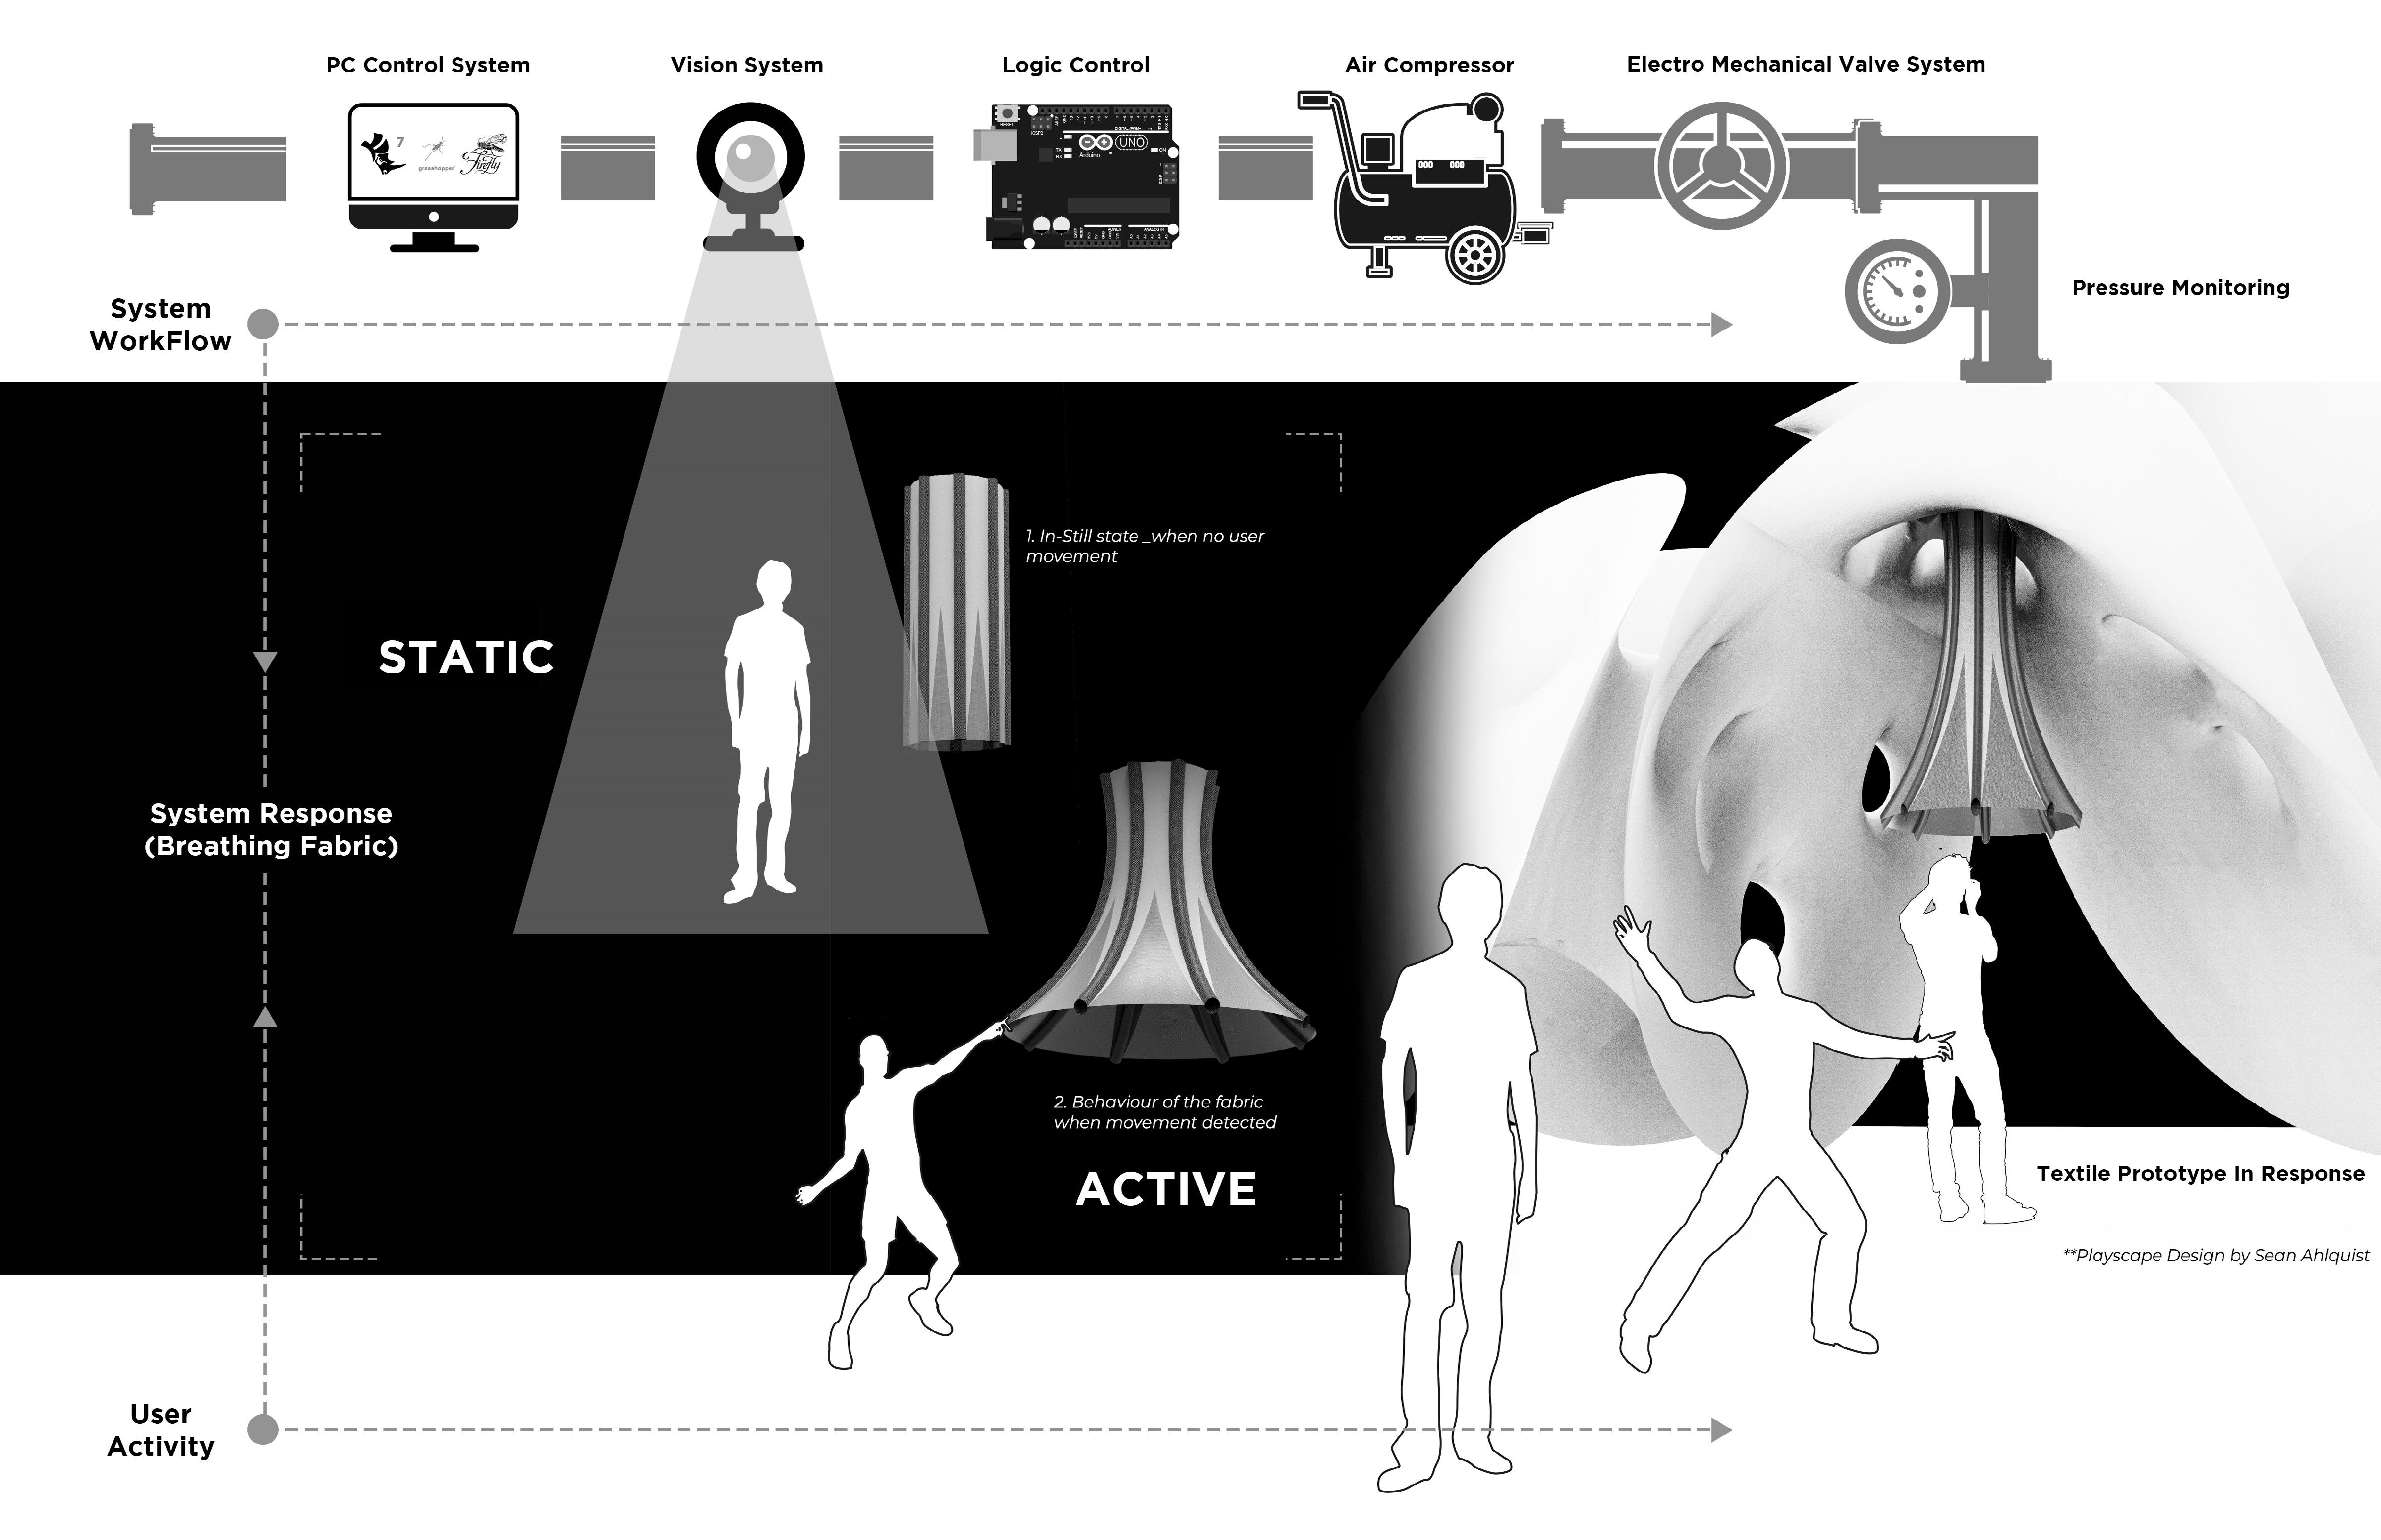
19
20
Architectural Design & Analysis
21
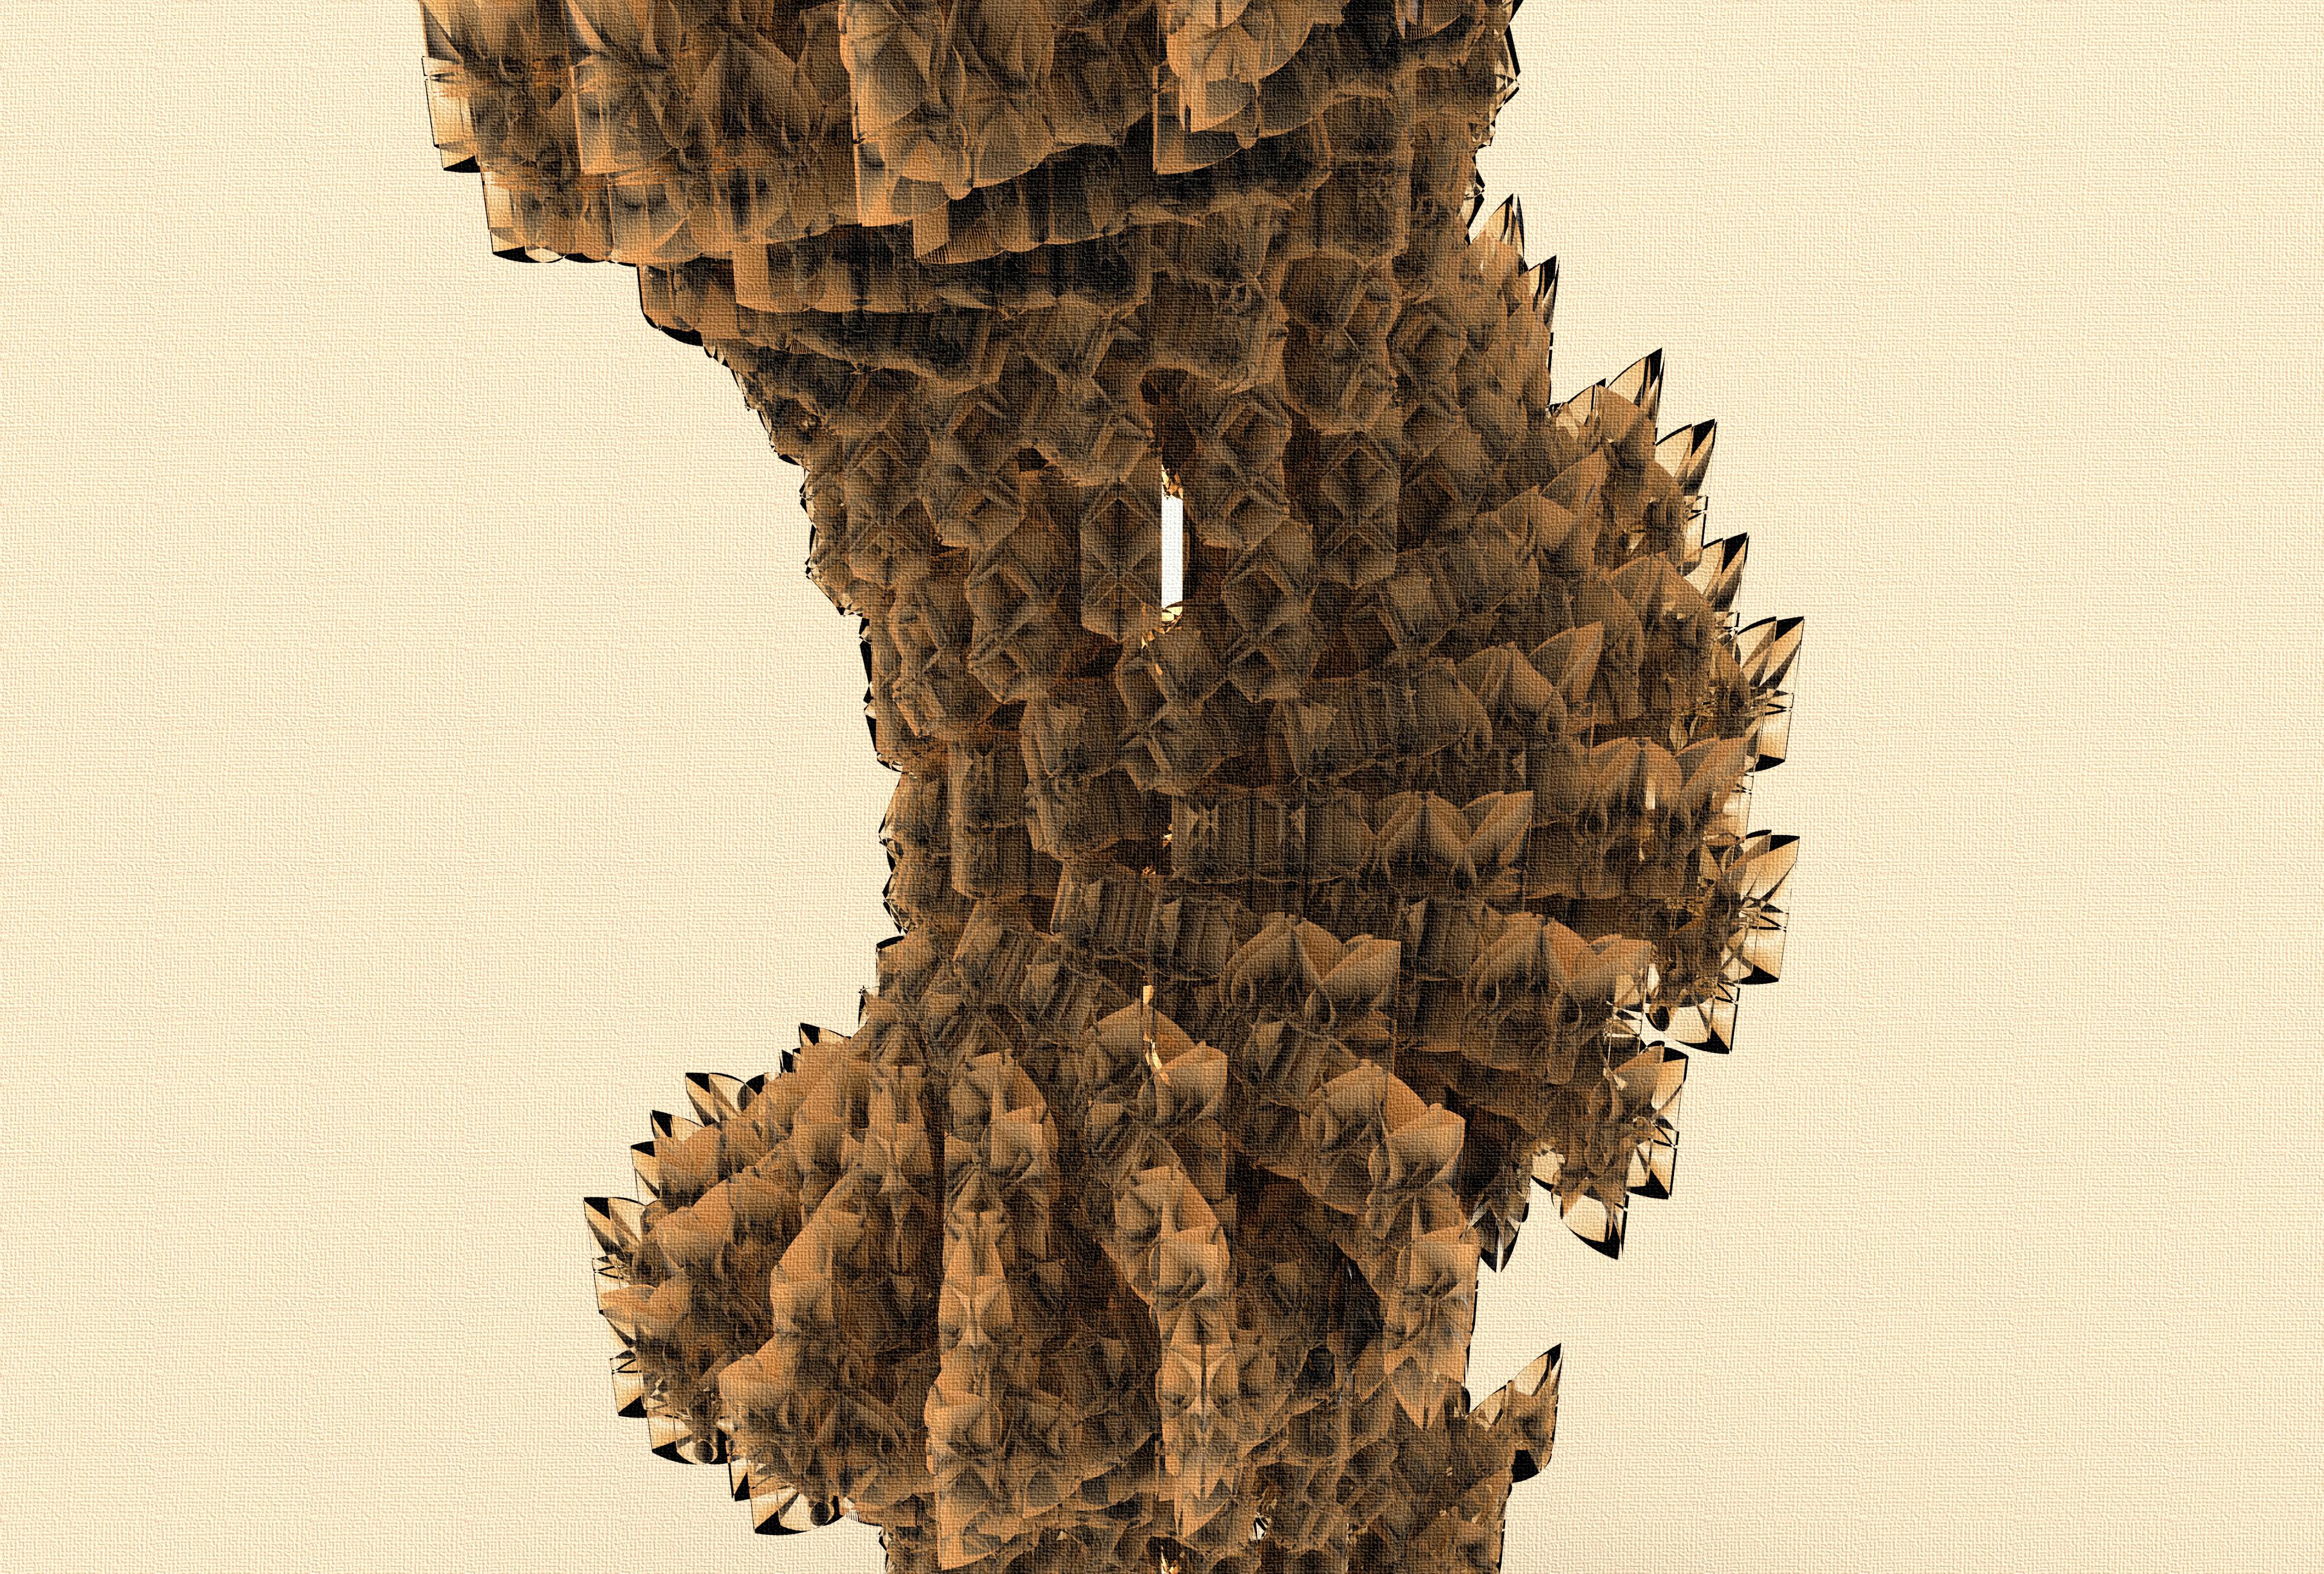
Coding Geometric Systems
Systematic Design Computing
Ann Arbor, Michigan, United States
February, 2023
Academic Project (During Masters, University of Michigan) Individual Work
Supervisor: Prof. Glenn Wilcox (gwil@umich.edu)
Aim: To understand how to code in a sequence to create a geometric system that generates variable outputs based on input parameters by the user. The idea is to get more streamlined control over designing complex systems and creating a computational workflow as a designer
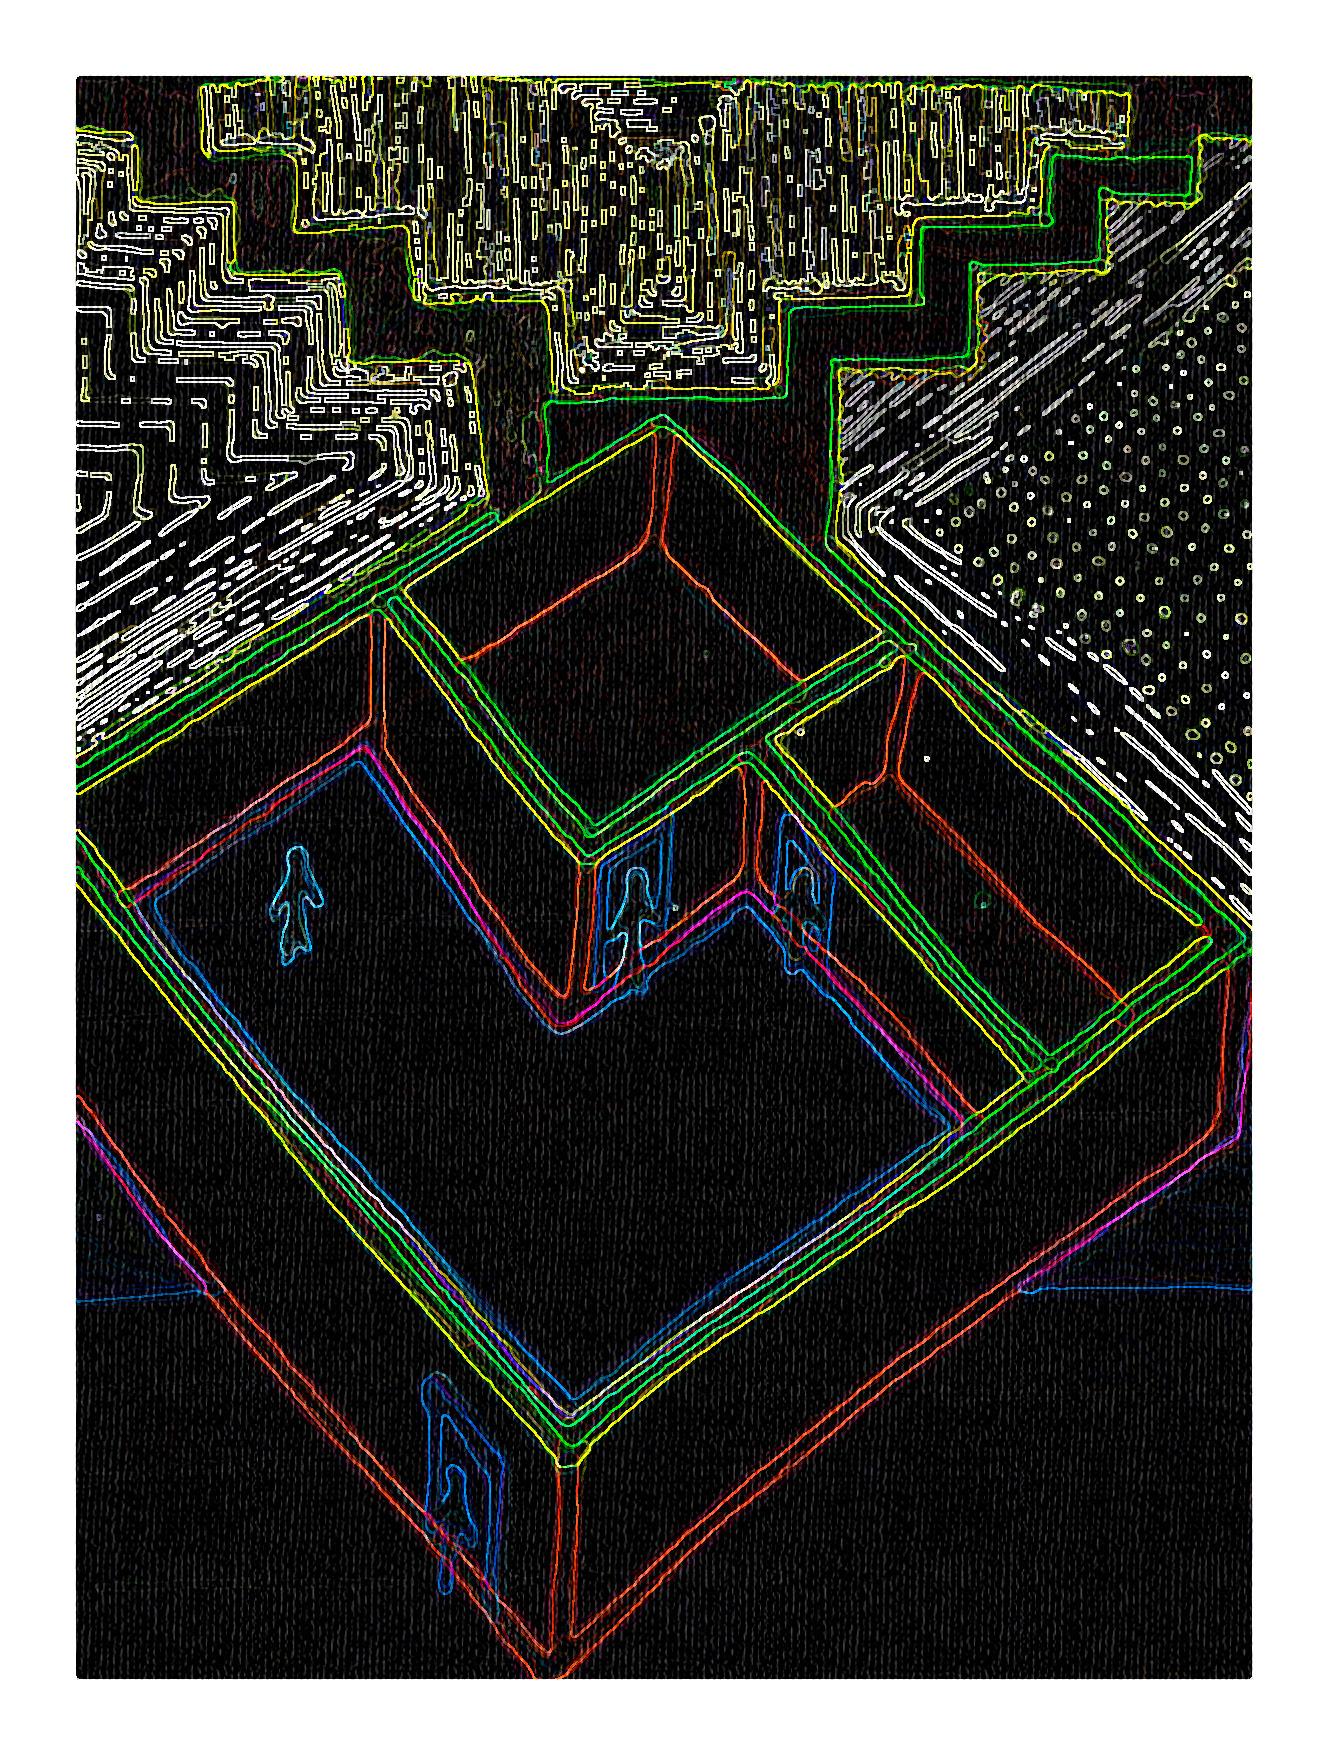
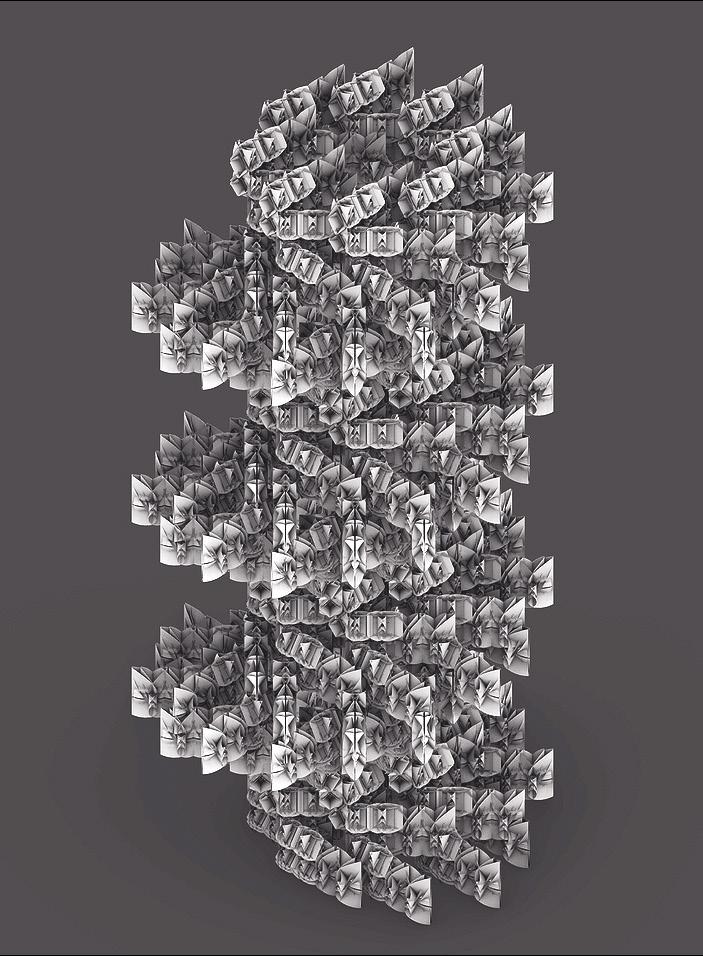
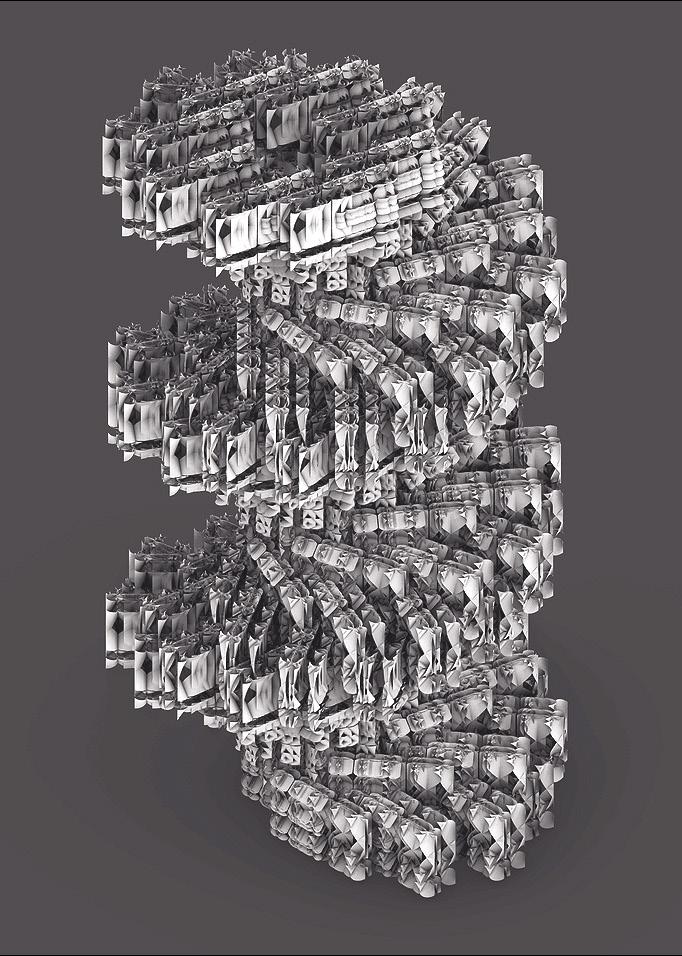
Summary: Using Python in Rhino, a carved geometric tower is created drawing inspiration from ancient monuments. It builds up on the idea of designing a single complex carved module, that is repeated, transformed and translated in a pattern to generate the geometry of the overall tower with variability
Keywords: Computational Workflow, Variability, Geometric System, Design Sequence
Softwares Used: Rhino, Python, Keyshot, Adobe Creative Suite
22
INSPIRATIONS:
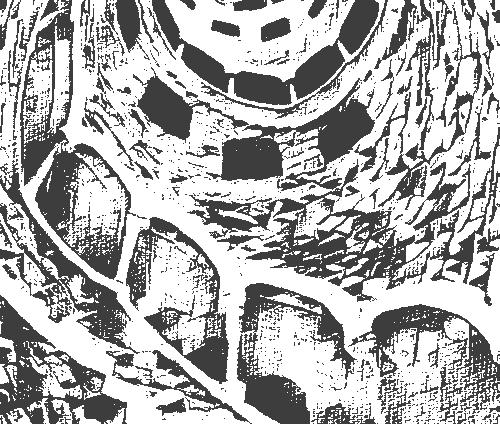
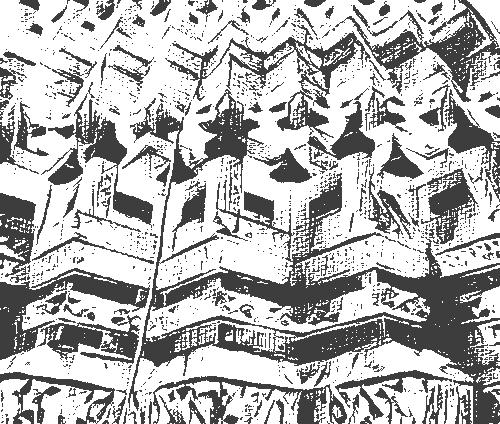
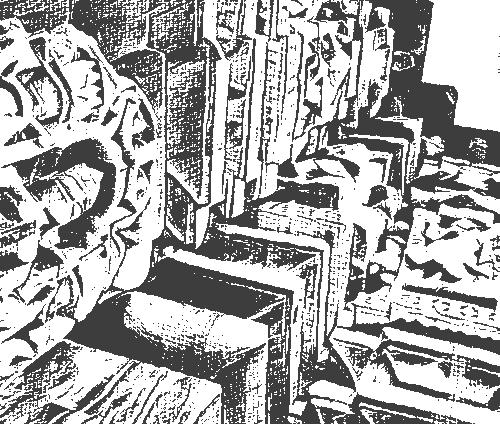
 1. DESIGNING A SINGLE MODULE Formulating Carvings/Reliefs/Motifs on Walls
Drawn from engravings and carvings on ancient monuments
2. DESIGNING EACH LAYER Staggering Pattern in Each Layer
1. DESIGNING A SINGLE MODULE Formulating Carvings/Reliefs/Motifs on Walls
Drawn from engravings and carvings on ancient monuments
2. DESIGNING EACH LAYER Staggering Pattern in Each Layer
23
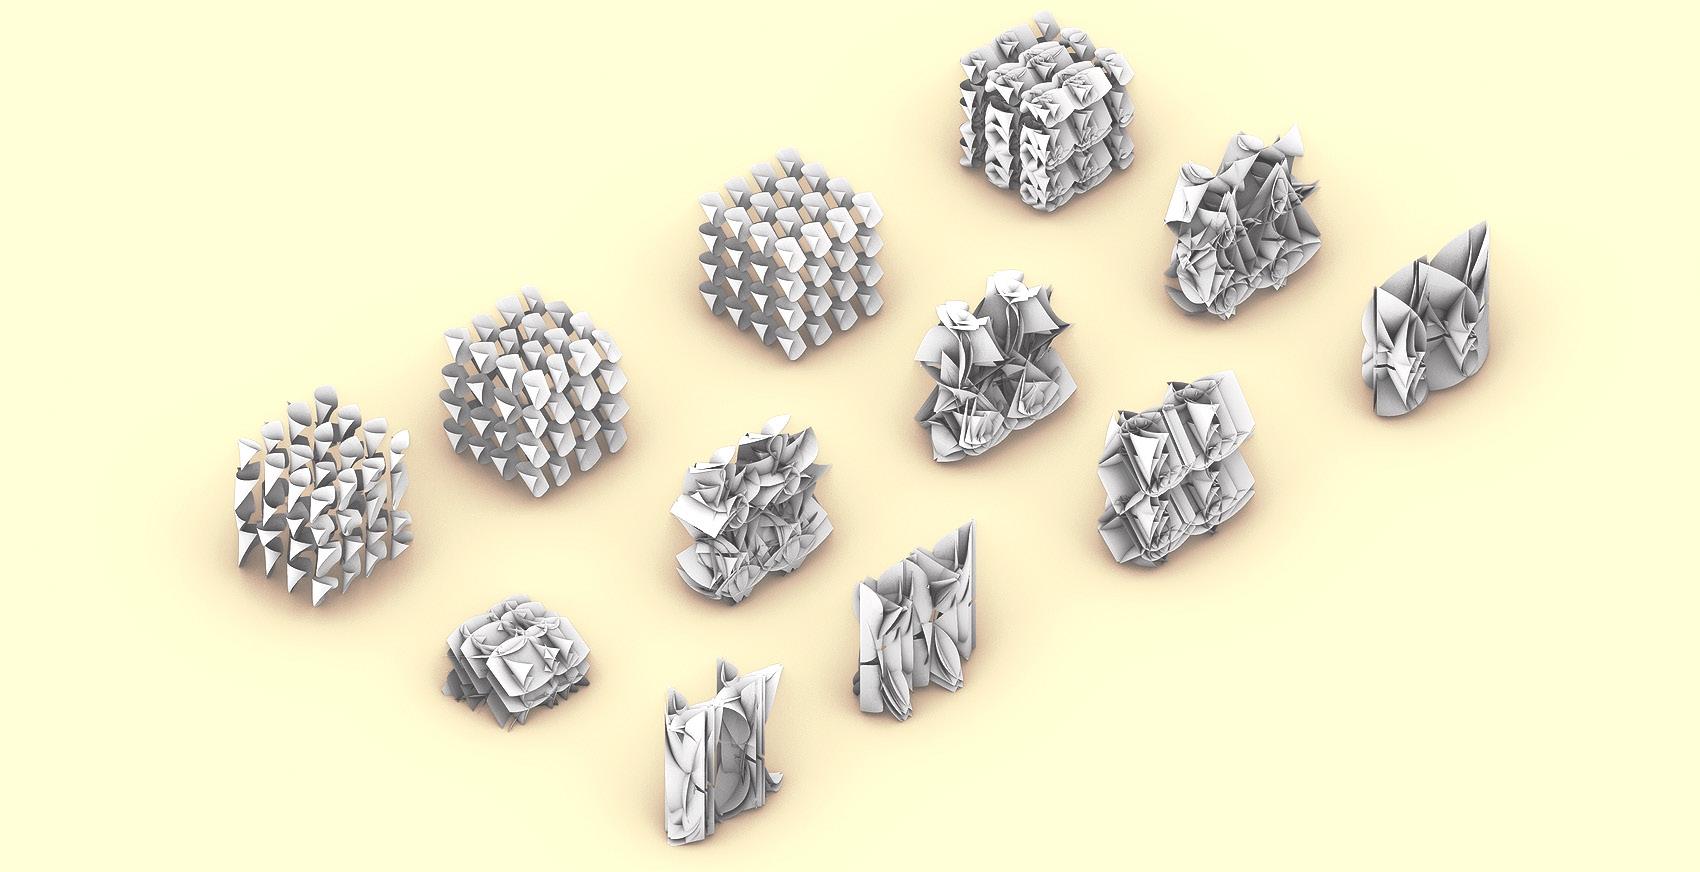
3. DESIGNING THE TOWER Overall Twisting Spiral Pattern EVOLUTION OF ITERATIONS OF A SINGLE CARVED MODULE


FINALIZED MODULE DESIGN FRONT LEFT SIDE RIGHT SIDE 24
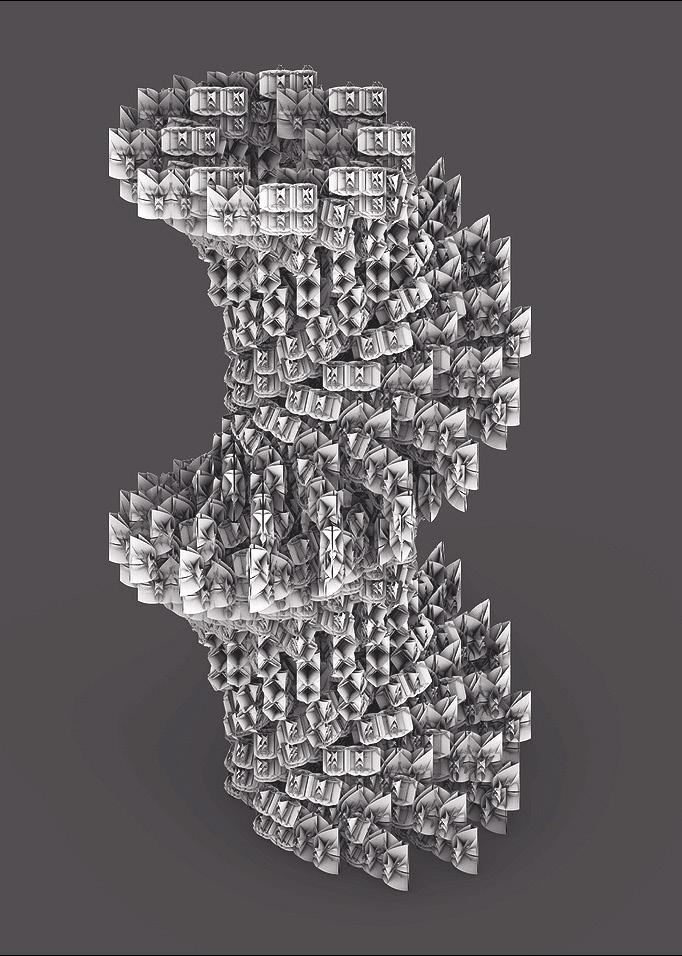
 TOWER VARIATION 1
By only changing user input values while running the code
TOWER VARIATION 2
By only changing user input values while running the code
TOWER VARIATION 3
TOWER VARIATION 1
By only changing user input values while running the code
TOWER VARIATION 2
By only changing user input values while running the code
TOWER VARIATION 3
25
By only changing user input values while running the code


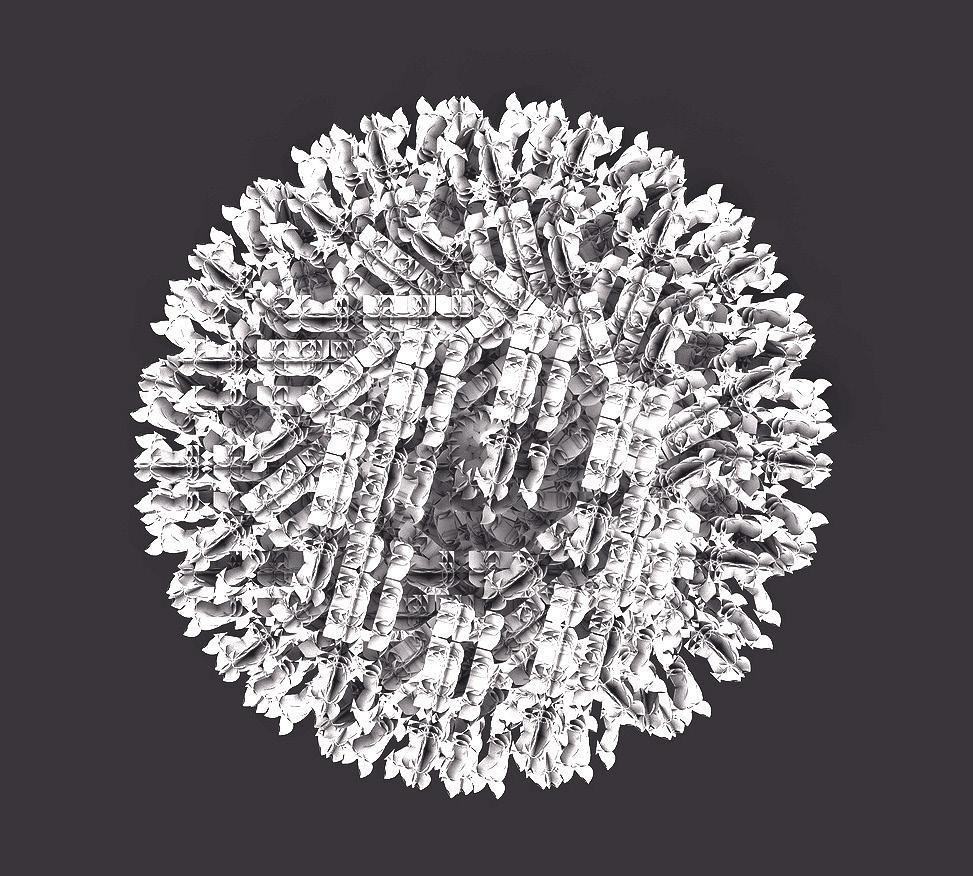 TOWER VARIATION 1 Top View
TOWER VARIATION 2 Top View
TOWER VARIATION 1 Top View
TOWER VARIATION 2 Top View
26
TOWER VARIATION 3 Top View
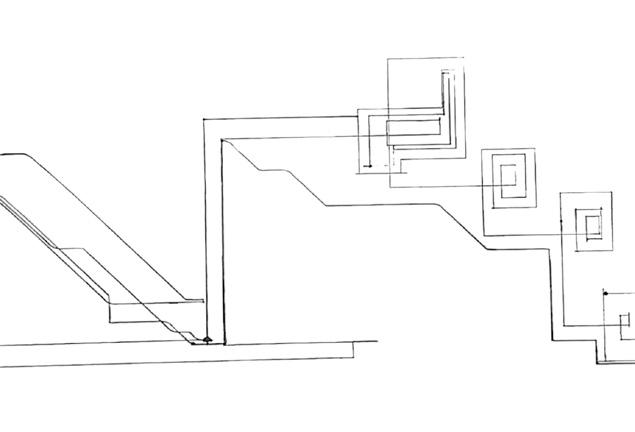
Step 1. Based on the input values from the user, generating a Point Matrix Dictionary consisting of Point Coordinates generated from Tan Equations. Then, finding their Midpoints and storing them in a list to generate the module
import rhinoscriptsyntax as rs
import math
# Function for generating Module Pattern 1
def GenerateModule1(IMAX, JMAX, KMAX, PATTERN, X, Y, Z):
pi = math.pi
imax = IMAX
jmax = JMAX
kmax = KMAX
x1 = X
y1 = Y
z1 = Z
pattern = PATTERN
Pt = {}
midPt = []
# Dictionary to store the Module Grid Coordinates for i in range(imax): for j in range(jmax): for k in range(kmax):
x = x1 + i * 16 + math.tan(i)*pi*pattern
y = y1 + j * 16 + math.tan(j)*pi*pattern
z = 90*z1 + k * 16 + math.tan(k)*pi*pattern
Pt[(i,j,k)] = (x,y,z)
# Use the above Dictionary to store Midpoints as a list for i in range(imax): for j in range(jmax): for k in range(kmax): if i > 0 and j > 0 and k > 0:
midPt.append(MidPt(Pt[(i,j,k)], Pt[(i,j-1,k)]))
midPt.append(MidPt(Pt[(i,j,k)], Pt[(i-1,j,k)]))
midPt.append(MidPt(Pt[(i-1,j,k)], Pt[(i-1,j-1,k)]))
midPt.append(MidPt(Pt[(i-1,j-1,k)], Pt[(i,j-1,k)]))
midPt.append(MidPt(Pt[(i-1,j-1,k)], Pt[(i-1,j-1,k-1)]))
midPt.append(MidPt(Pt[(i-1,j-1,k-1)], Pt[(i,j-1,k-1)]))
midPt.append(MidPt(Pt[(i,j-1,k-1)], Pt[(i,j-1,k)]))
midPt.append(MidPt(Pt[(i,j-1,k-1)], Pt[(i,j,k-1)]))
midPt.append(MidPt(Pt[(i,j,k)], Pt[(i,j,k-1)]))
midPt.append(MidPt(Pt[(i,j,k-1)], Pt[(i-1,j,k-1)]))
midPt.append(MidPt(Pt[(i-1,j,k)], Pt[(i-1,j,k-1)]))
midPt.append(MidPt(Pt[(i-1,j,k-1)], Pt[(i-1,j-1,k-1)]))
t = GenerateSurfaces(midPt)
return t
# Function for generating Module Pattern 2
def GenerateModule2(IMAX, JMAX, KMAX, PATTERN, X, Y, Z):
pi = math.pi
imax = IMAX
jmax = JMAX
kmax
PATTERN
# The number and order of midpoints here change the pattern for Module 2 for i in range(imax): for j in range(jmax): for k in range(kmax):
if i > 0 and j > 0 and k > 0:
midPt.append(MidPt(Pt[(i,j,k)], Pt[(i,j-1,k)]))
midPt.append(MidPt(Pt[(i,j,k)], Pt[(i-1,j,k)]))
midPt.append(MidPt(Pt[(i-1,j,k)], Pt[(i-1,j-1,k)]))
midPt.append(MidPt(Pt[(i-1,j-1,k)], Pt[(i,j-1,k)]))
midPt.append(MidPt(Pt[(i-1,j-1,k)], Pt[(i-1,j-1,k-1)]))
midPt.append(MidPt(Pt[(i-1,j-1,k-1)], Pt[(i,j-1,k-1)]))
t = GenerateSurfaces(midPt)
return t
# Function to generate Curves from Midpoints which are then Edge Surfaced def GenerateSurfaces(MIDPT):
midPt = MIDPT
# A list to store the Surfaces Generated
srf = [] for i in range(0, len(midPt)-11, 12): curve_1 = rs.AddCurve((midPt[i], midPt[i+1], midPt[i+2], midPt[i+3])) curve_2 = rs.AddCurve((midPt[i+3], midPt[i+4], midPt[i+5], midPt[i+6]))
srf.append(rs.AddEdgeSrf((curve_1, curve_2)))
rs.DeleteObjects(curve_1)
rs.DeleteObjects(curve_2)
return srf
# Function to Calculate the Midpoint def MidPt(aP1, aP2):
MidPt = None
MidPt = [(aP1[0] + aP2[0]) / 2, (aP1[1] + aP2[1]) / 2, (aP1[2] + aP2[2]) / 2]
return MidPt
def Main():
# Take input values from the user to generate the geometric assembly imax = rs.GetInteger('max number of x points in module grid',7)
jmax = rs.GetInteger('max number of y points in module grid',3)
kmax = rs.GetInteger('max number of z points in module grid',7) pattern = rs.GetInteger('pattern factor for module grid',4) angle_rotation = rs.GetInteger('angle of rotation of the tower',45)
pi = math.pi
Angle = 0.0
x = 0
y = 0
rs.EnableRedraw(False)
# Loop for making the overall tower that sends values to different functions to generate the modules first and then create the overall pattern for z in rs.frange(0.0, 13.0, 0.5):
Angle = z * Angle * (pi/2) for a in rs.frange(0.0, 2*pi, (pi/4)):
x = 150 * math.sin(a + Angle)
y = 150 * math.cos(a + Angle)
rs.RotateObjects(GenerateModule1(imax, jmax, kmax, pattern, x, y, z), [0, 0, 0], angle_rotation*z)
Step 3. Generating Surfaces using Edge Surface Method in Rhinoscript. Consequently, using Sine and Cosine Equations and Rotation
Transformation to use the modules to repeat variably in a spiral pattern through layers based on input angle of rotation to make a tower
# Dictionary to store the Module Grid Coordinates for i in range(imax): for j in range(jmax): for k in range(kmax):
x = 80 + x1 + i * 16 + math.tan(i)*pi*pattern
y = y1 + j * 16 + math.tan(j)*pi*pattern
z = 90*z1 + k * 16 + math.tan(k)*pi*pattern
Pt[(i,j,k)] = (x,y,z)
# Use the above dictionary to store Midpoints as a list
rs.RotateObjects(GenerateModule2(imax, jmax, kmax, pattern, x, y, z), [0, 0, 0],angle_rotation*z)
rs.EnableRedraw(True)
if __name__=="__main__": Main()
Pt
= KMAX pattern =
x1 = X y1 = Y z1 = Z
= {} midPt = []
Step 2. Creating Curves from the Midpoints
CODE LOGIC 27
Form Explorations Using Minimal Surfaces
Ann Arbor, Michigan, United States
August - December, 2022
Academic Project (During Masters, University of Michigan) Team of 2 People
Role: Contributed to the Form Explorations
Supervisor: Prof. Mania Aghaei Meibodi (meibodi@umich.edu)
Aim: To understand the construction and application of geometric minimal surfaces using various methods
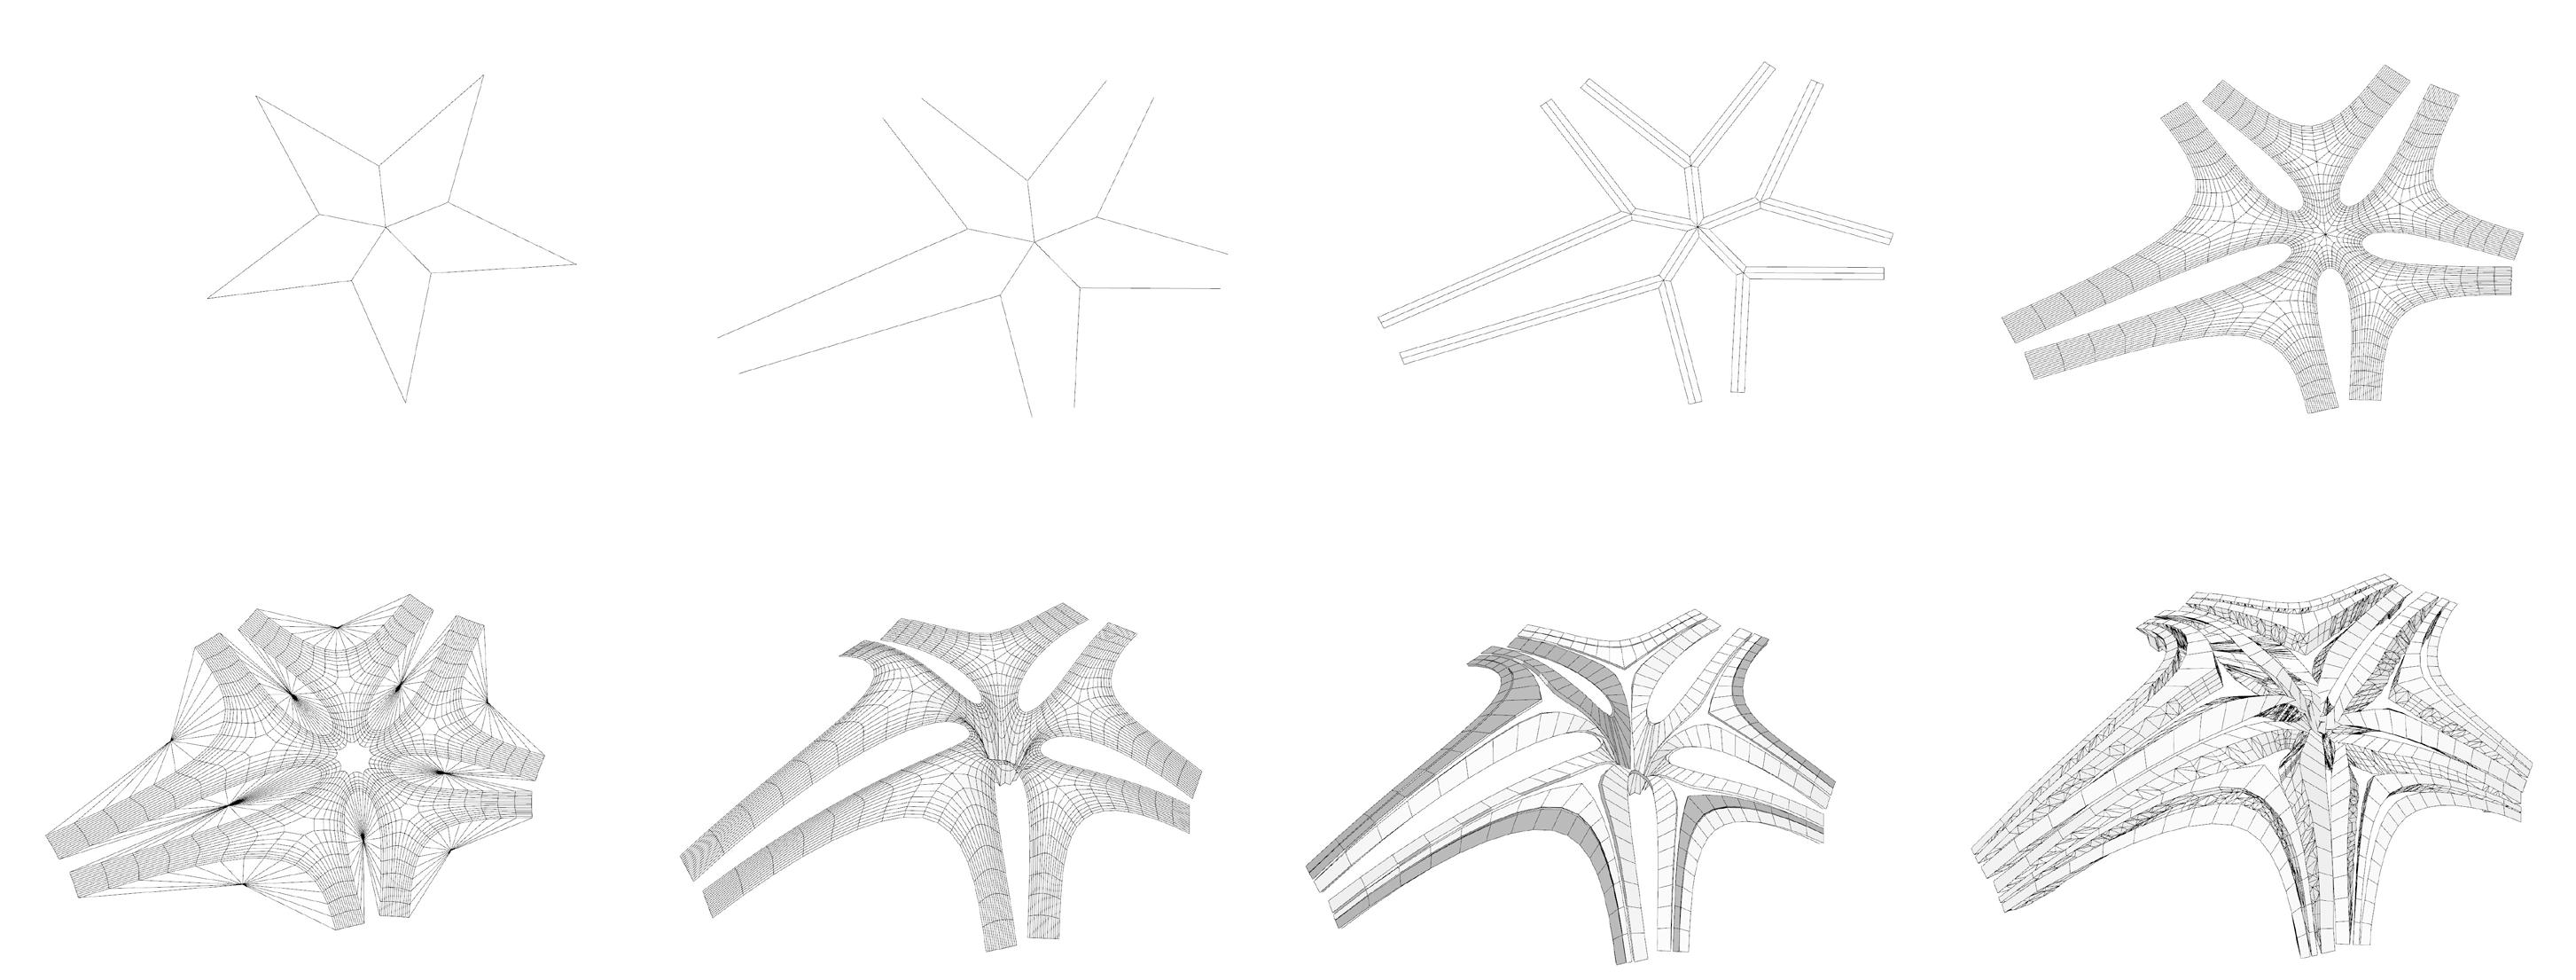
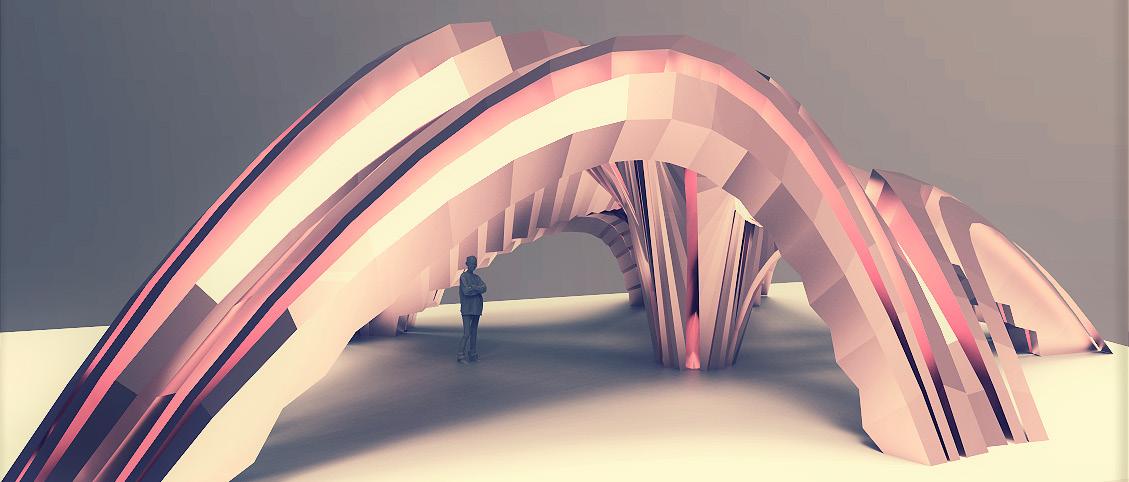
Summary: Using Grasshopper Plugins and Solvers in Rhino, Geometric Minimal Surfaces were constructed using various methods starting from manual digital modelling to generating using mathematical equations to mesh relaxation methods and so on. The final outcome was to transition into the possibility of creating architectural spaces using minimal surfaces
Keywords: Minimal Surfaces, Computational Geometries, Mesh Relaxation
Softwares Used: Rhino, Grasshopper, Kangaroo, Millipede, Keyshot, Adobe Creative Suite
28
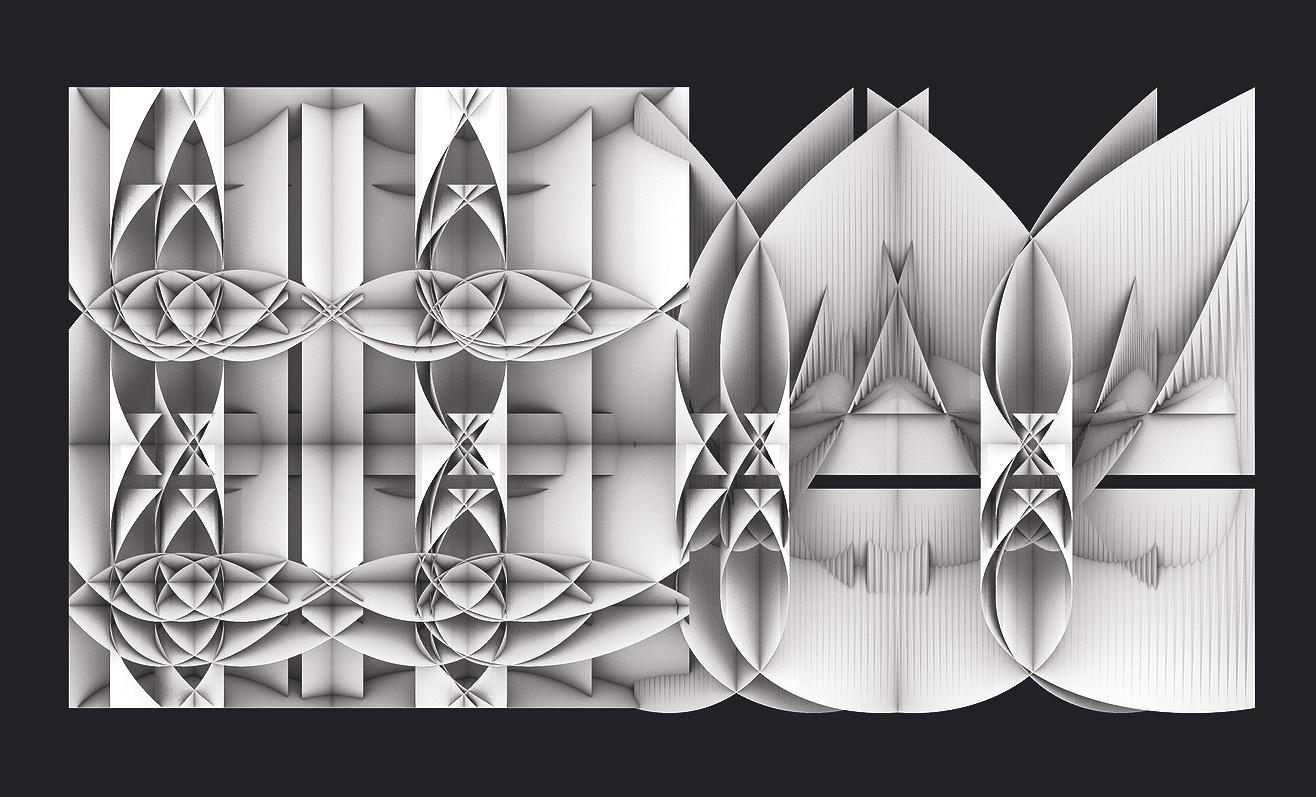
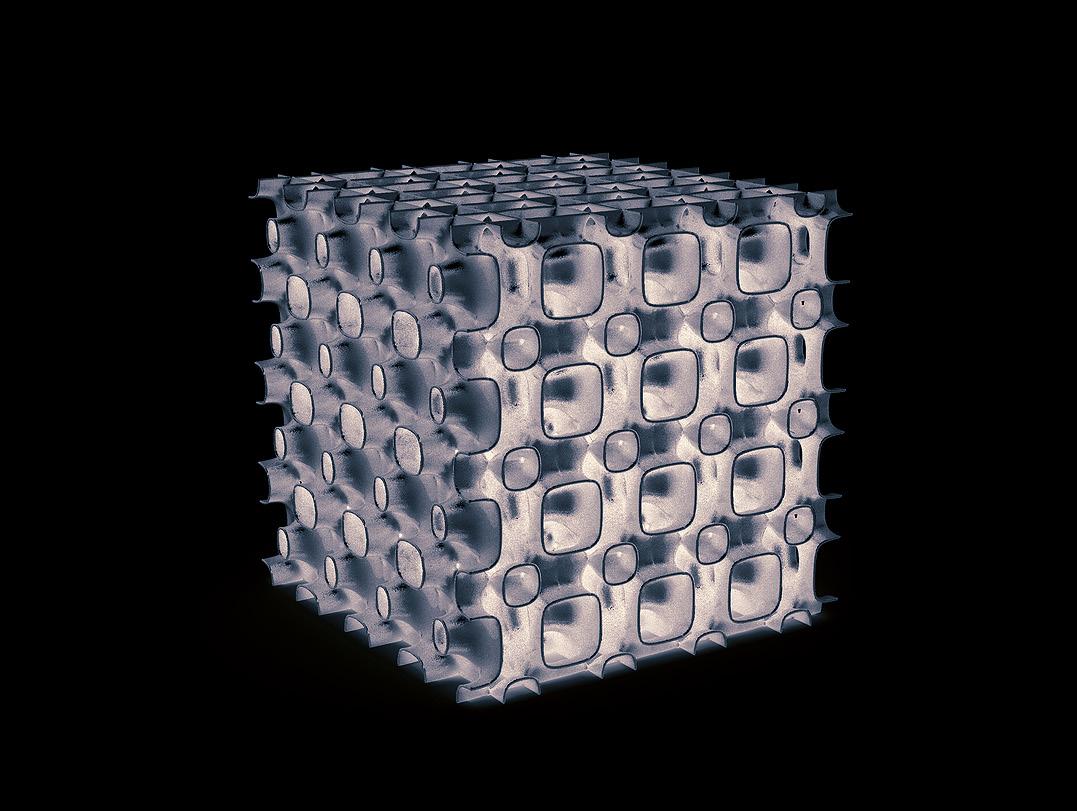
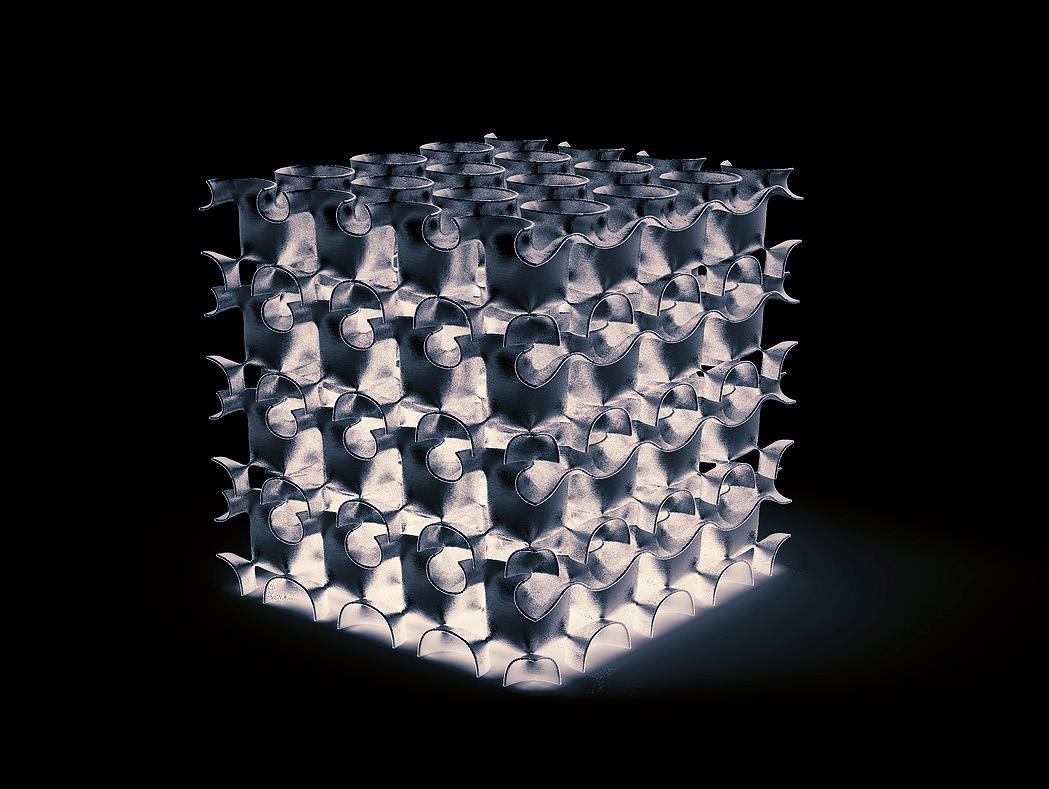
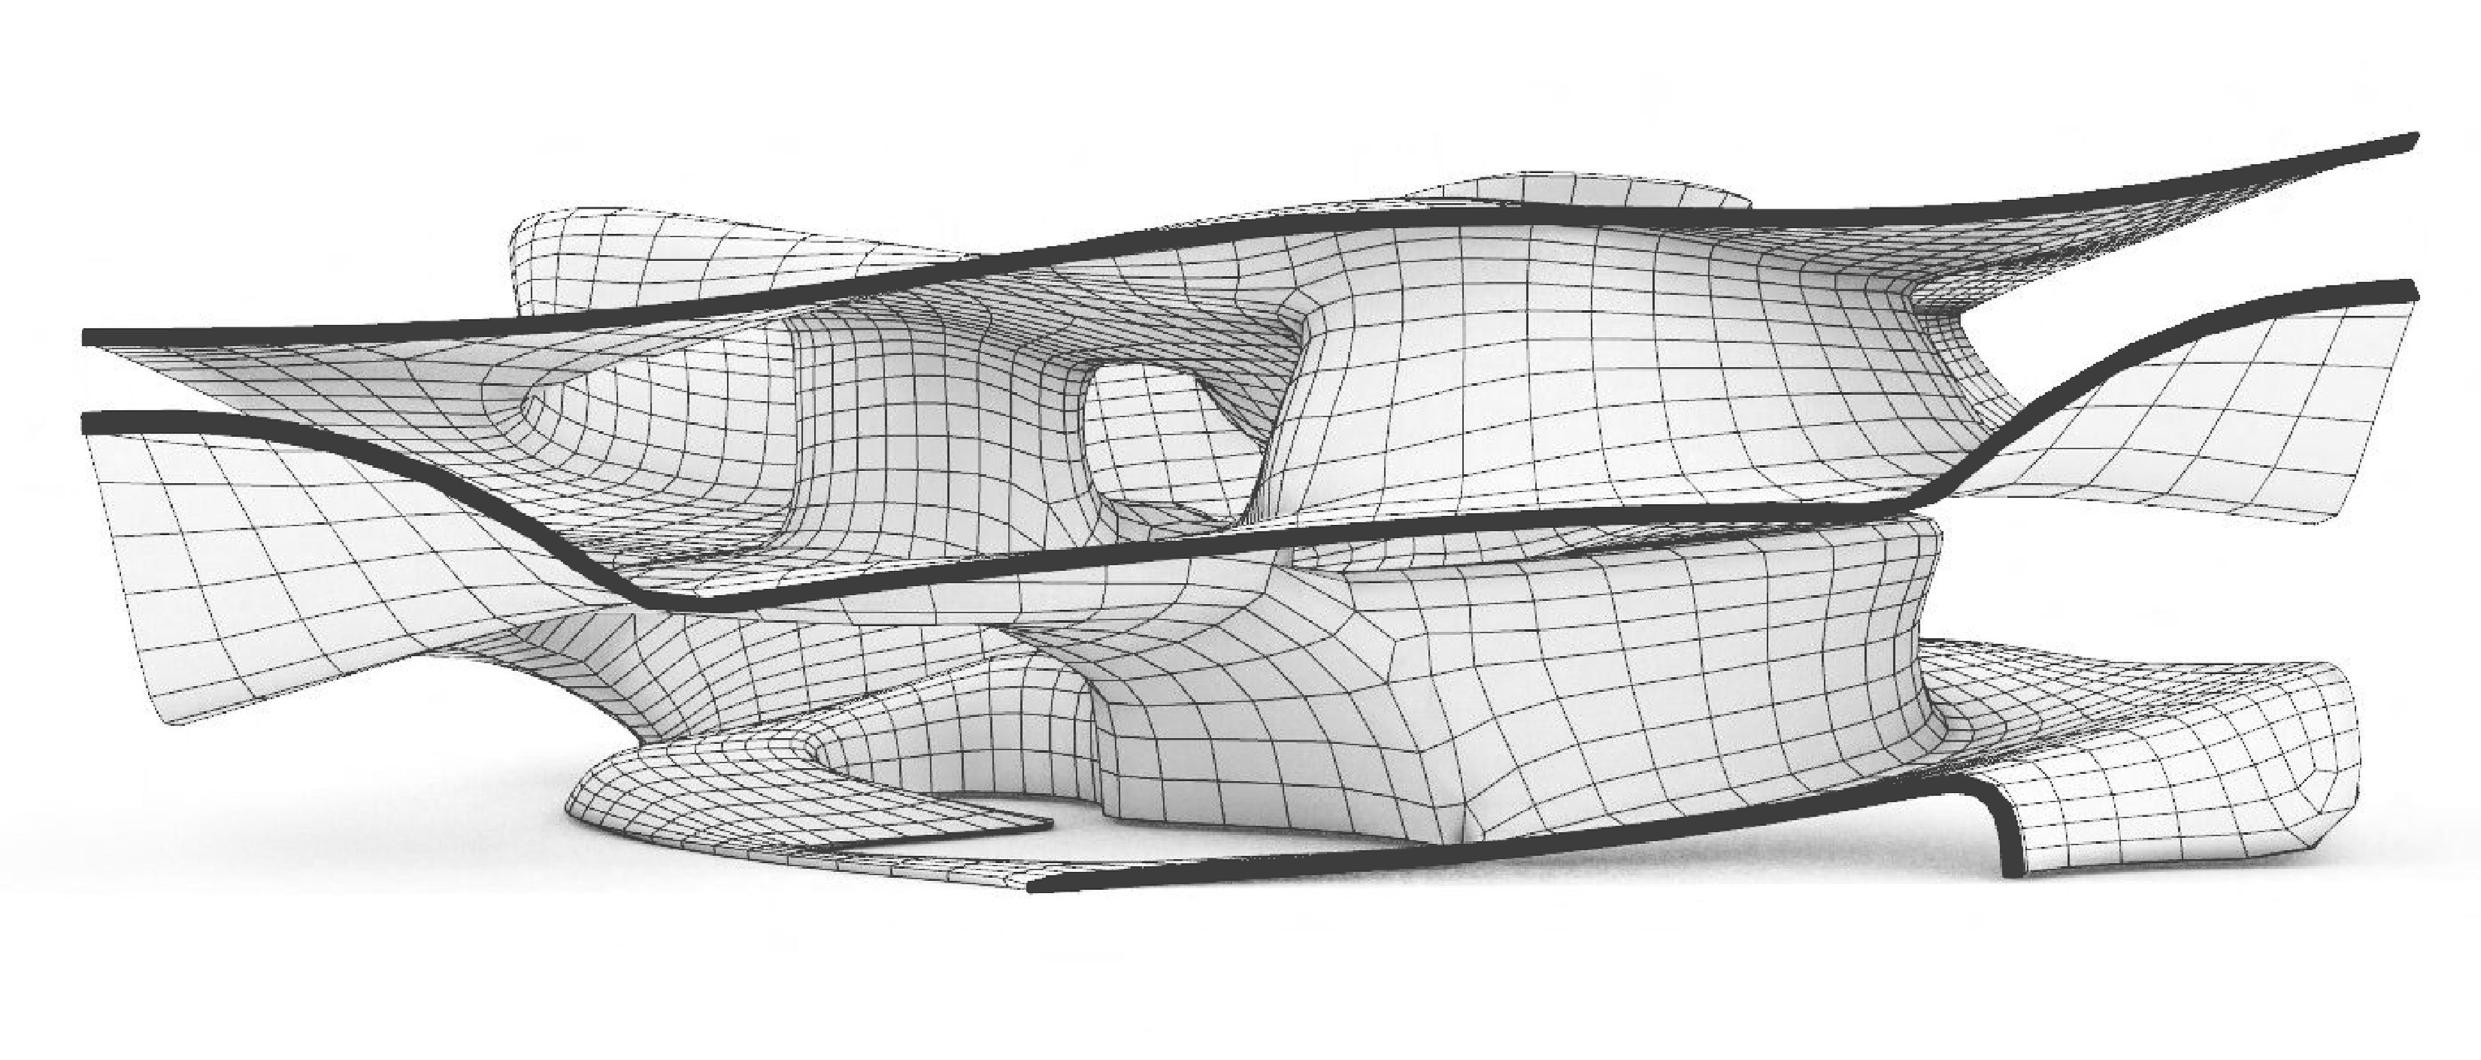
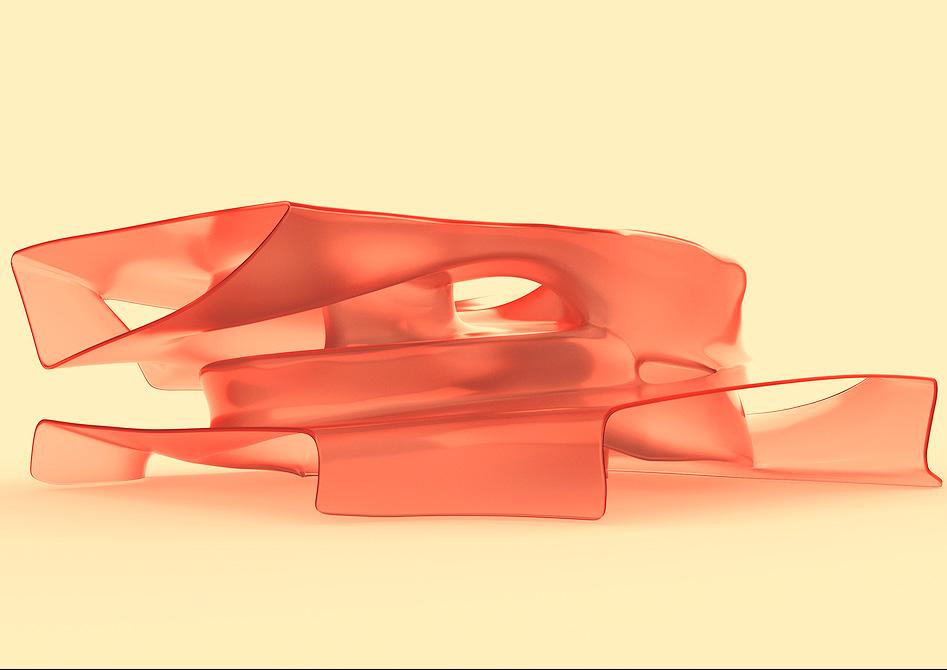
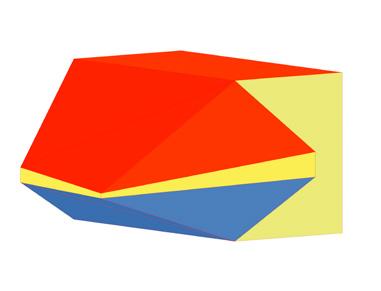
MANUAL MODELLING OF MINIMAL SURFACES IN RHINO ENVIRONMENT
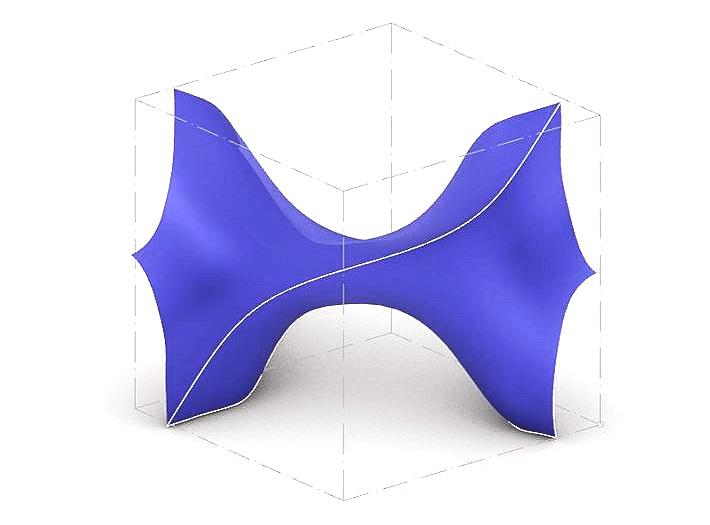
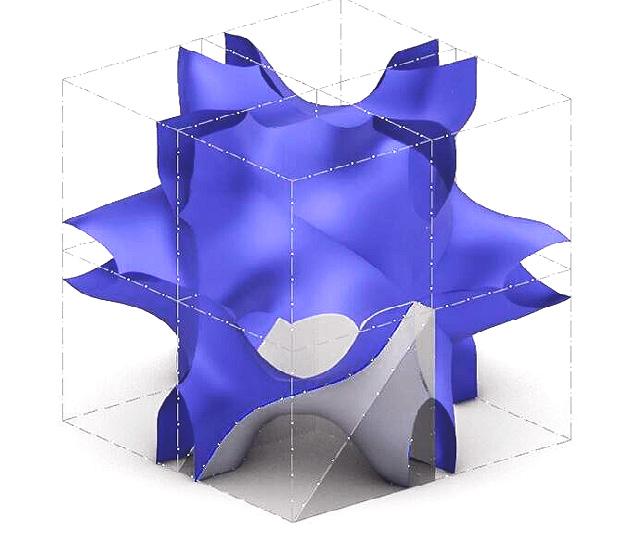
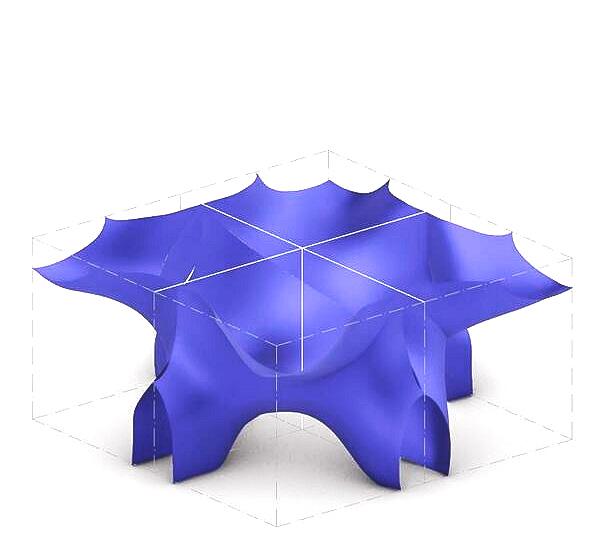

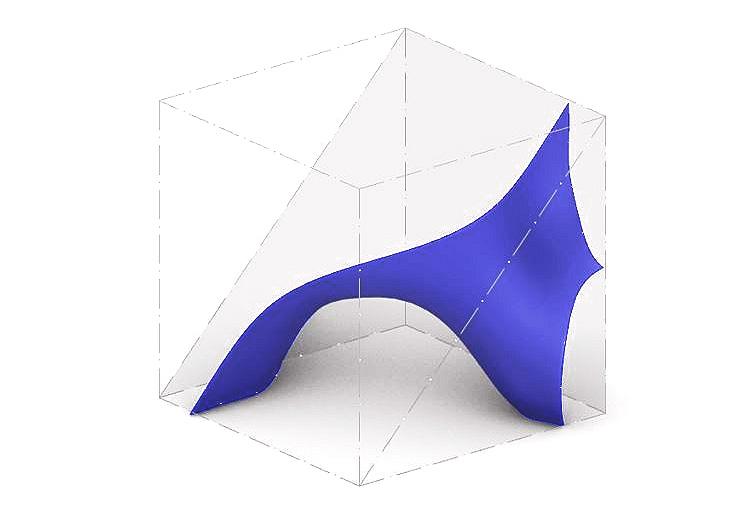
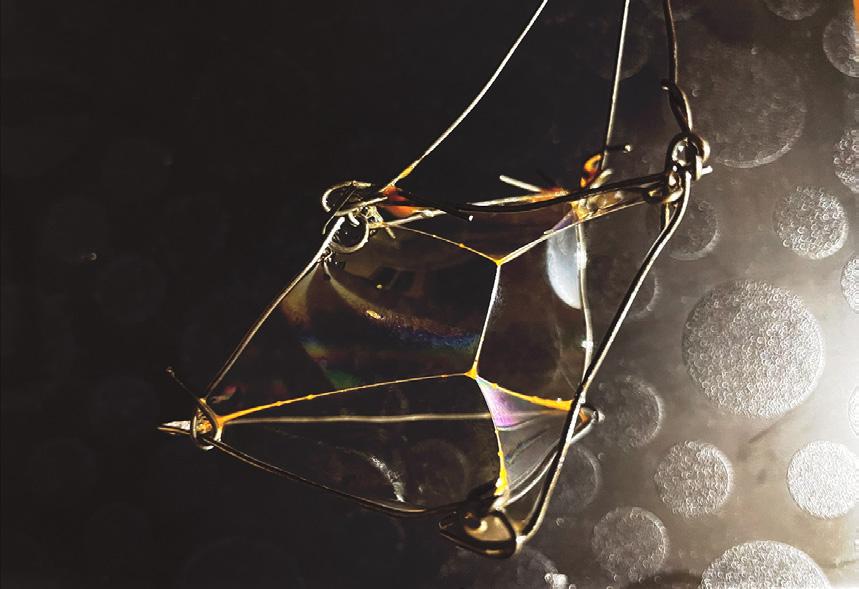

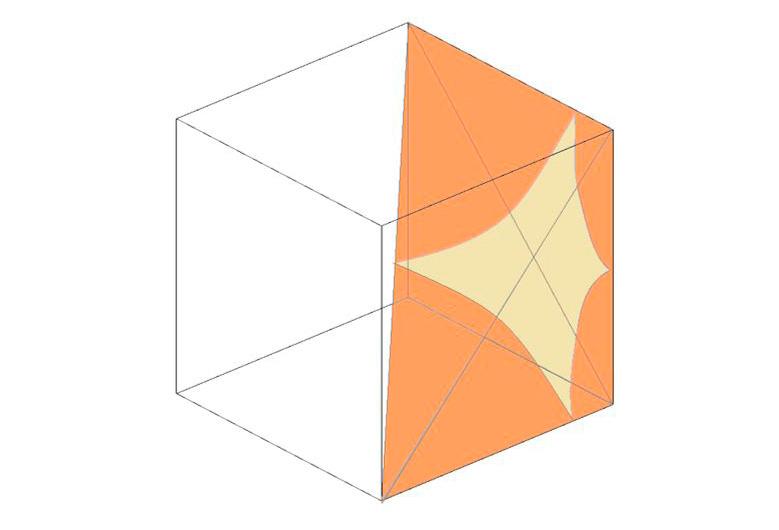
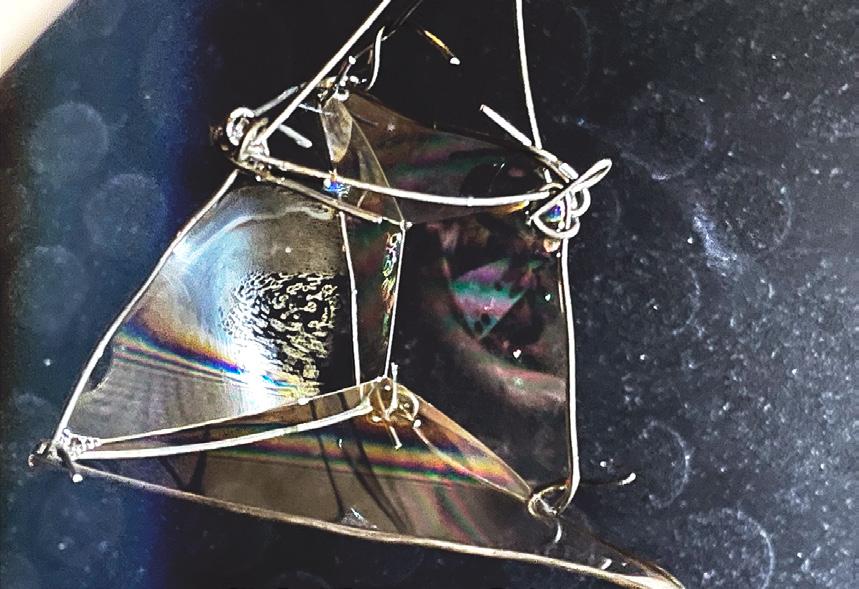
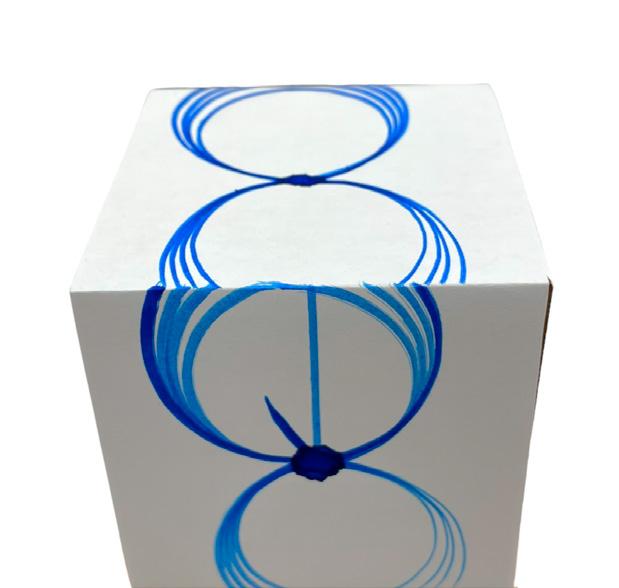
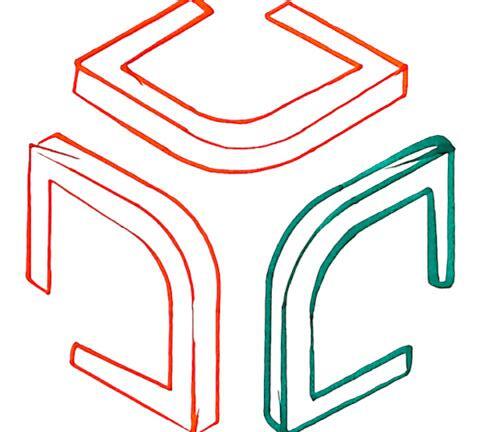
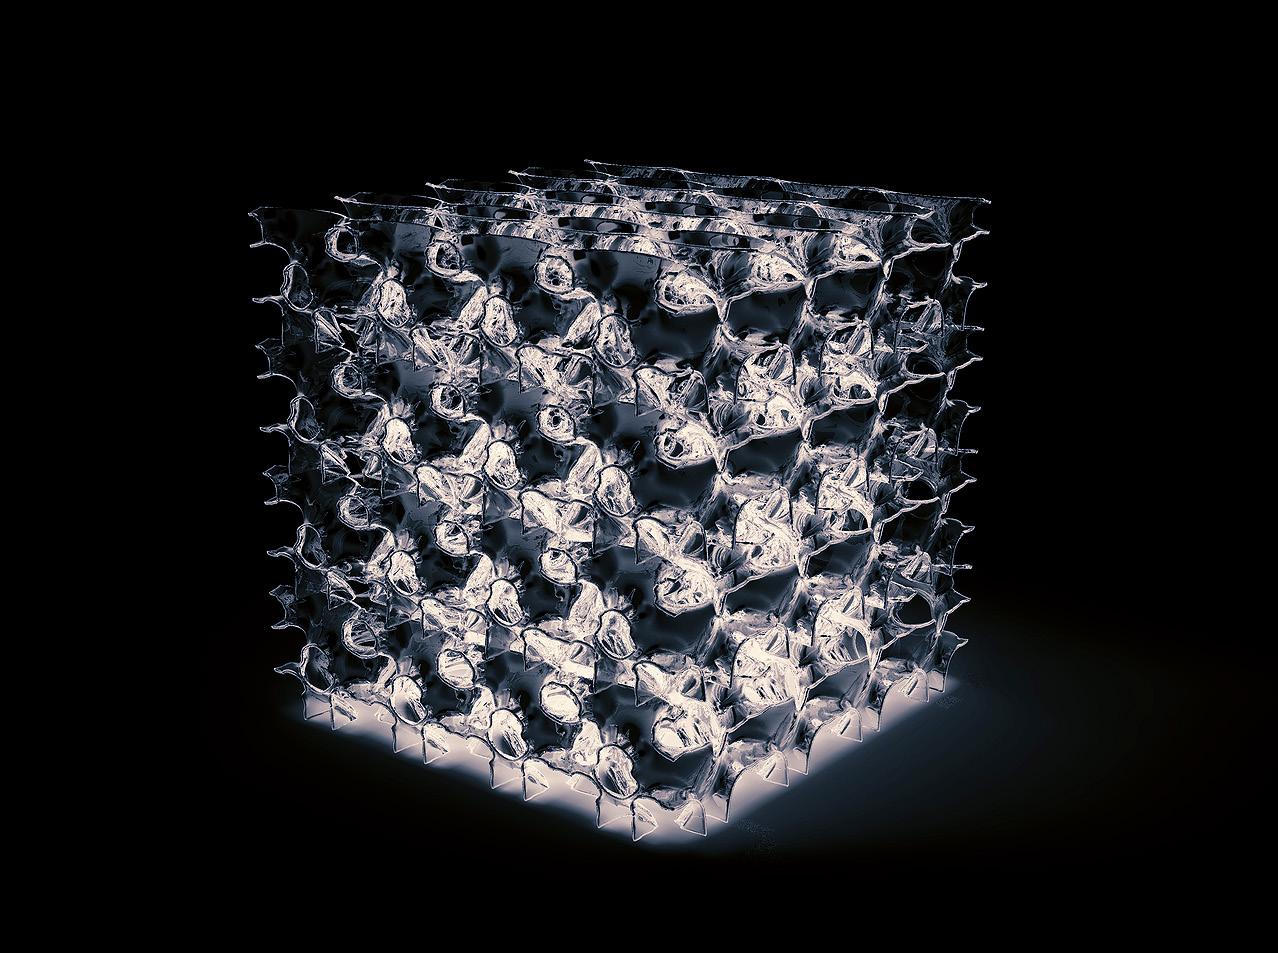
A minimal surface is a surface that minimizes its area between the given boundaries as much as possible. Soap films is one of the examples of naturally occuring minimal surfaces and various types of minimal surfaces have been discovered. The diagrams shown below craft a Neovius Surface - Genus 9
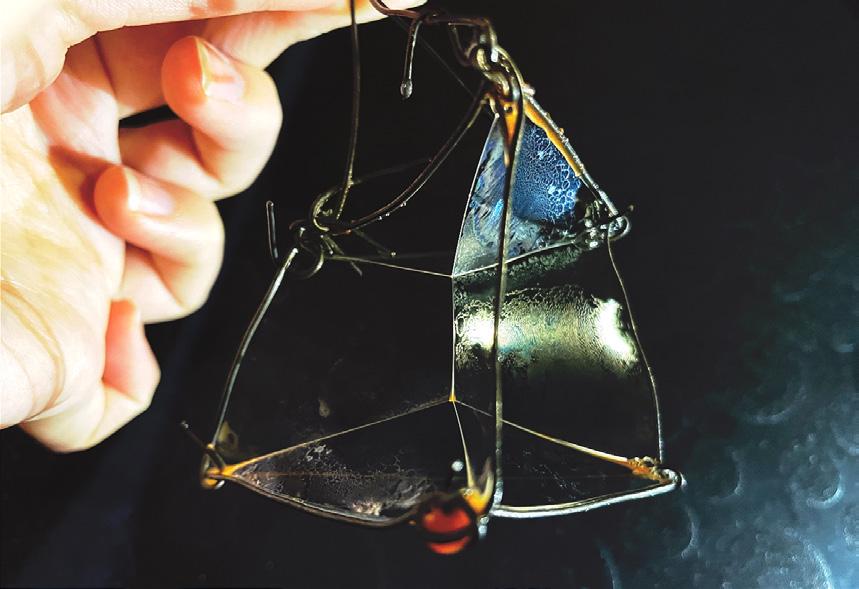 SOAP FILM EXPLORATIONS
1. TRACE CURVES ON THE FUNDAMENTAL REGION TO GENERATE THE UNIT SURFACE
2. MIRROR, FLIP, ROTATE
3. MIRROR
4. REPEATABLE MODULES THROUGH MIRRORING AND ROTATING (1/2 CUBICAL MODULE IN GREY)
SOAP FILM EXPLORATIONS
1. TRACE CURVES ON THE FUNDAMENTAL REGION TO GENERATE THE UNIT SURFACE
2. MIRROR, FLIP, ROTATE
3. MIRROR
4. REPEATABLE MODULES THROUGH MIRRORING AND ROTATING (1/2 CUBICAL MODULE IN GREY)
9) 29
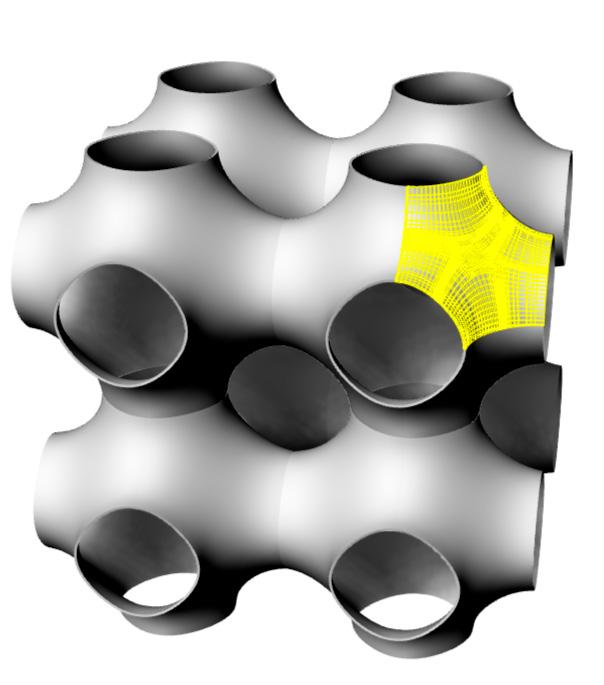
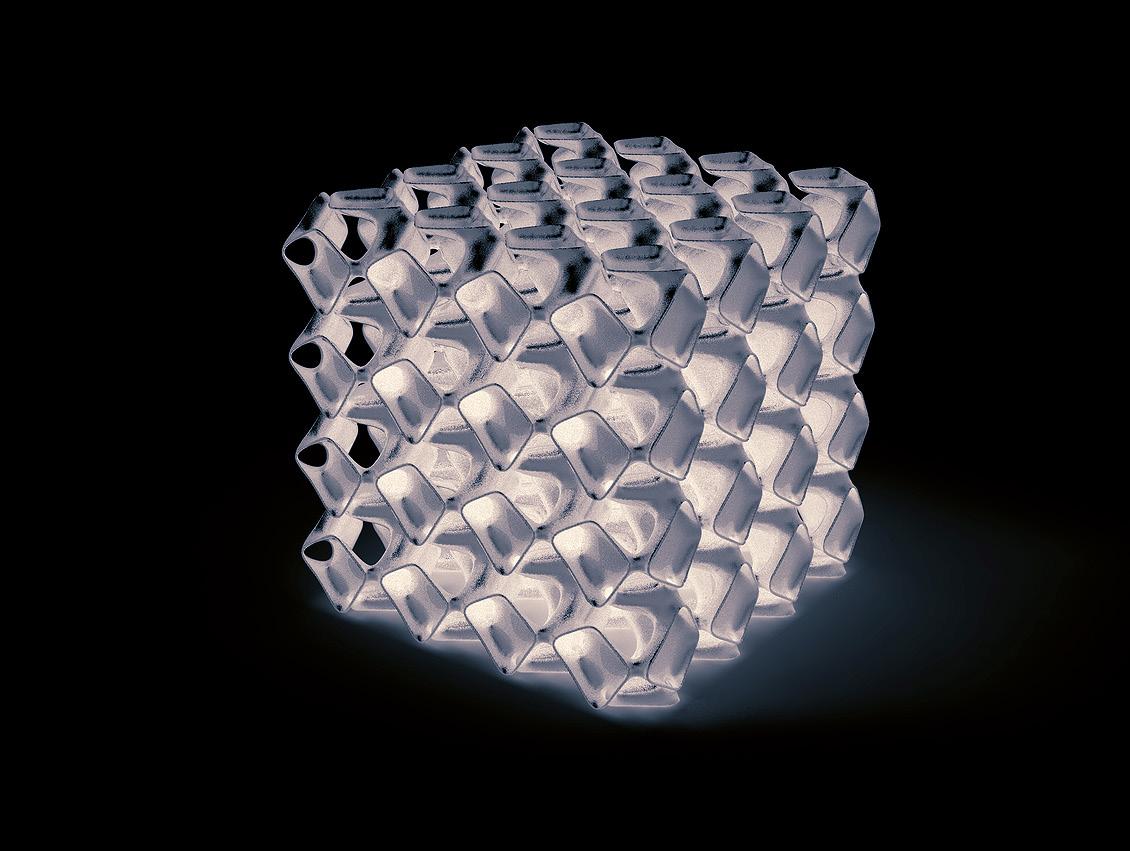
5. MODULAR STRUCTURE WITH SURFACE THICKNESS (AGGREGATION OF A NEOVIUS SURFACE - GENUS
GENERATING VARIOUS MINIMAL SURFACES USING MATHEMATICAL EQUATIONS IN GRASSHOPPER
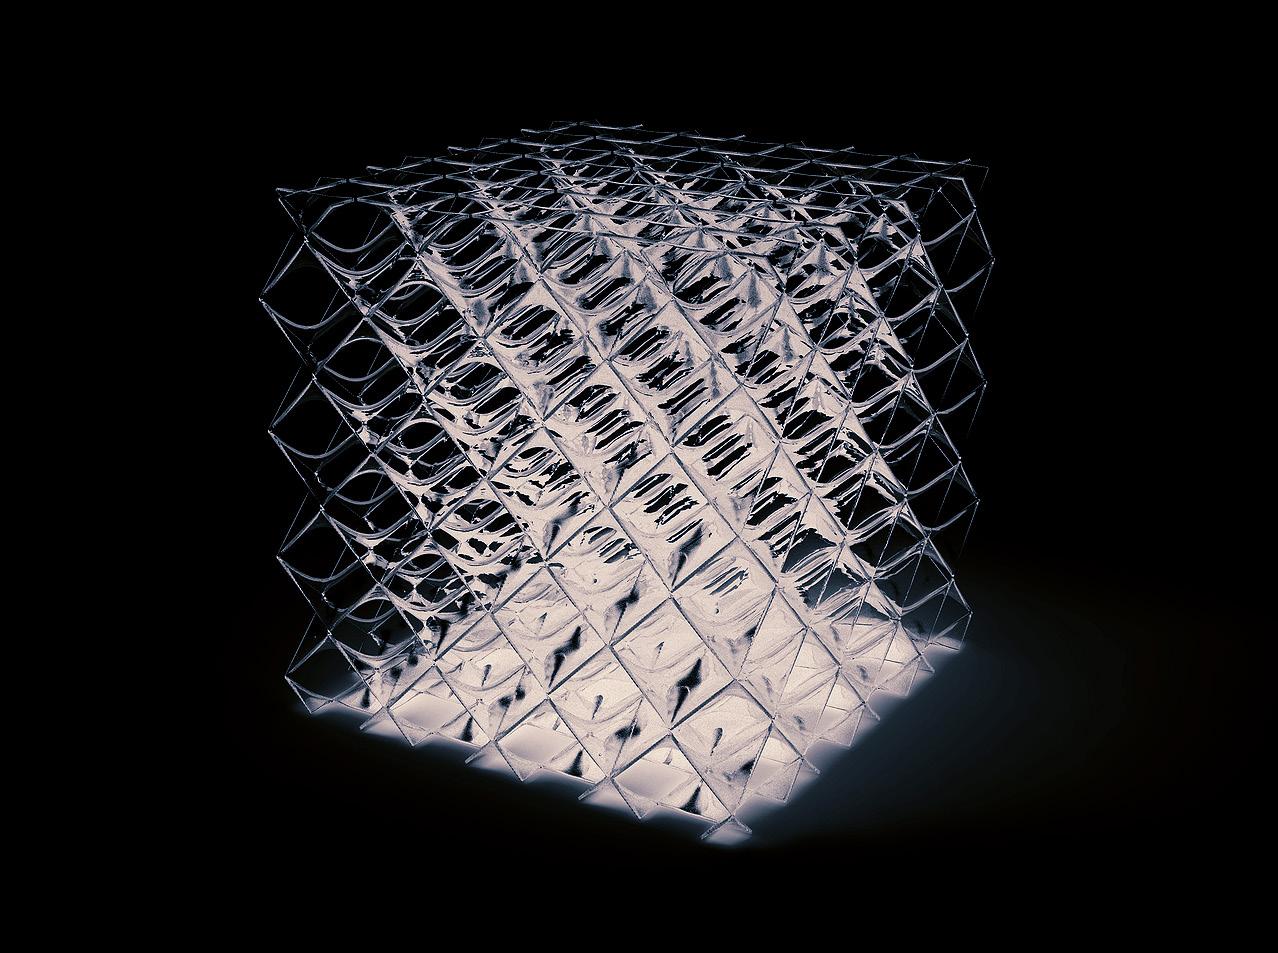


30
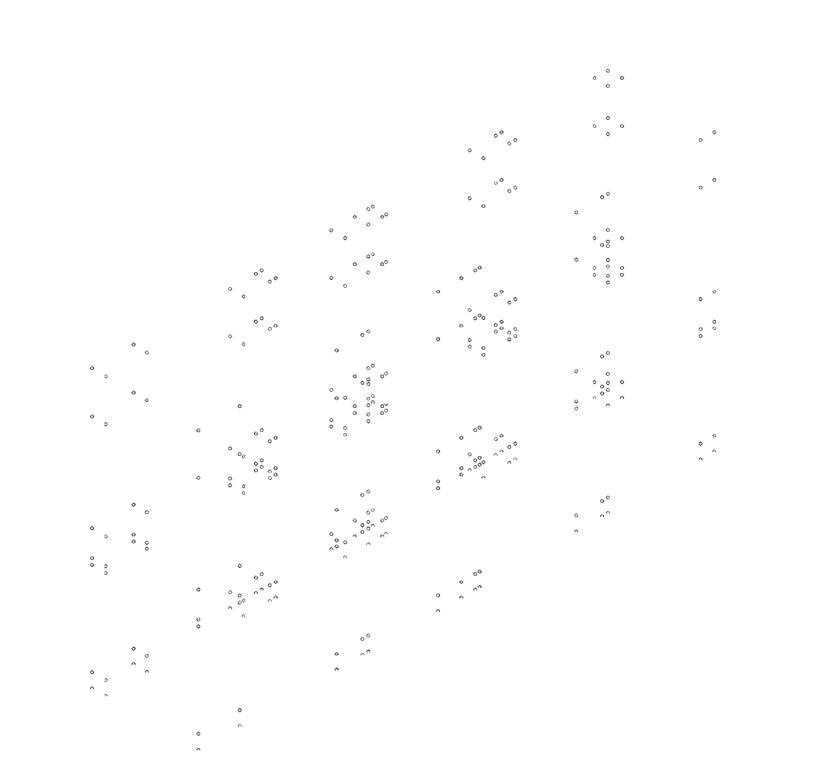
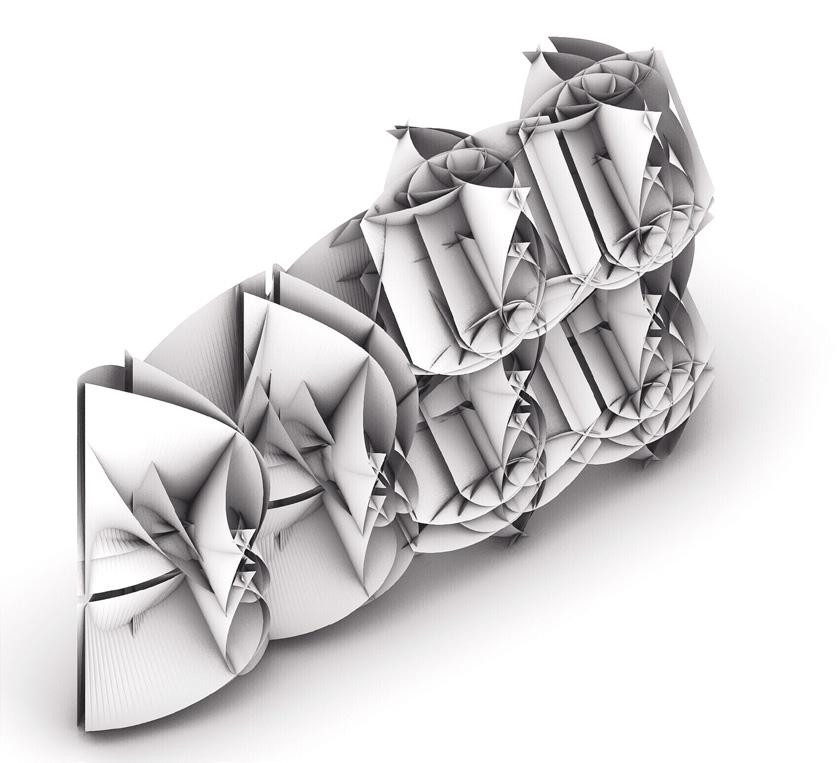
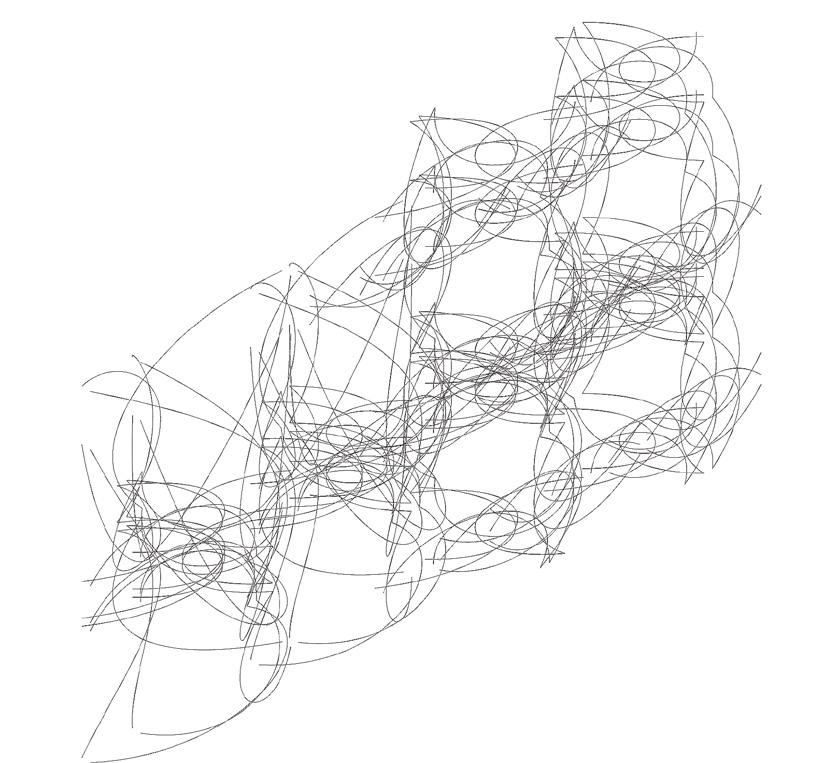
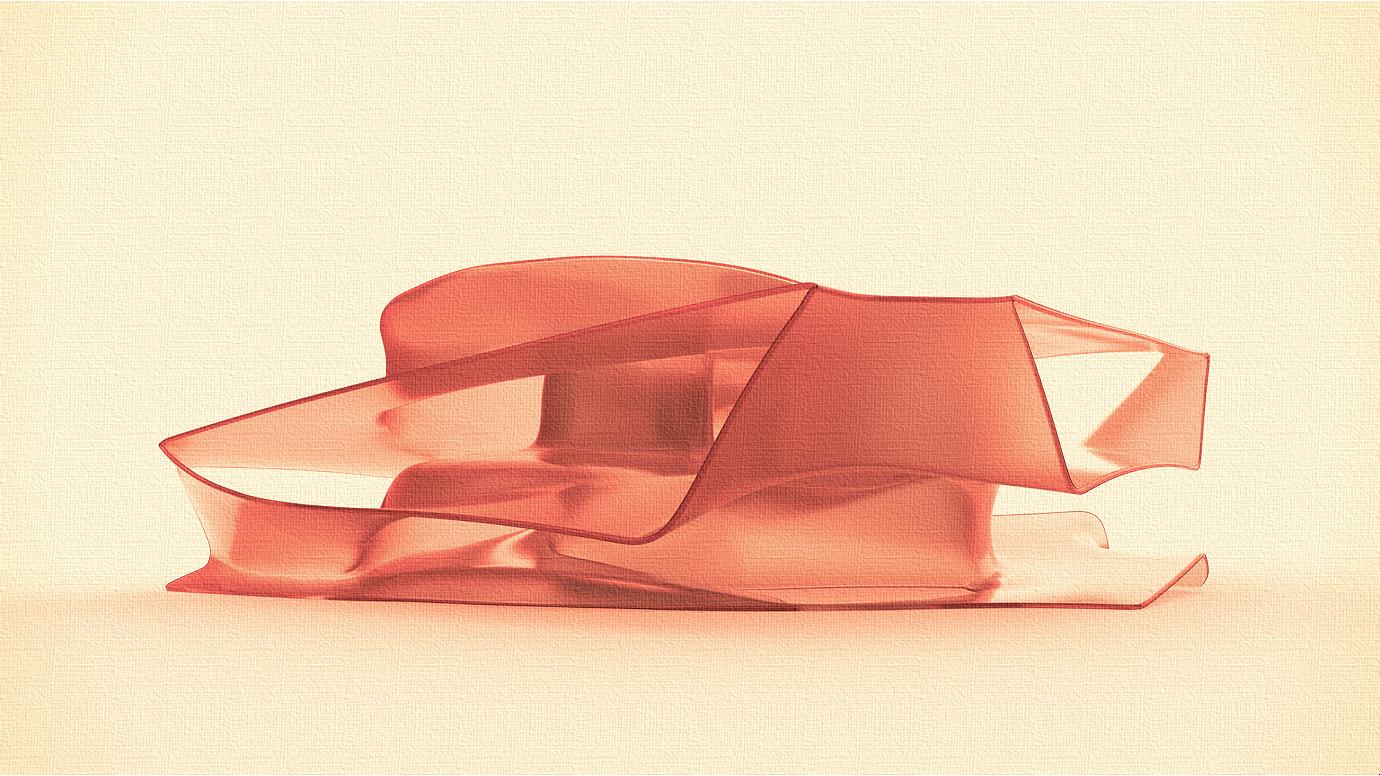
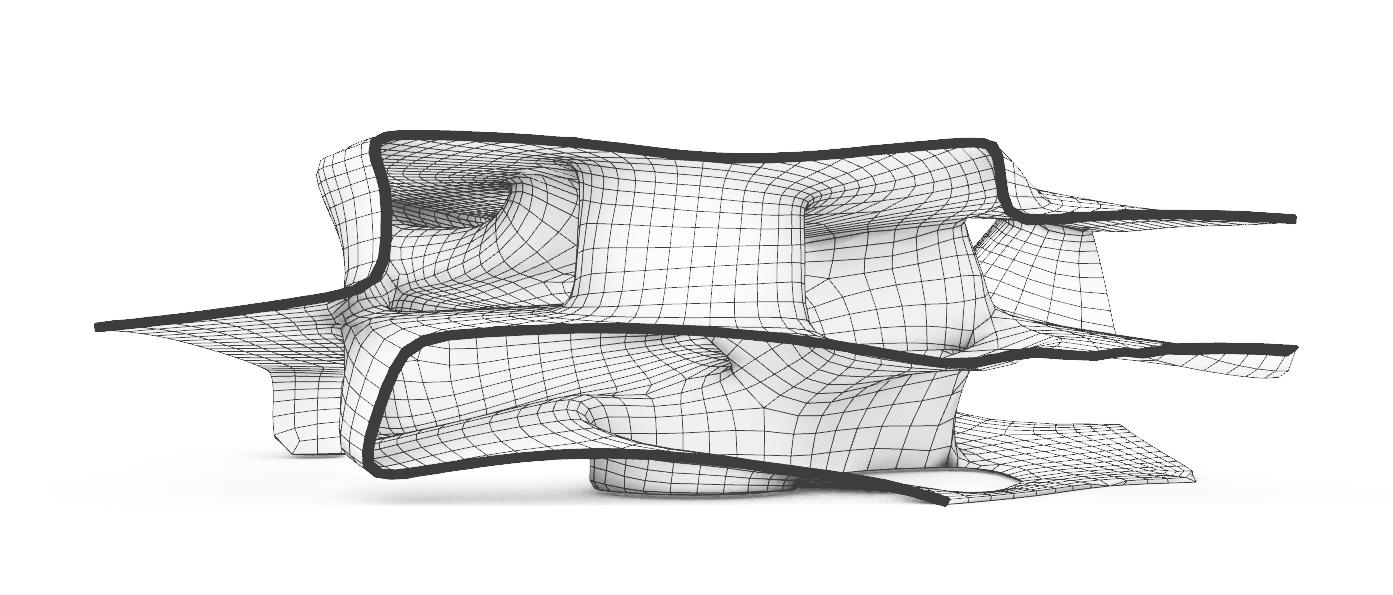
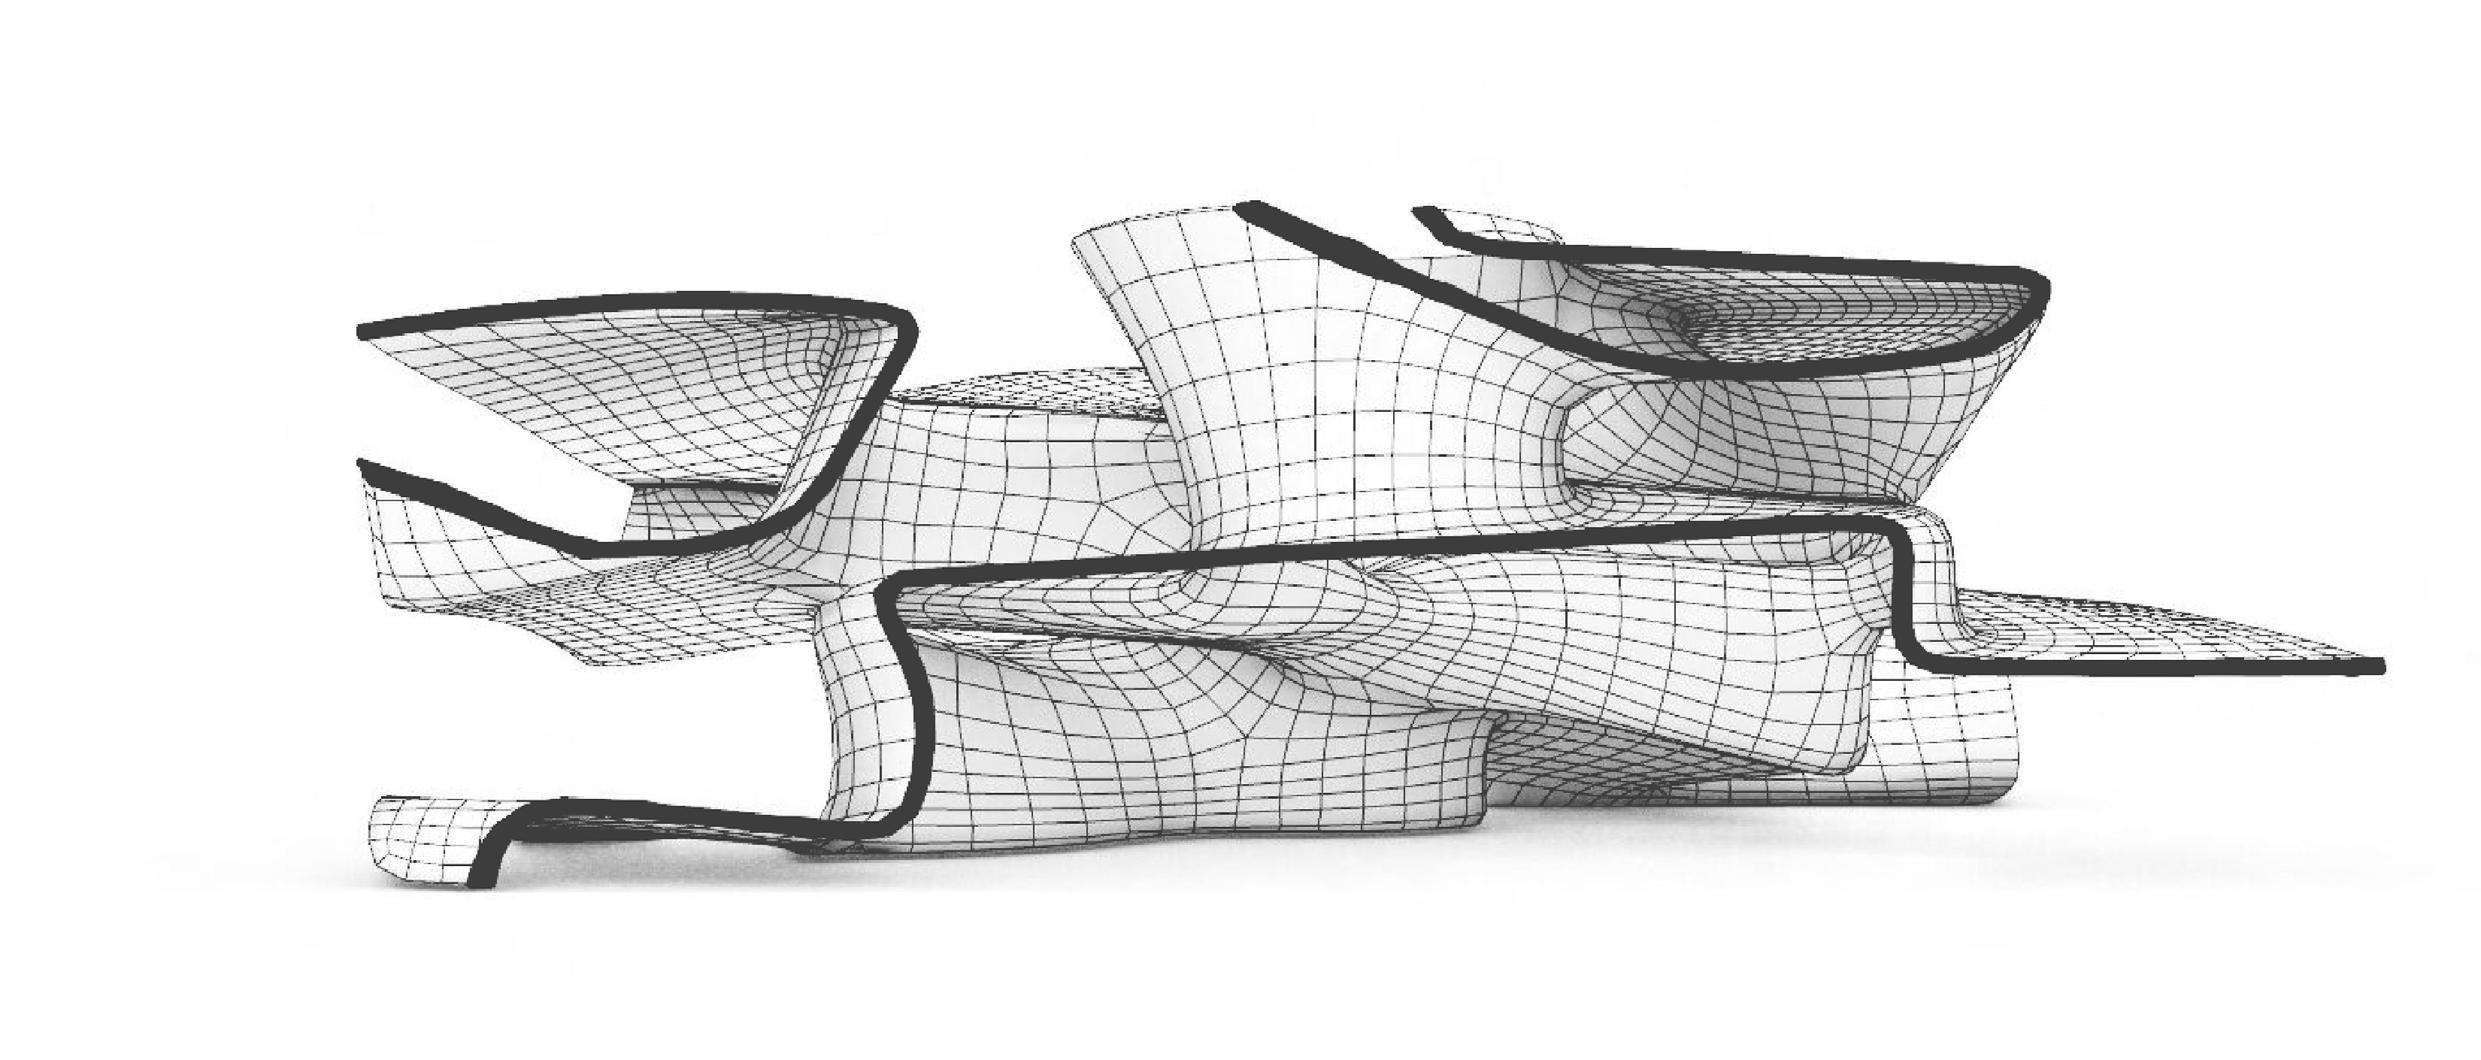
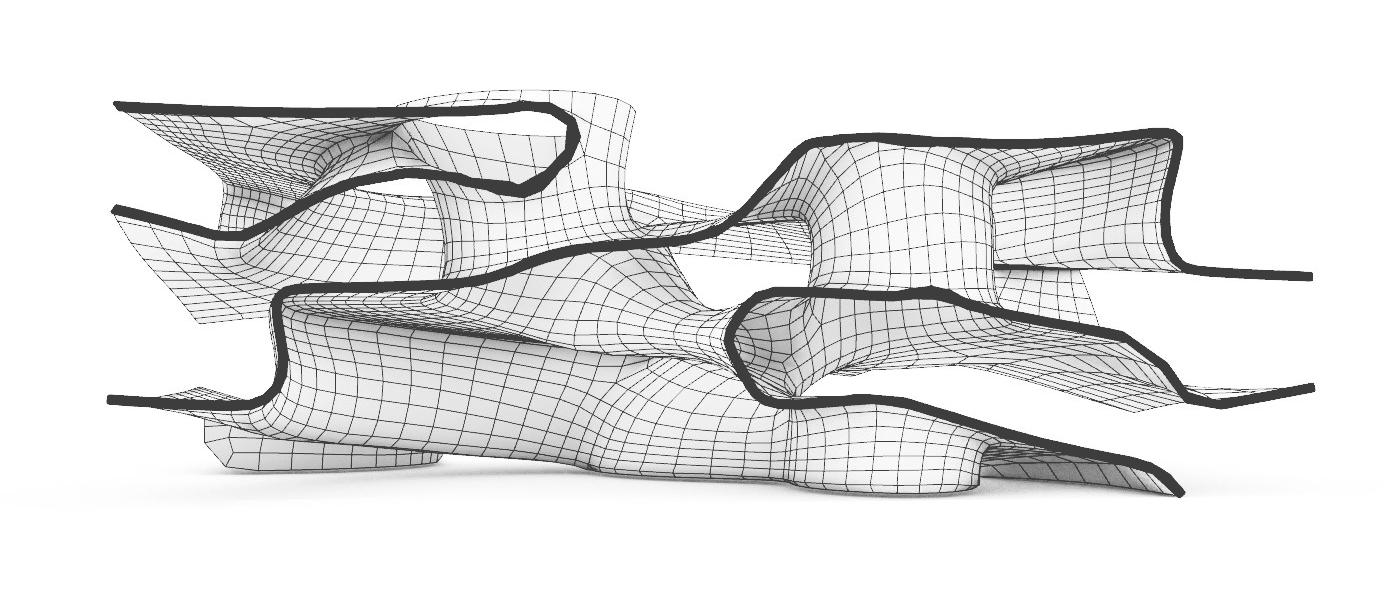
FURTHER FORM EXPLORATIONS USING VARIOUS MESH RELAXATION METHODS IN GRASSHOPPER Sectional Cuts depicted below for an abstract concept for creating an Architectural Cycling Track using Minimal Surfaces
31
32
Chinchwad City Centre
Undergraduate Thesis, 2018
Public Space Design
33
Chinchwad City Centre Congruence of Mixed-Uses, Activities and Materials for Multi-Layered Experiences
Pimpri-Chinchwad, Maharashtra, India
9th Semester, Undergraduate Thesis, 2018 Academic Individual Work
Thesis Guide: Dr. Nakul Dhagat, Associate Professor, Department of Architecture and Planning, M.A.N.I.T., dhagatn@manit.ac.in
Aim: To create a vibrant mixed-use development that generates employment and facilitates public activities while reviving local craft and culture. Also an attempt to solve the city’s massive waste generation issue by utilizing recycled plastic waste as materials in design
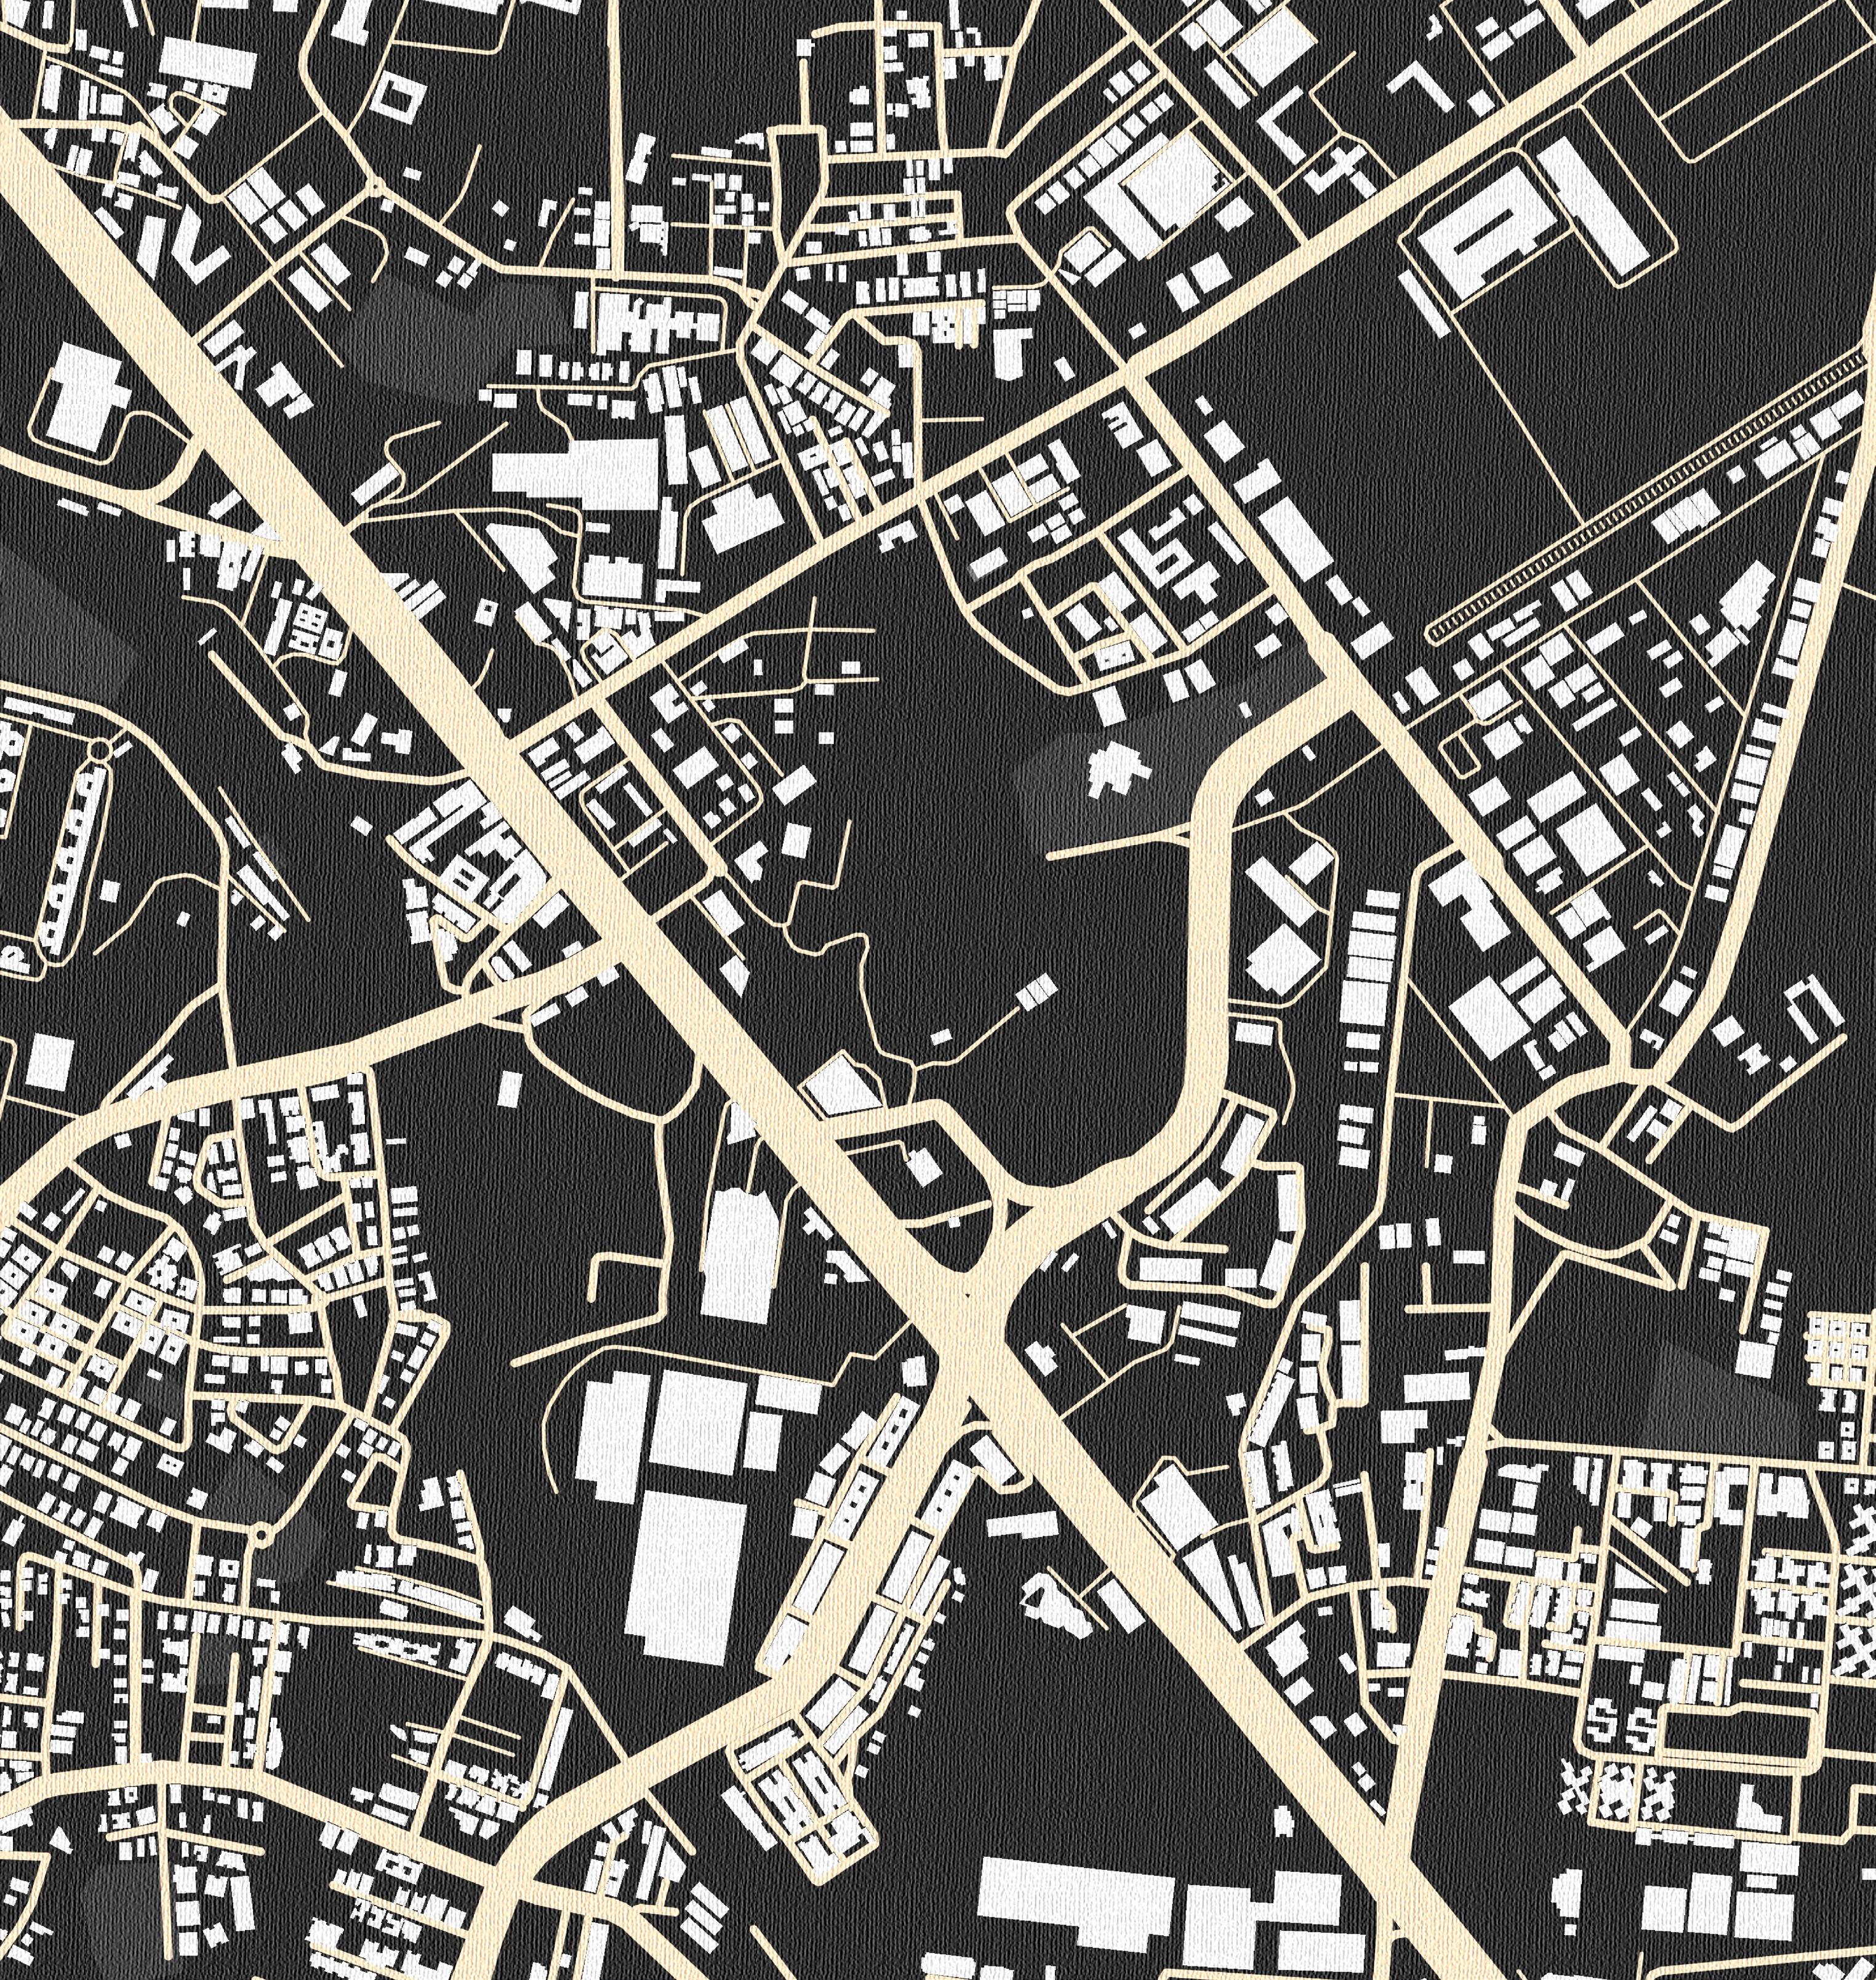
Summary: This 28 acres of site is located in the heart of Pimpri-Chinchwad city - at the intersection of the Mumbai-Pune highway service road and flyover, a busy and bustling zone. Pimpri-Chinchwad is a satellite city dependent on Pune City in the state of Maharashtra, India. It is known for its automotive, IT, sugar and thermo flasks industries. It is a culturally rich place, with various sightseeing places and monuments juxtaposed alongside modern office buildings and industries. Due to its fast paced development, it is in need of an identifiable landmark to reflect its characteristic nature and act as a new central node for decentralizing the congested Pune city. The design redefines the public space criteria and provides a rejuvenating space which will not only offer healthy business ambiance but also serve as a recreational multi-purpose space for people, thus, increasing social sustainability. Various computational methods are explored at different design stages to inform the architectural design decisions
Keywords: Social Sustainability, Public Space Design, Enclosed/Open Spatial Iterations, Solar Radiation Analysis, Image to Mesh Applications
Softwares Used: AutoCAD, Rhino, Grasshopper, Firefly, Ladybug Tools, Galapagos, V-Ray, Revit, Geodesica, Photoshop, Illustrator, Indesign
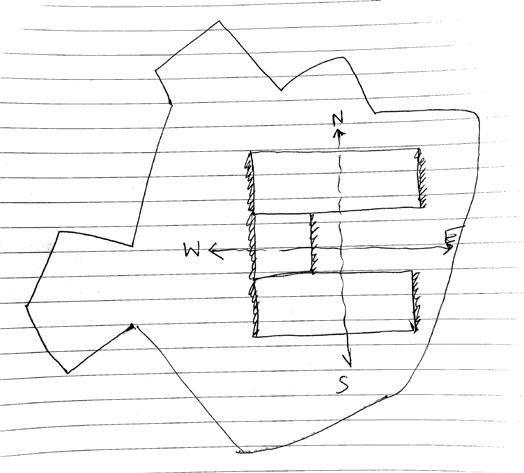
SITE MAIN ROAD AFTER FLYOVER FLYOVER HIGHWAY SERVICEROAD N 34
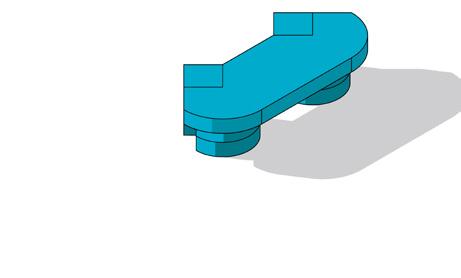
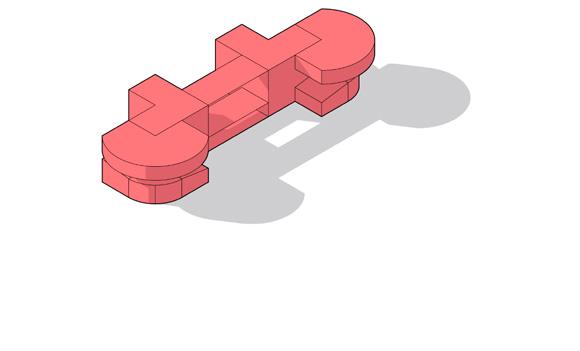
Bubble Zoning Diagram
Entry into site possible only through the main road after flyover. Bubble zones laid out in proximity, with retail and cultural spaces as front facing to attract crowds and commercial space at the back
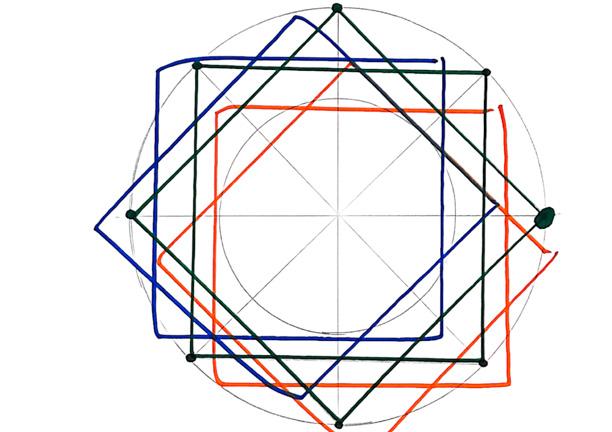
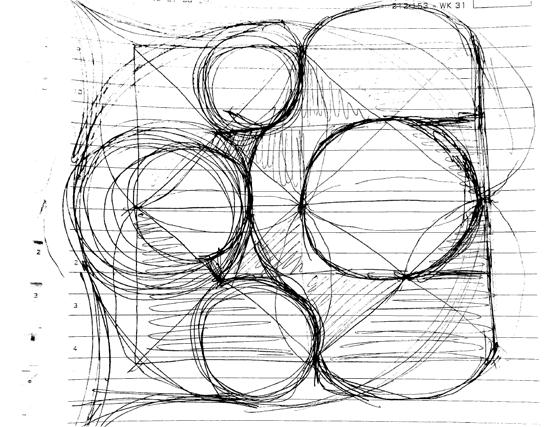
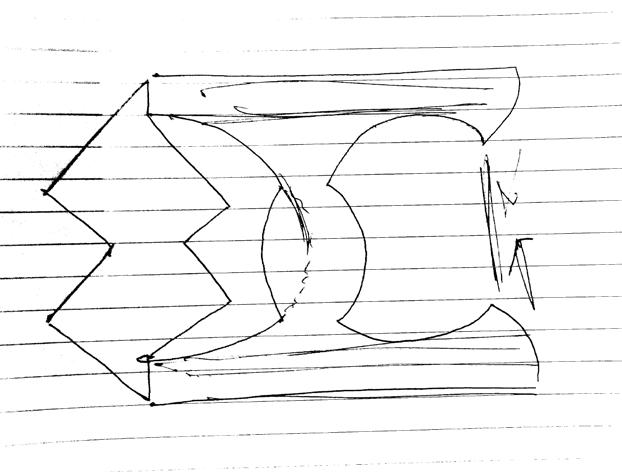
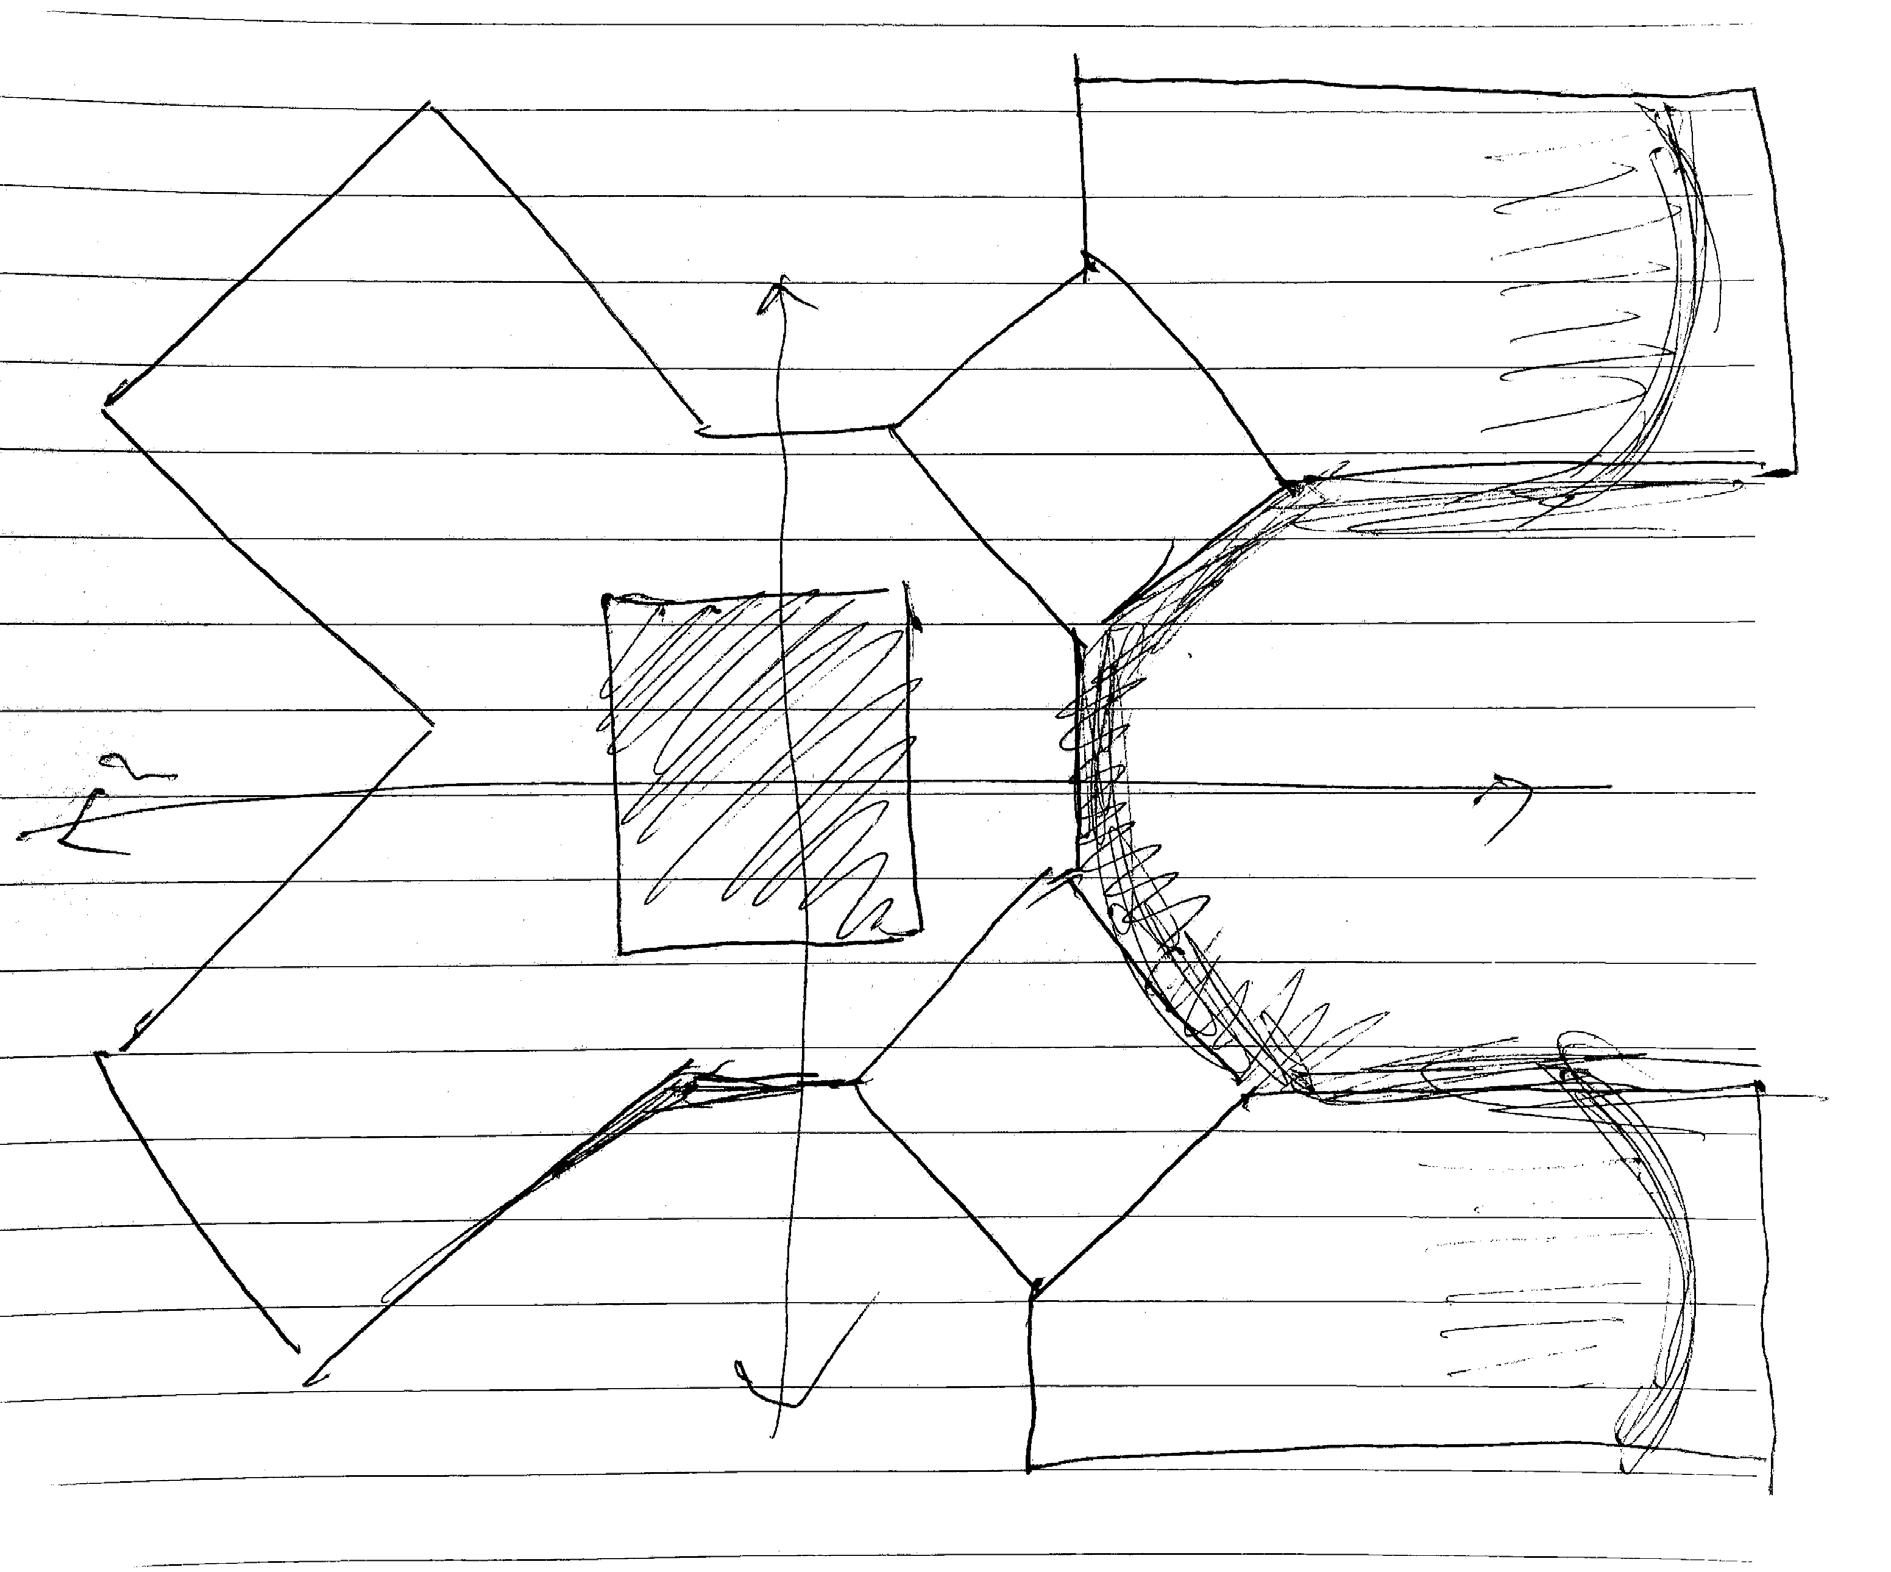
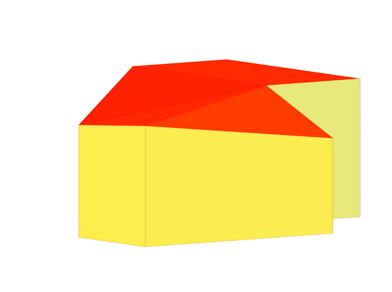
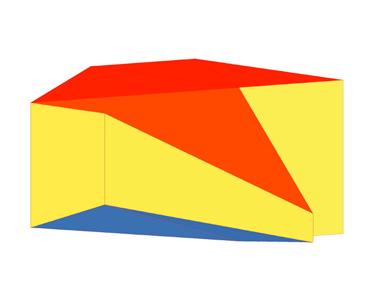
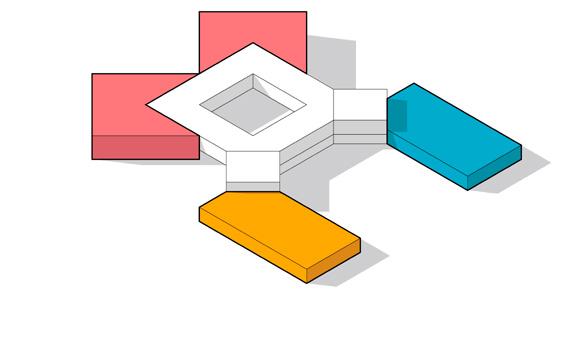
Quadrant Formation & Triangular Divisions
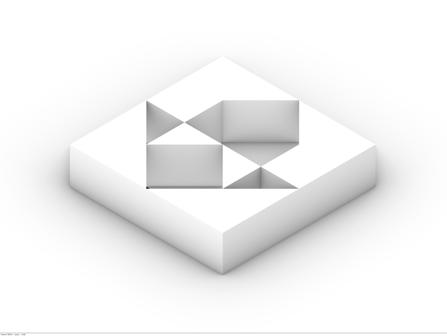
Iterations Based on Void Interplay: Results on next Page
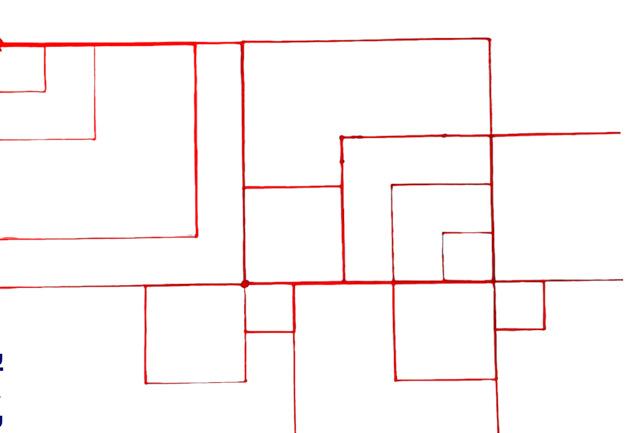
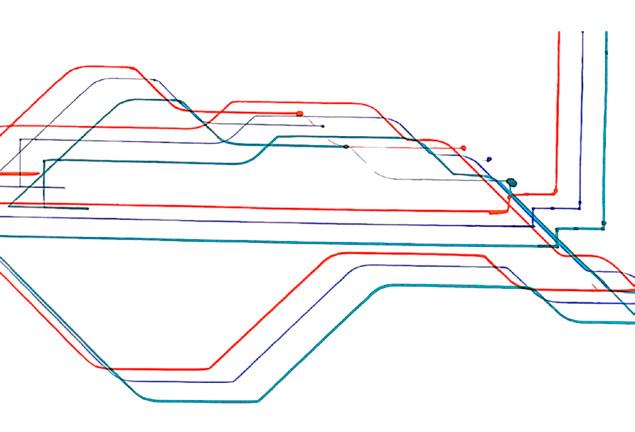
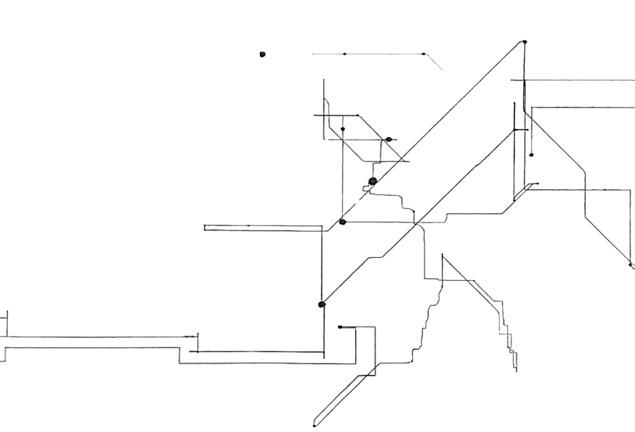
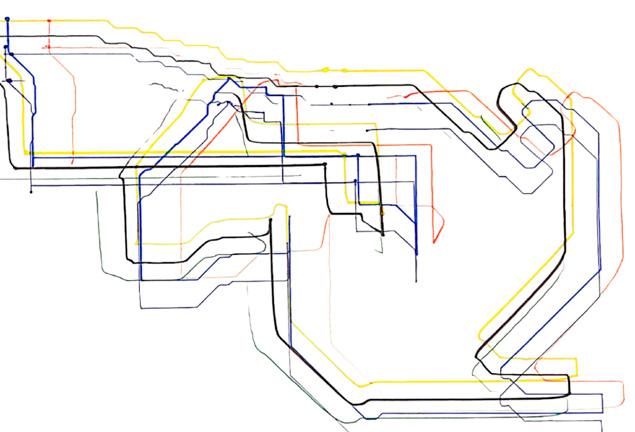
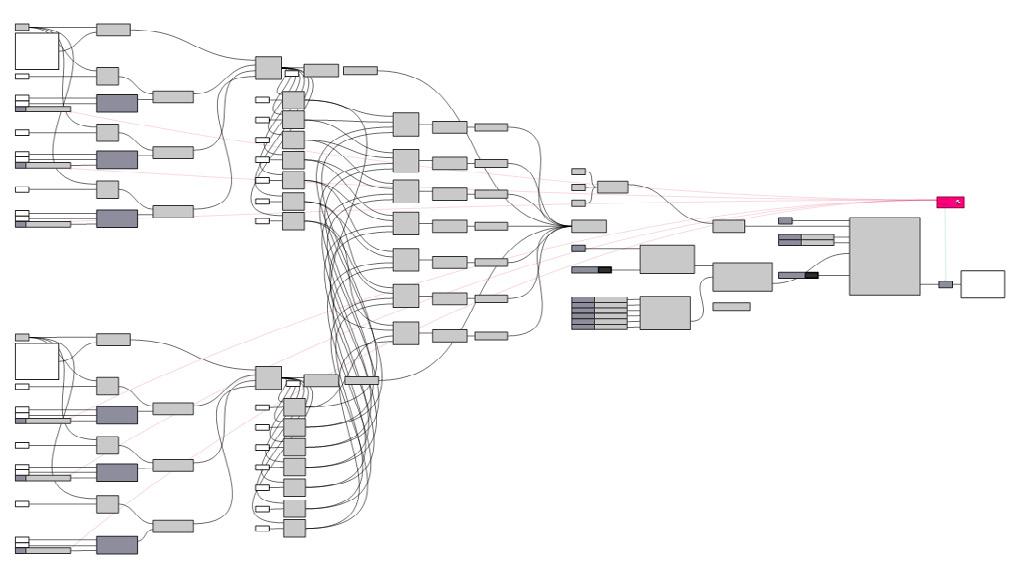
Solids have defined area zoning and enclosure requirements hence they are considered static in this exercise. Voids are flexible and dynamic public spatial uses which can be either open or semi-enclosed or enclosed or a mix. Using grasshopper scripts to formulate logic in the rhino interface, various iterations are generated in which the voids keep changing their nature and form based on 4 logics:
A Defining every alternate number in the void category as an open space
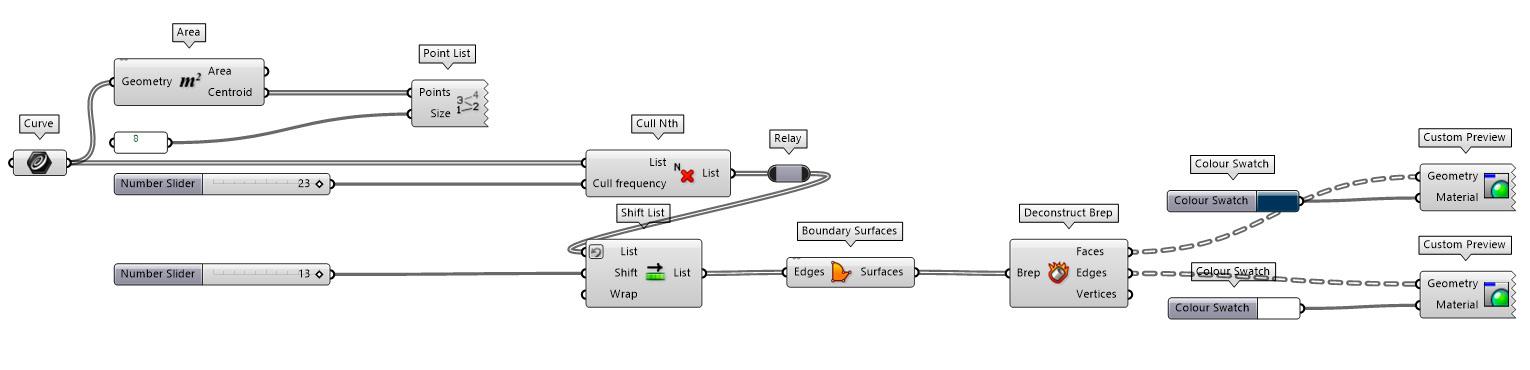
B Consecutively shifting and adding on adjacent open spaces between solids and enclosed voids
C. Randomly defining numbers in the void category as open spaces
D. Using all the above mentioned steps in a continuous linear work-flow to generate more options
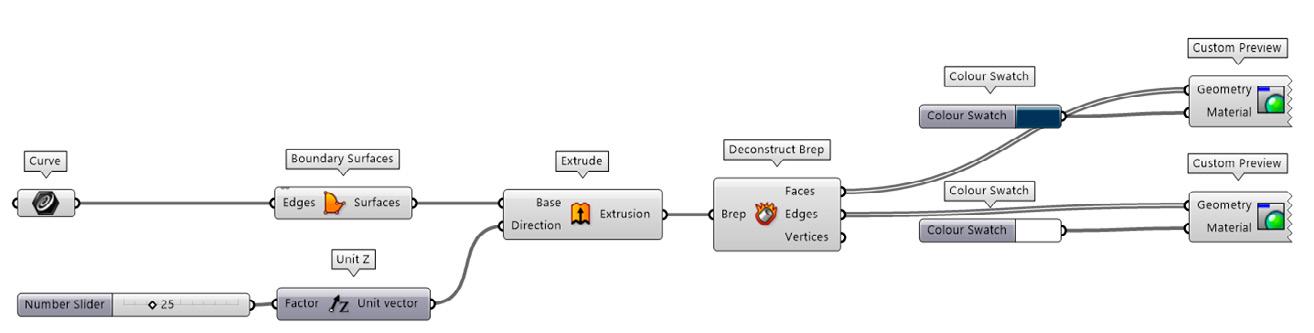
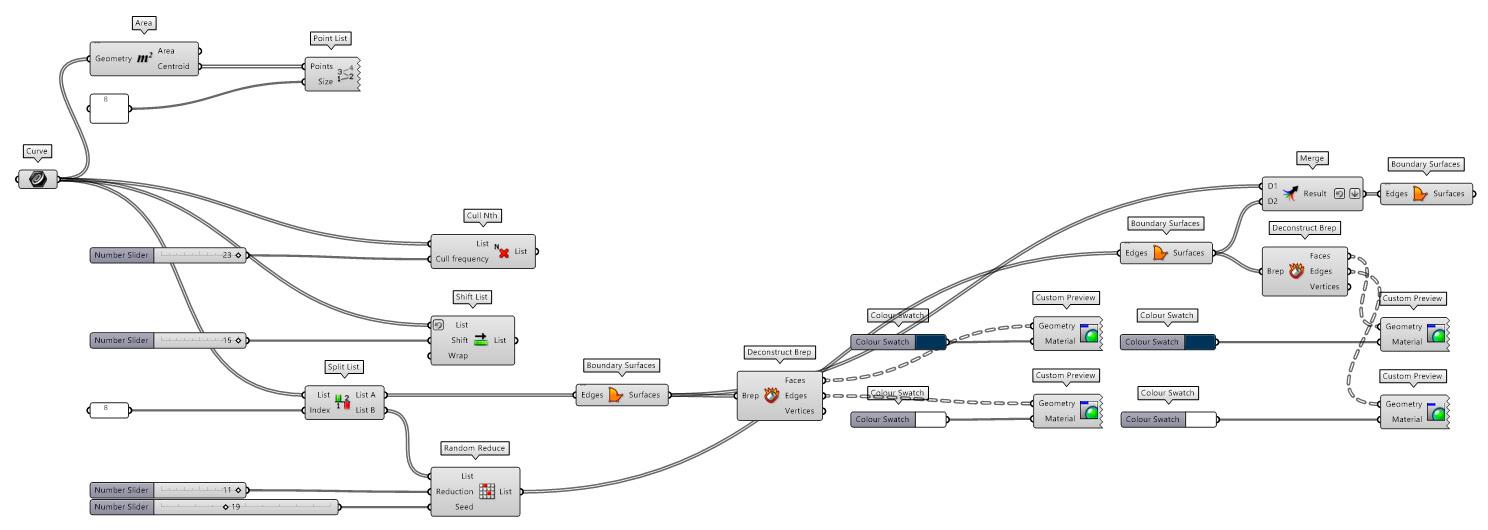
The idea is to use playful explorations as means to support the design thinking process and look at various possibilities before making design decisions
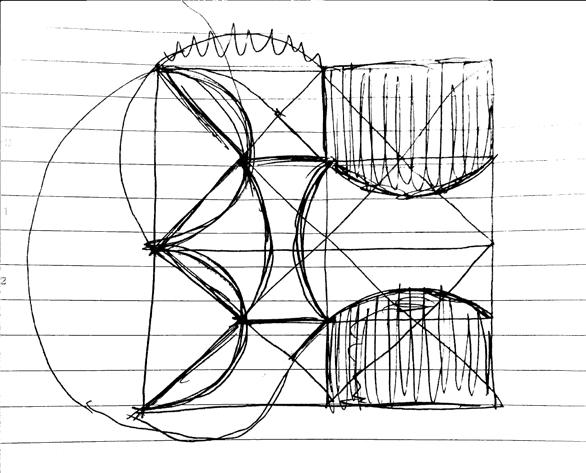
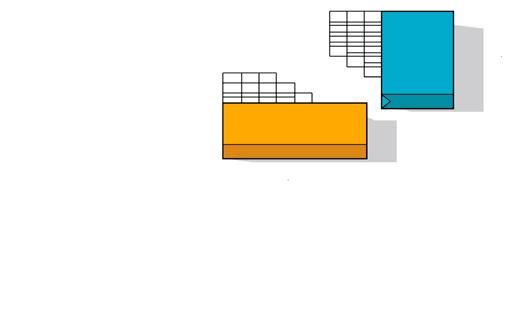
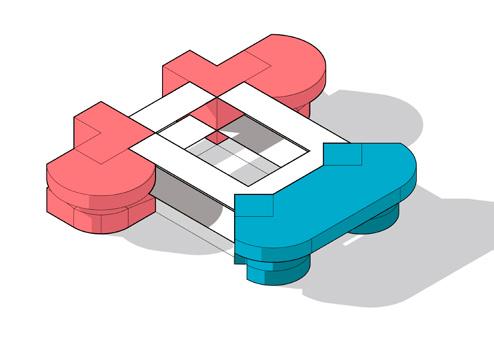
Blurring Boundaries at Intersections
Rectangular divisions formed when only the two adjacent zones share spaces between them, which can host various common multi-purpose activities such as recreation etc.
Connecting previous rectangular divisions highlight another layer which is a shared common space amongst all zones, and can be used to host exhibitions, performances etc. visible to all
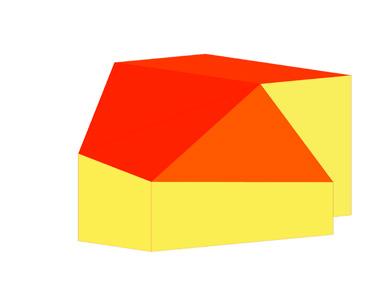
Space Classification
Classifying subdivisions further into enclosed solids (S) and open/enclosed voids (V) where solids incorporate specific uses and voids host majority flexible activities
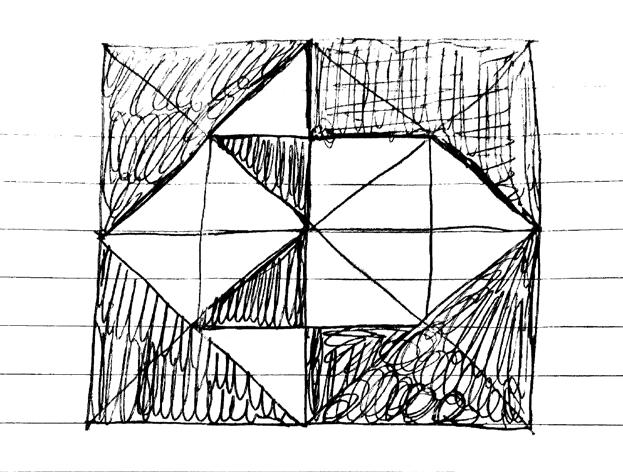
Quadrant Legend
Defining Space Uses at different subdivisions using a radial number legend, based on multilayered spatial characters discussed above
SPACE USE ZONING EVOLUTION I III II IV ENTRY 1 0 8 15 16 23 19 20 11 12 7 3 4 9 17 22 14 10 18 21 13 6 2 5 Retail Zone Office Zone Cultural Zone Misc. Zone A B C D 35
0. Commercial - S
1. Commercial - S
2. Retail - S
3. Retail - S
4. Handicrafts - S
5. Cultural Center - S
6. Planetarium - S
7. Library - S
8. Urban Plaza - V
15.
16.
17.
18.
19.
20.
21.
V
9. Recreation - V 10. Recreation - V 11. Concert Space - V 12. Concert Space - V 23.
13. Exhibition - V
14.
Exhibition - V
Urban Plaza - V
Urban Plaza - V
Urban Plaza - V
Urban Plaza - V
Urban Plaza -
V
Urban Plaza - V
Urban Plaza -
22.
Pharmacy - V
Misc. -
V
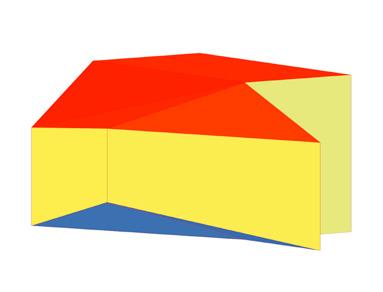
Central Public Space
All four zones connected through axial and diagonal pathways leading to formation of zonal quadrants with triangular spatial subdivisions depicting spaces in each zone
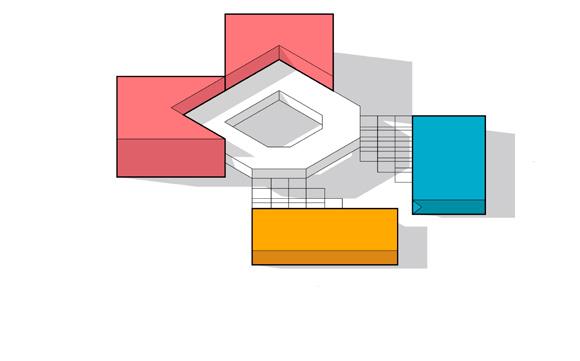
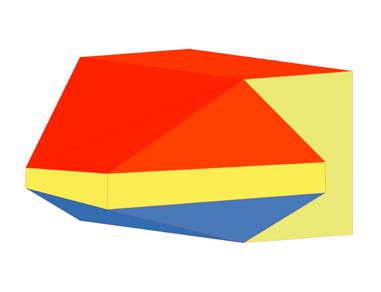
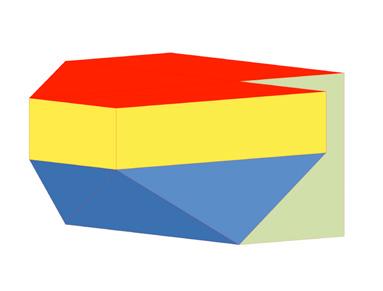
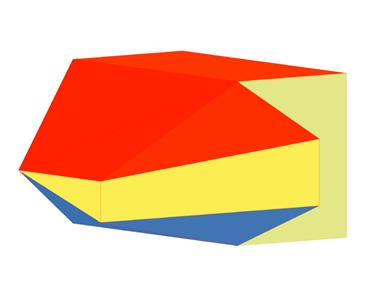
3D ITERATIONS AND SELECTION FOR FURTHER DESIGN DEVELOPMENT


Amongst all iterations, the chosen one incorporates a balance between open and enclosed spaces with relatively uniform distribution. Hence, it can facilitate better connectivity between all uses and reduce isolation and creation of stagnant spaces
 2D ITERATIONS
36
Static Solids and Enclosed Voids as dark space and Dynamic Open Voids as white space
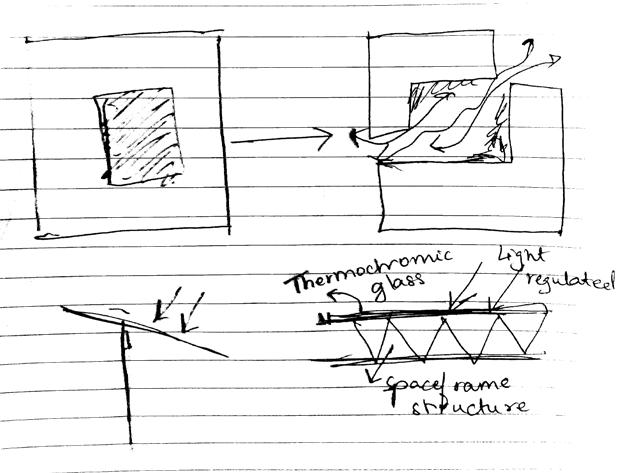
Climatic Considerations
The city has a moderate climate. It is pleasant throughout the year. To decrease solar heat gain, building's longer axis should be along the E-W axis. Central courtyards preferred that allow for crossventilation and cooling. Use of thermochromic glass that can regulate light and heat into the interiors for human comfort
Layering Over Selected Iteration
With the above climatic considerations into account, overlaying fluid and less sharp space boundaries
Resolving
Resolving curves and triangular edges to form a cohesive structure with a welcoming open space and crossconnectivity
1 3 5 2 4 6 7
37
EVOLVED SKETCH FOR FURTHER MASSING DEVELOPMENT
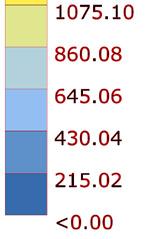
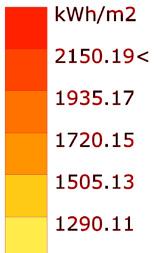
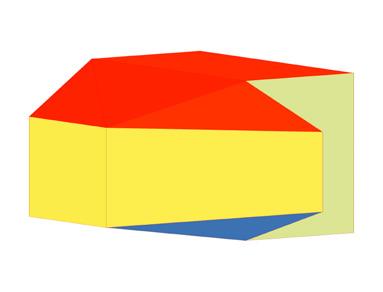
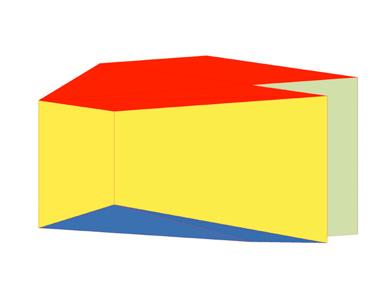
I. Evolutionary Form Optimization based on Incident Solar Radiation on Built Mass
Taking a block of the massing form of Office Zone, used different edges of the form as variables which change with respect to reducing solar heat gain on the mass, using ladybug tools and galapagos in grasshopper
II. Trade-off between efficient Internal Design and Solar Heat Gain Value
After running simulations, the most efficient form number 10 had issues with respect to internal spatial arrangement as it would waste a lot of functional space. Hence, resolved it further to create a balance between interior and exterior spaces with a slightly high solar heat gain value as a tradeoff solution
III. With lessons learnt, similar Form Optimization Ideology followed for deriving rest of the blocks of all zones
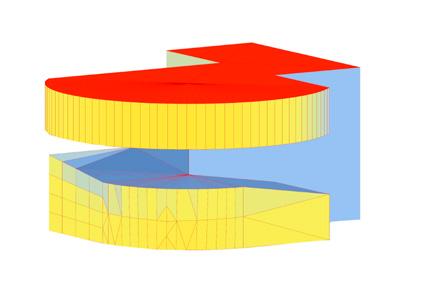
MASSING EVOLUTION
Creating a 3D Massing form of the previously evolved sketch in which the central space is opened up further for better cross-ventilation and positioning
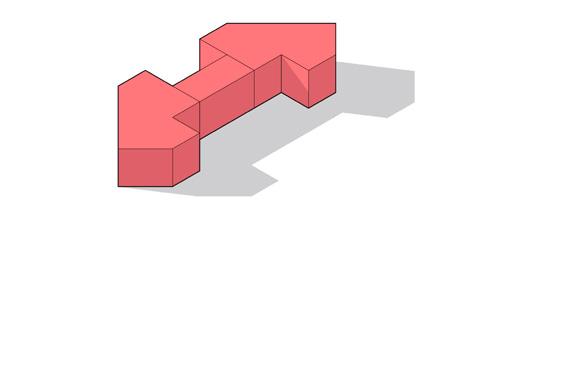
Office Zone: Chamfering sharp edges which may otherwise waste functional internal spaces. Using form finalized after optimization simulations to reduce solar heat gain and keep the spaces cool and comfortable
Retail Zone: Merging Cultural and Retail Zones together to create a welcoming shading structure as well as for better internal functional use
Connecting all the zones together through bridge spaces at different levels which also cumulatively act as the Central Public Space for conducting multiple activities and for facilitating people engagement from all zones
1 A C E B D G F 2 3 4 5 6 7 8 9 10 Retail Zone Office Zone Cultural Zone 38
Using Firefly and Grasshopper, an image of Powada Dance Posture, a famous folk dance of Maharashtra, is converted into a 3D Depth Mesh which is then transformed into a system of points. This information is transfered into a paneling system with the points represented by cylindrical lit-up tubes fixed perpendicular to a backdrop surface panel. The tubes are made of PET sheets.


Sit-outs made underneath bamboo structures
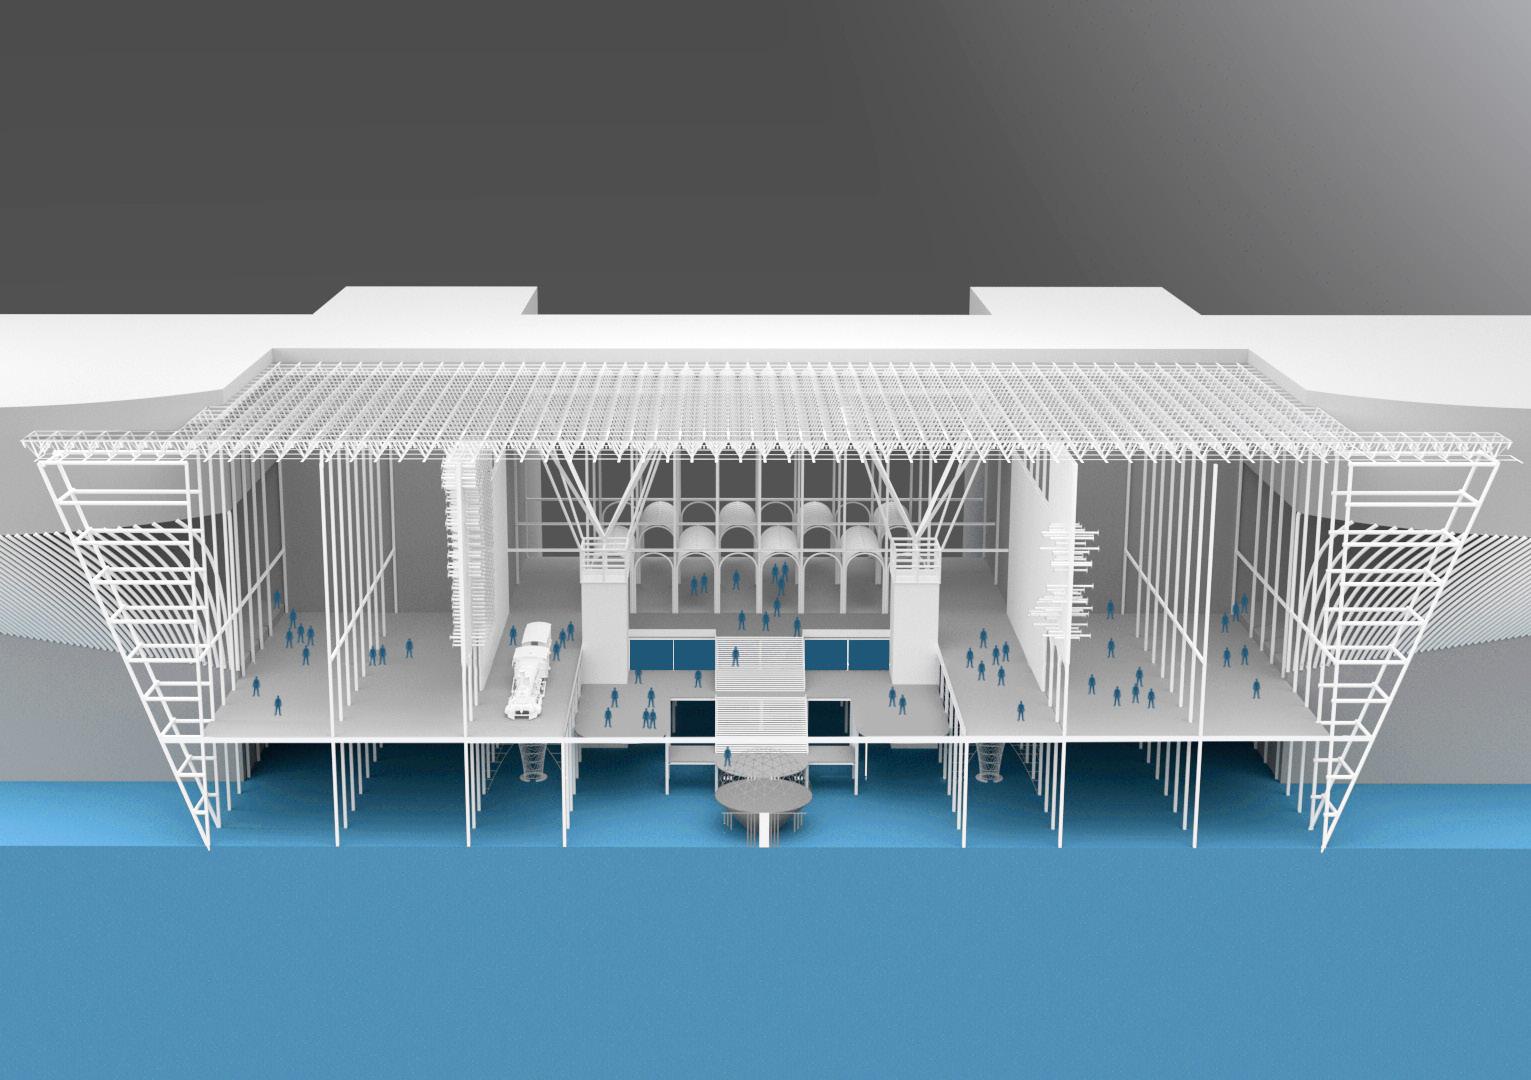
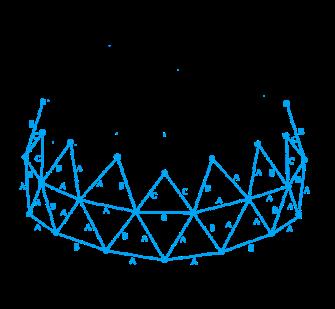
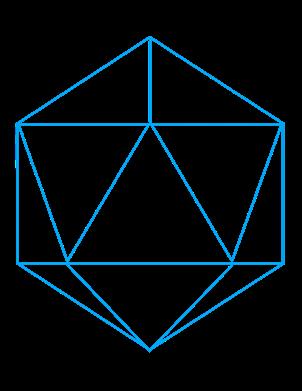
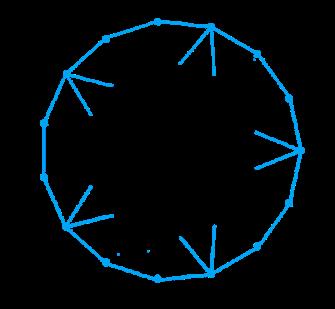
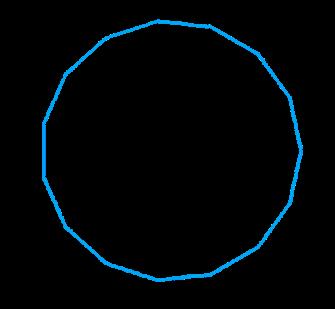
Central Stage which can be used for performance gatherings covered with a Geodesic Dome framework made of steel tubes. A regular Icosahedon has been used as the Base Polyhedron, which was further subdivided into triangles based on 3V frequency to create this geodesic structure. The experimentation with different frequencies was carried out in Geodesica. The assembling process given below:-

1
The Central Public Space can host a variety of activities such as exhibitions, concerts, performances, events, festivals etc. occurring at the same time or during different times or days. Due to abundance of steel industries, intention of highlighting local craftwork and for encouraging recycling of massive plastic waste produced in the city, materials used in this space are steel, bamboo and recycled plastic (PET) sheets
2 5
3 6 Visual interconnectivity between different levels


39
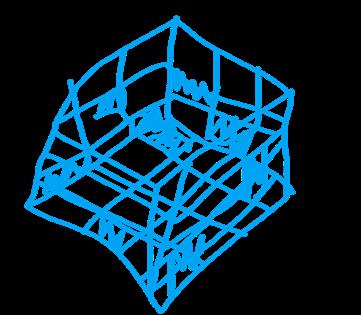
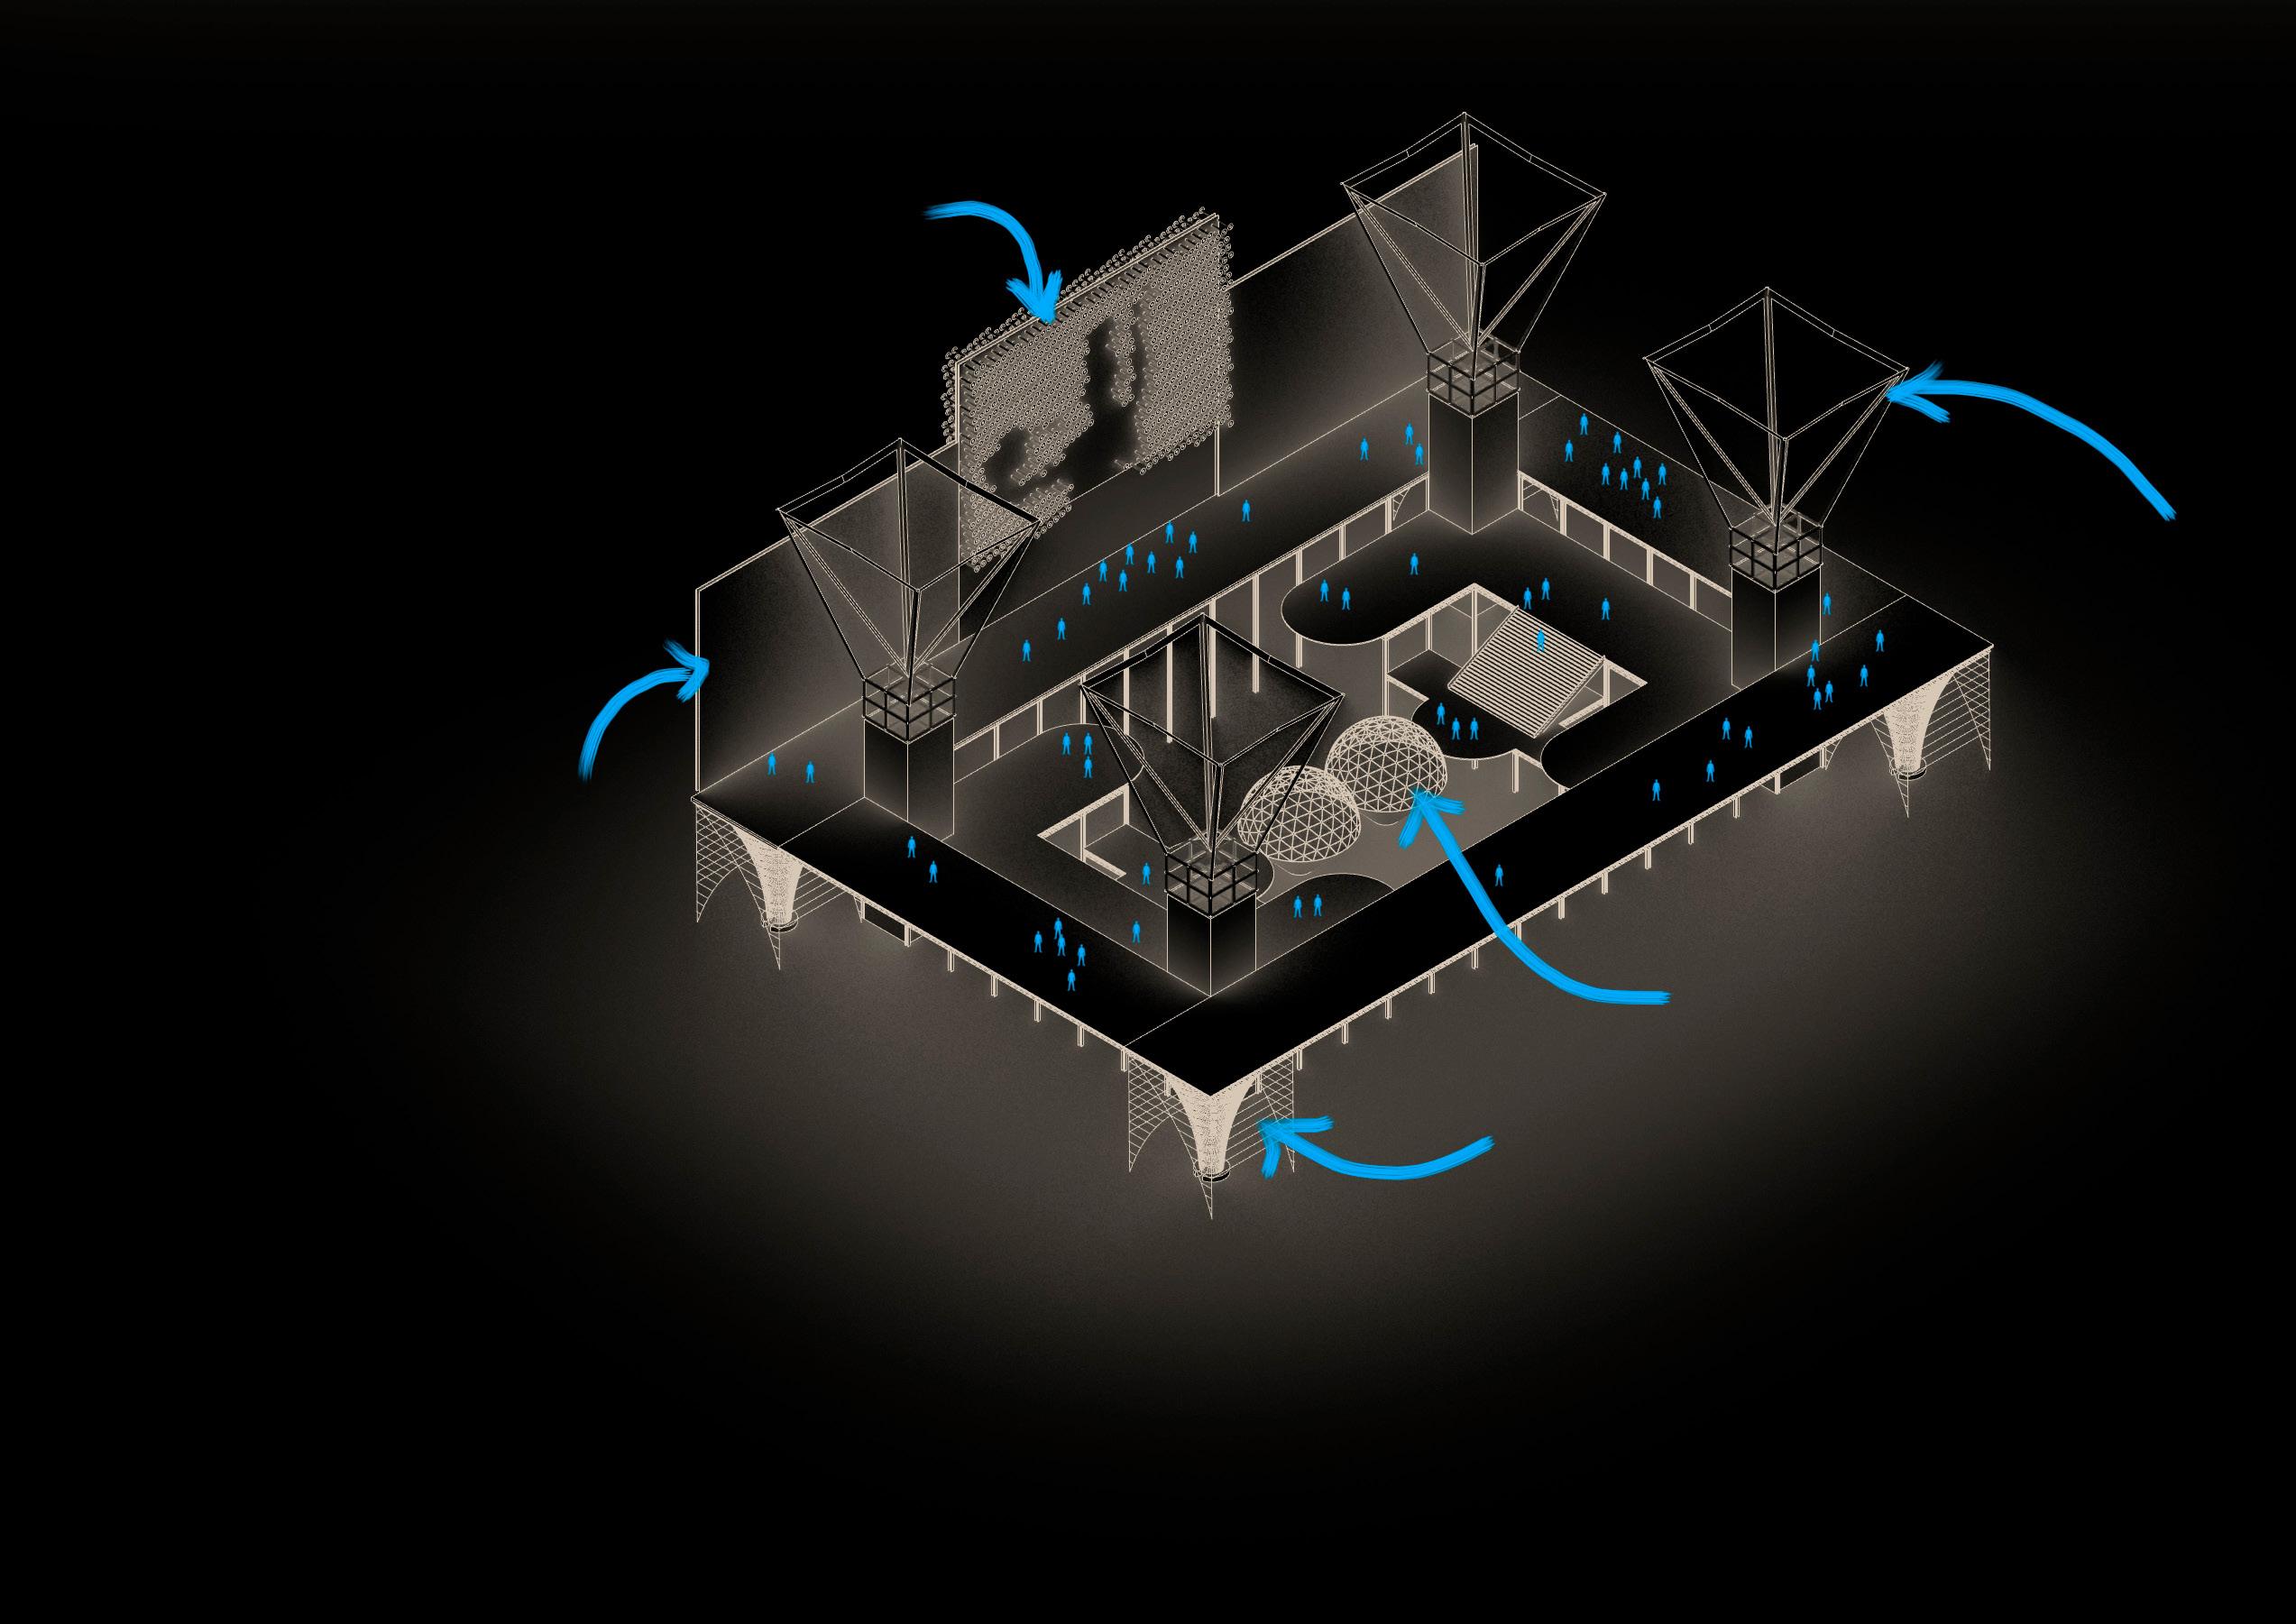 A cuboid framework of steel I section beams and columns
Stepped levels for directing gaze at the centre which has the main stage
Steel Support for Spaceframe Structure above
Wooden Panels
A cuboid framework of steel I section beams and columns
Stepped levels for directing gaze at the centre which has the main stage
Steel Support for Spaceframe Structure above
Wooden Panels
4
Central Public Space
Confidential Workplace Design Project
Human-Centered Professional Research
Bangalore, India
March - May, 2020
Experience Design Analysis Consulting - Gensler, Office Work Team of 3 People
Role: As an Experience Design Strategist, worked with Data Analyst Dhiraj Kumar to collect user data on case study sites, and computed solutions for the new office spatial plans
Supervisor: Shravan Bendapudi, Principal, Studio Director, Consulting & Real Estate Services Leader, Shravan_Bendapudi@gensler.com
Aim: To collect user behavior data via empirical research methodology to inform experiential and spatial design decisions and generate options
Summary: The global MNC client wanted to set-up a new office branch in India, but he was unsure of the Indian work culture and lifestyle. He had previously set-up two Indian branches, which were designed based on the global spatial guidelines and lifestyles but, there were issues over the years. We were asked to use the two Indian branches as site case studies and map quantitatively and qualitatively the experience and behavioral pattern of employees. Based on the results, we computed and generated customized spatial planning and stacking options which were given to interior architects, for translation into physical design for the new office
Keywords: User-Oriented Design, Empirical Research Methodology, Behavioral Heat Mapping, Generative Stacking, Customization
Softwares Used: Excel, Qualtrics Survey,Tableau, Gensler TUS App, Gensler Stacking Tool, AutoCAD, Sketchup, Photoshop, Illustrator, Indesign
40
RESEARCH METHODOLOGY
8 People
LEADERSHIP INTERVIEWS
Interviews with key talent and thought leaders were conducted to better understand how their teams work, what their primary business drivers are, and what they envision for the future
685 Respondents
WORKPLACE SURVEY
Surveys were conducted and analyzed to provide further insights about the employees’ opinions and suggestions
2900+ Route Stops
TIME/SPACE UTILIZATION STUDY
We gathered space usage data at a selection of stops/data points in the workplace. The resulting thousands of data points were then analyzed, revealing how often spaces were utilized
100+ Dots
POP-UP RESEARCH
Interactive pop-up stands were put up near busy cafeterias to gather feedback and ideas from the employee population about their workplace

5 Groups
FOCUS GROUPS
Small interactive group sessions were held at business unit level to help understand ways of working and common workspace pain points and needs
1. The study was carried out for 3 months, excluding the 1st day for the installation and test run. We observed and recorded the utilization data across the office facilities from 9 am to 7 pm in general
2. For a better understanding of 24X7 teams utilization pattern, the study time was extended to 2 am of the next morning on several routes
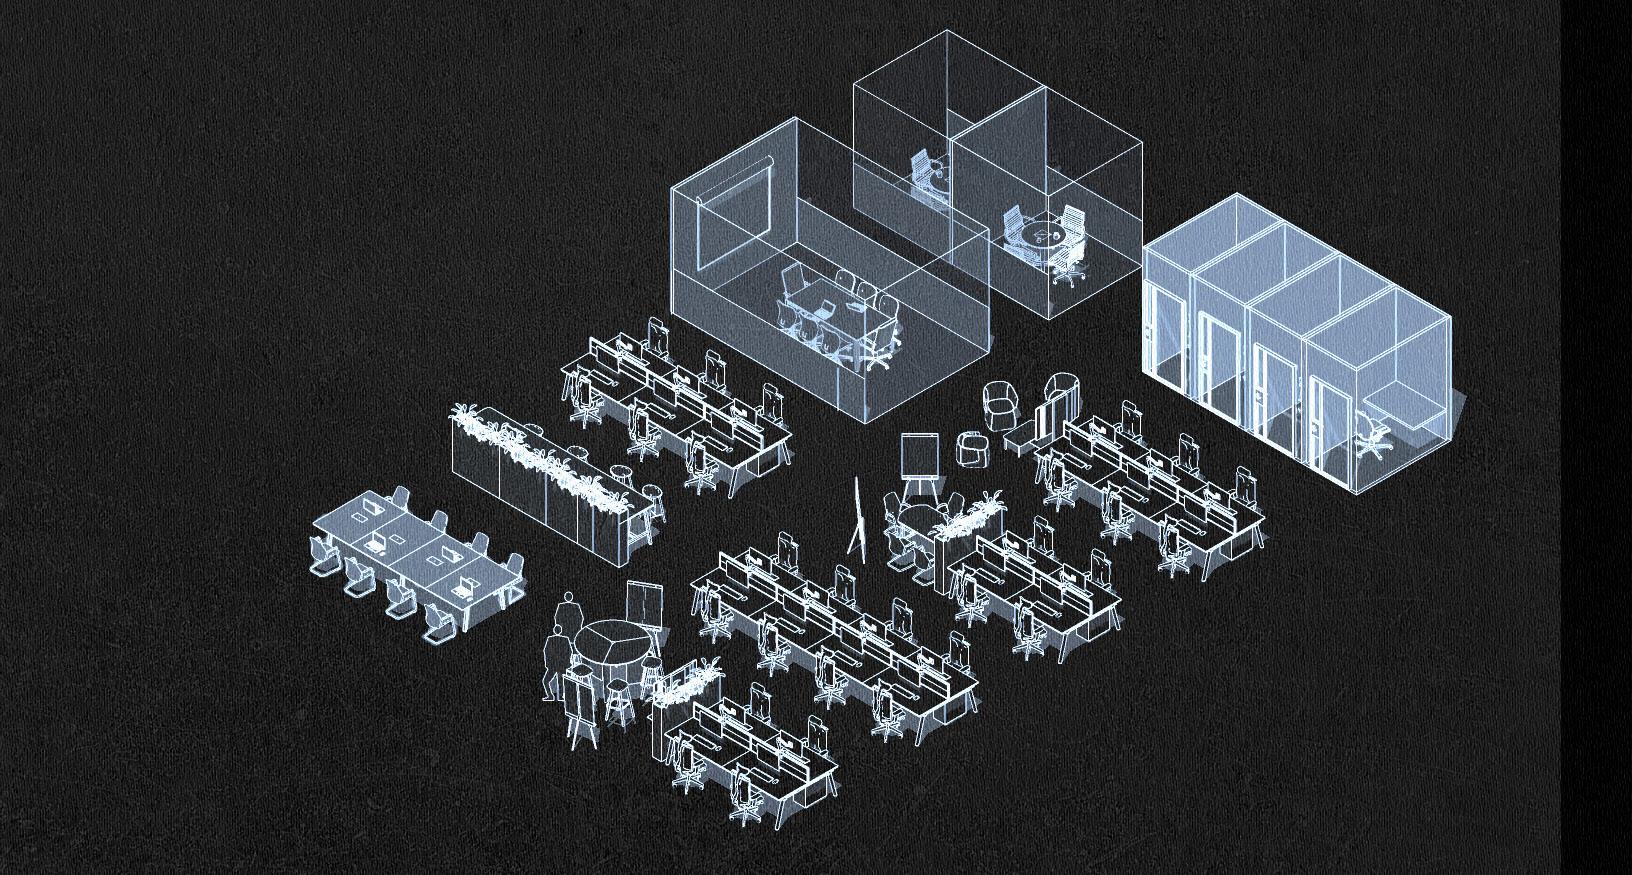
3. Observed spaces include all the spaces of a typical work-floor - Workstations, Private offices/cabins, Focus rooms, Enclosed meeting rooms, Open collab spaces, Phone rooms, Touch-down spaces and Floor cafe/break-out areas
4. We recorded the number of people and activity happening at each 2900+ marked spaces points (Route Stops)
41
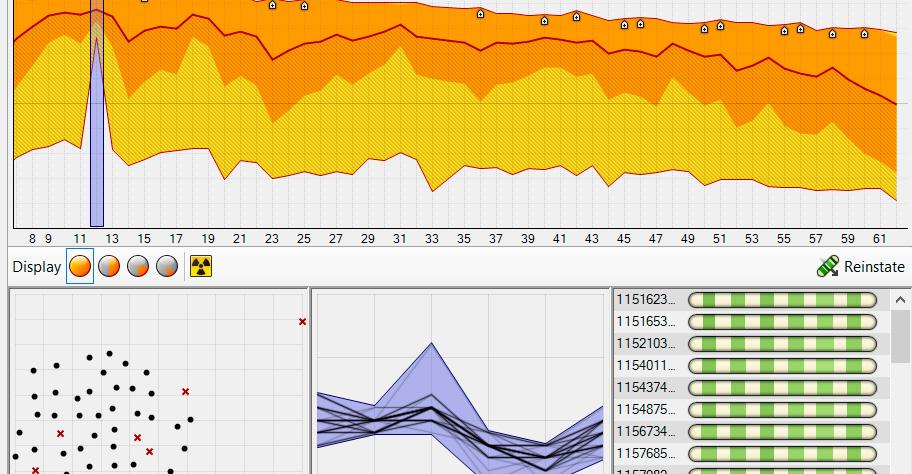
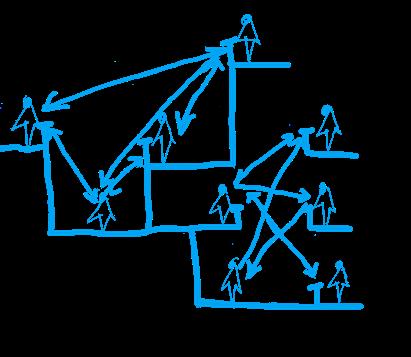
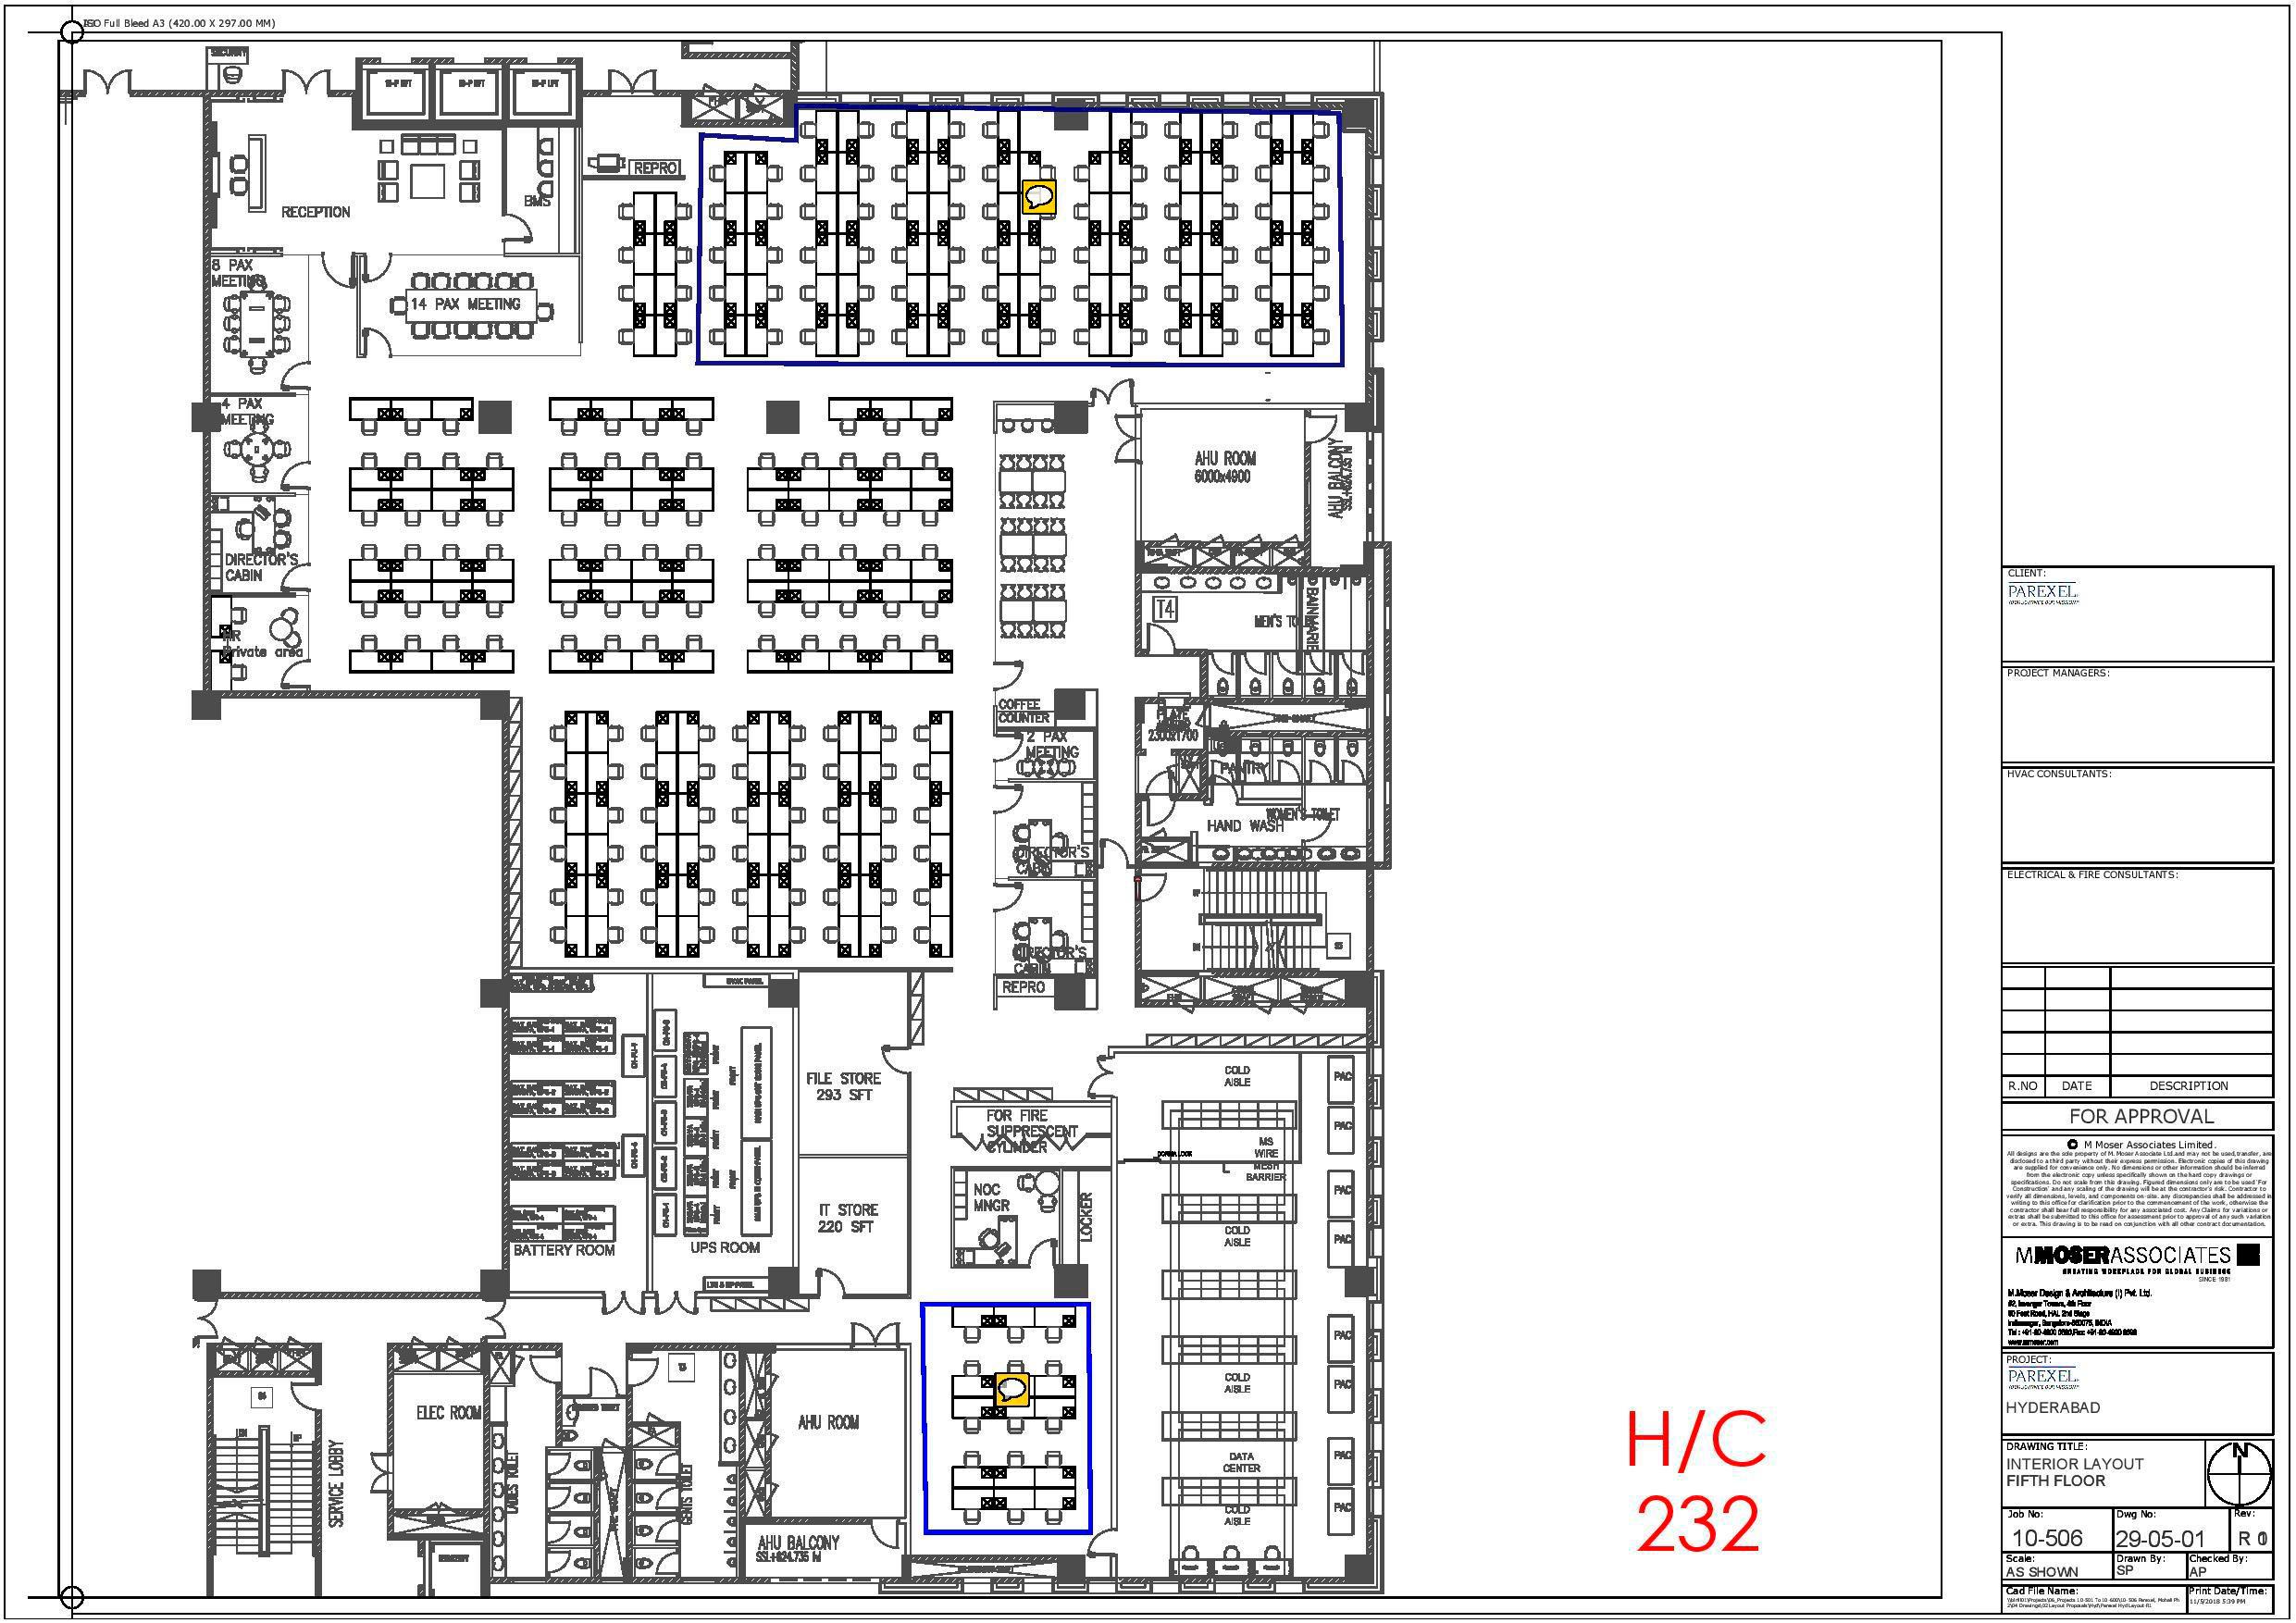
BEHAVIORAL HEAT MAP GENERATION AND ANALYSIS
• Floor-wise blueprints of case study sites were taken to first map the journey of observer by allocating route stops such as N-1 to N-30 etc.
• The route stops nomenclature was then fed into the TUS App
• Any activity happening at those stops was recorded in the form of questions on the app that gets stored in an Excel Database and charts are generated

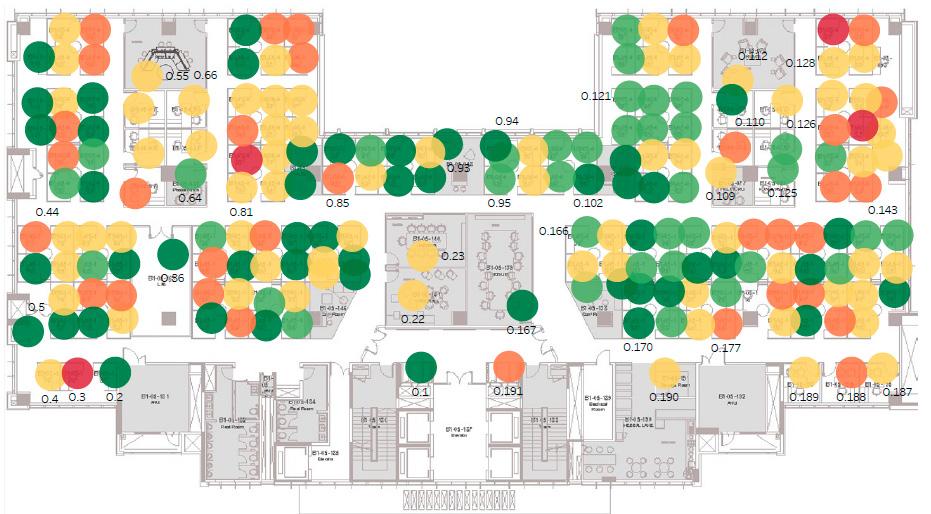
IMPORTING INFORMATION INTO TABLEAU
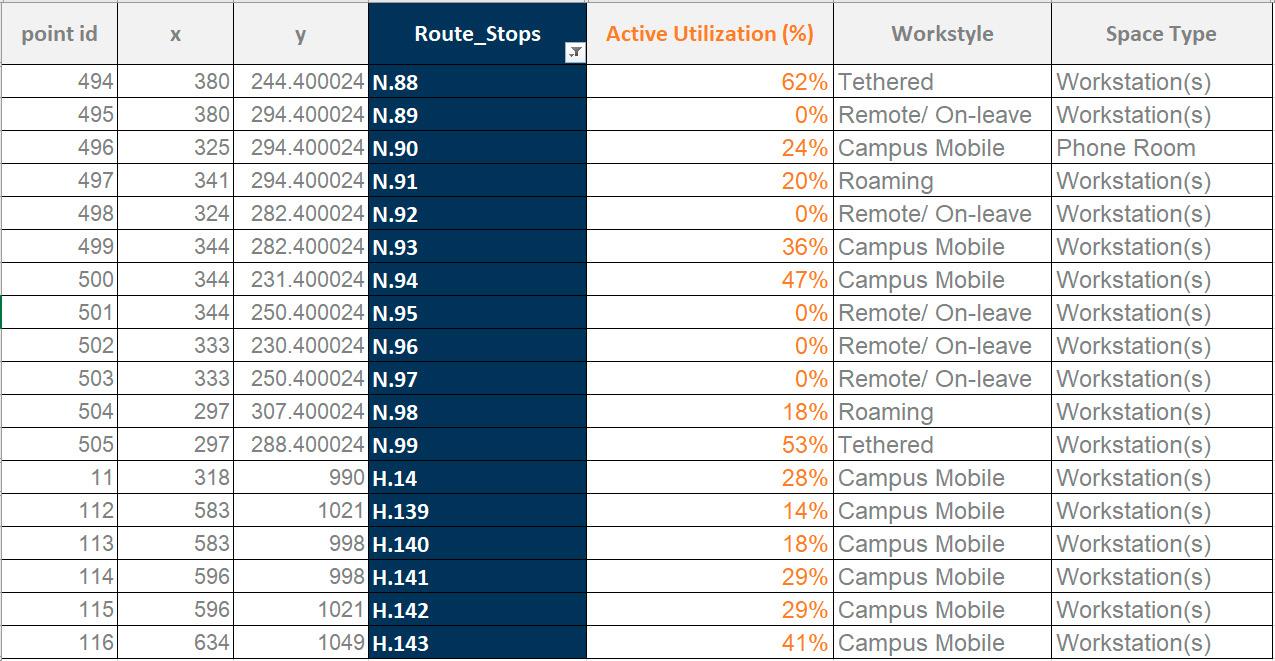
• Using Tableau Drawing Tool, the route stops were given exact x,y coordinates on the floor plans
• It was combined and correlated with the Excel Database containing activities occurring at those stops
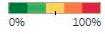
• A color legend was created to display active space utilization in the generated heat maps
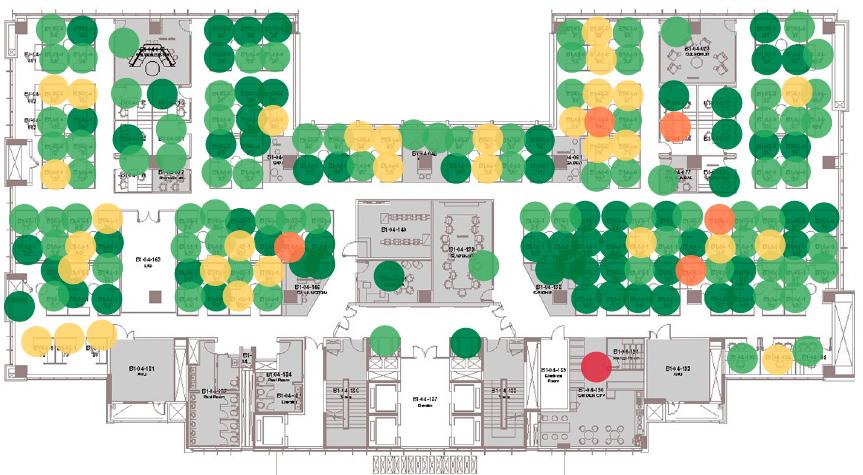
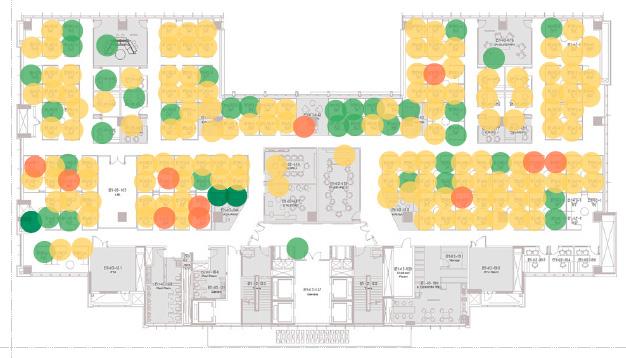
USER BEHAVIOR HEAT MAPS - IMPLICATIONS
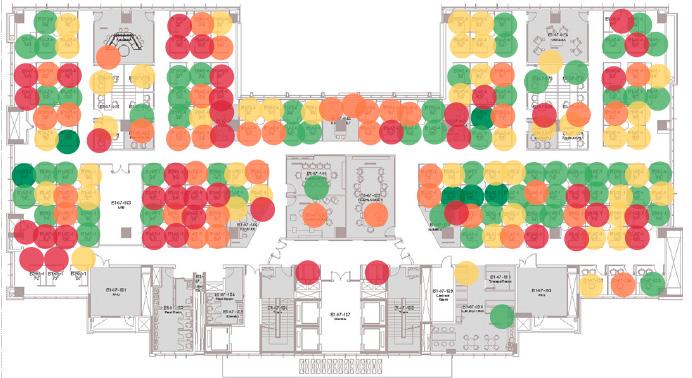
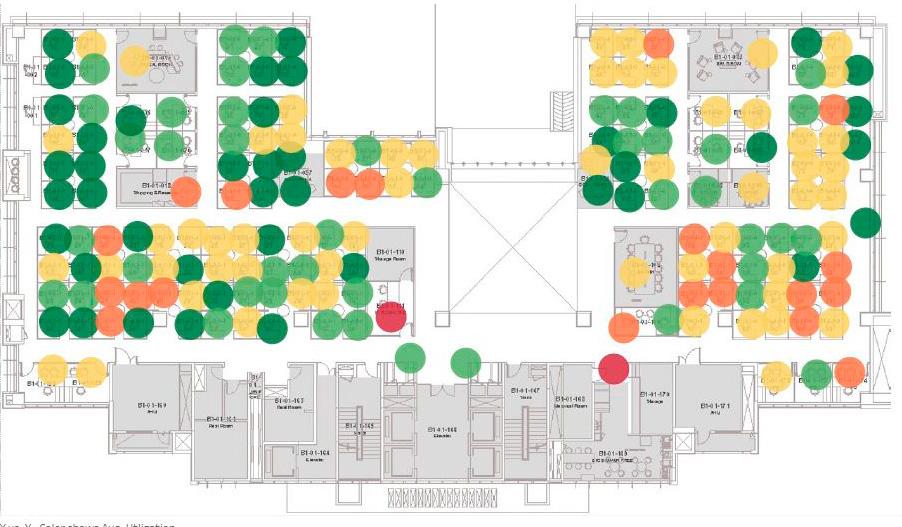
1. Focus Space to Collab Space Utilization Ratio - 60:40. Fairly large amount of individual focus spaces and meeting rooms were highly utilized

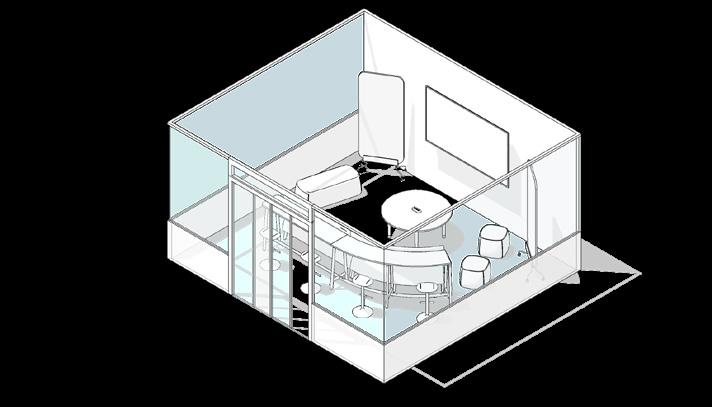
2. Meeting Spaces, open collaboration areas with informal/variety of seats were clear favorite amongst employees
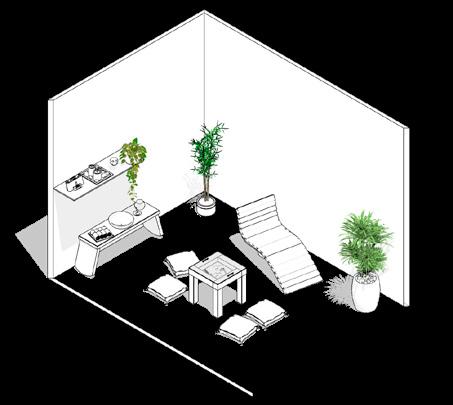
3. Pantry/breakout spaces were amongst highest utilized spaces, which indicated inclination towards desire of more choice and variety of social and recharge spaces
A125 A126 A136 A135 A134 A133 A132 A131 A130 A129 A137 A138 A154 A153 A155 A156 A157 A158 A152 A151 A139 A140 A143 A144 A148 A147 N1 N2 A141 A142 A150 A149 A159 A160 A127 A128 A145 A146 N3 N4 N5 N6 N7 N8 N9 N10 N11 N12 N13 N14 N15 N16 N43 N17 N42 N19 N41 N20 N40 N21 N39 N22 N38 N23 N37 N24 N36 N25 N35 N26 N34 N27 N33 N28 N32 N29 N31 N30 N69 N44 N68 N45 N67 N46 N66 N47 N65 N48 N64 N49 N63 N50 N62 N51 N61 N52 N60 N53 N59 N54 N58 N55 N57 N56 N70 N71 N72 N73 N74 N75 N76 N77 N78 N79 N80 N84 N81 N82 N83 N85 N86 N87
Data Point Allocation and Route Mapping Gensler TUS App Excel Database Tableau Drawing Utility Tool Import
CSV Files in Tableau
DATA POINT ALLOCATION
and Combine
Generate in Tableau and Export
1st
4th
7th
3rd
5th
Floor, Site 1
Floor, Site 1
Floor, Site 1
Floor, Site 1
Floor, Site 1
Avg. Utilization Avg. Utilization Avg. Utilization Avg. Utilization Avg. Utilization N N N N N 1 2 3 4 5 42
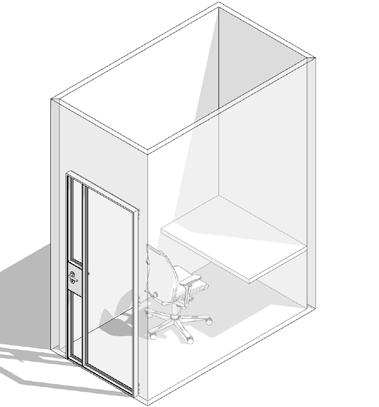
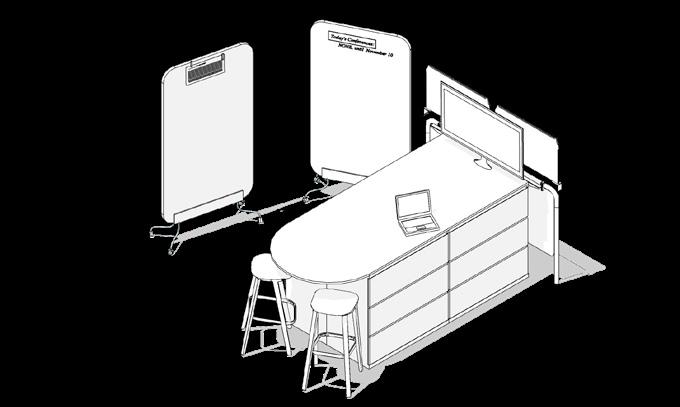
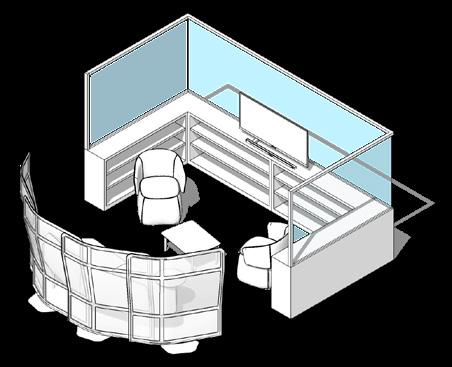
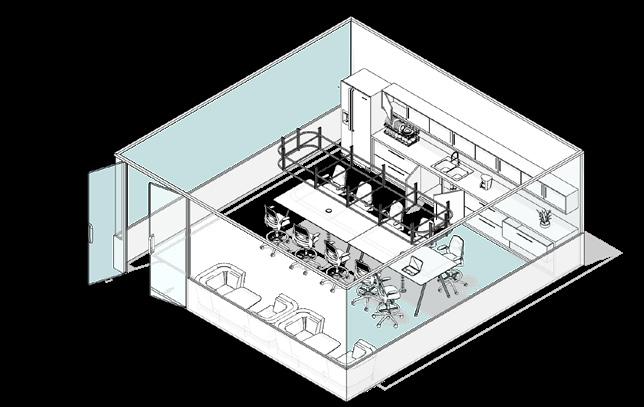
FORMULATION OF USER MODES AND PROFILES CUSTOMIZED SPATIAL KIT
Based on the study results and analysis, 5 major work behavior modes were identified as follows:-
Based on identified user spatial needs, a kit of customized work spaces was prepared:-
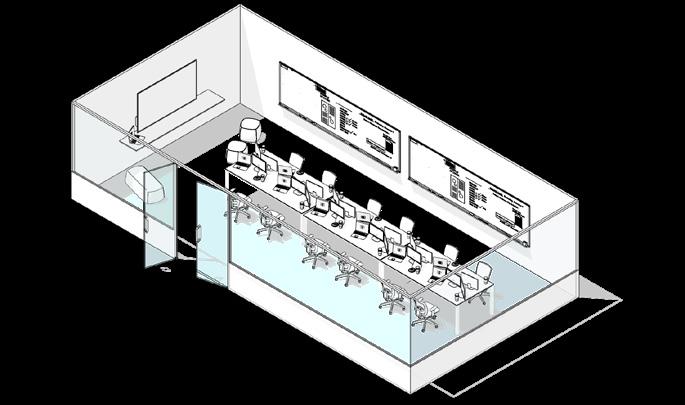
(40%) USER PROFILE 1 - Builder
Crafts experiences, explores ideas through physical or digital means. Key needs include:-
• Availability of meeting rooms
• Availability of prototyping and scrum space
• Flexible furnitures and settings of meeting rooms to foster design and creativity
• Focus rooms
(35%) USER PROFILE 2 - Enabler
Supports the business with various tasks. Key needs include:-
• Convenient spaces to collaborate and have ad-hoc, in-person meetings frequently
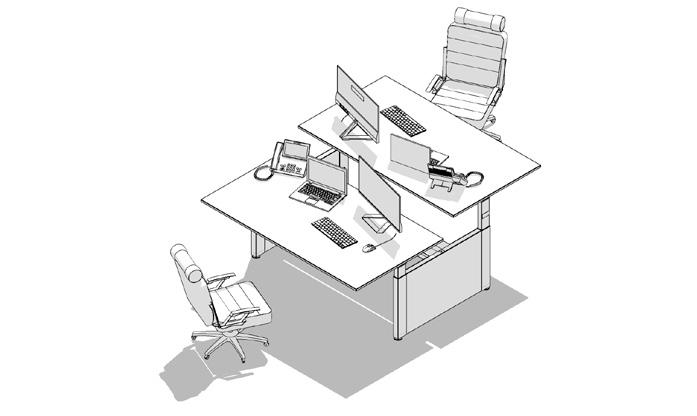
• Height adjustable desks to support wellbeing
(25%) USER PROFILE 3 - Customer Facing
An ambassador to customers representing the brand and product. Key needs include:-
• Spaces to support individual quiet and privacy
• Collaborative tools and technology to interact with clients
• Improved cafeteria and shared amenities’ experience
• Provision for dual monitors ( >2 on need basis)
TYPICAL DAY USER ACTIVITY JOURNEY Early Morning Shift Late Night Shift - US Timings
FOCUS Individual general / task work COLLAB Planned or impromptu gatherings for work related discussions SOCIAL Eating and socializing LEARNING Workshops and training sessions REJUVENATE Fitness and relaxation Open Analogue Informal Buzz Open Analogue Informal Buzz Open Analogue Informal Buzz Open Analogue Informal Buzz Open Analogue Informal Buzz Open Analogue Informal Buzz Open Analogue Informal Buzz Open Analogue Informal Buzz Enclosed Digital Formal Quiet Enclosed Digital Formal Quiet Enclosed Digital Formal Quiet Enclosed Digital Formal Quiet Enclosed Digital Formal Quiet Enclosed Digital Formal Quiet Enclosed Digital Formal Quiet Enclosed Digital Formal Quiet 43 In US In India 7:30 A.M. 8 A.M. 9 A.M. 10 A.M. 11 A.M. 12 P.M. 1 P.M. 2 P.M. 3 P.M. 4 P.M. 5 P.M. 6 P.M. 7 P.M. >8 P.M. Check emails + Heads down work Check emails + Heads down work 1-1 Discussions Heads down work + Coffee break Recreation Leave for home Leave for home Leave for home Virtual meeting Calls Learning Small team meetings Heads down work Heads down work Heads down work Team Collab Virtual meetings Lunch Arrival Arrival Arrival Scrum Meets Brainstorming session + Research Development + Heads down work Research Development + Prototyping + Collaboration + VC Calls Heads down work + Gym Ad-Hoc Meetings + Coffee Break Lunch Time
After the previously mentioned steps and referring to client company global space guidelines and program brief, a tentative space program with area allocation was formulated. The pie chart below shows the program spaces split between ME and WE spaces in the ratio 60:40, as concluded from previous studies.
• ME Space: Spaces for individual work
• WE Space: Spaces for discussion, collaboration, socialization and relaxation
SPACE PROGRAM SPACE
Different spaces were laid out in arrangement, based on certain proximity logics derived from previous studies.
SPACES
Clustered on the same floor
and split across multiple floors
floors
PROXIMITY LOGICS APPLIED
Adjacent Adjacent Separate
Distributed
LAID OUT
ZONING
TEAM 1 TEAM 2 TEAM 5 TEAM 3 TEAM 4 A5 A5 A1 A1 CR CR A2 A2 HC HC A3 A3 GY GY A4 A4 RE RE TEAMS INFORMATION TEAM 1: Support TEAM 2: Admin TEAM 3: Sales and Marketing TEAM 4: Cloud Tech TEAM 5: Finance Planning
44
1 2 3
Wellness | 0.7% 4,430 sq.ft. Recreation (Active Cafe) | 0.5% 2,850 sq.ft. Individual Workspaces | 38.4% 236,280 sq.ft. Hiring Center | 0.8% 5,180 sq.ft. Support Spaces | 4.2% 25,784 sq.ft. A1 A2 A3 A4 A5 CR HC
Work Cafe + Coffee Shop | 4.7% 29,119 sq.ft. Open & Closed Collab | 9.4% 58,085 sq.ft. Gym | 1.1% 7,026 sq.ft. Cafeteria | 7.4% 45,279 sq.ft. Internal Circulation | 22.3% 137,233 sq.ft. Creche | 0.3% 1,855 sq.ft. Reception & Experience Center | 0.5% 3,200 sq.ft. Training + Business Center | 3.1% 19,205 sq.ft. Internal Circulation | 6.7% 41,298 sq.ft. ME WE 60% 40%
ME WE
GY RE
GENERATIVE STACKING
Based on the zoning logics formulated previously, it was fed into a 3-part datasheet with prompts and relations between different spaces specified. It was then uploaded into the Gensler Stacking Tool to run and generate various iterations and options.
Option 1
DATASET PART 1: Specifying teams, spaces along with their head-counts and areas with the option of being splittable across multiple floors
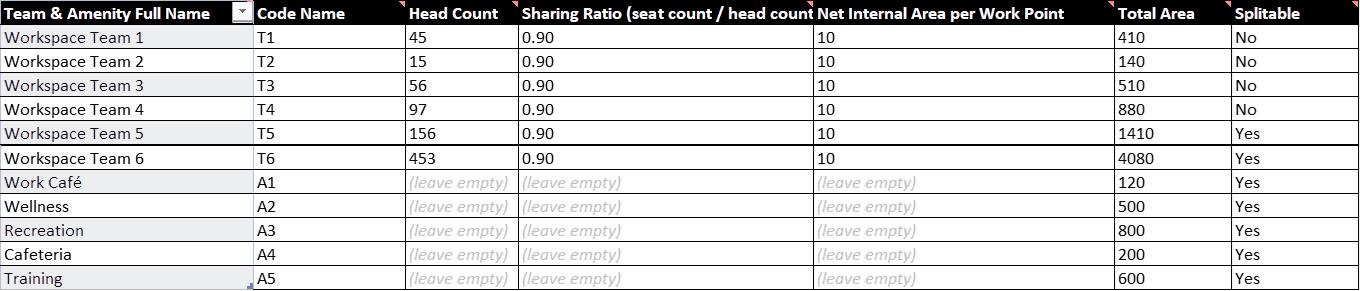


Teams Amenity 3 - A3 Recreation Amenity 1 - A1 - Work Cafe Amenity 4 - A4 Cafeteria Amenity 2 - A2 - Wellness Amenity 5 - A5 Training

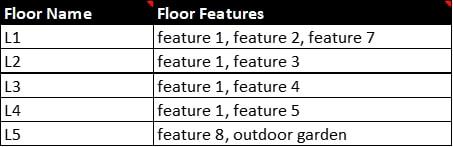
DATASET PART 2: Specifying number of floors (Only iterating those floors where the spaces are distributable) and adding various features such as outdoor garden, open space, refuge area, good daylight etc.
Option 2
DATASET PART 3: Connecting teams and amenities together through conditions and defined priorities
Option 3

1 2 3 45
FINALIZED STACKING DIAGRAM AFTER VARIOUS ITERATIONS
This stacking diagram depicts an area wise vertical split of amenities provided throughout the building. The amenities were categorized into:-
• Hubs - Amenities distributed on all work-floors
• Destinations - Amenities for the entire building concentrated on single floors
• Other required amenities provided on Lower Ground & Ground Floor
NEXT STEPS
The fully compiled report of studies, calculations, vertical stacking and horizontal zoning options was given to the interior design and architecture team, along with a design checklist to provide a foundation to start off the concept and design iterations.
0 10,000 20,000 30,000 40,000 50,000 60,000 70,000 Sq.ft. 0 LGF 1 2 3 4 5 6 7 8 9 56,515 Sq.ft. 54,563 Sq.ft. 4,624 Sq.ft. 7,120 Sq.ft. Parking + Other Services 770 HC 1006 HC 1006 HC 867 HC 1006 HC 1006 HC 796 HC 805 HC 64,549 Sq.ft. 64,549 Sq.ft. 64,549 Sq.ft. 58,335 Sq.ft. 64,549 Sq.ft. 64,549 Sq.ft. 55,341 Sq.ft. 55,626 Sq.ft. Total Carpet Area : 614,876 Sq.ft. Total: 7729 HC M Cafeteria + Kitchen + BOH + Lunchroom Gym Hiring Training + Business Center 467 HC Refuge Terrace Legend Individual Workspaces + Collab Spaces + Support Cafeteria Work Cafe + Coffee Shop on GF Hubs Destinations Other Amenities Hiring Center Creche Recreation (Active Cafe) Reception & Experience Center Gym Training + Business Center Wellness
46
Digital Tools
47
Form Sketcher 2D
Precise 3D Model from 2D Shape Sketch
Online October, 2021
Part 1 of a 3-Part Hackathon Project 7 Member Overall Team Form Sketcher 2D - Part 1 Team - 3 Members
Mentions: 1st Prize, Computational Design Method Hackathon, HMC Architects, LA, CA, US, 2021
Role: Designed and developed the form sketcher work-flow and tool as part 1 of 3 part project at the hackathon. Part 2 and 3 were developed by other team members. Brainstorming and execution done with team leader Mayur Mistry, and co-team member Richa Gupta
Aim: To provide flexibility and inclusivity to any age designers to create in their own style, by easily incorporating technology into their work-flow, instead of thinking of it as a hindrance to their thoughts
Summary:
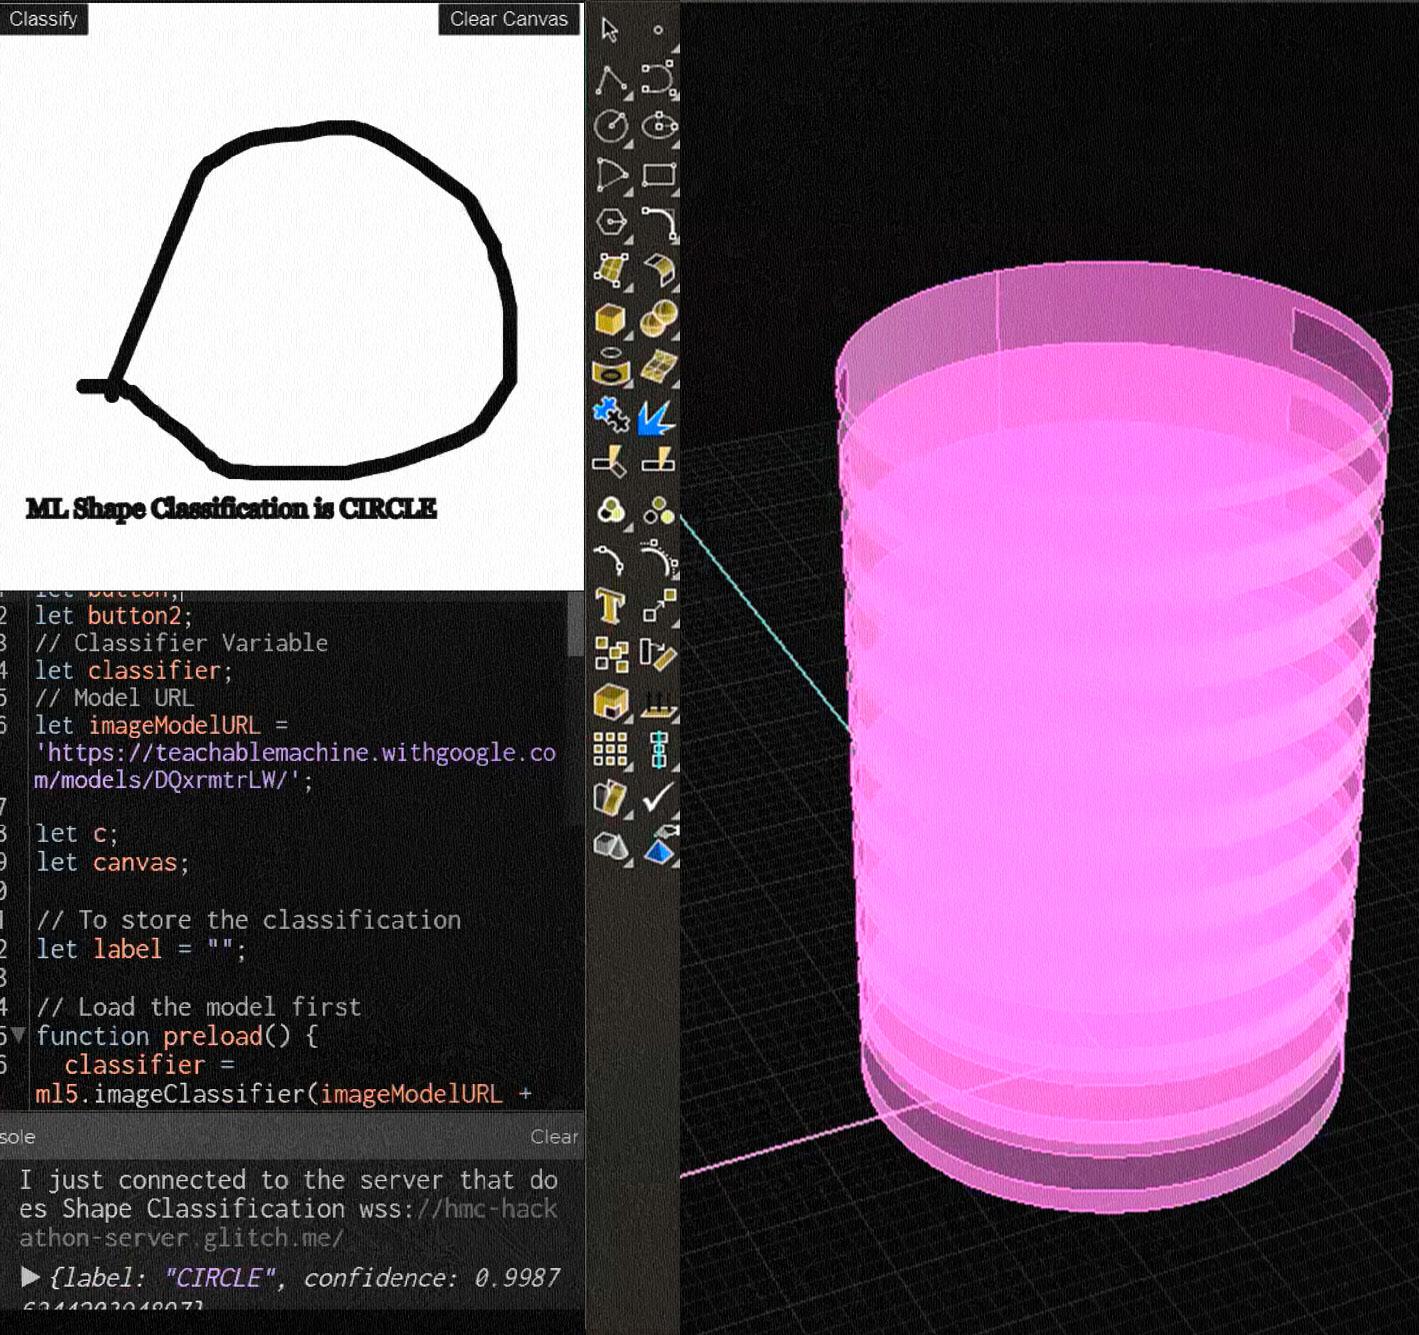
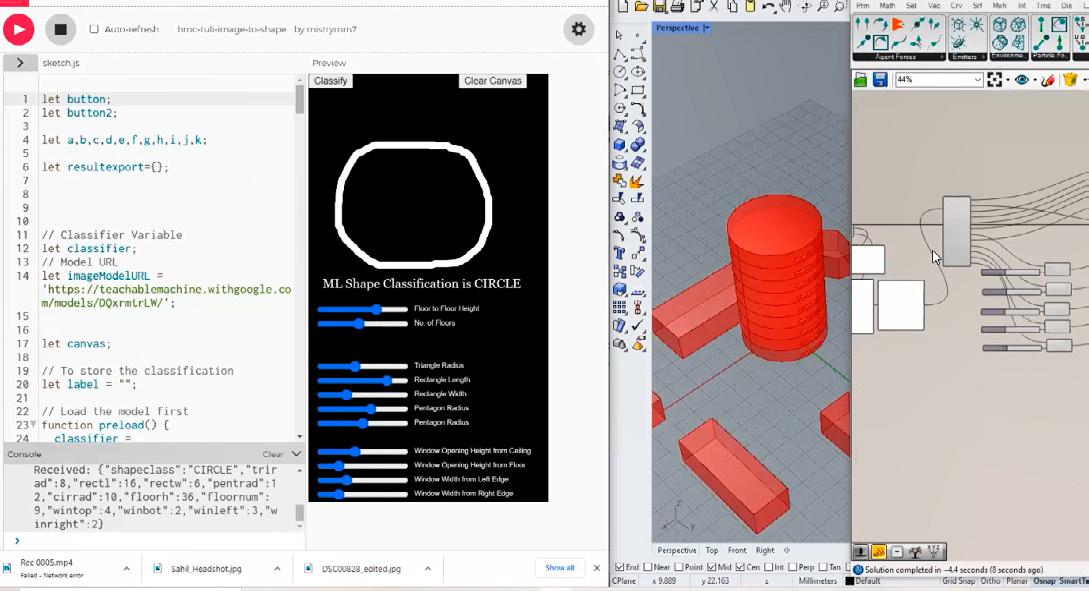
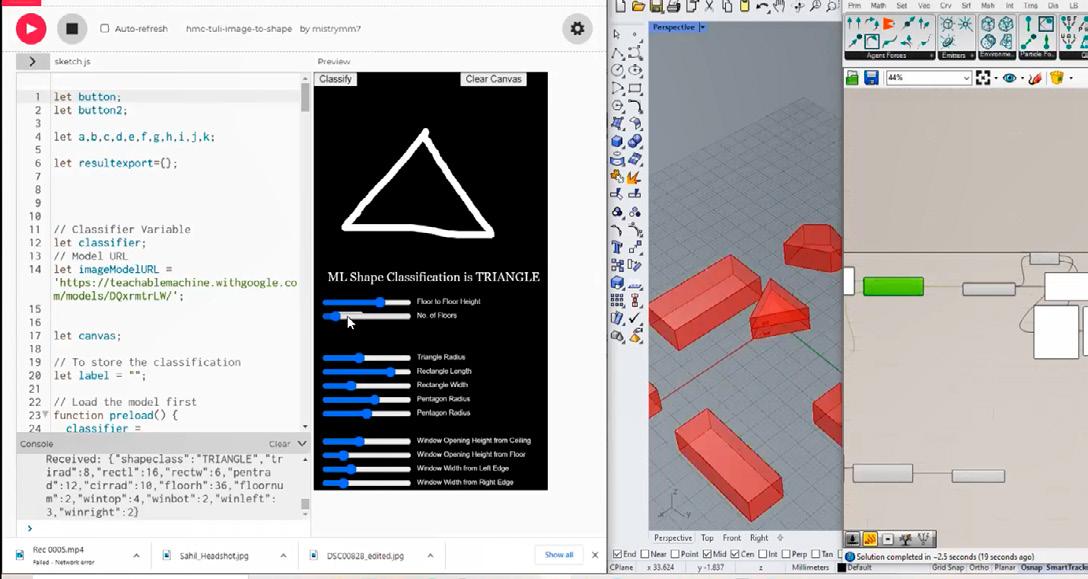
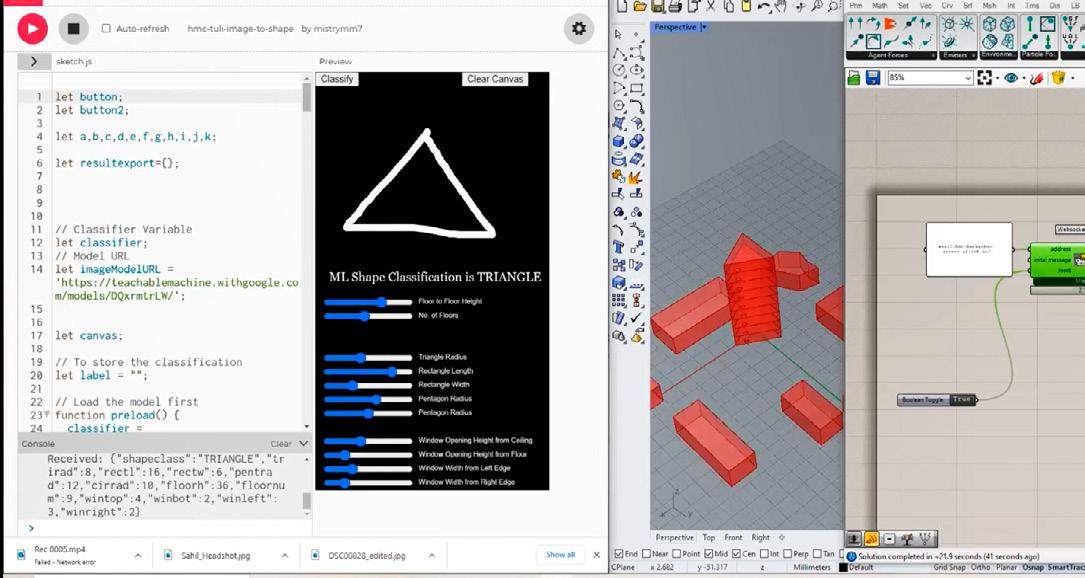
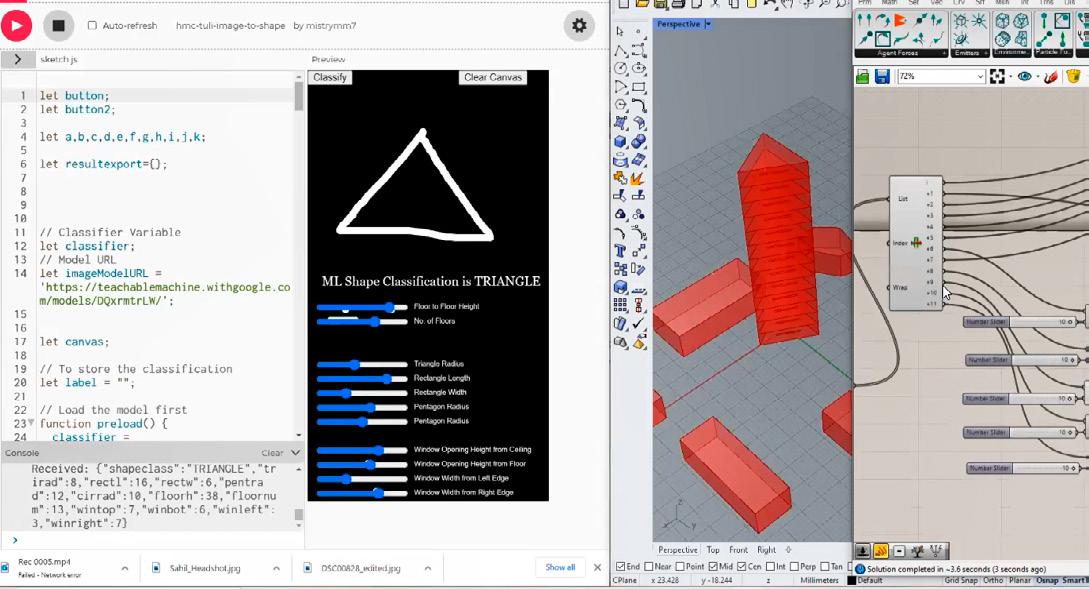
The hackathon theme was to develop a tool that encourages a computational design work-flow irrespective of the medium, while solving a critical current problem. Hence, developed a bridge using websocket (glitch server) that could integrate any modes of data (sketch,voice,vision) from any medium (p5js) and used open-source ML libraries (teachable machine web tool) to facilitate creative work-flows in the rhino-hops-grasshopper interface.
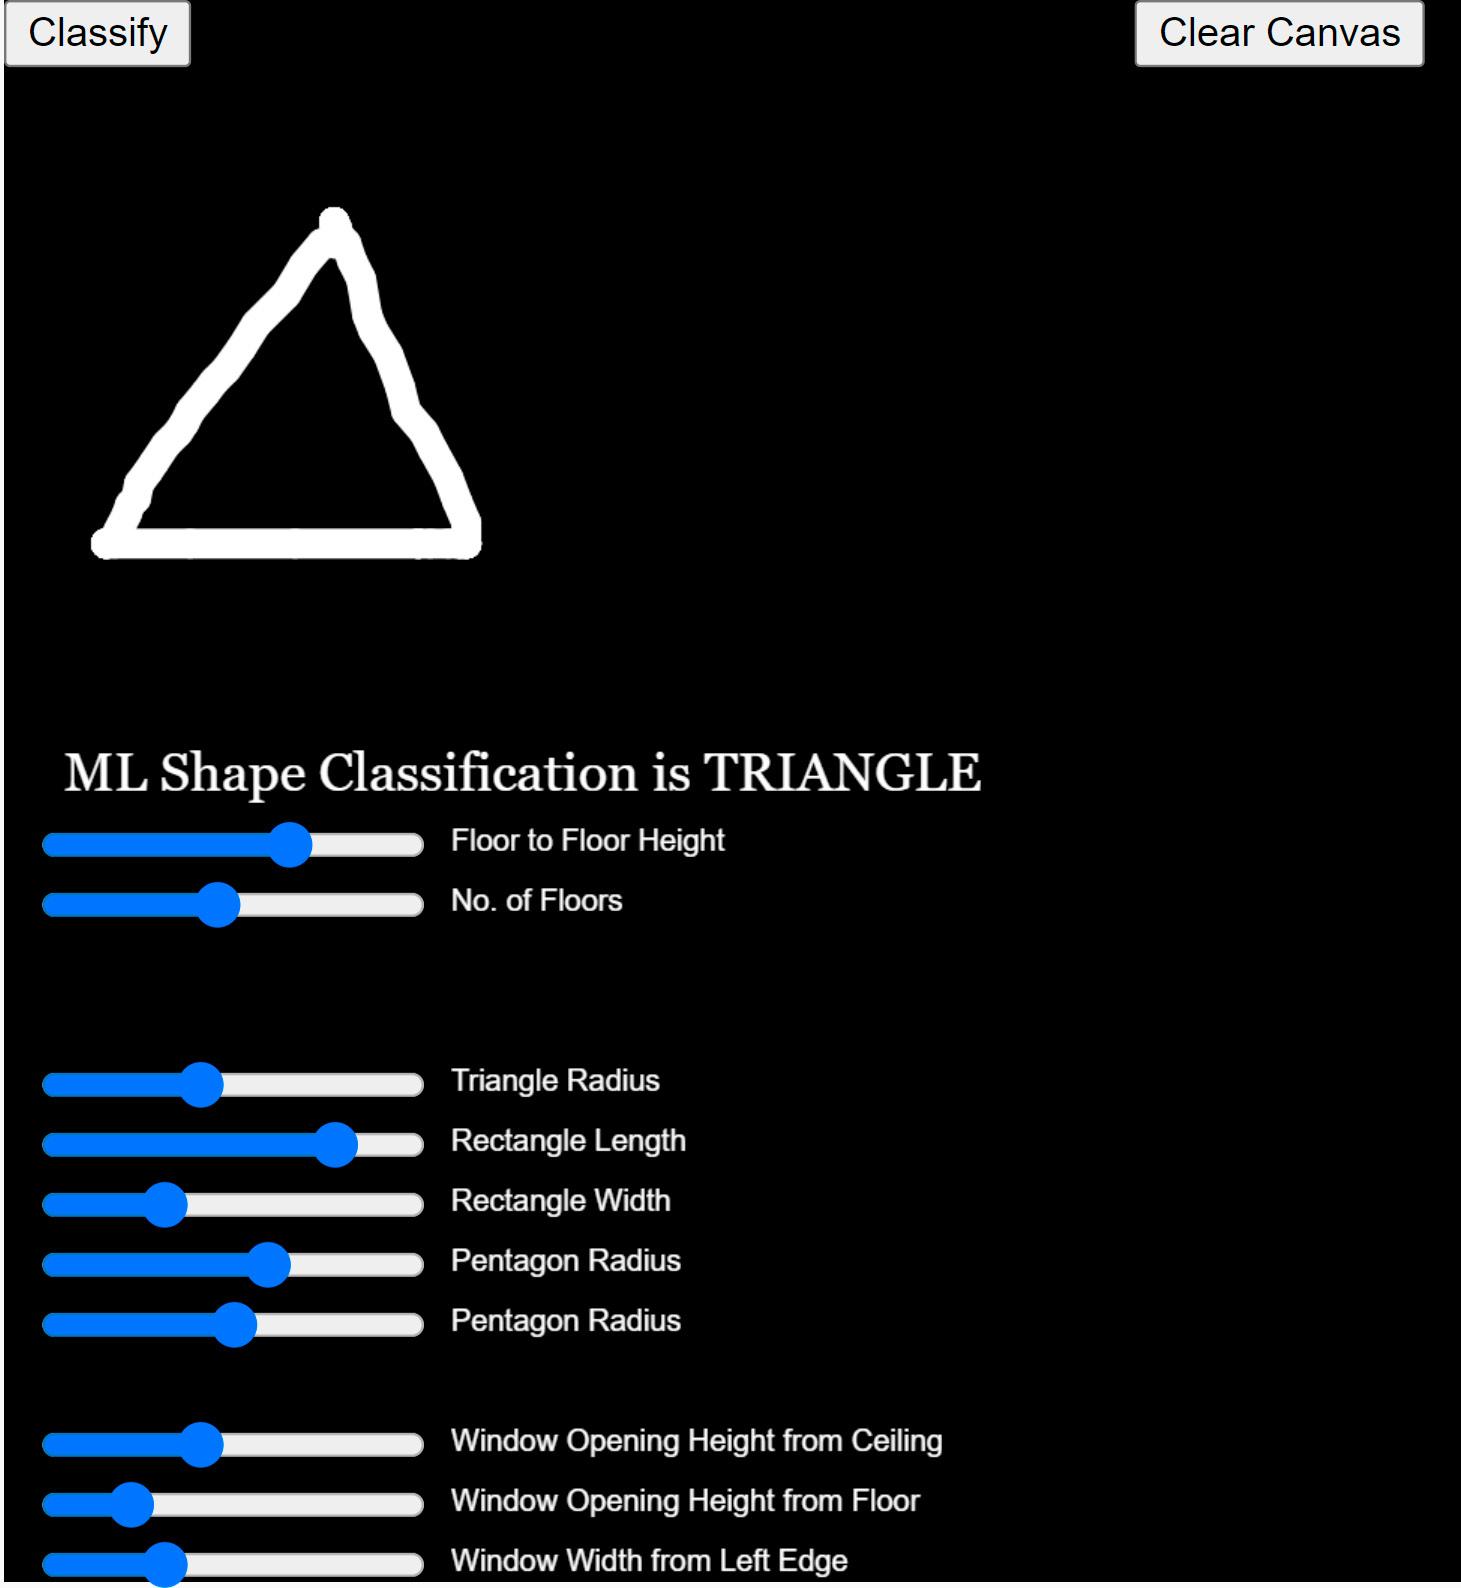
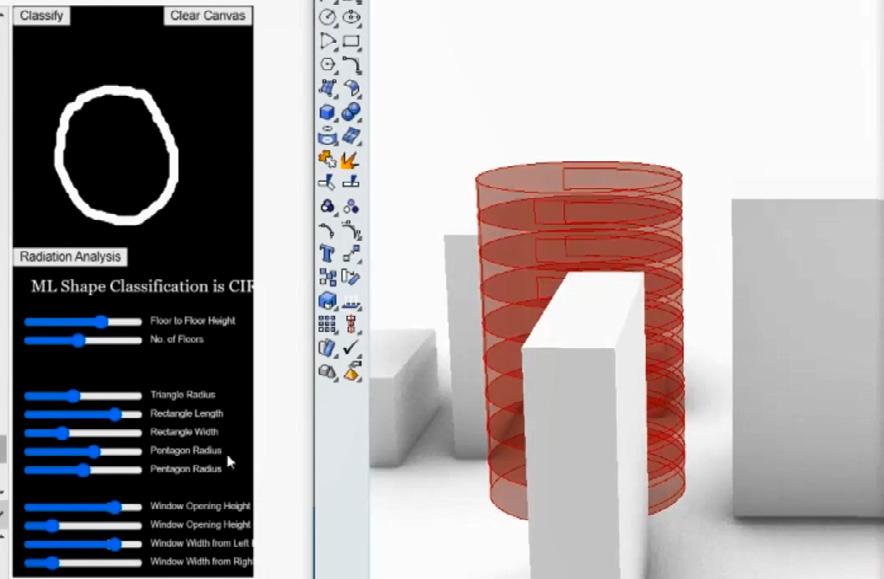
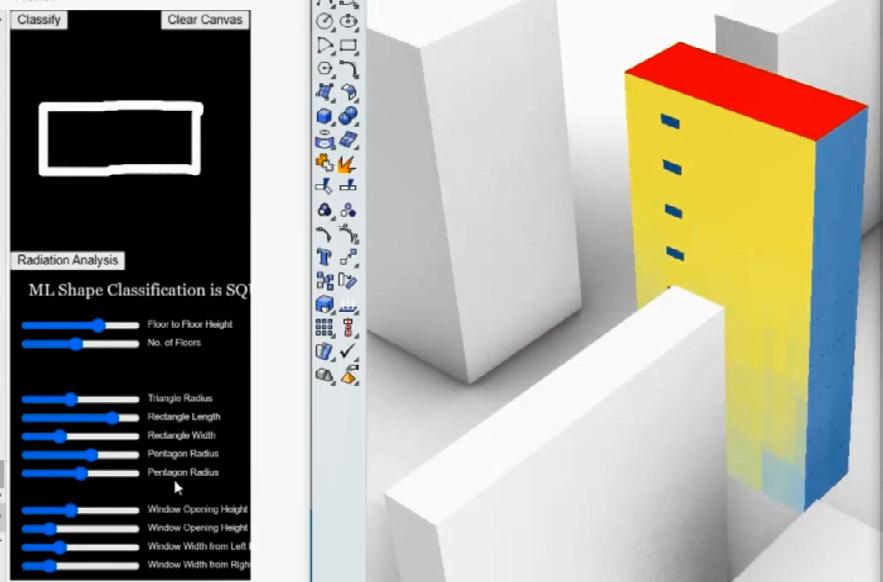
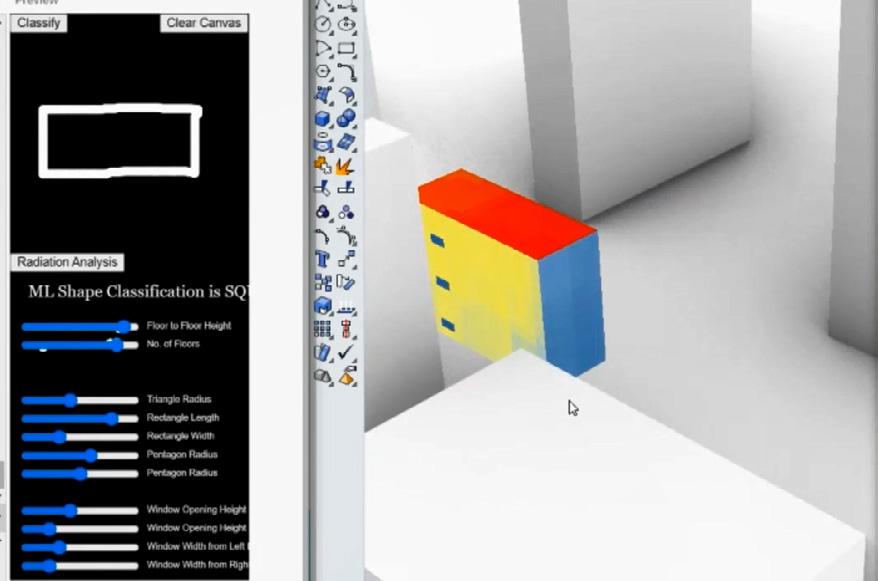
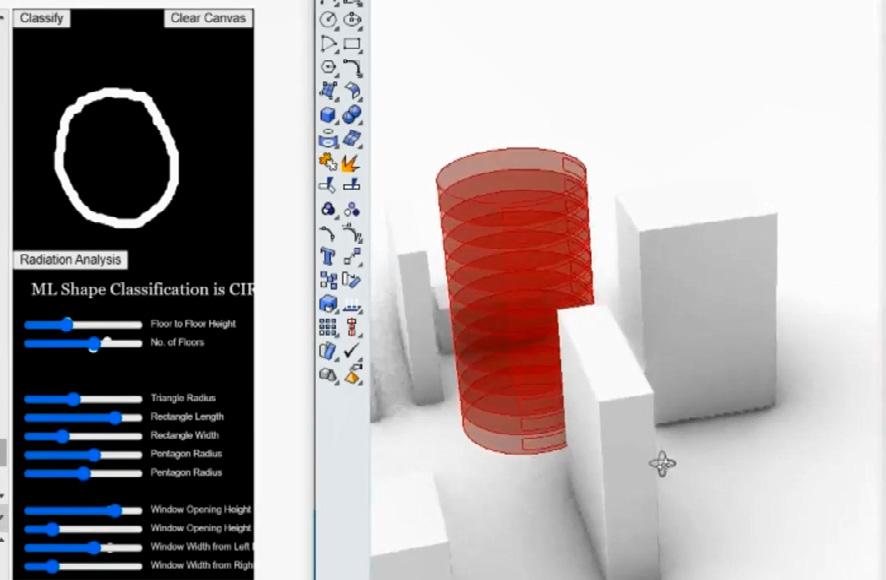
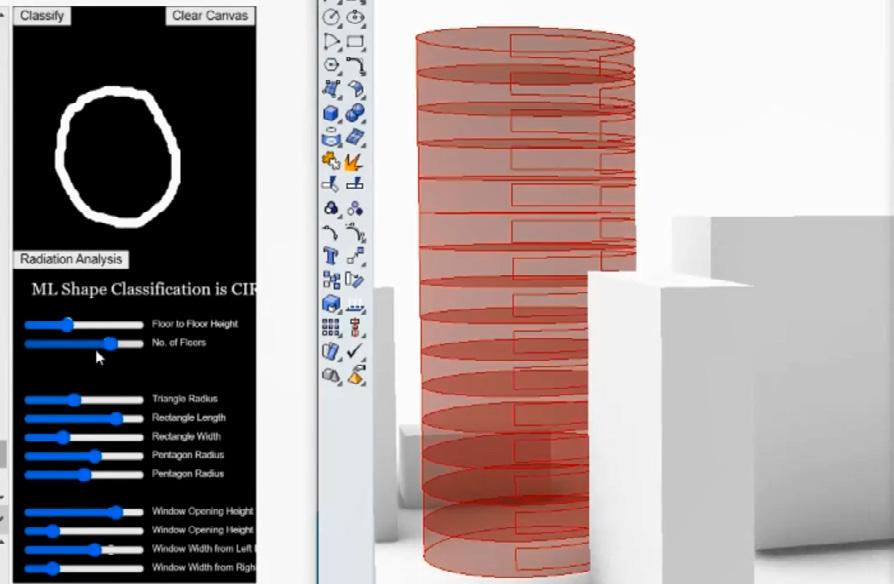
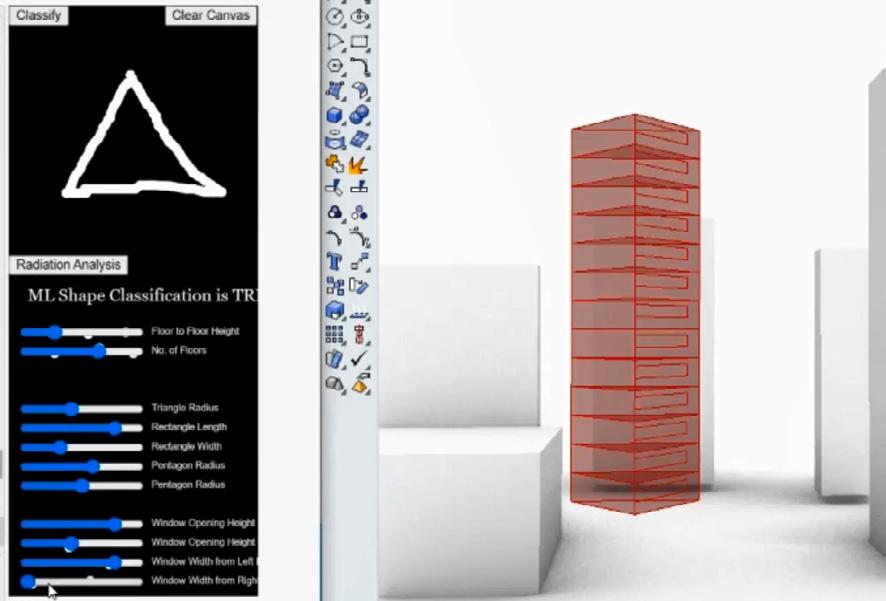
PART 1 - FORM SKETCHER 2D
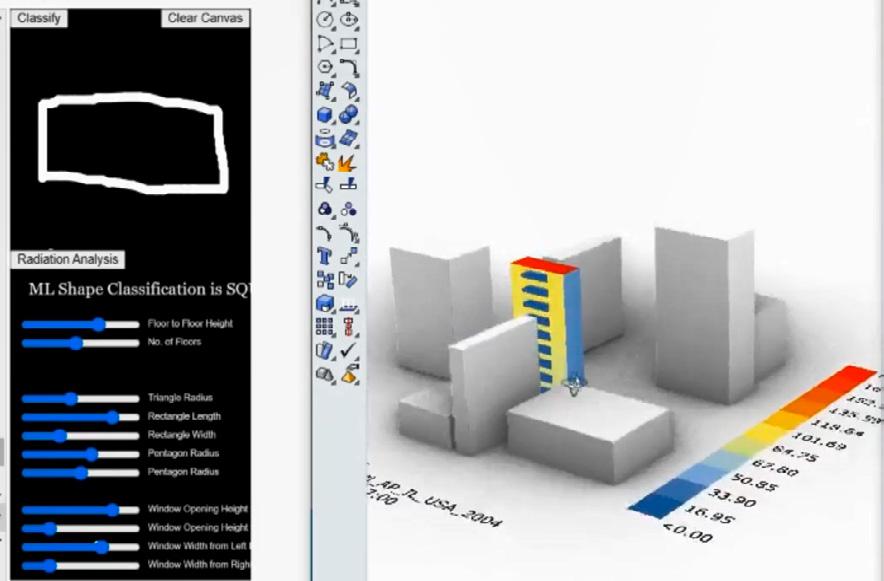
Draw a basic sketch and it generates its corresponding 3D geometry. It can also be used for environmental analysis. In early development stage PART 2 - ML SOUND RECOGNITION
Interactive methods between the design software and aged/people with disabilities with the purpose of independence. In primitive stage PART 3 - ML EMOTION RECOGNITION
A database creation based on recognizable experiential emotions at different building parts using security cameras. It can be used as feedback to generate an evidence based design approach in further projects. In primitive stage
Github Repository: https://github.com/Mistrymm7/playful-design-hackershmc-hackathon
48
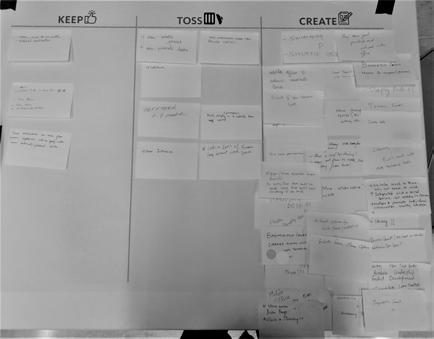
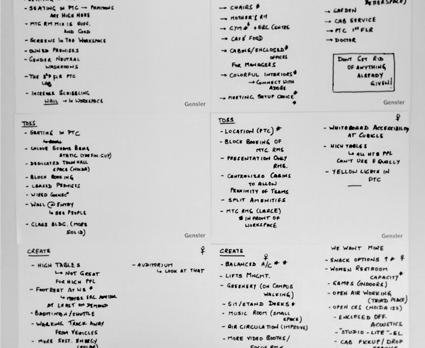
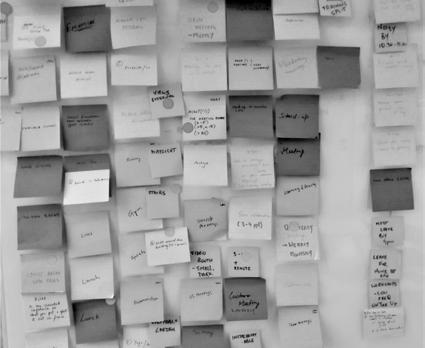
FORM SKETCHER - DESIGN PROCESS CONCEPT BOARD
After overall team discussion and theme setup, we split up into different virtual breakout rooms. This was our breakout room scene
“How can we bridge the gap between sketching and software modeling?”

Not really sure where to start, haha.
I have seen that most of us designers have trouble with softwares unlike sketching
Mine is the opposite case where I was never really good at sketching
Richa Mayur Tuli
Several discussions, life lessons and hours later...........
Whats happening?
We really need to start structuring
Come on brain and team, chop-chop, lets get this going!
We need to scale down our ideas and start with a basic prototype
“It feels like the designers adjusting to the software rather than vice versa”
STEP 1 - IMAGE CLASSIFICATION ML TRAINING ON TEACHABLE MACHINE
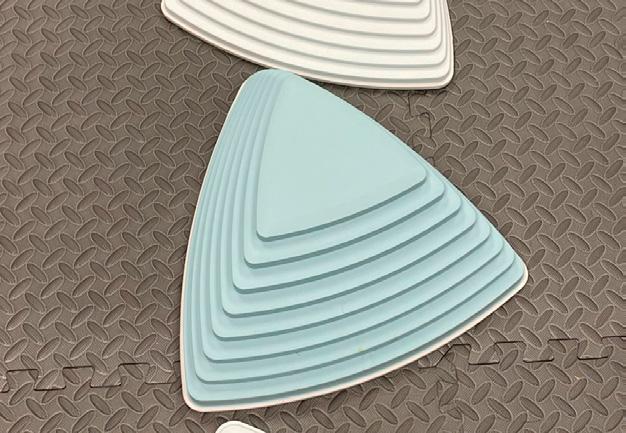
A. To start off, some preliminary research and Bruno Munari’s books indicated that any image/drawing/sketch can be broken down into a composition of squares, circles, triangles and vice versa. This trio is considered to be the most basic of shapes on Earth, both synthetic and natural. Human eye tends to simplify everything we see around us into these shapes.
“There are so many underutilized machine learning libraries out there as well as tools and websites that can be combined together to make life easier for designers”
All fired up Nervous
Thinking, thinking, thinking......................
That actually sounds feasible. We can add slider options in the sketcher too
Oh, got it! Lets setup an online sketcher where anyone can scribble an imperfect shape. We can use ML libraries to classify it into a shape category & transfer info into rhino to directly prompt its 3D geometry. That way all sketchers as well as software phobic people get a win win situation!
We can prepare it to be used further for multi-analysis
“How to reduce jumping back and forth between mediums and actually connect them all through a bridge?”
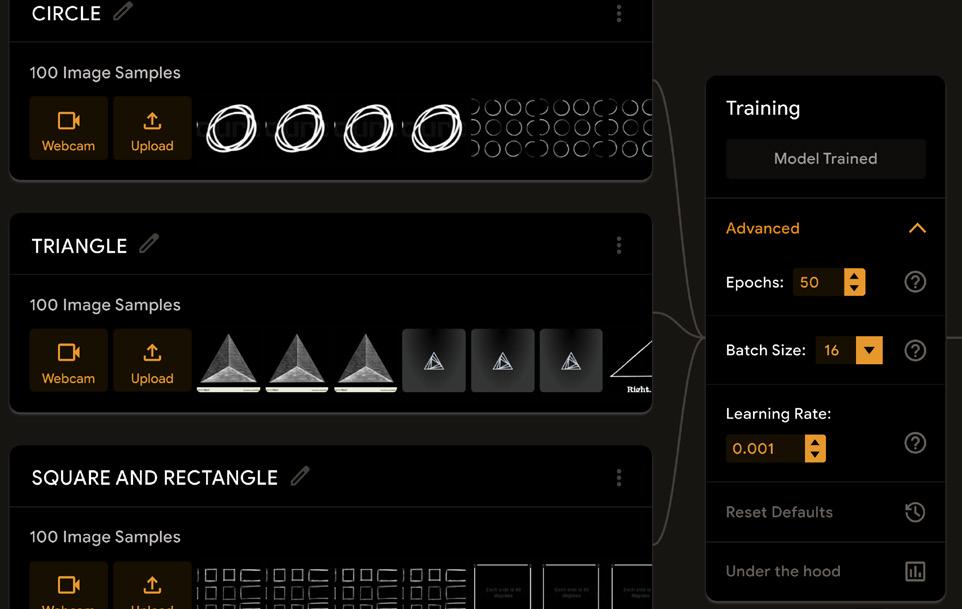
B. Hence, as a starting prototype, it was seen fit to first train ML model for image classification of any drawn sketch into its resembling primitive i.e. either a square, circle or triangle. It was trained on Teachable Machine - a web based open source ML tool built on TensorFlow.js library. More layers would be added to the model with progress in development to classify complicated shapes.
“Why should it just be limited to designers? Why not make it simple to include any age group? Play and tinker with it”
C. The image classification model was trained under supervised learning method at the learning rate of 0.001%. 100 samples were included in each class. Samples included all sorts of scribbled or imperfect shape sketches found on the web that resembled any of these shapes. Each batch size is 16, hence there were 6 batches every training class dataset. The whole training set ran 50 times. The trained model was loaded into p5js.
Zoned out
49
STEP 2 - SETUP GLITCH WEBSOCKET SERVER
Used Glitch Node App Template to create an Echo Server for multi-platform dynamic information sharing.
STEP 3 - CODED IN p5js
• Developed an interface to input basic sketch drawing which gets classified into a defined primitive shape
• Various dimensional sliders were also setup to facilitate live customization
• Information sent back to glitch websocket server
let button; let button2;
let a,b,c,d,e,f,g,h,i,j,k;
let resultexport={};
// Classifier Variable
let classifier;
// Trained Model URL
let imageModelURL = ‘https://teachablemachine.withgoogle.com/models/ DQxrmtrLW/’;
let canvas;
// To store the classification let label = “”;
// Loading the Trained Teachable Machine Image Classifier Model function preload() { classifier = ml5.imageClassifier(imageModelURL + ‘model.json’); }
// Setting up the Sketch Interface function setup() { canvas = createCanvas(0.8*windowWidth, 0.9*windowHeight); background(0);
// Setting up the Slider information that would be imported into gh script resultexport.shapeclass=’abcd’; // Shape Classification resultexport.trirad = 2; // Triangle Radius
resultexport.rectl= 2; // Rectangle Length
resultexport.rectw = 2; // Rectangle Width
resultexport.pentrad= 2; // Pentagon Radius
resultexport.cirrad= 2; // Circle Radius
resultexport.floorh= 2; // Floor Height
resultexport.floornum= 2; // Number of Floors
resultexport.wintop= 2; // Window Top
resultexport.windbot= 2; // Window Bottom
resultexport.widleft= 2; // Opening Width from Left Corner
resultexport.widright= 2; // Opening Width from Right Corner
fill(255)
.strokeWeight(2); textSize(10); noStroke();
// Creating Slider Graphics slid1 = createSlider(0, 20, 8); slid1.position(10, 0.6*windowHeight); text(‘Triangle Radius’, slid1.x * 2 + slid1.width, 0.6*windowHeight+12);
slid2 = createSlider(0, 20, 16); slid2.position(10, 0.6*windowHeight+ 20); text(‘Rectangle Length’, slid2.x * 2 + slid2.width, 0.6*windowHeight+12+ 20);
slid3 = createSlider(0, 20, 6); slid3.position(10, 0.6*windowHeight+ 40);
text(‘Rectangle Width’, slid2.x * 2 + slid2.width, 0.6*windowHeight+12+ 40);
slid4 = createSlider(0, 20, 12); slid4.position(10, 0.6*windowHeight+ 60);
text(‘Pentagon Radius’, slid2.x * 2 + slid2.width, 0.6*windowHeight+12+ 60);
slid5 = createSlider(0, 20, 10); slid5.position(10, 0.6*windowHeight+ 80);
text(‘Pentagon Radius’, slid2.x * 2 + slid2.width, 0.6*windowHeight+12+ 80);
slid6 = createSlider(28, 40, 36); slid6.position(10, 0.6*windowHeight-80);
text(‘Floor to Floor Height’, slid2.x * 2 + slid2.width, 0.6*windowHeight+12- 80);
slid7 = createSlider(0, 20, 9); slid7.position(10, 0.6*windowHeight-60);
text(‘No. of Floors’, slid2.x * 2 + slid2.width, 0.6*windowHeight+12- 60);
slid8 = createSlider(0, 10, 4); slid8.position(10, 0.6*windowHeight+120);
text(‘Window Opening Height from Ceiling’, slid2.x * 2 + slid2.width, 0.6*windowHeight+12+120);
slid9 = createSlider(0, 10, 2); slid9.position(10, 0.6*windowHeight+140); text(‘Window Opening Height from Floor’, slid2.x * 2 + slid2.width, 0.6*windowHeight+12+140);
slid10 = createSlider(0, 10, 3); slid10.position(10, 0.6*windowHeight+160);
text(‘Window Width from Left Edge’, slid2.x * 2 + slid2.width, 0.6*windowHeight+12+160);
slid11 = createSlider(0, 10, 2); slid11.position(10, 0.6*windowHeight+180); text(‘Window Width from Right Edge’, slid2.x * 2 + slid2.width, 0.6*windowHeight+12+180);
// Invoking exporttogh function everytime Slider value gets changed slid1.changed(() => { exporttogh(); console.log(resultexport); let str = JSON.stringify(resultexport); serverConnection.send(str); })
slid2.changed(() => { exporttogh(); console.log(resultexport); let str = JSON.stringify(resultexport); serverConnection.send(str); })
slid3.changed(() => { exporttogh(); console.log(resultexport); let str = JSON.stringify(resultexport); serverConnection.send(str); })
slid4.changed(() => { exporttogh(); console.log(resultexport); let str = JSON.stringify(resultexport); serverConnection.send(str); })
slid5.changed(() => { exporttogh(); console.log(resultexport); let str = JSON.stringify(resultexport); serverConnection.send(str); })
slid6.changed(() => { exporttogh(); console.log(resultexport); let str = JSON.stringify(resultexport); serverConnection.send(str); })
slid7.changed(() => { exporttogh(); console.log(resultexport); let str = JSON.stringify(resultexport); serverConnection.send(str); })
slid8.changed(() => { exporttogh(); console.log(resultexport); let str = JSON.stringify(resultexport); serverConnection.send(str); })
slid9.changed(() => { exporttogh(); console.log(resultexport); let str = JSON.stringify(resultexport); serverConnection.send(str); })
slid10.changed(() => { exporttogh(); console.log(resultexport); let str = JSON.stringify(resultexport); serverConnection.send(str);
slid11.changed(() => { exporttogh(); console.log(resultexport); let str = JSON.stringify(resultexport); serverConnection.send(str); })
})
50
// Creating prompt buttons for ‘classify’ and ‘clear canvas’ button = createButton(‘Classify’); button.position(0, 0); button.mousePressed(classifyImage);
button2 = createButton(‘Clear Canvas’); button2.position(0.5*windowWidth, 0); button2.mousePressed(clearcanvas);
fill(255)
.strokeWeight(5)
.textSize(10); textSize(18); textFont(‘Georgia’); }
// exporttogh function function exporttogh(){
resultexport={ shapeclass: label, trirad : slid1.value(), rectl : slid2.value(), rectw : slid3.value(), pentrad slid4.value(), cirrad :slid5.value(), floorh :slid6.value(), floornum :slid7.value(), wintop :slid8.value(), winbot slid9.value(), winleft : slid10.value(), winright slid11.value(), } }
function draw() { noStroke();
let a = slid1.value();
let b = slid2.value();
let c = slid3.value();
let d = slid4.value();
let e = slid5.value();
let f = slid6.value();
let g = slid7.value();
let h = slid8.value();
let i = slid9.value();
let j = slid10.value();
let k = slid11.value();
if (mouseIsPressed === true) { stroke(255); fill(255)
.strokeWeight(10); line(mouseX, mouseY, pmouseX, pmouseY);}
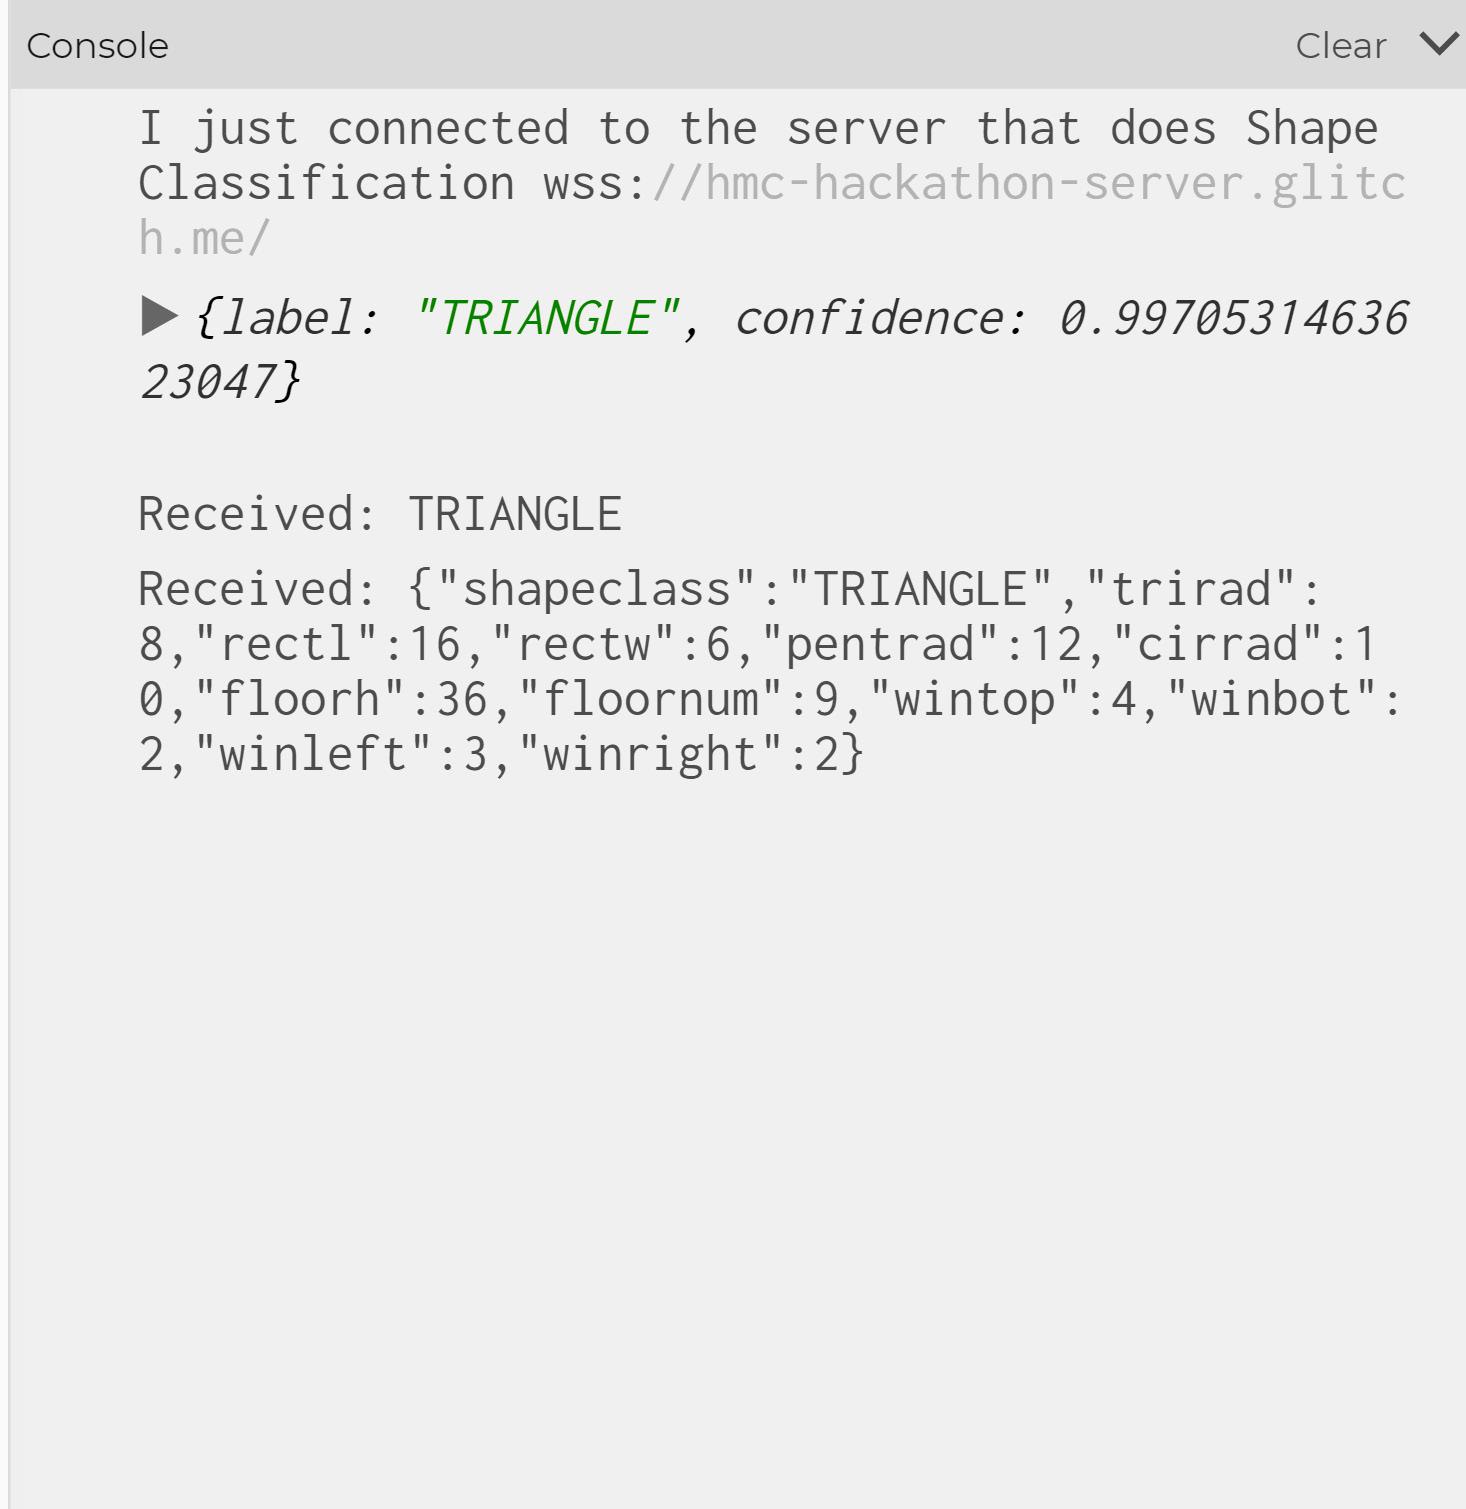
// Connecting to glitch websocket server const serverAddress = ‘wss://hmc-hackathon-server.glitch.me/’; const serverConnection = new WebSocket(serverAddress);
serverConnection.onopen = function() { console.log(“I just connected to the server that does Shape Classification “ + serverAddress); }
// Get a prediction for the current video frame function classifyImage() { classifier.classify(canvas, gotResult); }
// Clearcanvas function function clearcanvas(){ background(0); } function keyPressed() { classifier.classify(canvas, gotResult); }
// When we get a result function gotResult(error, results) { // If there is an error if (error) { console.error(error); return; }
// The results are in an array ordered by confidence console.log(results[0]); label = results[0].label; serverConnection.send(label); exporttogh(); let str = JSON.stringify(resultexport); serverConnection.send(str); noStroke(); fill(255) .strokeWeight(2); text(‘ML Shape Classification is ‘ + label, 20, 0.45*windowHeight); }
serverConnection.onmessage = function(event) { console.log(“Received: “ + event.data); }
}
51
to GRASSHOPPER WORKFLOW
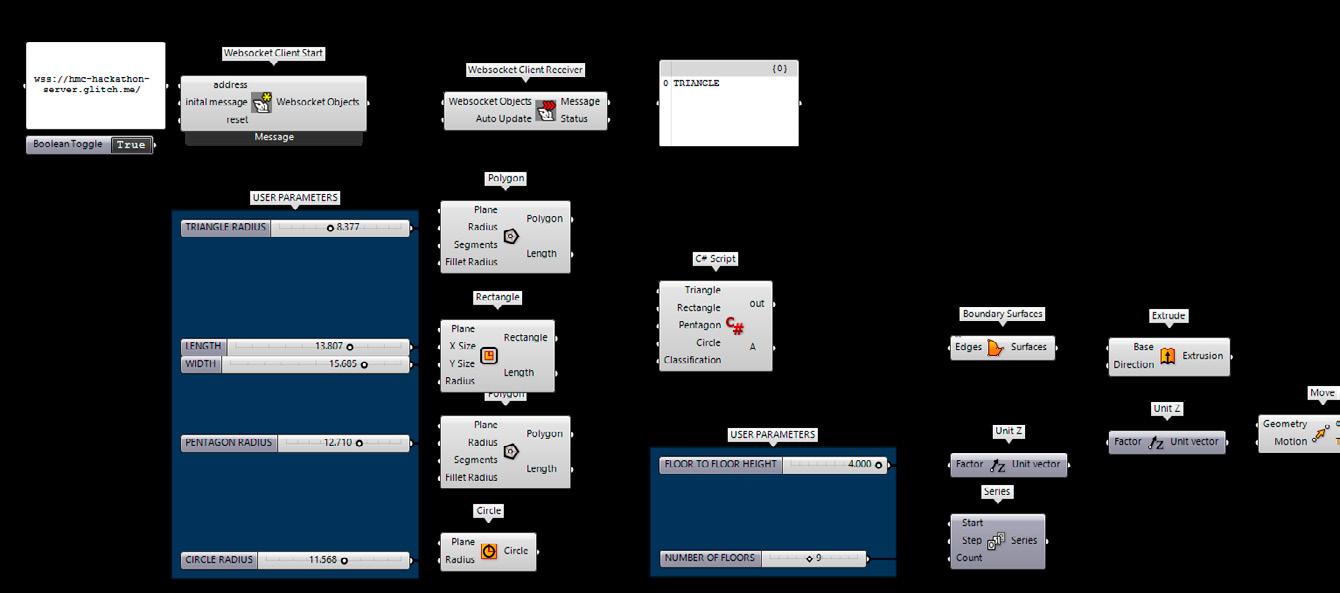
Connected Grasshopper to glitch server using Bengesht and jSwan plugins
Later on, re-arranged the script and connected everything together using hops component in grasshopper
SLIDERS SLIDERS
Developed a basic C# script to use classification information to generate 3D extrusions-
private void RunScript(Curve Triangle, Curve Rectangle, Curve Circle, string Classification, ref object A)
{if(Classification == “TRIANGLE”){ A = Triangle;}
if(Classification == “SQUARE AND RECTANGLE”){ A = Rectangle;}
if(Classification == “CIRCLE”){ A = Circle;} }
SLIDERS
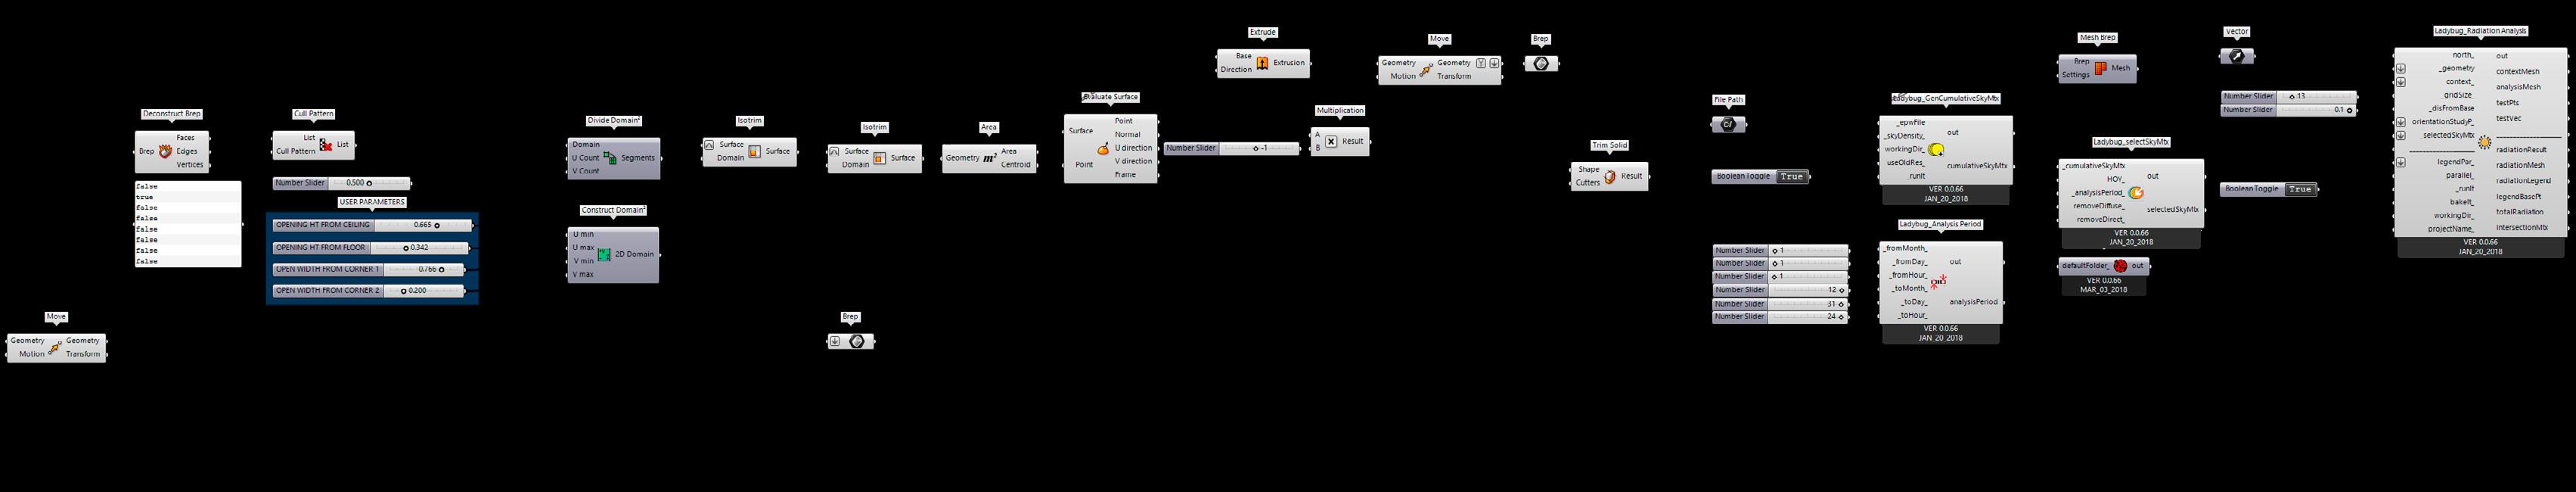
Specified more details such as floor heights, number of floors, and creation of openings
Connected the geometry to ladybug tools to do solar radiation analysis. Possibilities for other analyses as well
STEP 4 - p5js
52

in Sliders and Shapes
Tested with Ladybuy Tools 53
Demo During Hackathon Change
After Some Progress
Tuli Bhattacharjee
+1 8622129707 tuli@umich.edu bhattacharjee.tuli.1996@gmail.com
Computational Designer & Researcher | Experience Design Strategist | COA Licensed Architect, India
54
