ANNUAL REPORT 2021


TID will provide reliable and competitively priced water and electric service, while being good stewards of our resources and providing a high level of customer satisfaction.
TID’s reputation will be as a trusted partner, innovative leader, and model of sustainability in enhancing the quality of life for our community, through embracing our core values at every level of our organization.
Community can be defined as a group of people, a society, within a given geographic area. For TID community encompasses so much more than the physical space we occupy. At TID, our community is made up of our customer-owners. Our community is our top priority. Our community is why we exist.
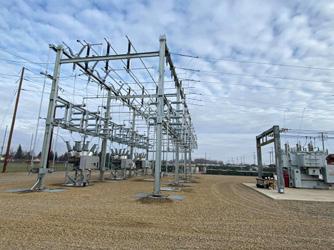
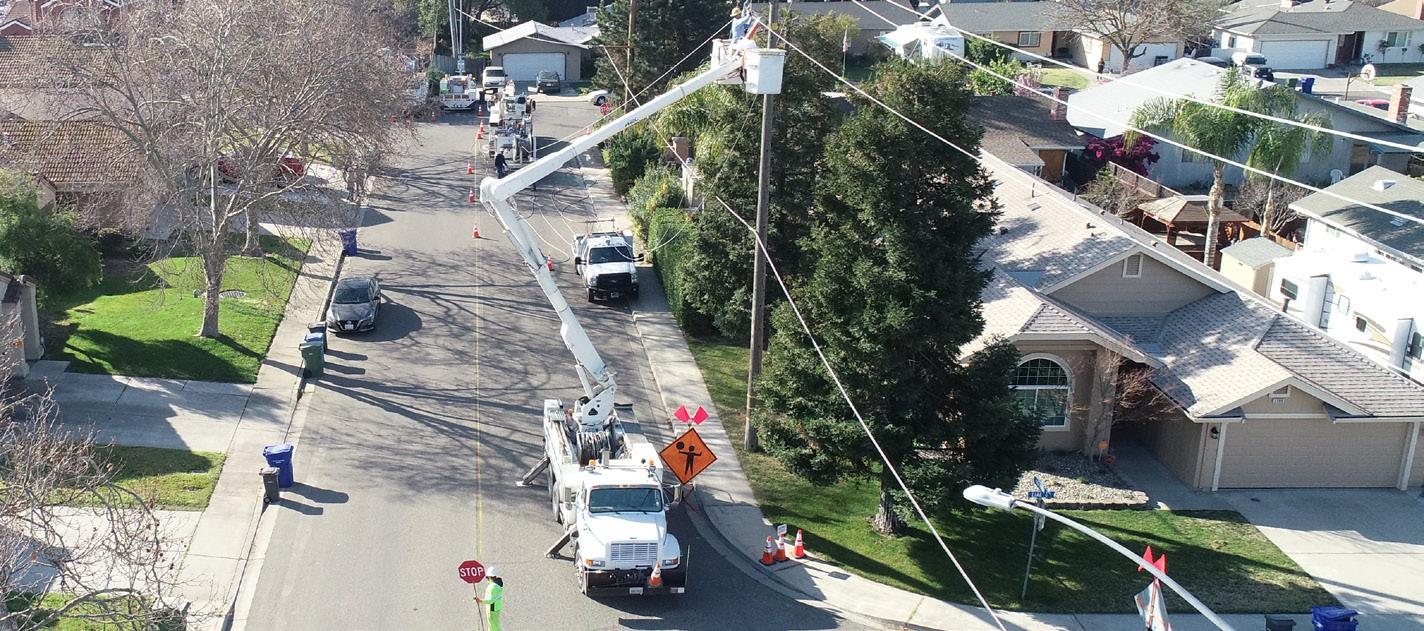
As a community-owned utility, we make decisions that are guided by the needs and wants of our customers. From District investments like power line restrings to substation projects to ensure the reliability of our power supply, to continually advocating for local control of the resources we steward, such as the Tuolumne River, to maintain the necessary water supply to our growers, TID remains focused on providing for our community.

TID plans, builds and maintains its water and electric systems to reliably serve its customers.
TID provides stable, competitive rates for its customers.
TID provides leadership by sustainably managing the resources entrusted to us.
The 2021 Annual Report highlights local control at its best. Due to TID’s stewardship of the Tuolumne River through the use of forecasting tools, our Board was able to make informed, thoughtful decisions for the 2021 water year, which ended as the 6th driest on record since 1897. Our growers benefit from the proactive, data-driven decisions taking place at TID. Another example of the advantages of a community-owned utility came in the summer months when the State experienced excessive heat. TID customers benefited from our position as a balancing authority and our participation in the Energy Imbalance Market. As such we were able to secure power for our customers and minimize the impact to the State’s power grid.
In a fast-paced, ever-changing environment, TID has not let up on exploring and implementing innovative technology in support of our operations and offerings to our customers, and we are proud to be recognized nationally for our local accomplishments.
TID ensures a safe environment for employees and customers.
TID is committed to building strong and lasting relationships with our customers and community through engagement, transparency, accountability and trust.
TID attracts and retains highly-skilled and experienced team members.
Decisions made by local people to address local needs are essential to TID’s continued success.
TID proactively balances near-term decision making with the long-term wellbeing of its customers.
We continue to work through our five-year Strategic Plan and the priorities it outlines. The 2021 Annual Report provides a year in review and an opportunity to look ahead to projects on the horizon. We aim to apply a bold, yet tactical, approach to advance the District in initiatives that will provide real-time benefits and support our customers for generations to come.
I continue to be energized by the hardworking team members who are committed to keeping the District moving forward to best serve our community. Together, We Are TID.
Michelle Reimers General Manager
driest year since 1897
driest twoyear period
average full natural flow (October – September)
The 2021 curtailment orders called for an immediate cease of diversions from the rivers for both pre- and post-1914 water right holders.
August 20, 2021
The State Water Resources Control Board (SWRCB) issued curtailment orders on approximately 4,500 water right holders in the Sacramento-San Joaquin Delta – including Turlock Irrigation District.
September 2, 2021
The San Joaquin Tributaries Authority (SJTA), of which TID is a member, filed a lawsuit against the SWRCB challenging their adoption of the Emergency Drought Curtailment Regulations.
November 2021
SWRCB temporarily lifted the curtailment orders on imposed upon water right holders in the Sacramento-San Joaquin Delta – including Turlock Irrigation District. Lifting the curtailments allowed TID to capture water for storage in the Tuolumne River Watershed, including the early water season storm in October.
The SWRCB has not yet indicated when the curtailments will again be imposed on the District. Without the reprieve, the curtailments could have significant impact on available water in future years.
precipitation compared to average year (September – August)
per parcel
On October 20, 2021, the State Water Resources Control Board informed TID that they were walking away from the Tuolumne River Voluntary Agreement process and would instead move forward with implementing their Phase 1 Bay-Delta Water Quality Control Plan. TID has repeatedly expressed our commitment to continue Voluntary Agreement discussions and has negotiated in good faith for years to implement our comprehensive, science-based plan to improve the ecology of the Tuolumne River. Parallel to the voluntary agreement discussions, TID filed lawsuits against the State Water Resources Control Board’s Bay-Delta Plan, and those lawsuits continue to move forward. TID remains committed to long-term, science-based, voluntary solutions and is willing to re-engage in discussions with the State to reach an agreement that will benefit all.
TID is governed by a five-member, locally elected board of directors with the role of representing the needs and voices of customers within their district. The Directors are responsible for approving District policies and budgets and operational practices.
Additionally, the Directors represent TID on regional boards such as the Turlock Subbasin Groundwater Sustainability Agency, the California Farm Water Coalition and the San Joaquin Tributaries Authority, as well as TID’s Power Supply Risk, Personnel and Compensation, and Pension Investment committees. The public is invited to participate in the Board of Directors meetings. Information including time, date and agendas can be found at TID.org/boardmeetings.
There are many ways Turlock Irrigation District benefits from being community-owned, including local control of our generation and transmission resources. As a Balancing Authority, TID is solely responsible for meeting the power needs of our over 240,000 customers within our 662-square miles service area.
In Spring of 2021, TID officially entered the Western Energy Imbalance Market (EIM) providing the District with access to additional low-cost energy to serve real-time demand while meeting Renewable Portfolio Standard requirements.
Entering the EIM is an example of how TID and the Board of Directors have invested in beneficial programs and resources to best serve its customer-owners. After being live for only 10 months, TID’s 2021 monetary benefits of joining the EIM are $5,107,698.70.
As a community-owned utility,
is
the maintaining
facilities.
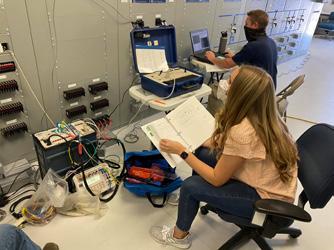
2021, departments throughout the District contributed to facility and infrastructure
to preserve
increase the efficiency of TID’s vital infrastructure which enables the District to provide the essential resources of water and power to our customers.
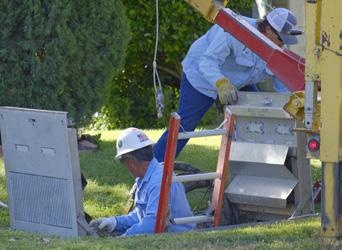
Proactive replacement of aging
3,770 residential customers received rebates
non-residential customers received 3,094,053 kWh in rebate savings
2,548 streetlight fixtures replaced with Dusk to Dawn LED’s, saving 1,362,221 kWh
kWh total saved in 2021 (residential and non-residential)
Electric Vehicle rebates issued in 2021 (residential and commercial)
Electric Vehicle Charger rebates issued in 2021 (residential and commercial)
made to increase
capacity and reliability to customers.
automatic drop
provide added control
equipment before
potential of problems
Commissioning new protective relays to support providing safe and reliable power to customers.
TID customers were invited to test drive a wide variety of electric cars, learn about purchasing and owning a plug-in vehicle from actual EV owners. The event hosted 12 vehicles and conducted over 170 test drives by registered customers.
Replacement of electric poles and distribution lines is an important investment in the District’s resources.
TID continues to educate customers on benefits and potential savings from electric vehicles through events like the Guest Drive, as well as the EV guide, ev.tid.org

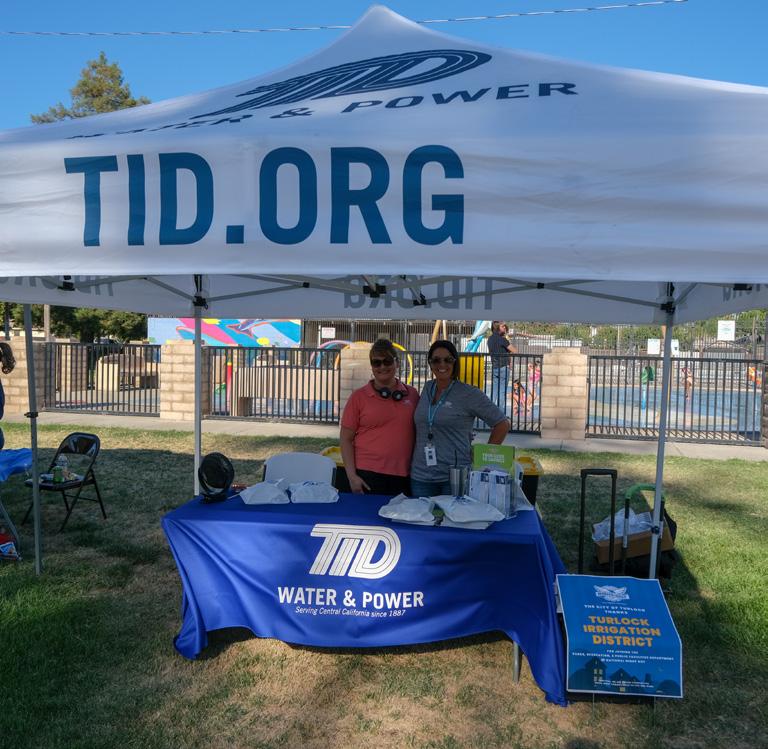
As a trusted community partner, TID recognizes that we can accomplish more when we work together. In recognition of this, TID established the “Powering Our Communities” Program. “Powering Our Communities” is a grant-type program available to municipal organizations in the TID service area that aims to provide financial support for energy efficiency projects benefitting the community.
In 2021 TID awarded the inaugural grant to the City of Turlock to be used exclusively for the Pedretti Park Lighting Upgrades project, which will begin construction in the summer of 2022.

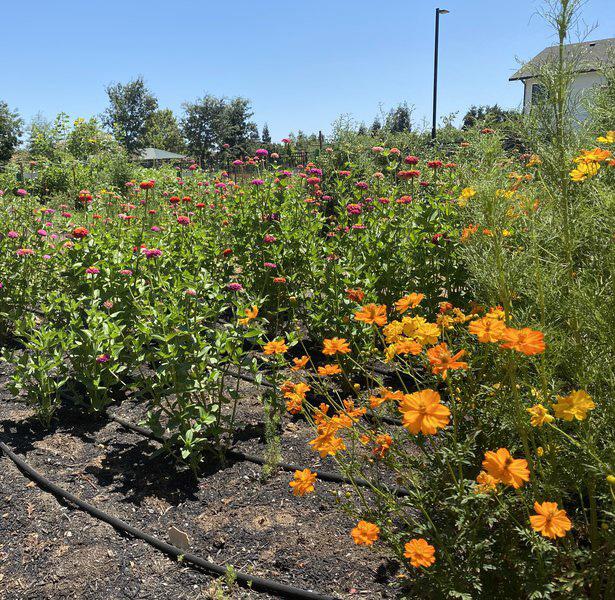
Outside of the grant program, TID also supported the installation of a drip irrigation system for the local, non-profit community garden, continuing the District’s support of efficient use of the precious resource of water.
With a desire to further connect with customers and offer greater insight into the District, TID introduced the TID Water and Power Podcast. The monthly podcast showcases subject matter experts from across the District, giving listeners inside knowledge about the operations of their community-owned utility. Launched in May 2021, TID’s podcast had over a 1,300 downloads in its first year, with five of the first eight episodes receiving enough downloads in the first 7 days of release to be within the top 25% of all podcasts.
As TID’s customers continued to be impacted by COVID-19 in 2021, the District introduced new programs and enhancements that would deliver on ease of service and provide support. Payment assistance programs continued to support customers. One example is the Salvation Army Program that provides financial assistance to TID customers, resulting in the reduction of the total past due amounts by over $87,000.
TID also implemented new practices and options to allow customers to safely and easily make payments, including the installation of payment kiosks at both our Turlock and Ceres office locations. The outdoor kiosks offer a contactless, secure, and convenient way for customers to pay their electric bill through a self-service platform.
As a focal point of the TID system, the Don Pedro Project celebrated a milestone anniversary in 2021. Don Pedro has not only provided irrigation water and power for our community, but has offered flood control and multiple recreational opportunities over its 50 years.
Don Pedro Reservoir stores irrigation water for approximately 200,000 acres of farmland.
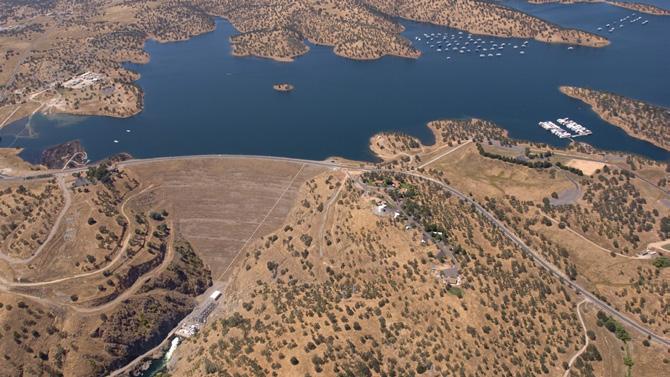
The power plant generates 203 megawatts of clean, affordable hydroelectricity.

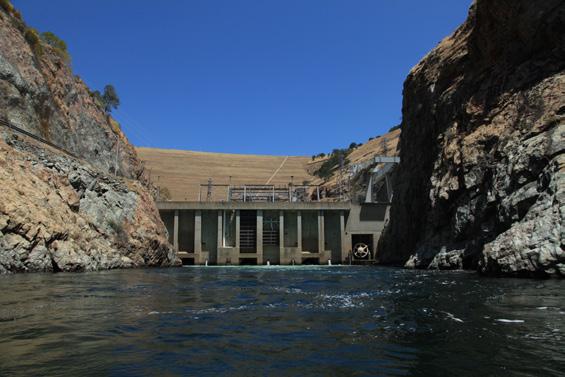
The reservoir offers fishing, boating and camping opportunities along 160 miles of shoreline.
Regulated river flows are released from Don Pedro to benefit fisheries and maintain the health of the Tuolumne River.
The reservoir and the optimized operation of the Don Pedro Project allows for efficient water usage and provides flood control capabilities.

The Strategic Plan continues to serve the critical function of helping the District move forward with a cohesive vision and a tactical action plan. The District’s progress against the Goals, Actions and Tasks of the 2020-2025 Strategic Plan is continuously monitored to ensure tasks are on track to meet the Districts’ priorities.
TID utilizes the best technology to run models and regularly update our Board of Directors and growers throughout the year. New technology, including the Airborne Snow Observatory (ASO),
Forecast-Informed Reservoir Operations (FIRO), offers the best possible data to inform the District’s decision making on water operations allowing us to save as much water as possible for the most efficient use in dry and wet years.
In 2021, TID officially implemented new features on the online water request system to benefit growers irrigating within TID’s service area. Growers can request water easily from a desktop, tablet, or mobile device. In addition to requesting water on the go, users can check the water usage on each parcel, view irrigation history, and download parcel summary reports.
There is great pride in being part of a community, and as a community-owned utility, TID seeks out opportunities to support the well-being of its customers through educational programs, sponsored events, and our employee giveback program, Team TID.

Swim for Free with TID: As part of TID’s swim safe campaign, TID sponsored the entry fee for community members at local pool sites on specific days during the summer season.

In July, TID sponsored nearly 700 swimmers at pool sites within TID’s service territory in support of water safety education
Community Events: Annually, TID supports community events to connect TID to its customers.
Throughout 2021, TID participated in several community events including: National Night Out, Turlock Certified Farmers Market, Hilmar Dairy and Farm Festival, Denair Farm and Family Night, Delhi Block Party, Turlock’s Annual Holiday Parade and Patterson’s Holiday Boutique.
Team TID: TID’s employee give-back nonprofit program raises support for families and organizations within TID’s service territory.
In 2021, through virtual events and fundraising efforts, Team TID raised nearly $5,000 which supported local families in need during the holiday season.
The We Are TID campaign represents TID’s commitment to the work we do for, and with, our community. In its second installment, the 2021 We Are TID campaign shared the stories of eight employees, the unique work they do, and the many ways TID supports families and business through the essential services we provide.
American Public Power Association awarded Turlock Irrigation District with the 2020 Certificate of Excellence in Reliability for being in the top quartile (25%) of utilities for System Average Interruption Duration Index (SAIDI) based on the EIA data in 2015 - 2019.
Institute for Local Government awarded the Beacon Award for Leadership in Climate Resilience and Adaptation to Turlock Irrigation District for their innovative Water Management Operations Program.

American Public Power Association presented Turlock Irrigation District with the Excellence in Public Power Communications Award for its 2020-2025 Strategic Plan publication.
The Association of California Water Agencies selected Turlock Irrigation District as the winner of ACWA’s 2021 “Most Effective Agency on Federal Issues” Award for its work on HR 8041 (Harder CA-10) and S 4530 (Feinstein CA) in support of the Snow Water Supply Forecasting Program Authorization Act.

The National Hydropower Association presented Turlock Irrigation District with the 2021 Outstanding Stewards of America’s Waters (OSAW) Award in the category of Operational Excellence for Don Pedro Power Plant’s Role in Supporting the Grid During the 2020 August Heatwave.
Northwestern Public Power Association awarded Turlock Irrigation District’s Casey Hashimoto (ret.) the Wm. “Bill” McCrorie Distinguished Service Award for his exceptional service to public power.
Turlock Irrigation District was recognized with a coveted Best CIS Implementation Award as part of CS Week for the successful implementation of a new Customer Information System (CIS).
TID continues to seek new opportunities to provide information to customers. In April 2021, TID launched its presence on Instagram in an effort to reach a broader demographic of customers. Each month, TID’s Instagram account grew its engagement and ended 2021 with more than 816 followers, with an additional 23,000 users reached through Instagram Stories. Across all TID social media channels, the District reached well over half a million people in 2021.
Electric energy - Retail $289,834 $275,323 $264,836 $268,963 $304,200
Electric energy - Wholesale 78,830 47,052 54,980 53,476 51,482
Wholesale Gas 5,237 2,005 3,600 4,311 4,273
Irrigation 15,138 13,213 13,314 13,201 13,145
Other 1,913 4,383 6,237 4,315 5,173
Total Operating Revenue 390,952 341,976 342,967 344,266 378,273
Power Supply:
Purchased Power 80,532 58,027 50,537 54,718 55,237
Generation and Fuel 105,616 83,200 93,607 95,612 95,281
Total Power Supply 186,148 141,227 144,144 150,330 150,518
Other Electric O&M 25,144 25,207 26,008 28,032 26,512
Irrigation O&M 13,708 13,996 14,126 14,281 12,474
Public Benefits 4,384 5,119 4,732 4,722 5,457
Administration and General 29,608 27,639 26,687 25,612 24,786
Depreciation and amortization 69,159 65,276 65,793 65,001 64,567
Total Operating Expenses 328,151 278,464 281,490 287,978 284,314
OTHER INCOME (EXPENSE):
Interest/Derivative (loss)gain 3,100 6,534 6,723 4,049 3,230
Miscellaneous 11,956 11,117 10,278 14,099 10,028
Total Other Income 15,056 17,651 17,001 18,148 13,258
INTEREST EXPENSE
Long Term Debt 36,831 44,544 48,334 49,845 47,473
NET INCOME (LOSS) 41,026 36,619 30,144 24,591 59,744
NET POSITION:
BEGINNING OF YEAR (1) 451,756 415,138 384,994 360,403 310,814 END OF YEAR $492,782 $451,757 $415,138 $384,994 $370,558
DEBT SERVICE COVERAGE -
REVENUE BONDS/COP'S 4.22x 3.76x 3.54x 2.93x 2.81x
Government Accounting Standards Board (GASB) Statement No. 75, Accounting and Financial Reporting for Postemployment Benefits Other Than Pensions, was a adopted in 2018 and as a result beginning of year Net Position was restated as of January 1, 2018
AVERAGE CUSTOMERS AT END OF PERIOD:
Residential 75,238 74,376 73,978 73,730 73,381
Commercial 7,469 7,386 7,320 7,282 7,236
Industrial 883 876 883 878 860
Other (1) 10,326 21,346 21,085 21,060 20,853
Total 93,916 103,984 103,266 102,950 102,330
MWh SALES:
Residential 826,440 821,010 745,512 732,041 764,099
Commercial 141,141 134,617 134,018 132,867 133,967
Industrial 843,108 808,223 792,909 790,621 774,613
Other (1) 413,741 399,658 373,378 390,310 375,219
Total Retail 2,224,430 2,163,508 2,045,817 2,045,839 2,047,898
Interdepartmental meters 50,595 49,925 48,470 48,811 48,871
Wholesale Power 1,214,391 1,124,759 1,307,447 1,299,777 1,379,433
Total 3,489,416 3,338,192 3,401,734 3,394,427 3,476,202
SOURCES OF MWh:
Generated by district 2,171,463 2,182,107 2,136,572 2,062,189 2,251,144
Purchased 1,404,758 1,244,994 1,341,973 1,410,460 1,307,532
Subtotal 3,576,221 3,427,101 3,478,545 3,472,649 3,558,676
System losses 86,805 88,909 76,811 78,222 82,474
Total 3,489,416 3,338,192 3,401,734 3,394,427 3,476,202
Residential
$132,132 $130,991 $119,534 $117,429 $122,325
Commercial 19,993 19,186 19,039 18,886 19,013
Industrial 100,311 96,630 95,450 94,828 93,356
Other (1) 55,868 54,167 51,031 53,188 51,034
Power Supply Adjustment Recognized (Deferred) (18,813) (25,935) (30,235) (23,405) (23,443)
Rate Stabilization Transfer 0 0 9,570 7,506 41,370
Total Retail Energy 289,491 275,039 264,389 268,432 303,655
Electric Service Charges 323 246 409 502 489
Other Electric Revenue 20 38 38 29 56 Electric Energy Retail 289,834 275,323 264,836 268,963 304,200
Wholesale Power 78,830 47,052 54,980 53,476 51,482
Total $368,664 $322,375 $319,816 $322,439 $355,682
SYSTEM PEAK DEMAND (MW) 562 571 537 526
AVERAGE MWh SALES PER CUSTOMER
Residential 10.984 11.039 10.077 9.929 10.413
Commercial 18.897 18.226 18.308 18.246 18.514
Industrial 954.822 922.629 897.972 900.479 900.713
AVERAGE REVENUE PER MWh
Residential
$159.88 $159.55 $160.34 $160.41 $160.09
Commercial $141.65 $142.52 $142.06 $142.14 $141.92
Industrial
AVERAGE
$119.56 $120.38 $119.94 $120.52
$0.069
Includes agricultural and municipal water pumping and street lighting. During 2021, street lighting accounts were consolidated as the District migrated to a new utility billing system, resulting in fewer report customer accounts.
Includes depletion and depreciation on generation assets, excludes debt service.
General

 Brian Stubbert
Dan Severson


