Economic Impact Study 2024

Page 1

ECONOMIC IMPACT STUDY

ABOUT

TIFFIN UNIVERSITY

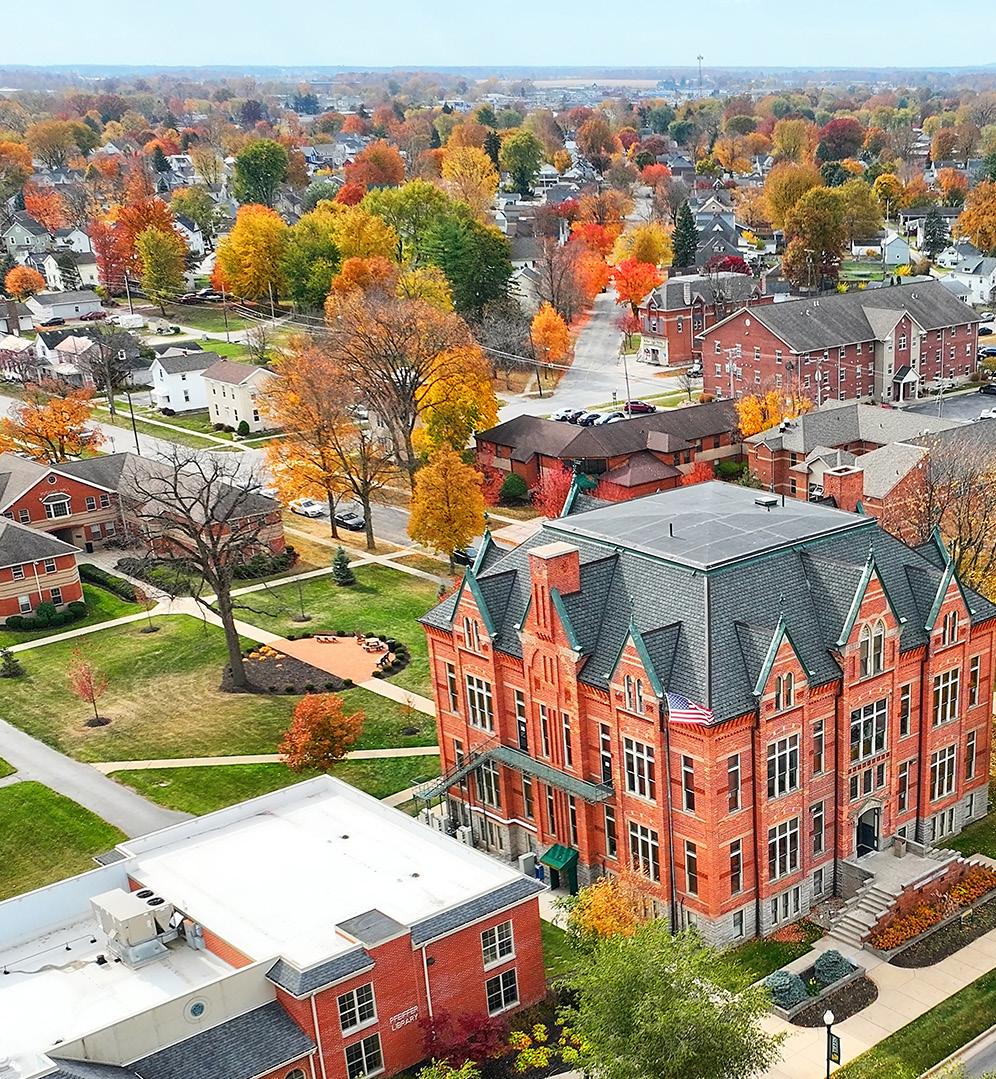
Tiffin University (TU) is an independent, private institution of higher education, chartered by the State of Ohio to award degrees at the associate, bachelor’s, master and doctorate level. Founded in 1888, Tiffin University is located in north-central Ohio, a 153-acre campus in Tiffin, Ohio that serves as a vibrant and warm home for a culturally diverse educational community. TU offers classes oncampus, online and in the countries of Romania and Switzerland, as well as Latin America.

Tiffin University’s programs are authorized by the Ohio Department of Higher Education and are accredited by the Higher Learning Commission (HLC), is one of the six regional accreditation bodies recognized by essentially all of the major public and private colleges and universities in America.

TU’s School of Business is accredited by the Accreditation Council for Business Schools and Programs (ACBSP). The ACBSP is a leading specialized accreditation body for business education supporting, celebrating and rewarding teaching excellence. Institutions with this accreditation are committed to continuous improvement that ensures their business program will give students the skills employers want.

Throughout history, TU has maintained its dedication to providing a professionally focused, learning-centered education to prepare students for successful careers and for productive and satisfying lives of excellence, leadership and service.

Top Programs: Business Management, Psychology: Human Services, Forensic Psychology, Exercise Science, Cyber Security and Computer Science

Degrees: Associate, Bachelor’s, Master’s and Doctorate

Budget: $42,131,536

Budget tuition and fees gross: $54,381,749

Budget tuition and fees net: $31,021,068

STUDENT ENROLLMENT

3,176 total student enrollment

TU SEATED ENROLLMENT

• Undergraduate - 1,354 students (approx. nine months on campus)

- On-campus - 825

- Commute - 529

- 250 commuters in Seneca County or nearby

• Graduate - 94 students (approx. nine months on campus)

TU ONLINE AND EXTENDED LEARNING

• Undergraduate - 722

• Graduate - 652

Non degree seeking - 354
1

TIFFIN UNIVERSITY OUR ALUMNI

Tiffin University’s living alumni - 14,746 Students employed or continuing education six months after graduation: 91%

Top Alumni Employers:

• Marathon

• Cuyahoga Community College

• Amazon

• Whirlpool Corporation

*per Live Alumni

TIFFIN UNIVERSITY OUR TEAM

• PNC

• Cleveland Clinic

• US Army

• Terra State Community College

Based on the survey, on average, an undergraduate student spends:

• $140 a month on groceries

• $84 a month at restaurants

• $330 a month on rent/utilities (for those who live off-campus)

• $40 a month on entertainment

• $34 a month on personal care

We can conclude that:

Number of full time faculty - 66

Number of staff - 186

• Walmart

• State of Ohio

• Progressive Insurance

Total salaries and benefits (from payroll) $23,284,527.26

Total paid to vendors in located in Seneca County $6,298,498.91

TU STUDENTS’ IMPACT ON OUR COMMUNITY

Based on the survey, on average, a graduate student spends:

• $712 a month on groceries

• $125 a month at restaurants

• $375 a month on rent/utilities (for those who live off-campus)

• $10 a month on entertainment

• $60 a month on personal care

• TU students spend a total of $4.165 million at local establishments.

• 50% of TU students have friends and family visit them in Tiffin. On average two to three people come 11 times a year and, on average, they stay for two days. A quarter of guests stay at local hotels for at least two nights a visit. Assuming three meals a day, at $20 each and at $120 a night at the local hotel, guests contribute at least $2.09 million to the local economy.

*Currently, available multipliers (multipliers that were used to calculate indirect and induced impacts) are for 2022.

• TU’s undergraduate students contribute 28,500 volunteer hours a year

• 100% of first-year students are involved in serving-learning projects

2

ECONOMIC IMPACT OF TIFFIN UNIVERSITY OPERATIONS ON SENECA COUNTY

DIRECT

Impacts generated as a result of spending on operations, capital expenditures, pay and benefits, student spending and visitor spending.

INDIRECT

The increase in demand for goods and services in industry sectors that supply or support the University, the students and visitors. (Often referred to as the supply chain.)

INDUCED

The third wave of impact created as a result of household spending by TU employees, students and suppliers. Induced impacts estimate the effect of increased household income, including housing, household goods, entertainment, food, clothing, transportation and other categories of personal spending.

IMPACT EMPLOYMENT LABOR INCOME VALUE ADDED OUTPUT Direct 4242.68 $24,781,697.27 $25,571,100.63 $29,767,231.12 Indirect 449.76 $18,500,541.28 $23,758,415.12 $38,819,552.07 Induced 104.65 $3,830,456.03 $8,671,097.76 $15,410,791.83 TOTAL 979.09 $47,112,694.57 $58,000,613.52 $83,997,575.02
RANK INDUSTRY DIRECT INDIRECT INDUCED TOTAL IMPACT 1 481 - Junior college, colleges, universities and professional schools 355.02 4.62 3.81 363.48 2 509 - Full-service restaurants 34.09 1.43 5.52 41.04 3 53 - Construction of new educational and vocational structures 40.36 0 0 40.36 4 447- Other real estate 5.8 13.04 2.39 21.23 5 517 - Personal care services 16.52 .03 1.8 18.35 6 406 - Retail - food and beverage stores 6.5 .06 3.79 10.35 7 510 - Limited-service restaurants .01 .47 8.2 8.67 8 511 - All other food and drinking places 0 1.14 3.61 5.01 9 521 - Religious organizations 1.22 0 3.52 4.74 10 448 - Tenant-occupied housing .47 0 3.43 3.89 OVERAL TOTAL 477.23 42.21 104.65 624.10 3

(Top 10 industries, based on total output impact)

4
TU’S IMPACT ON INDUSTRIES OUTPUT IN SENECA COUNTY, OHIO IN 2022
DESCRIPTION FEDERAL TOTAL STATE TOTAL COUNTY TOTAL SUB COUNTY (SP. DIST.) TOTAL SUB COUNTY (GENERAL) TOTAL Social insurance tax: employee contribution $1,676,174.30 $32,150.91 Social insurance tax: employer contribution $1,393,610.22 $32,976.86 TOPI: Excise taxes $55,944.85 TOPI: Custom duty $62,325.86 TOPI: Sales tax $1,315,307.55 $131,884.68 $1,950.09 TOPI: Property tax $140,947.32 $72,626.76 TOPI: Motor vehicle license $10,743.01 $2,613.09 TOPI: Severance tax $4,145.16 TOPI: Other taxes $64,821.56 $517.65 $132.42 $2,975.69 TOPI: Special Assessments $6,347.92 $4,864.06 OPI: Corporate profits tax $353,162.57 $21.80 Personal tax: Income tax $1,654,015.19 $275,064.96 $27,474.10 $129,154.43 Personal Tax: Estate and gift tax Personal tax: Motor vehicle license $8,042.70 $1,145.76 Personal tax: other tax (fish/hunt) $4,878.14 TOTAL $5,195,233.00 $1,748,152.65 $279,697.57 $599,202.39 $215,329.89
RANK INDUSTRY DIRECT INDIRECT INDUCED TOTAL IMPACT 1 481 - Junior colleges, colleges, universities and professional schools $17,801,770.93 $232,803.24 $191,295.69 $18,225,869.85 2 53 - Construction of new educational and vocational structures $2,760,611.30 0 0 $2,760,611.30 3 449 - Owner-occupied dwellings 0 0 $2,060,736.64 $2,060,736.64 4 509 - Full-service restaurants $1,085,358.26 $45,587.38 $175,838.33 $1,306,783.97 5 441 - Monetary authorities and depository credit intermediation $14,043.70 $272,952.53 $582,571.51 $869,567.74 6 406 - Retail - Food and beverages stores $357,745.07 $3,330.20 $208,710.57 $569,785.84 7 413 - Retail - Nonstore retailers 0 $11,064.45 $121,653.89 $465,718.34 8 447 - Other real estate $108,595.36 $244,332.23 $44,832.24 $397,759.82 9 490 - Hospitals 0 0 $362,352.12 $362,352.12 10 47 - Electric power transmission and distribution 0 $193,261.29 $162,963.44 $356,224.73 OVERAL TOTAL $23,506,375.79 $2,538,612.71 $8,671,097.76 $34,716,086.26 TU’S VALUE ADDED COMPONENTS BY INDUSTRY (Top 10 industries by total value added)
RANK INDUSTRY CODE DESCRIPTION TOTAL EMPLOYMENT TOTAL OUTPUT TOTAL INTERMEDIATE INPUTS TOTAL VALUE ADDED LABOR INCOME 1 510 Limitedservice restaurants 1,229.35 $114,596,406.12 $70,639,129.65 $43,957,276.47 $25,837,289.29 2 542 *Employment and payroll of local govt, education 1,201.81 $93,909,791.79 $0 $93,909,791.79 $79,250,373.26 3 544 *Employment and payroll of local govt, other services 721.5 $52,891,676.02 $0 $52,897,676.02 $44,442,379.81 4 447 Other real estate 649.94 $93,570,721.02 $81,392,740.97 $12,177,980.05 $3,751,976.82 5 193 Other plastics product manufacturing 620.56 $211,996,512.79 $151,990,282.36 $60,006,230.43 $41,767,361.27 6 509 Full-service restaurants 598.83 $45,826,353.90 $26,758,810.87 $19,067,543.03 $11,351,286.52 7 2 Grain farming 598.51 $108,489,673.12 $78,907,186.44 $29,582,486.68 $16,530,288.41 8 347 Motor vehicle gasoline engine and engine parts manufacturing 575.54 $364,822,992.82 $318,253,678.48 $46,569,314.34 $40,390,563.79 9 481 Junior colleges, colleges, universities and professional schools 554.7 $40,690,774.03 $12,876,272.54 $27,814,501.49 $22,218,900.92 10 491 Nursing and community care facilities 554.3 $43,873,836.59 $19,387,554.12 $24,486,282.41 $22,505,429.08 INDUSTRY SUMMARY FOR SENECA COUNTY, 2022 (Top 10 industries based on total employment) 6

Turn static files into dynamic content formats.

Create a flipbook
Issuu converts static files into: digital portfolios, online yearbooks, online catalogs, digital photo albums and more. Sign up and create your flipbook.