
25 minute read
Being COUNTER-Productive Developing Strategies and Workflows for Processing and Standardizing E-Resource Usage Data
Being COUNTER-Productive
Developing Strategies and Workflows for Processing and Standardizing E-Resource Usage Data
By Kate Reagor, MSIS
INTRODUCTION
The aim of this paper is to offer instructions and best practices on how librarians can use OpenRefine to automate the majority of the cleanup work required to put monthly e-resource usage reports into a consistent and usable format: standardized across metric types and able to be imported into data visualization software. Some basic coding functions will be described, but no coding knowledge or prior experience with OpenRefine is required. The examples used within are COUNTER 5 format Database Reports and discussion around converting metrics will focus on these standards, but the methodology may be adapted to any desired format.
The techniques described here were developed as part of a graduate capstone project at the UT Austin School of Information: Developing an e-Resource Usage Dashboard for Texas Libraries (Reagor 2020), which involved working with the TexShare Databases program at the Texas State Library and Archives Commission (TSLAC) to develop new methods to process and display consortia-level e-resource usage reports.
OPENREFINE
OpenRefine is a long-standing open source tool designed for data cleanup and transformation. The program is available for free at https://openrefine.org/ and, though it operates through your browser, all data stays private and remains on your machine (“OpenRefine” 2021).
OpenRefine is a popular tool among catalogers for cleaning messy metadata files, but it contains another feature that should be of particular interest to staff who manage their library’s usage data – one that makes the automation of processing regular reports possible. In brief, a user may import a usage spreadsheet, work through a series of transformations until the data is in the proper format, and then export all of those transformation steps as a block of JSON code. This code block can be saved and, when applied to future iterations of that same report, will instantly apply all of the same transformation steps. In the case of the TexShare program’s usage reports, this transformed a days-long monthly task involving 12 reports into a process that took approximately 30 minutes.
SETUP AND BEST PRACTICES
Before you get started processing your first usage report, there are a few steps worth taking to ensure that the workflow creation process goes smoothly, and that the resulting code is robust and applies properly to future reports.
Document Everything as You Go
Every usage report will require a number of steps to be taken outside of the saved workflow, and each should be documented and saved in a procedure. These are the tasks that can’t be automated, such as: • How many non-data header rows OpenRefine should remove during import. • If a report has known inconsistencies that should be checked and fixed before import, such as columns
changing names or order. • If any manual cleanup is required after applying the code, such as adding the report date if that data is not included in the file.
These workflows are designed to be run regularly – ideally on a monthly basis. Creating these procedures as you go and keeping them up to date will ensure that the process goes smoothly every time it’s repeated.
Keeping Track of Files
Following the process presented here means you will end up with at least two files for each report: a procedure and the saved transformation code. Considering how many reports most libraries get, these files can add up after a while. Additionally, the code itself must be saved as a text file. If you save it in Word, the changes it makes will absolutely break it. With this in mind, I recommend saving all procedures and codes as individual text files, saved together in a single folder, and then viewing them using a free text editor called Atom.
Atom allows you to open all files in a folder as a “project”. All available files are displayed in a navigation bar on the left, and open files as tabs across the top. This allows you to quickly work your way through the procedure and code files for each report without the need to search for individual files or switch between windows.
Figure 1. Atom text editor displaying usage file transformation procedures and code.
Checking Transformations for Repeatability
It’s important to note that not every change made in OpenRefine will carry over when you apply the transformation code to the next report. It can be frustrating to do the work of processing an entire report and then applying those changes to the next one, only to discover that something didn’t apply correctly and now the whole thing is messed up.
A good rule of thumb is to favor broader changes and avoid small, manual ones. Changes to individual cells or manually selected rows don’t translate well across reports, but broad filters (called “facets” in OpenRefine) based on defined criteria do. But the most reliable way to ensure that all transformations will apply properly to future reports is to work with two of that vendor’s reports simultaneously.
To do this, open reports from different months in separate browser windows. As you work through cleaning one file, stop periodically to export the steps already taken: in the Undo/Redo tab, click Extract and copy the text there. Navigate to the second report, revert it to “0. Create Project” in Undo/Redo if needed, then click Apply and paste the copied code. If all looks well, return to the first report and continue. If not, backtrack and find a different way to make the necessary changes.
While this may sound like a complicated and onerous process, remember that the goal is to automate the cleanup of all future reports. That initial investment of effort means that particular report will likely never
DATA TRANSFORMATION DESTINATION
The final step before you start transforming your data is to decide what you want your fully cleaned and processed data to look like. Ideally this configuration should allow you to combine the data from all of your usage reports into a single file or database, in a layout suited for analysis or visualization. For this purpose, the best configuration is something called the Entity-Attribute-Value Model, or “Narrow Data”.
Wide Data
To understand Narrow Data, we must define Wide Data. As demonstrated in figure 2, wide data describes datasets where every distinct variable has its own column. It’s human readable, but it makes combining different datasets difficult and data visualization software can’t understand it. Note too that important information, such as the vendor name and report date, may be in the header or file name but not in the data itself.
Figure 2. An example table demonstrating wide data.
Narrow Data
Narrow data, on the other hand, is designed to be machine-readable rather than human-readable. It’s difficult to scan by eye but works well with data visualization and analytics software. Note in figure 3 that every row contains all of the information needed to understand the data presented in that row, without having to refer to a header row or file name for context.
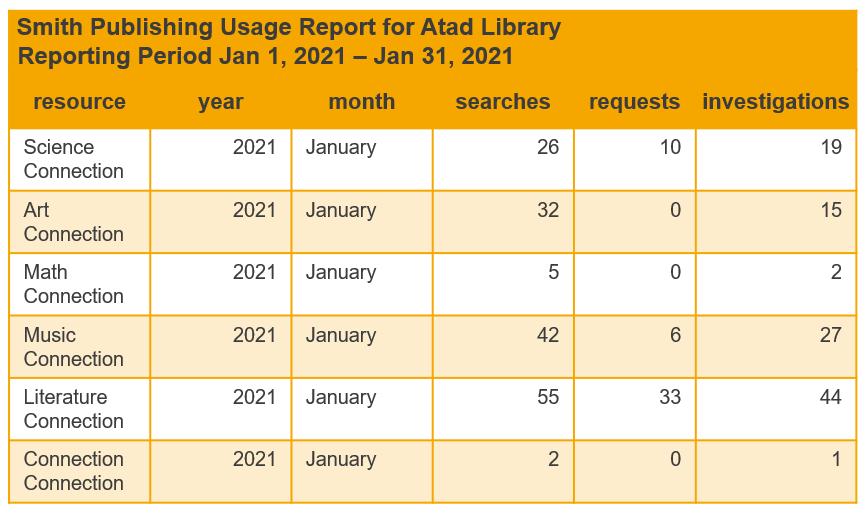
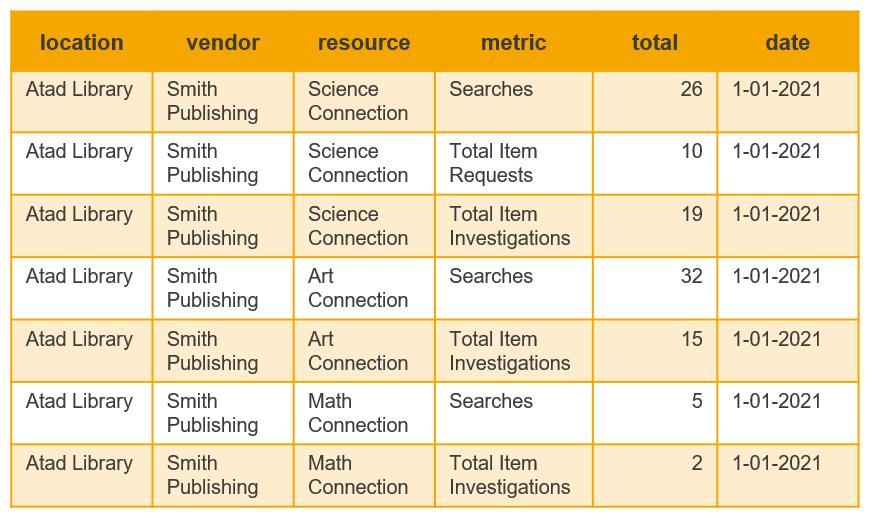
Figure 3. An example table demonstrating narrow data.
Data in this format can be combined with data from other reports without any loss of information, because each row indicates which library location, vendor, and resource the usage number belongs to, what type of use it indicates, and which month it’s from. And if you do sometimes need the data displayed in readable tables, it’s easy to convert it back to table format using data visualization software or Excel pivot tables.
TRANSFORMING COUNTER 5 REPORTS
When you’re ready to start processing reports, it helps to begin with the ones that require the least amount of cleanup. For most libraries this will be those reported in COUNTER 5 (C5), both because it is the primary accepted usage reporting standard, and because it is already very nearly in the narrow data format that is our goal. Keep in mind that, though this demonstration uses C5 Database Report metrics, these procedures can be adapted to other reports and metrics as well.
Configure Parsing Options
To begin, open OpenRefine and click Browse to select your file. OpenRefine will prompt you to select a few pre-import configuration options before continuing. Here you can choose to eliminate non-data header rows or whether to use the top row as column names or keep them as part of the data.
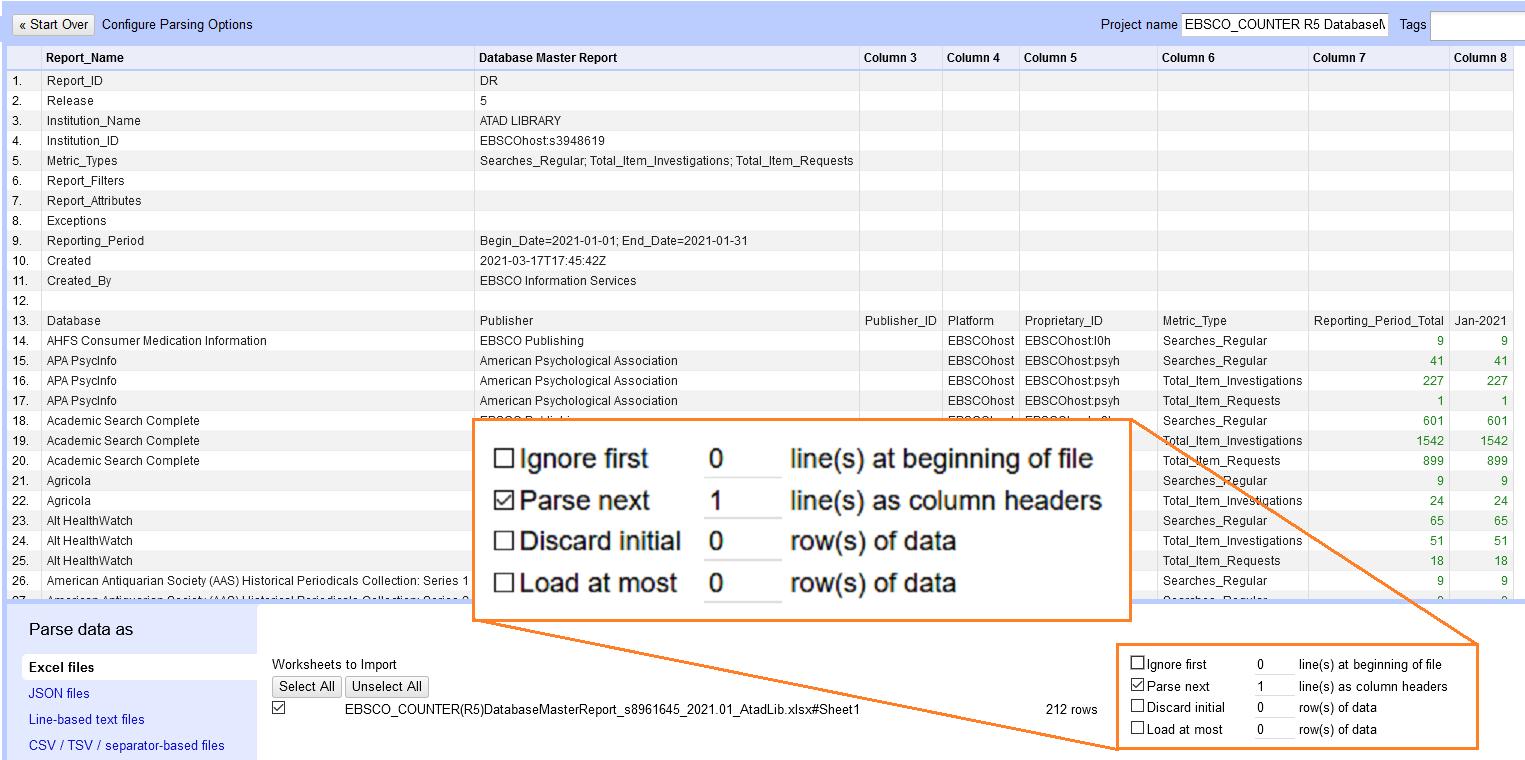
In the case of this EBSCO report (figure 4) the useful data begins on row 13, so you would check “Ignore first” and set it to 13 lines. This sets row 13 as the column names, but in this case we don’t want that. One strange quirk of COUNTER 5 is that it saves the report date as a column name rather than as an attribute within the dataset itself. If we want to combine reports from multiple months, then we need that date in our data. But it’s difficult to pull data from column names in OpenRefine, so instead we uncheck “Parse next”. Now those column names will be included in our data as our first row. This done, you can click Create Project to proceed.
If you plan on working with two reports simultaneously, this is a good time to import a second report using these same steps. In your current project, click “Open…” in the upper-right to open a second project in a new tab.
Bringing the Date into the Data
COUNTER 5 reports are already very close to being narrow data. You can see in figure 5 that each row already contains most of the necessary information: database name, metric type, and the total for that reporting period. But there needs to be a column for the report date.
Figure 5. A usage report in OpenRefine with column names, including the report date, in the first row.
While we could easily type in and paste the date by hand, our goal is to create a process that will convert and populate that date automatically for any report, with no need for manual entry. Instead we need to accomplish the same thing using broad transformations.
The first step is to clear all cells underneath the cell with the date, which can be done using a facet. Facets work like a filter, allowing transformations to be applied only to targeted selections. Here we will use a numeric facet on the date column to select and clear any cells in that column that are formatted as numbers. Click the arrow on the date column and select Facet > Numeric facet. This will bring up a facet selector on the left (see figure 6).

Figure 6. A numeric facet selector in OpenRefine
Note that the facet indicates that the column contains many cells with numeric data, but only one with nonnumeric data. That last one is our date. Deselect the non-numeric box and you’ll see that the rows displayed on the screen have been updated to show only those which contain numeric data in that column. Only the displayed rows will be affected by the following step. Click the arrow on that column, then select Edit cells > Common transforms > To null. Close the facet by clicking the “x” next to the facet box, and now you’ll see only the date above empty cells.
Before moving on there is one more step that needs to be taken. Because of how OpenRefine saves facet information in the code, it will define the upward limit for the facet as the largest number represented in this particular report. If a future report contains a higher number, those cells won’t be cleared. Fortunately, there is a workaround.
After clearing the cells, go to the Undo/Redo tab and click Extract to open the Operation History (see figure 7). Note in the code that the facet is defined as numbers ranging from 0 to (in this case) 1600. If any other transformations have been applied prior to this, make sure to only select this particular step. Click inside
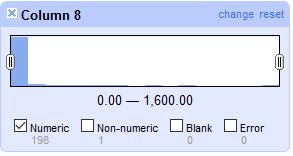
the box with the code and change the second number to something significantly higher, such as “20000000” (with no commas). Select and copy all code in the box, then close the operation history window. In the Undo/ Redo tab, select the step immediately above the currently selected one to “undo” the step that cleared the numeric values. Then click Apply, paste the copied code into the box, and click Perform Operations. The numeric values will once again disappear, and this code will now work with all future reports regardless of usage numbers.
Figure 7. OpenRefine Extract Operations History box, showing how a numeric facet is represented in the code.
The next step is to convert the text string representing the date (e.g. Jan-2021) into something software programs will recognize as a date (e.g. 1-01-2021). OpenRefine does have some built-in functionality for converting text into DateTime format, but it doesn’t work very well in this particular instance. For C5 reports, what ultimately worked best was to write some basic code in OpenRefine’s coding language (GREL) that would look at each month’s abbreviation and replace it with the appropriate numbers for month and day, but preserve the year as is. The resulting code was as follows:

value.replace(‘Jan’,’01-01’).replace(‘Feb’,’02-01’).replace(‘Mar’,’03-01’). replace(‘Apr’,’04-01’).replace(‘May’,’05-01’).replace(‘Jun’,’06-01’). replace(‘Jul’,’07-01’).replace(‘Aug’,’08-01’).replace(‘Sep’,’09-01’). replace(‘Oct’,’10-01’).replace(‘Nov’,’11-01’).replace(‘Dec’,’12-01’)
The solution is a bit brute force, but it will properly convert the date from any COUNTER 5 report. Apply the code by selecting the date column, then Edit cells > Transform. Paste the code into the box, then click OK. Finally, populate the date throughout the column using Edit cells > Fill down.

Figure 8. Usage report in OpenRefine with a column containing properly formatted and populated dates.
This done, the row of former column names may now be cleared out. Choose a column name, such as “Metric_Type”, and facet that column using Facet > Text facet. In the facet tab next to Metric_Type, click “include”. You should now see only that top row. Now click the arrow next to All, on the far left, and select Edit rows > Remove matching rows. Close the facet, and that row will be gone.
Now all that remains is to configure the columns. First remove any unnecessary columns using Edit column > Remove this column. Next add new columns containing additional desired information, such as the vendor name itself and, if working with multiple library accounts or locations, the location name or identifier. Columns such as these, which will contain the same information in every row in the report, can be added by selecting any existing column and clicking Edit column > Add column based on this column. In the box that opens (see figure 9), give the column a name – in this case “vendor”. Erase the default text and input the desired text, encased in double-quotes to indicate it is a text string. Click OK, and that text will appear in every cell in the new column. (Note that empty columns can also be populated by editing a single cell and selecting “Apply to All Identical Cells”, but this action will not be saved in the Operation History, and therefore will not apply to future reports.)

Finally, rename any unnamed columns (Edit column > Rename this column), and move the columns into the desired order (using the move options under Edit column, or select All > Edit columns > Re-order/ remove columns). The specific names and order aren’t important so long as they’re consistent across all reports.
Figure 10 shows an example of a fully processed report. It contains columns identifying the library location, vendor, specific resources or databases, the types of use recorded, the total number of uses, and the month in which the use happened. Configured this way, the data can easily be combined with reports from additional months or vendors. It may be loaded as-is into a database or consolidated spreadsheet, and from there connected to data visualization software or further manipulated in Excel using graphs or pivot tables. The data can be grouped to show total aggregated usage numbers by vendor, broken out by individual resources, or grouped by dates to show total use by quarter or fiscal year.
Figure 10. A fully transformed usage report in OpenRefine, ready for export.
Exporting the Code
Once all transformations are complete and have been confirmed to work on other iterations of the same report, it’s time to save the transformation code itself. Go to the Undo/Redo tab and click Extract to open the Extract Operations History box. Making sure that all steps are selected and none are grayed out, copy the entire block of code and paste it into a text file. When future reports arrive, the code can be applied by clicking Apply in the Undo/Redo tab and pasting that code back in.
CONVERTING NON-STANDARD METRICS
COUNTER 5 reports are relatively easy to process but cleaning up non-standard reports can get a little more complicated. Not all vendors have migrated to the C5 standard, and some e-resources are designed such that the COUNTER metrics cannot be applied. This presents a challenge for offering straightforward instructions for processing non-standard reports, as each report will require its own unique approach and assessment. Still, the process will always break down into two distinct tasks: 1. Evaluate the metrics in the report and develop a crosswalk for converting them to an estimated equivalent to the desired usage metrics (e.g. COUNTER 5). 2. As with the COUNTER 5 reports, work through the steps required in OpenRefine to transform the report into the desired configuration.
In order to create a metric crosswalk, it is first necessary to understand exactly what is being counted by the metrics you’re using as your baseline. In the case of COUNTER 5 Database Reports, the primary usage metrics are Searches (Regular or Federated), Total Item Requests, and Total Item Investigations. Searches are fairly straightforward, so we’re going to focus on the latter two.
According to Project Counter (2021), the Total Item Requests metric counts instances of access to full-text objects or their equivalents: HTML or PDF full-text articles, video or audio content, images, etc. The Total Item Investigations metric includes all uses under the Total Item Requests umbrella, as well as any views of additional information around those objects: views of abstracts or previews, views of cited references, linkouts, etc.

With this in mind, an equivalent to Total Item Requests would be any and all counted views of objects which are that resource’s equivalent to full-text or media items. These might be accesses
to
or
Figure 11. Graphic detailing what is contained within COUNTER 5 Investigations and Requests metrics (Project Counter 2021). car manuals in ChiltonLibrary, legal documents in a Legal Forms resource, views of scanned documents in genealogy or other primary source resources. If a resource offers more than one such metric, then those metrics may be totaled together to get the Total Item Requests equivalent.
Next, an equivalent to Total Item Investigations may be calculated by identifying any metrics measuring views of non-full-text material such as abstracts or previews and adding these metrics together with the Total Item Requests. If no such metric exists in that resource, then simply leave both

Requests and Investigations as the same number for that resource.
Of course, not all reported metrics must be included in the final processed report. Many reports continue to include Sessions as a metric, but COUNTER 5 does not include an equivalent to this metric. If C5 is your baseline standard, then these metrics may be discarded. Note, too, that not all resources will report equivalents to all desired metrics. Many resources do not include search functions, and therefore do not report searches. If that is a metric you wish to report, then it may have to be left blank for that resource.
To illustrate this process, I will give a few examples of crosswalks developed for non-standard reports. For LearningExpress Library, an equivalent to Total Item Requests could be considered the sum of accesses to all tests, tutorials, ebooks, and computer courses accessed that month. The “page hits” metric counts user views of individual pages in the resource, each of which contains summary information on what is contained within that section. Because this serves a similar function to an abstract or preview, that metric could be added to the previous count to indicate an equivalent to Total Item Investigations. The sessions and new user account metrics do not fit into the C5 metrics and can be discarded. The resource does not have a search function, and therefore Searches is left blank. ChiltonLibrary, on the other hand, only reports two metrics: Searches and Retrievals. Searches may translate directly, but without any abstract or preview function Retrievals must be counted for both Requests and Investigations.
Most vendors offer documentation on how their metrics are counted, which can be useful in developing these crosswalks. If questions remain, speaking to the vendor directly about their usage reports can yield additional information. But ultimately it is less important for the crosswalks to be perfect than for them to be consistent, transparent, and well-documented. It is vital to keep clear and descriptive documentation of how the report metrics are converted and what is counted for each, in case questions arise at a later date. If an issue is discovered necessitating changes to how the report is converted, then the data can always be reprocessed at that time.
TRANSFORMING NON-STANDARD REPORTS
Processing non-standard reports in OpenRefine can be slightly trickier than the more standardized COUNTER 5 reports. Because each requires developing its own custom approach, I will stick to offering suggestions for managing a few common transformations likely to be required when dealing with these reports.
Converting Wide Data to Narrow
As mentioned previously, wide data refers to reports in which every variable in a spreadsheet is given its own column. Converting these datasets into narrow data in Excel is time-consuming and typically requires multiple rounds of copying and pasting. Fortunately, OpenRefine makes this process much easier. When working with a report resembling the one in figure 12, OpenRefine can take the data from any selected columns and transpose them into two new columns: one for the attribute (for which it will use the column names) and one for the corresponding value (the numbers contained in those columns).

Figure 12. A dataset in OpenRefine presented in wide data format, with separate columns for the three usage metrics.
First, make sure that the columns are named using the exact text you want to be placed in the new metric type column. Then select the arrow for the first column, and then Transpose > Transpose cells across columns into rows. In the box that opens, select all columns to be included, check the option to transpose the data into two new columns, then name the key column and value columns according to your standard layout. In this case I used “metric_type” and “reporting_period_total” (see figure 13). Because this will create new rows in your dataset, make sure to check the option to “Fill down in other columns”, so that data from unaffected columns such as vendor and database name will populate down.
Figure 13. An option box in OpenRefine for choosing details related to transposing data across columns into rows.
Once complete, the data should appear as in figure 14, with one column describing the usage type, and one indicating the total. Note that this conversion will often result in a significant number of rows reporting a use total of “0”. Because an absence of data is also counted as zero, these rows are unnecessary and increase the size of the file. It’s best to simply remove these rows using a text facet on the number 0, then deleting all matching rows.


Totaling Across Columns
Sometimes before converting wide data reports to narrow, it’s necessary to add some metrics together to get the total equivalent numbers for Requests and Investigations. Though OpenRefine does have a “Join Columns” function, it primarily works to combine text strings rather than add numbers. Totaling several rows of numbers will require a little bit of coding, but fortunately the code itself is simple and can be easily adapted to any situation.
Click the arrow for any column which will be included in the final total. Select Edit column > Add column based on this column. In the box that opens, fill in the name for the new column to be created (in Figure 15 this is Total_Item_Requests). Then, in the Expression box, type the code telling OpenRefine which columns to add together. The basic format for this is: value (indicating the value listed in the selected column) + cells[‘ColumnName’].value (indicating the value for the cells in the listed column name). Any number of columns can be strung together using this pattern. The example given in figure 15 uses the following code to add the values of columns “TestsAdded”, “TutorialsAdded”, “eBooksAdded”, and “ComputerCoursesAdded”, with the “ComputerCoursesAdded” column being one initially selected when creating a new column:
value + cells[‘TestsAdded’].value + cells[‘TutorialsAdded’].value + cells[‘eBooksAdded’].value
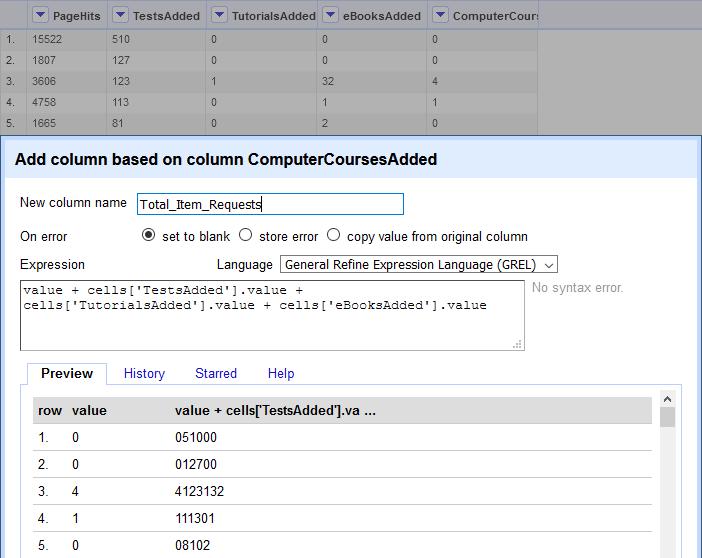
Figure 12. An option box in OpenRefine for creating a new column based on adding the totals from other columns.
The preview allows you to see what the resulting column will contain. However, note in figure 15 that the values shown are not an added total, but instead individual values placed together as a text string. This is because those columns are formatted as text rather than numbers. Luckily this is an easy fix. Text may be converted to numerical format using Edit cells > Common transforms > To number. Try the same process again after converting all columns to numbers, and it should add all cell values together properly (see Figure 16). The same process may then be repeated to add the new Total Item Requests column to the PageHits column to get Total Item Investigations. Lastly, delete all excess columns, then transpose the metrics and values into narrow data format as before.
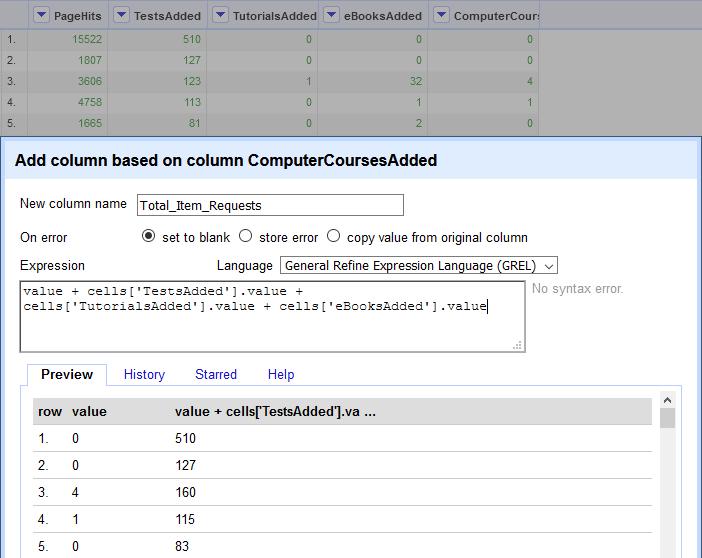
Figure 16. An option box in OpenRefine for creating a new column, with totals combining as numbers rather than text.
PROCESSING CONSORTIAL REPORTS
Finally, I will briefly touch on a few tips for processing consortial reports that contain usage for multiple locations. Vendors typically differentiate between these locations using their own unique IDs and naming conventions that aren’t consistent across reports. Luckily, OpenRefine can also automate replacing these with a more standardized ID or naming structure.
The first step is to create ID crosswalks for every distinct vendor or platform ID. Note that it’s best to create these as separate files, in case different vendors use overlapping ID numbers. Each crosswalk is a spreadsheet containing columns for: known vendor IDs, the location each corresponds to, and the persistent ID and/or name the consortia assigns to that location. If multiple vendor IDs need to be assigned to a single location (e.g. branch locations whose usage should be counted towards the system), then add additional columns for branch locations and IDs, with the main ID and location columns containing information indicating which location their usage totals will be counted towards.

Figure 17. An example Vendor ID Crosswalk.
Once these crosswalks are set up, they can be uploaded into OpenRefine as their own projects. I recommend giving these crosswalks a tag, such as “crosswalk” to make them easy to find in case updates are required. These crosswalks can then be used to connect vendor IDs within the monthly reports to the appropriate consortia ID or location name in the crosswalk using a function called “Cell Cross”.
To start, find the column in the report containing the vendor IDs and select Edit column > Add column based on this column. The cell cross function is constructed as follows: cell.cross(‘Name of ID Crosswalk Sheet’, ‘Name of Vendor ID Column in that spreadsheet’).cells[‘Name of Consortia ID Column in that spreadsheet’.value[0].
Thus if the ID Crosswalk Spreadsheet was saved in OpenRefine as “VendorID Crosswalk EBSCO”, and contains columns named “VendorID” and “ConsortiaID”, then the function would be:
cell.cross(‘VendorID Crosswalk EBSCO’,’VendorID’).cells[‘ConsortiaID’]. value[0]
This will match each vendor ID with a consortia ID and populate the latter into a new column. If a match is not found that cell will remain empty, so be sure to check for blanks and update the crosswalks as needed.
Note also that the cell cross function does not always work properly with numeric values, so it may be necessary to convert numeric IDs into text using Edit cells > Common transforms > To text. Occasionally the resulting text strings will have a “.0” at the end. These may be removed using Edit cells > Transform and entering the following code:
value.split(‘.’)[0]
This splits the values in half using the period and keeps only the first half.
FUTURE WORK AND DEVELOPMENT
Of course, not every transformation can be anticipated, and some reports are more difficult to process than others. And it may be that some steps simply can’t be automated and must be performed manually after applying the transformation code (just make sure to note these in the procedure). Fortunately, OpenRefine is a widely used program, and information on how to perform more complex tasks can often be found using a web search. But even with its limitations, OpenRefine offers immense potential for automating data processes and cutting down time spent manually cleaning and rearranging monthly reports.
TexShare Program staff intend to continue exploring the potential for using OpenRefine workflows to process consortial usage data and make the standardized reports available to its members through an online dashboard. Any questions related to this project may be directed to TexShare@tsl.texas.gov.
Kate Reagor is a Library Technical Services Specialist for the TexShare Databases Program at the Texas State Library and Archives Commission.
REFERENCES
“OpenRefine,” OpenRefine, accessed May 5, 2021, https://openrefine.org/. Project Counter. “Release 5: Understanding investigations and requests.” Accessed May 7, 2021, https://www.projectcounter.org/release-5understanding-investigations-and-requests/. Reagor, Kate. “Professional Experience Project: Developing an e-Resource Usage Dashboard for Texas Libraries.” Last modified July 31, 2020. http://katereagor.net/capstone.html.


