Is the Budget Inertia of Washington, DC Being Changed?
Isaac Newton’s first law of motion states that, “an object at rest stays at rest and an object in motion stays in motion with the same velocity and in the same direction unless they are acted upon by an outside force.” Stated another way, inertia is the resistance an object has to a change in its state of motion. It is also true that the tendency of an object to resist changes in its state of motion depends directly upon the mass of the object.
If you kick a golf ball that is sitting on the ground it will travel a good distance, but if you try to do the same to a bowling ball you are more likely to break some toes than to move the bowling ball any significant distance.
When the Department of Government Efficiency (DOGE) was announced, I was immediately skeptical that this initiative could make a dramatic change in the way the federal government handles the public purse. Washington, DC or as I like to call it, “Versailles on the Potomac,” is an entrenched ecosystem of bureaucracy fueled entirely by American taxpayers.
As we wrote in the previous U.S. Forecast : “Government Efficiency or DOGE. The primary goals of DOGE include:
- Dismantling government bureaucracy
- Slashing excess regulations
- Cutting wasteful expenditures
- Restructuring federal agencies.
DOGE will be led by Elon Musk and Vivek Ramaswamy and Trump has set a deadline for DOGE’s work to conclude by July 4, 2026, aligning with the 250th anniversary of the signing of the U.S. Declaration of Independence.
This sounds like exactly what is needed to address
head-on the problem of the national debt and the rising burden of servicing that debt. However, the reality of implementing drastic changes to the federal government may prove to be a much greater challenge than forming the committee.
Making substantive changes to the federal government would require legislative action by the House and Senate. Can DOGE navigate the complexities of the legal, political, and bureaucratic landscape of Washington, DC?
As recommendations come out this committee, rest assured there will be push-back on these proposals. The bureaucracy will fight any big changes tooth and nail, scrambling and mustering all resources to prevent the changes from taking place. They will be aided and abetted by legislators working to prevent changes that could adversely impact their political supporters and constituencies, most of whom have an entrenched interest in the status quo.
I must admit I am quite skeptical of the committee’s ability to usher in significant changes to the federal government. I suspect it will turn into a beltway version of dodge ball, with the bureaucracy and its supporters frantically running around trying to avoid getting hit by the DOGE ball. Like in any elementary school physical education class, I think there will be lots of shouting and chaotic movement as this committee proceeds over the next two years. Unlike the staple of gym class, at the end of this game there will not be just a single player standing and much of the system will remain intact.
Dramatic changes are necessary for the federal government in the face of mounting debt and the increasingly untenable interest rate burden that comes with it. I am not sure that the DOGE committee will be able to deliver the necessary changes needed to resolve our debt crisis.
I would, however, be delighted to be proven wrong.”
I recall going to a conference in DC in the Spring of 2010. Florida’s economy was in shambles; the unemployment rate was 12%, the housing market had collapsed and a wave of foreclosures, abandoned homes and prices that had plunged nearly 50% in many locales and new construction had ground to a halt.
When I got to Washington, it felt like I was in another country. The greater DC area was absolutely booming. Construction cranes and ongoing housing projects dotted the landscape, and it felt like the region was nearly immune to the recession that had wracked the rest of the country. It was surreal.
This was not a temporary phenomenon. Three of the five wealthiest counties in the United States are in the greater DC area1. What is the source of all this wealth? It is, of course, the federal government, funded by tax dollars and debt.
My concern laid out above from our previous U.S. Forecast was essentially that DOGE would not have enough force to overcome the inertia that the federal bureaucracy has built up over decades.
I am still somewhat skeptical that a full reversal of this trajectory is possible eventually, but the revelations that have been made by DOGE analysis have brought to light the modus operandi of Washington in a way that had been greatly obscured historically. I think that this process will reduce the growth of government spending, but I am less confident that it will be a permanent change to the rudderless budget process in our nation’s capital.
For now, the bowling ball is moving, how far it goes remains yet to be seen.
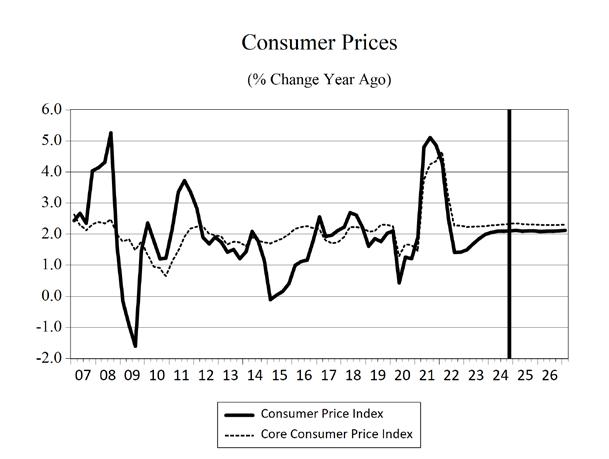
ANXIOUS INDEX
Recession Fear Remains Subdued
The most recent release (1st quarter of 2025) of the Survey of Professional Forecasters by the Federal Reserve Bank of Philadelphia states that the forecasters surveyed for the publication put a 15.37% chance that a decline in real GDP will occur in the
2nd quarter of 2025. This is the lowest reading of the anxious index in three years.
One section of the Survey of Professional Forecasters asked panelists to estimate the probability that real GDP will decline in the quarter in which the survey is taken, as well as the probabilities of a decline in each of the following four quarters. The anxious index is the estimated probability of a decline in real GDP in the quarter after a survey is taken. In the survey taken in January for the 1st quarter of 2025, the index stands at 15.37, meaning forecasters believe there is a 15.37% chance that real GDP will decline in the 2nd quarter of 2025. This is up from 14.95% in the survey taken in the 4th quarter of 2024.
The graph plots the historical values of the anxious index, where the gray bars indicate periods of recession in the U.S. economy. The current level of the anxious index is slightly more than 1.7 points higher than the average level during the 2009-2020 economic recovery (13.63).
GDP OUTLOOK
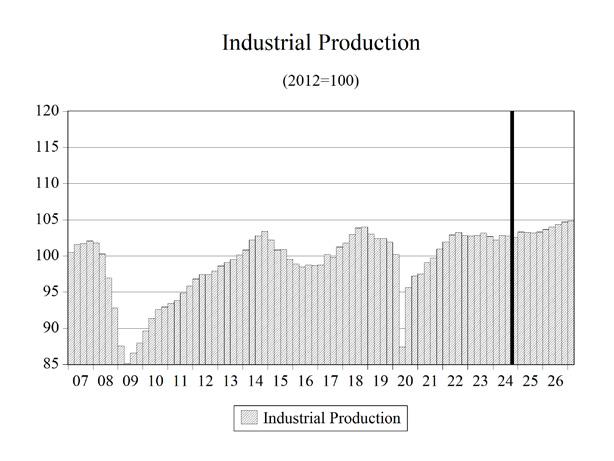
The negative growth we are projecting for federal government spending is going to have an impact on overall real GDP growth for the next several years. There is a high level of uncertainty in the economy with the frenetic pace of activity in the initial weeks of the Trump administration. Until the dust settles and markets can discern what the “new normal” might look like, the level of uncertainty will persist and so will the dampening effect that uncertainty always has on economic growth.
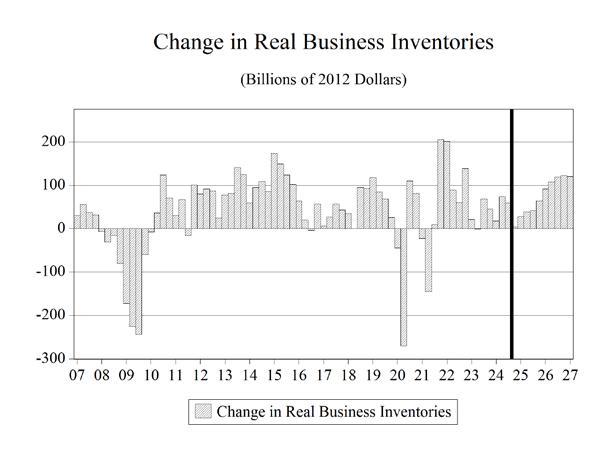
Many economic indicators suggested that we were headed for a recession in 2023, but this was not the case. Persistent large deficits at the federal level have continued to fuel economic growth through the end of 2024. It would appear that the size of these deficits is set to decline significantly (but not be completely eliminated), so the brute force of deficit spending that pushed the economy forward the past four years will no longer be a large driver of growth and the national debt.
1 https://www.usnews.com/news/healthiest-communities/slideshows/richestcounties-in-america?onepage
The end of election uncertainty and business friendlier policies from DC should continue the
economic expansion through the end of our forecast horizon if the frenetic change and uncertainty accompanying DOGE don’t knock the economy off its tracks.
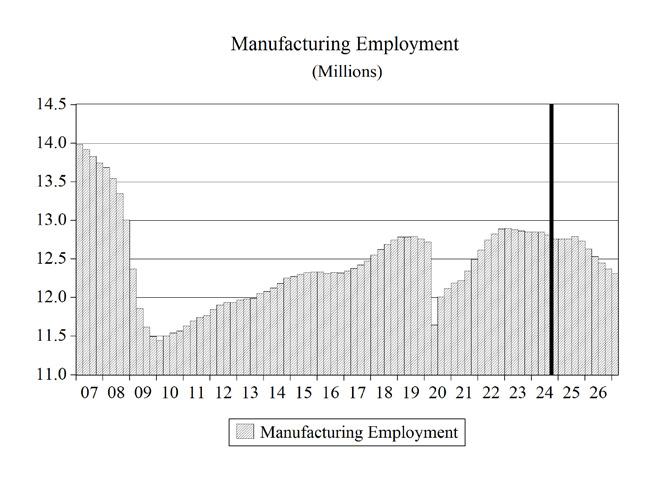
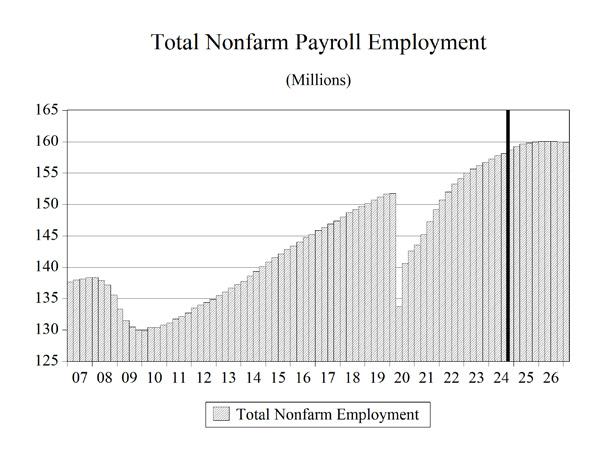
While the labor market showed no signs of the 2022 recession, the slowing of growth in 2026 and beyond will impact the labor market. I think unemployment will gradually rise as 2026 progresses, continuing into 2027 before stabilizing at below 5%. Job growth will slow to a trickle and then will likely turn slightly negative but should not contract by any significant amount, at least outside of the federal government sector.
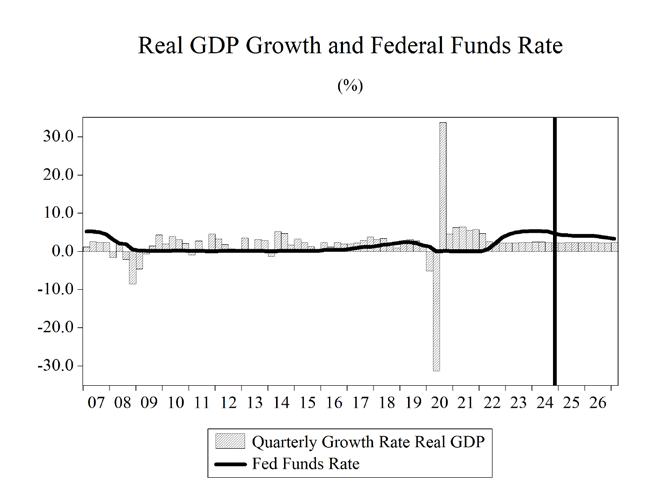
There will be another recession, they are as certain as death and taxes, and there is a chance that it could be borne of the chaotic changes happening in the nation’s capital. However, at this point we are not predicting that it will come to pass in the next several years. In the meantime, we are anticipating a softening of real GDP growth slowing from 2.8% in 2024 to 2.2% in 2025 before drifting down to 1.6% in 2027 and then ticking up to 1.8% in 2028.
CONSUMER SPENDING
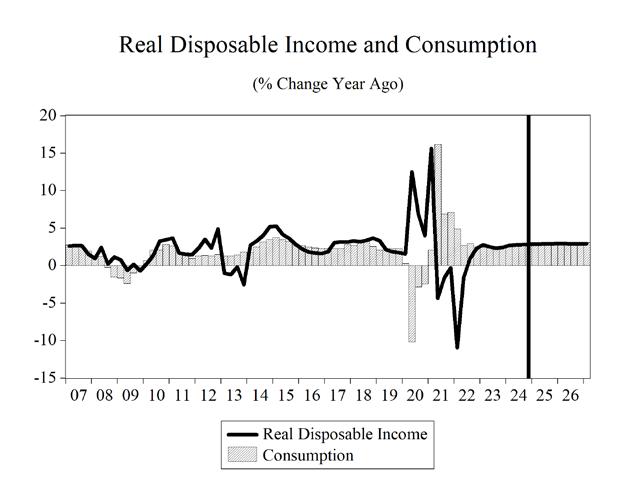
The Return of Real Wage Growth is Helping Households Heal
U.S. consumers were hit hard by high inflation for more than two years, and despite wage and salary growth, the rising cost of living eroded wiped away all those wage gains and even more purchasing power beyond that. Since the second quarter of 2021, real median weekly wage and salary growth had been negative. This means that even though workers had more dollars in their paychecks, the amount of goods and services that they could purchase with these dollars was declining for more than two years. This declining purchasing power set the stage for a slowing economy and the possibility of recession.
The holes in consumers’ budgets were patched by savings from the COVID era and using credit card debt. These patches to consumers’ budgets can only hold for so long.
Inflation hit middle- and lower-income households hard. Roughly 63% of consumer expenditures go to food, shelter, and transportation; all three categories saw outsized price increases over this two-year span.
Over the most recent two years, thanks to a still strong labor market and retreating inflation, growth in real wages has turned positive. This is enabling consumers to make more permanent repairs to damaged household budgets.
Credit card delinquency rates had been rising for more than two years as households struggled to make ends meet. In the second half of 2024, these delinquency rates have been declining thanks to rising real wages.
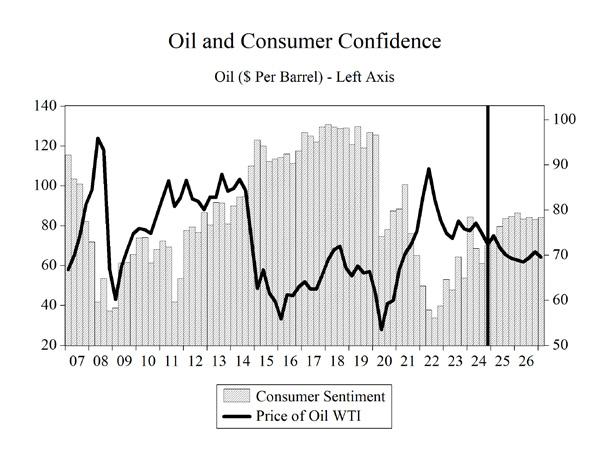
Consumer sentiment has been on an upward, but somewhat volatile, trend since hitting an all-time low at the height of the inflation crisis. Seeing paychecks
start to go further has played a role in the regaining of confidence in household financial status.
The public health policies aimed at slowing the spread of COVID-19 caused spending growth in 2020 to contract by 2.5%. Consumption spending growth slowed from 8.8% in 2021 to 3.0% in 2022 and then to 2.5% in 2023 before ticking up to 2.8% in 2024. During 2025-2028, real consumer spending growth is expected to average 2.6%. Consumer spending growth will be dampened by the economic slowdown in 2026 and 2027 after hitting 3.0% in 2025 before slowing in the next two years to 2.3% in 2027.
INVESTMENT
Higher interest rates and increasing levels of uncertainty have combined to slow investment spending in 2024, and it will likely continue to decelerate through 2027 before rising in the final year of our forecast.
Presidential elections are an intersection when it comes to economic policy that can shape the type and profitability of private investment spending. Not knowing what policy path the economy will be traveling down puts investment projects on the sideline as businesses await the outcome of the election. However, despite the outcome of the election being determined, the level of uncertainty has not gone down amidst the frenetic goings on in the first weeks of the new administration. Businesses will continue to try and divine what tariffs, spending cuts, regulatory changes are going to be implemented and importantly how long such changes might remain in place. The “intersection” feels more like a large roundabout, and it is unclear when we might exit it.
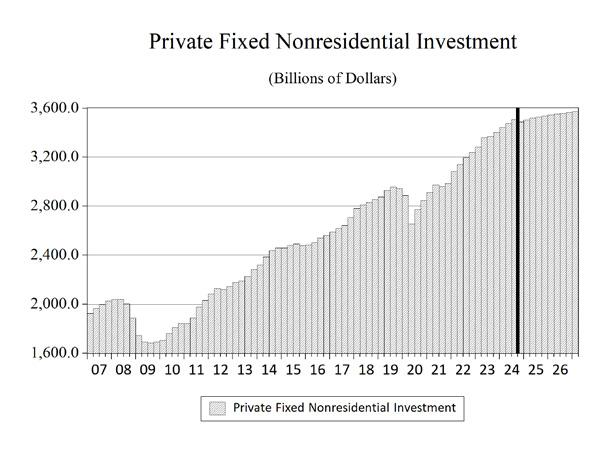
Nonresidential fixed investment spending eased in 2019 to 3.8% from 6.9% in 2018. In 2020, investment spending contracted by 4.6% then rebounded to 6.0% growth in 2021 and 7.0% growth in 2022 that eased to 6.0% in 2023. During 20252028 we expect average growth in nonresidential investment spending to be 1.3%, decelerating from 3.7% in 2024 to just 0.9% in 2027 before rebounding to 2.0% in 2028.
Spending on equipment and software turned negative in 2020 and contracted by 10.1%. In 2021, spending grew 6.7%—a 16.8 percentage point swing. Average growth in this type of investment spending is expected to be 2.8% over the 2025-2028 timeframe, after spending surged in 2024.
Investment in aircraft is highly volatile. A single aircraft order from a major airline can move this figure by tens of billions of dollars. The contraction in spending in 2021 reversed in 2022 as air travel continued to grow in the post-lockdown era. Aircraft purchases grew by 5.4% that year and 28.9% in 2023. Over the 2025-2028 period, spending on aircraft is expected to grow by an average of 2.6%. This deceleration of growth comes after a two-period growth that averaged 23.2% in 2023-2024.
The 2016 slowdown in overall investment spending also reflected the negative impact of oil prices falling by nearly two-thirds. Consumers enjoyed the low prices at the gasoline pump, but oil producers—shale and otherwise—cut back on investments as oil prices dropped below $40 per barrel early in 2016. The rig count in the U.S. hit a seventy-year low of 404 in response to these plunging oil prices. In the middle of the COVID recession, an oil price war broke out and drove spot prices of oil below zero one day in March of that year. This price drop caused the U.S. rig count to further plummet to 282.
Lower oil prices over the past quarter and persistently unfriendly policy from the Biden administration have pushed the current rig count to 593 which is 36 rigs fewer than a year ago. Rig counts were over 1,000 as recently as 2019. A friendlier policy from the new administration should bolster that number in the next couple of years.
In 2018, investment in mining and petroleum equipment growth came in at 27.0% for 2018, before contracting by 0.3% in 2019 and plunging to -38.4% in 2020. Investment will average a 3.4% growth per year during 2025-2028 after contracting by 6.0% in 2024.
Business nonresidential structures investment growth contracted by 9.2% in 2020, by 2.6% in 2021 and then accelerated to 3.6% in 2022. Nonresidential structures spending will grow at an average rate of
-1.4% during 2025-2028, after growing at 10.8% in 2023 and 3.2% in 2024.
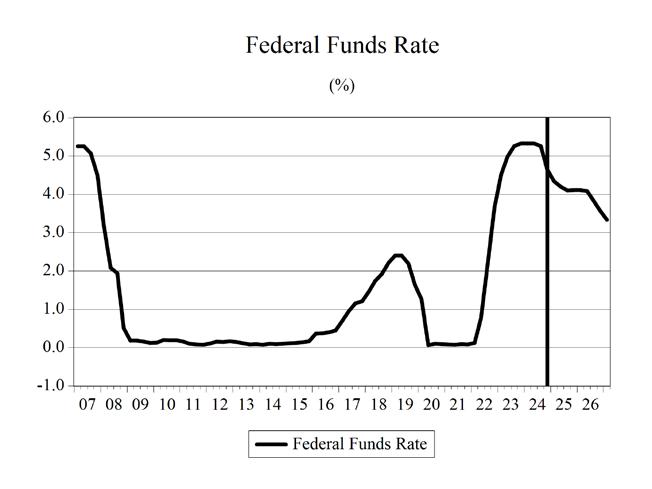
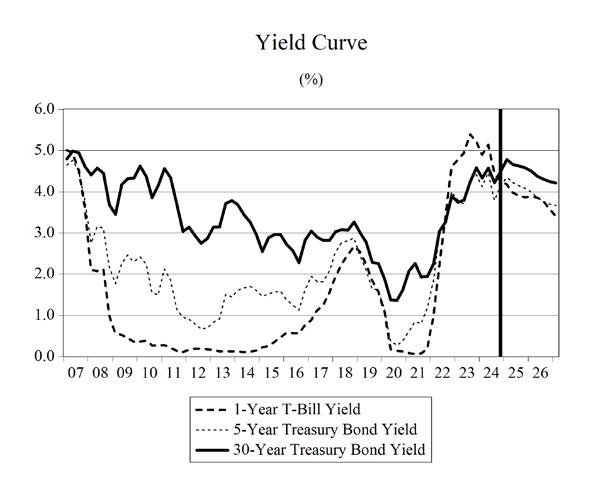
Interest rates plunged in response to the pandemic. The Federal Reserve cut short-term interest rates to near zero and kept them there for nearly two years. The interest rates on U.S. Treasury bonds fell to historic lows but have since risen significantly. Rising interest rates are not good for investment. The Fed has now switched gears to go into recession-fighting mode and beginning in September cut short-term interest rates; longer-term rates actually went up in response to these cuts. Higher borrowing costs and tighter credit conditions in the wake of the Silicon Valley Bank failure will be a persistent headwind for commercial real estate investment spending.
Business spending on industrial equipment will grow at an annual average rate of just 0.2% from 2025-2028. Investment spending growth on computers and peripherals will average 3.5% during 2025-2028. Spending on communications equipment should expand at an average annual rate of 5.4% during the same period, with spending in 2027 expanding at nearly a 10.0% rate.
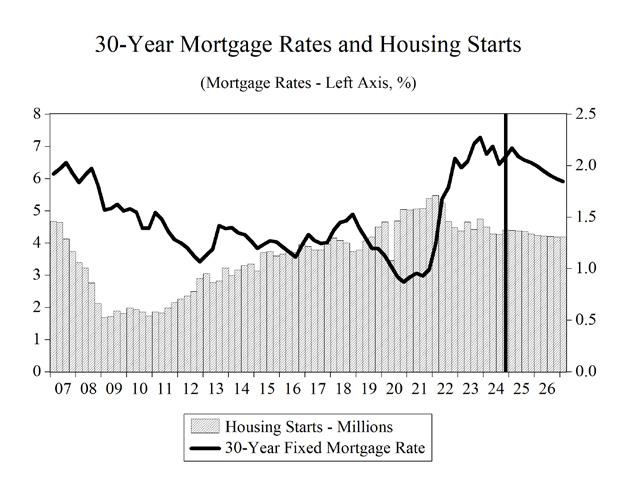
Residential fixed investment growth hit 10.7% in 2021. Growth will average just 0.3% during 2025-2028, as higher prices combined with higher mortgage rates have eroded demand and caused investment spending to contract 8.6% in 2022 and 8.3% in 2023.
We expect housing to continue a slow deceleration that commenced in 2023 and continued through 2024. Starts will fall gradually over the following three years. After reaching 1.6 million in 2021, starts fell to 1.36 million in 2024. They will continue to drift lower for the next four years hitting a level slightly less than 1.33 million in 2028. High home prices and a slowing economy are headwinds, and the expected decline in mortgage rates as the Federal Reserve loosened monetary policy did not materialize as long-term interest rates moved in the opposite direction. The ongoing shortage of housing that is plaguing the sector in many parts of the country will help fight against these headwinds and provide an underpinning for home building.
GOVERNMENT SPENDING
DOGE, Like March, Has Come in Like a Lion
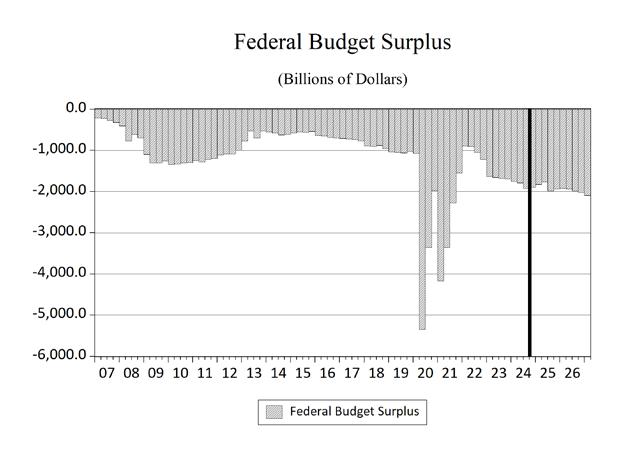
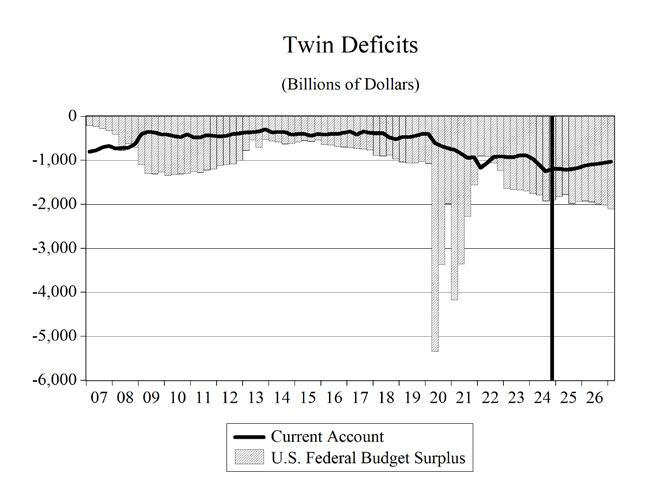
Government budget management devolved into a series of continuing resolutions, COVID-19 stimulus packages, and spending made under the umbrella of a pandemic emergency declaration. Federal government spending has been devoid of any policy discussions or debates about priorities, problems, objectives or any consideration of deficits and the national debt. Unsurprisingly, public finances have been adrift, and deficits climbed back to the $1 trillion mark in 2019 even before the massive wave of deficit spending triggered by the pandemic.
The pandemic ended but the spending spree in Washington, DC continued unabated. The vote to suspend the debt ceiling in June of 2023 removed the last restraint on our elected prodigals and prior to DOGE $1.0 trillion was being added to the national debt every 100 days. The interest payments on this national debt are now more than $1 trillion every year.
Can the proposed Department of Government Efficiency (DOGE) curb this profligate and unchecked spending? I am still not convinced that it will be able to rein in a bureaucracy entrenched by decades of the same modus operandi. DOGE has been making cuts and according to the US debt clock website in the footnote below, there has been more than $150 billion in cuts made via this process. That’s a lot of money, but when deficits are near two trillion dollars, it also shows how much heavy lifting still must be done.
Federal government spending growth was 3.8% in 2019 before jumping to 6.3% in 2020. During the 2025-2028 period, federal government spending growth is going to contract, growing at an annual average pace of -0.6%. Over the same period, state and local governments will see spending growth at an average rate of 0.2%.
I am not yet convinced that congress will undertake the required cuts to the deficit; I would like to be proven wrong. Thus, we are still projecting deficits through 2028 that will consistently average nearly $2.0 trillion. The amount that the projected
deficits will add to the national debt over the next four years will be $7.9 trillion, pushing the total national debt to more than $44 trillion and a debtto-GDP ratio of approximately 130%. If higher interest rates return to the economy, the burden of servicing this debt will continue to rise as well. Slower-than-projected economic growth or a recession would also push projected deficits higher, though the possibility of faster-than-projected economic growth could help mitigate the growth of these deficits on the debt-to-GDP ratio.
Currently, the national debt is over $36.5 trillion and rising. This represents a debt of more than $323,000 per taxpayer and $107,344 per citizen. The unfunded liabilities of the U.S. are even more troubling. These include Social Security, Medicare parts A, B, and D, and Federal debt held by the public and federal employee and veteran benefits, representing more than $227.1 trillion in liabilities, boiling down to more than $667,249 per citizen. 2
NET EXPORTS
While DOGE is whipping up uncertainty about government spending, the threats and announcements of new tariffs to be levied against U.S. trading partners is shaking up the international sector of the U.S. economy.
A country’s use of tariffs historically has been to protect a domestic industry from international competition. The Trump administration seems to be using tariffs as a lever to get other countries to make changes that are to the benefit of the United States.
Colombia initially refused to accept its citizens that were being deported from the U.S. back to Colombia. The administration threatened broad tariffs against Colombia and within a matter of hours their president capitulated. Similar tactics were employed to incentivize Mexico and Canada to assist with drug flows and border control with the U.S.
A longer run goal appears to be incentivizing U.S. firms to onshore production that had been moved overseas previously. It is not clear how successful
these efforts will ultimately be, particularly with the potential that these tariffs may not be in place in the longer term.
The globalization genie is not going back in the bottle, but the possibility of leveling the playing field in international trade could be a boost to U.S. companies trying to compete abroad.
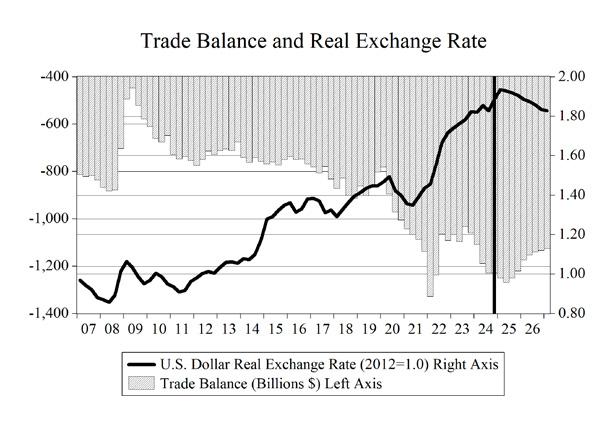
A stronger dollar boosts imports and reduces exports by making our goods and services more expensive to foreigners while at the same time making imported goods and services less expensive to U.S. consumers. This results in a worsening of the trade deficit, which is the difference between the dollar value of exports and the dollar value of imports. The opposite is true when the dollar undergoes a depreciation.
However, the effects of currency changes take time to work on the actual quantity of trade flows, resulting in what is known as the J-curve effect on net exports. Because of this effect, an appreciation (depreciation) of the dollar initially decreases (increases) the trade deficit before eventually increasing (decreasing) it. Why? Importers and exporters do not enter contracts based on the total dollar value of the transaction, but rather on the actual quantity of goods to be shipped (automobiles, flat-screen televisions, etc.). As the exchange rate varies in the short run, the values of these shipments and, thus, net exports vary as well. Over time, however, the quantities do adjust in response to the exchange-rate fluctuations, and this is what gives rise to the J-curve effect.
With the Federal Reserve pausing the interest rate cuts it began in September, higher interest rates, this will lead to an appreciation of the dollar in 2025 before lower interest rates lead to a depreciation during 2026-2028.
Overall, real export growth has resumed, after a sharp contraction in 2020, and will continue through the end of our forecast horizon after accelerating sharply in 2021 and 2022. The appreciation of the dollar in 2022 caused a deceleration of this growth in 2023 and 2024. Real import growth also experienced a strong contraction in 2020, but growth recovered before contracting again in 2023. Import growth
will resume in 2024 and will continue through 2027. Emerging trade policy issues, a slowing economy, increasing geopolitical uncertainty notwithstanding, real export growth from 2025-2028 will average 2.4%, while real import growth will average 3.0% over the same period.
Real net exports will average over -$1.52 trillion during 2025-2028, with the trade balance improving somewhat in 2026 in response to imposition of new tariffs this year before worsening over most of that period from -$1.39 trillion in 2024 before reaching -$1.62 trillion in 2028.
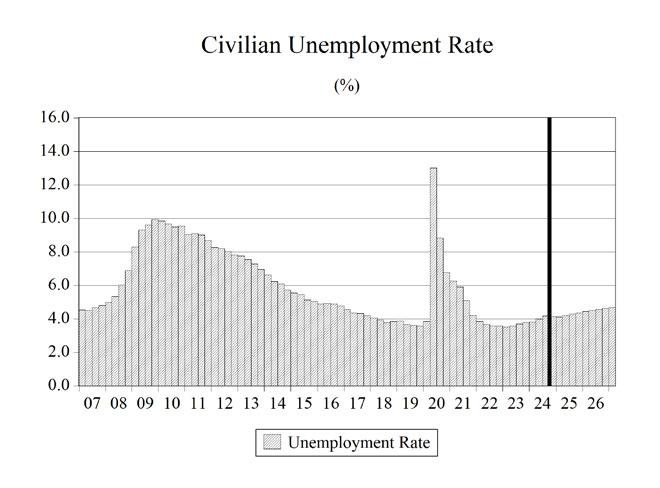
UNEMPLOYMENT
The national headline unemployment rate (U-3) in January 2025 stood at 4.0%: down 10.8 percentage points from the April 2020 reading of 14.8%, which was the highest level since the Great Depression era. The labor force participation rate ticked up after holding steady in the previous three months month with the January 2025 rate at 62.6%. The labor force participation rate is still below pre-pandemic levels of 63.3%.
The Bureau of Labor Statistics (BLS) produces alternative measures of labor market weakness, including the broadest measure of unemployment (U-6). U-6 accounts for discouraged workers (currently 592,000 workers), underemployed workers—working part-time but not by choice— (currently 4.48 million workers), and workers who are marginally attached to the labor force—those who have looked for work in the past 12 months, but are not currently looking, yet indicate a willingness to work (1.59 million workers). None of these 6.6 million-plus workers are accounted for in the January headline unemployment rate of 4.0%.
U-6 stands at 7.5% as of January 2025, down 5.1 points from the September 2020 level, and up 0.8 percentage points from the start of 2023. The current level of U-6 is on par with its level in November 2021. U-6 was stuck in double digits for more than seven years. It had been in the single digits for fiftyone consecutive months, beginning in December 2015, before surging during the lockdowns in April and May of 2020.
The spread between U-6 and U-3 measures of unemployment sits at 3.5 percentage points and is 3.9 points below the peak spread of 7.4 points that took place in September 2011.
Table 1. Summary of the Long-Term Forecast of the U.S.
Table 1. Annual Summary of the Long-Term Forecast of the U.S.
Composition of Real GDP,
Measures
Incomes