
22 minute read
Needs Assessment


SECTION 3
Needs Assessment

Alignment starts with a needs assessment. Your needs assessment is what drives your decision making. It is the basis for understanding whether to keep or eliminate an existing program or if an entirely new program is needed to meet current or future needs. Your needs assessment will lead down one of several paths, as highlighted in Figure 3 below. For example, your district launches a needs assessment process and focuses on reviewing its existing programs. You decide that your existing computer science pathway is largely meeting industry needs but, based on feedback from industry, you will overhaul several parts of it, including the curriculum and the end of pathway assessment, and create opportunities for work-based learning and other types of experiential learning.
Figure 3 Needs Assessment Flowchart
Needs Assessment
Need for New Program
Capacity to Add Now Build Capacity to Add Later Existing Program
Keep End
Overhaul Enhance/ Revise
The needs assessment is a core element of the CTAE alignment process. At the most basic level, the needs assessment is about collecting information from and about employers and employment patterns in your region regarding hard-to-fill jobs and skills shortages. The needs assessment process may involve interviews with businesses, conversations with local economic development professionals, surveys of business partners, and a review of relevant labor market information. The needs assessment process will help to identify key industries, high-demand jobs, and opportunities for the school system to plug into local workforce development needs.
CASE STUDY
Manufacturing at Newton County Schools
How do you get students enrolled in a CTAE pathway with high local demand but uninterested students? Tim Schmitt, the director of CTAE and workforce innovation for Newton County Schools, and Chad Walker, principal and CEO of the Newton County College and Career Academy (NCCCA), faced just this problem with the Manufacturing pathway. The local chamber of commerce reached out to Schmitt about an ongoing need among local manufacturing firms: a lack of workers. Newton County decided to do two things: First, Schmitt and Walker changed the name of the pathway, and then Schmitt worked with several local employers to develop a teacher externship program.
By changing the name from Manufacturing to Automation, Robotics, and Manufacturing and including some additional topics, the school system removed some of the stigma and increased student interest in the pathway. Another way Schmitt tackled the stigma and boosted student interest was through a oneweek summer externship program open to all faculty and staff. The educators tour local manufacturing and meet employees. They must then produce a portfolio profiling three to four people they met, including their job description, educational background, wages, and other relevant information. The portfolios are then shared as a resource for other teachers to incorporate into the curriculum, such as creating real-world math problems using local companies to allow students to learn what actual manufacturing work looks like in their community. Teachers were surprised to learn about the wide variety of positions in the field and the respective entry points ranging from a high school diploma to a PhD, depending on the position.
Schmitt has seen increased enrollment in the Automation, Robotics, and Manufacturing pathway, which he hopes will produce students more likely to enter the local manufacturing workforce. When asked how to make this work in other schools, he shared two pieces of advice: “Ask for meaningful things from local business,” and remember, “if it is good for the kids, then we are for it.” It can be easy to get discouraged by legal or logistical barriers, but if both sides can be flexible and provide multiple options, then finding a middle ground beneficial to both sides should be feasible.
WHY IT WORKS ü Communication between industry and education leaders is ongoing, and both sides showed flexibility.
ü Classroom teachers and school administrators are involved.
ü New knowledge gained through local tours and other activities is applied directly in the classroom.

Needs Assessment Approaches
There are three main approaches to conducting a needs assessment process. Some school districts use more than one approach, such as combining a needs assessment meeting with targeted follow-up interviews to capture missing voices.
1
Needs Assessment Meeting. This approach to gathering needs assessment information focuses on getting various partners (e.g., business leaders, school leaders, community and economic development leaders) in the room for short presentations and discussion. Each business should be asked to make a short presentation addressing the four questions highlighted on the next page. After the business presentations, the group should discuss common needs and opportunities for partnerships. Needs assessment meetings typically last no more than four hours. Depending on the size of the community, you may need to have more than one meeting and could break up industry sectors. See Appendix B for a sample needs assessment meeting agenda and Appendix C for a sample needs assessment meeting guide.
2
Needs Assessment Survey. Another means of to gathering needs assessment information is through a short online survey. You could use an existing list of relevant contacts (e.g., advisory committee roster, partners in education listing) or work with your partners to develop a list (e.g., chamber of commerce, economic development). Several free or low-cost survey tools are available that can be used to develop and administer the online survey, such as Survey Monkey, Qualtrics, or Google Forms.
3
Needs Assessment Interviews. The final approach to gathering needs assessment information is through interviews. The interviewer is typically a member of the school district’s leadership team, sometimes accompanied by a partner from economic development or the local chamber of commerce. The interviews would preferably be conducted in person, but they can also be completed via phone. In-person interviews have the advantage of helping you form and build relationships with potential partners. The interviews are also a great way to garner input from partners who are not able or willing to participate in a needs assessment meeting or survey. As mentioned earlier, interviews need not be a stand-alone approach to conducting a needs assessment but can also be an important supplement to the other approaches.
Key Needs Assessment Questions
No matter the approach you use to conduct your needs assessment, you should be trying to answer the following basic questions. The answers to these questions can also be supplemented with labor market information, which is discussed on page 17.
1. What jobs are currently the most difficult to fill?
2. What jobs do you anticipate struggling to fill in the next five to 10 years?
3. What types of skills, knowledge, and attributes are entry-level workers missing when they interview for a position or start employment with your company?
4. How can our school district help to meet your company or industry workforce development needs?
Additional questions to take into consideration are included in the sample needs assessment meeting guide in Appendix C. In addition to these key needs assessment questions, the needs assessment process may need to address additional factors to best align programs, support students, and meet local workforce development needs. The Needs Assessment Evaluation Criteria worksheet in Appendix D is a tool to help ensure that you are asking the right questions during the needs assessment process. It also raises other potential considerations that may be relevant to your community.
As mentioned earlier, multiple exit points should be built into your career pathway pipeline. These exit points and the associated credentials, skills, and knowledge that a student can obtain at each exist point should be evaluated. Appendix E contains an example of the credentials, titles, and relevant employers where students can obtain nursing jobs. It also contains a worksheet that you can use for each pathway or career.
Two other perspectives that a needs assessment must take into account are those of the students and parents/caregivers. Parents and students might have a bias toward certain industries and trades. Even a pathway aligned with industry cannot be successful if no students are interested in taking the classes or choosing a career in that industry, or if parents discourage enrollment. Some programs are naturally more popular than others in a high school and may not require heavy student recruitment. Other programs may not have a natural constituency or students may have limited exposure to careers in the industry, which can hinder enrollment. Helping both parents and students understand the competencies required to succeed in these industries or careers and the potential associated wage or salary is important to overcoming this bias. See the Construction at Roswell High School case study on page 16 to learn about how the Construction pathway took a K-12 approach to building and sustaining interest in construction careers.
CASE STUDY
Construction at Roswell High School
The construction industry is growing rapidly in metro Atlanta, and contractors are having a difficult time finding young people to enter the industry. Roswell High School, located in the northern part of Fulton County, launched the Construction pathway in 2014 to help fill the gap and graduate students ready to enter the construction field or continue to postsecondary education. Unfortunately, it was difficult to get high school students interested in construction, and parents had misconceptions about the field, career prospects, and earning potential.
To help expand the high school program and meet regional talent needs, leaders from the construction industry and Fulton County Schools launched a construction pipeline program in their two middle and six elementary feeder schools. According to Zach Fields, former Roswell High School construction teacher and current vice president of K-12 pipeline for the Construction Education Foundation of Georgia, the elementary school and middle school pipeline programs are designed to “expose students to construction careers and build their interest in the high school construction pathway.”
At the six elementary schools, Toolbox Construction Clubs meet after school once a week. Students have the opportunity to complete hands-on projects, learn employability skills, and receive mentoring from industry leaders. The construction clubs are entirely volunteer-driven and funded by industry partners. The construction pipeline continues into the two middle schools in the Roswell cluster. Each school has a Construction Connections class in which students learn additional construction and employability skills and have opportunities to interact with the high school Construction pathway instructor. The middle school class is not meant to accelerate the high school pathway but instead to continue to develop interest in the field and transition students into the high school program.
The pipeline approach has led to a group of students ready to enter the high school Construction pathway and has helped change the negative stigma of careers in construction among parents and students. Ultimately, this approach is helping to fill high-demand jobs in the region and prepare students to develop the skills needed to succeed in this career field.
WHY IT WORKS ü The program is designed to meet the needs of a growing industry and prepare students for highdemand careers.
ü Industry partners are actively involved in developing and supporting the construction career pipeline.
ü Student interest in construction careers starts well before high school with elementary school construction clubs and middle school Construction Connections classes.
SECTOR Construction
Afterschool Toolbox Construction

WHERE HOW
Elementary School
Volunteers
Construction Connections Course Construction Pathway
Course 1 Course 2 Course 3
Middle School High School
Middle School Teacher High School Teacher
Construction Workforce
Labor Market Information
As mentioned previously in this toolkit, labor market information (LMI)—data about the quality of, supply of, and demand for a workforce—can be a powerful tool to help secondary and postsecondary educational institutions align their offerings with business and industry needs. Knowing where to look for LMI on a specific industry in your region or what your existing workforce looks like and how to analyze and use such data can be overwhelming, so this section is designed to provide some basic LMI resources. Some of these sources are national in scope while others are specific to Georgia. Note also that different data sources report information for different geographic areas. Educational sources like the Career Pipeline Tool and the Governor’s Office of Student Achievement (GOSA) are more likely to be very detailed, going as specific as the county or district level, whereas other sources of economic data like the US Census Bureau and the Bureau of Labor Statistics more commonly report information by county or multicounty regions.
Keep the following in mind as you research LMI:
• Do not limit your data collection to a snapshot in time: Make sure you look at trends over time.
• Benchmark your region/county/school district against similar or surrounding areas,
or use a state average.
• Look at existing employers as well as at sectors of the economy that have the promise of growth.
As an educator, you may not know this information, so rely on your partners.
• Each data source has limitations, so it is important to pull from multiple data sources. These
sources should ideally include quantitative (statistical) backed by qualitative (interviews) information from partners.8
USEFUL TERMINOLOGY
Below are some common and useful terms that you will need to know as you work through your LMI analysis:
Standard Occupational Classification (SOC) codes: SOC is the federal statistical standard to classify workers into occupational categories. There are 459 occupations that are divided into 23 major groups. Every occupation has a code, which is a hierarchy to help place it in the larger system. At the two-digit level, you will only see the 23 major groups, but as you increase the number of digits, the information gets more detailed. An individual occupation can be explored at the five-digit level. For example, the two-digit code 25 is for Educational Instruction and Library Occupations. Under that category are subcategories for Postsecondary Teachers (25-1000) and Preschool, Elementary, Middle, Secondary, and Special Education Teachers (25-2000). Each of those categories is then broken down further; for example, code 25-1194 is for Career/Technical Education Teachers, Postsecondary, and 25-2023 is for Career/Technical Education Teachers, Middle School.
SOC codes are useful as you look at the number of jobs in a region, job growth over time, or average earnings for certain types of jobs and typical education needed for entry-level positions. You can learn more about the occupations and major groups at the Bureau of Labor Statistics (BLS): bls.gov/soc.
North American Industry Classification System (NAICS) codes: This is the federal classification for business establishments. All business fall into one of 20 sectors. Much like the SOC codes, all industries are coded in a hierarchy starting with a two-digit sector going down to a six-digit industry. For example, code 23 is for Construction. Under that category are subcategories for Construction of Building (236) and Heavy and Civil Engineering Construction (237). Each of these is broken down further, such as Residential Building Construction (2361) and Nonresidential Building Construction (2362). The final two digits divide the industry even further. In the example of residential building construction, there is New Single-Family Construction (236115), New Multifamily Construction (236116), and Residential Remodeling (236118). In total, a business can be classified into one of 1,057 industries. NAICS codes are useful as you look at what industries are growing, remaining constant, or declining over time in your community.
To learn more about NAICS, visit bls.gov/bls/naics.htm or census.gov/eos/www/naics.
Metropolitan Statistical Area (MSA): This is a common geographic area for measuring economic indicators, including all Census data. An MSA is defined as an area containing at least one urbanized area of 50,000 or more people. Currently, the US has 542 MSAs, 14 of which are in Georgia: Albany, Athens, Atlanta, Augusta, Brunswick, Columbus, Dalton, Gainesville, Hinesville, Macon, Rome, Savannah, Valdosta, and Warner Robins. In addition to these 14, Georgia has 23 micropolitan statistical areas. These are defined as one or more adjacent counties that have at least one urban core area of at least 10,000 but less than 50,000 residents.
To find out more about MSAs and other geographic delineations, visit the US Census Bureau’s website: census.gov/programs-surveys/metro-micro.html.
WHERE TO FIND LMI AND EDUCATION DATA
Listed below are some of the most useful websites for finding LMI and education data. If you represent a school or district, these will help you gain a better understanding of the labor market in your area. If you are an employer, the education data can help you gain a better understanding of the school district or districts in your area.
• Georgia’s Career Pipeline Tool is provided by the Georgia Department of Education (GaDOE) CTAE
Division. This tool contains pathway completion rates and CTAE enrollment by school and district as well as data about end-of-pathway assessments (EOPAs) and career and technical student organizations. Business partners may find the Career Pipeline Tool helpful as it also includes contact information for district leadership like CTAE directors and work-based learning coordinators. To learn more about this tool, visit gacareerpipeline.gadoe.org.
• Georgia Insights is an initiative of the Georgia Department of Education, focused on improving the clarity and accessibility of district and school-level data through public-friendly and easy-to-use dashboards. Dashboards include Georgia Milestones, Teacher pipeline and Endorsements and many other easy-to-understand visuals. By displaying the data in a streamlined, usable and useful manner,
GaDOE hopes to equip educators, parents, and communities with the tools they need to enact positive change in their schools. To see dashboards, visit georgiainsights.com.
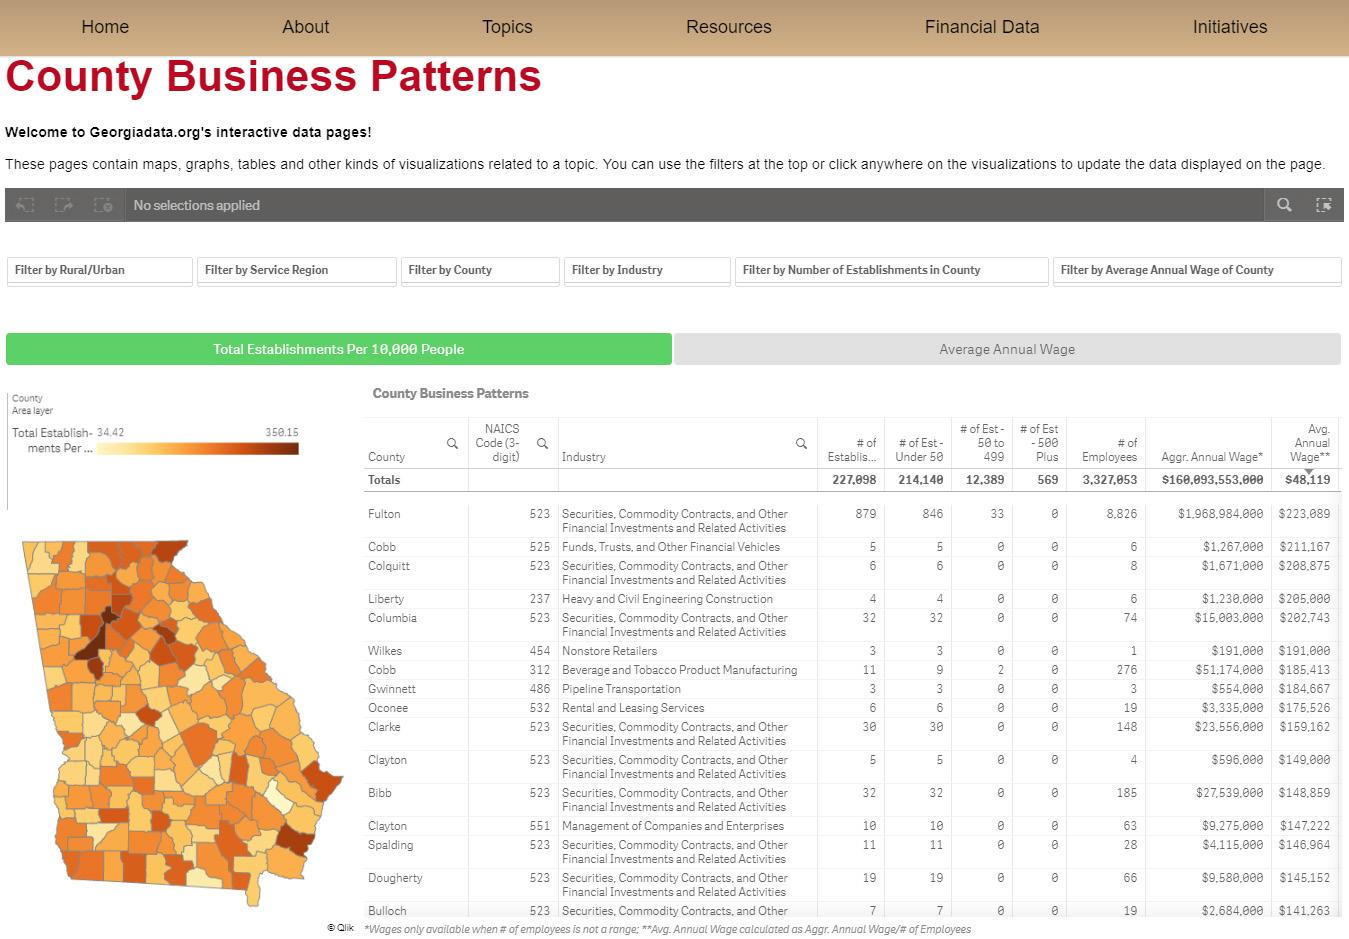
• GeorgiaData.org is a website developed by the Carl Vinson Institute of Government at the University of Georgia. It contains state- and county-level data on a wide variety of topics, including economics, education, health, labor, and population as well as links to other state data resources. This resource can be accessed at georgiadata.org.
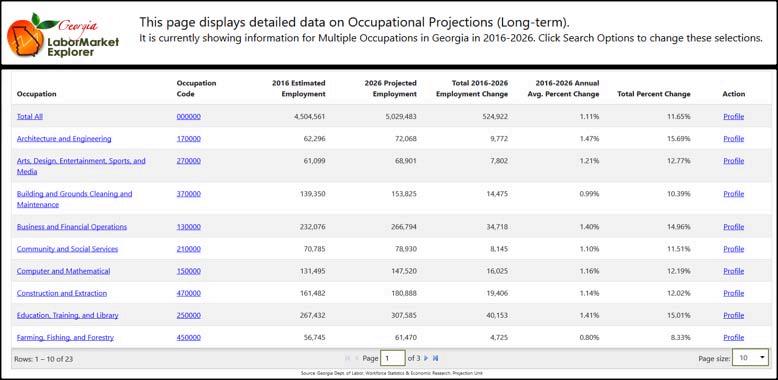
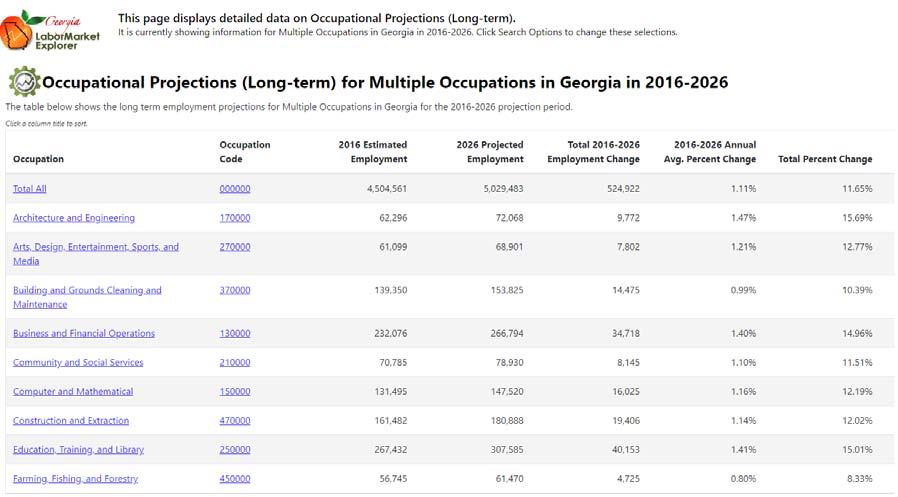
• Georgia’s Labor Market Explorer, which is compiled by the Georgia Department of Labor (DOL), links closely with the Career Pipeline Tool to provide economic data for each of the 17 high school
CTAE career clusters. It also provides maps and labor market data like STEM (science, technology, engineering, and mathematics) careers, top growing careers, and top employers in the state. For more information on the labor market in Georgia, visit explorer.gdol.ga.gov.
• The Governor’s Office of Student Achievement (GOSA) focuses on all levels of education. The following data sources are free to anyone interested in Georgia education data from pre-k through postsecondary.
° Downloadable Data includes a series of K-12 performance indicators (e.g., dropout rates, graduation rates, HOPE-eligible graduates, attendance data) that can be downloaded by school district.
° The High School Graduate Outcomes dashboard shows what high school graduates do after graduation.
° Higher Learning and Earnings provides information on earnings for Georgia’s technical college and college/university graduates who work in Georgia after completing their degrees. ° Report Cards provides indicators and information about all public educational institutions in the state including pre-k, K-12 public schools, USG institutions, TCSG institutions, and
Georgia Military Colleges.
All of these data sources and more can be found on GOSA’s Data Dashboards page at gosa.georgia.gov/ report-card-dashboards-data.
• The Governor’s Office of Planning and Budget (OPB) is particularly useful for accessing state and county population data as well as data and links to external resources like the Census. Past population data by county are available at opb.georgia.gov/population-estimates. Population projection data must be requested. To do so, visit opb.georgia.gov/population-projections and fill out a request form.
• The Bureau of Labor Statistics (BLS) is part of the US DOL and is responsible for measuring labor market activity, working conditions, and price changes in the economy. All of its data, including official monthly unemployment rates, labor force participation rates, and productivity, are free and open to the public and can be found at bls.gov/data.
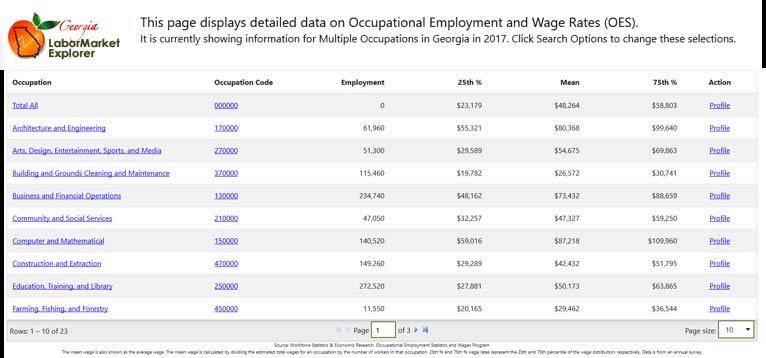
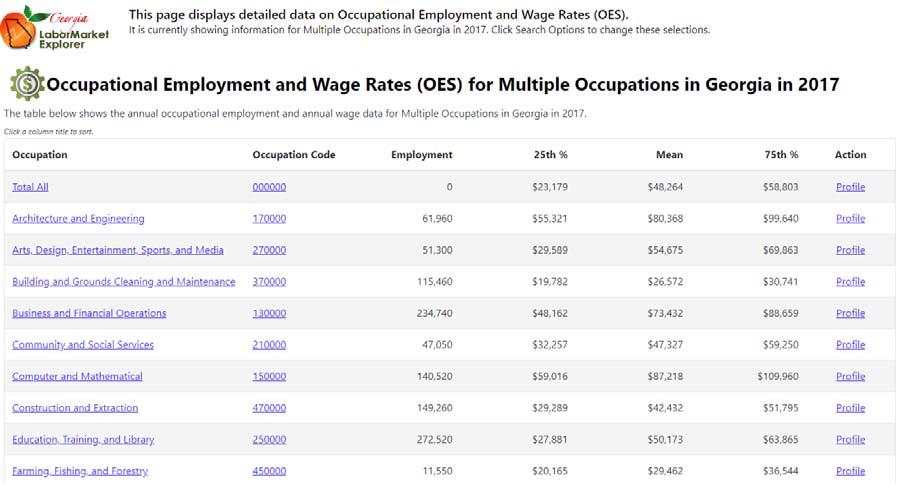
Another BLS resource—the Occupational Employment Statistics (OES) data—estimates employment and wage data annually for states and MSAs. It can be found at www.bls.gov/oes.
• The US Census Bureau, part of the US Department of Commerce, contains a vast amount of data and resources. Below are some details on several of the tools that may prove to be particularly interesting and useful throughout the alignment conversation.
° American FactFinder is the hub for most Census data such as population, housing, and economic and geographic information. It includes data from the Decennial Census as well as County Business Patterns and the American Community Survey. To access American
FactFinder, visit census.gov/data/data-tools/american-factfinder.html.
° Quarterly Workforce Indicators (QWI) provides detailed information (32 indicators) on employment at the state and county level, including demographics, ownership, and size of firm. QWI uses NAICS codes. More about QWI can be found at qwiexplorer.ces.census.gov.
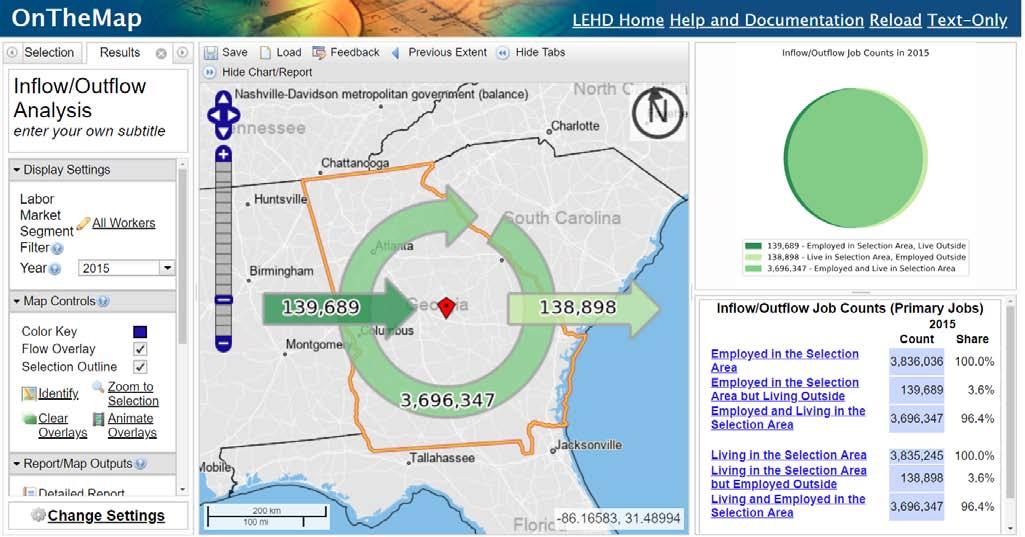
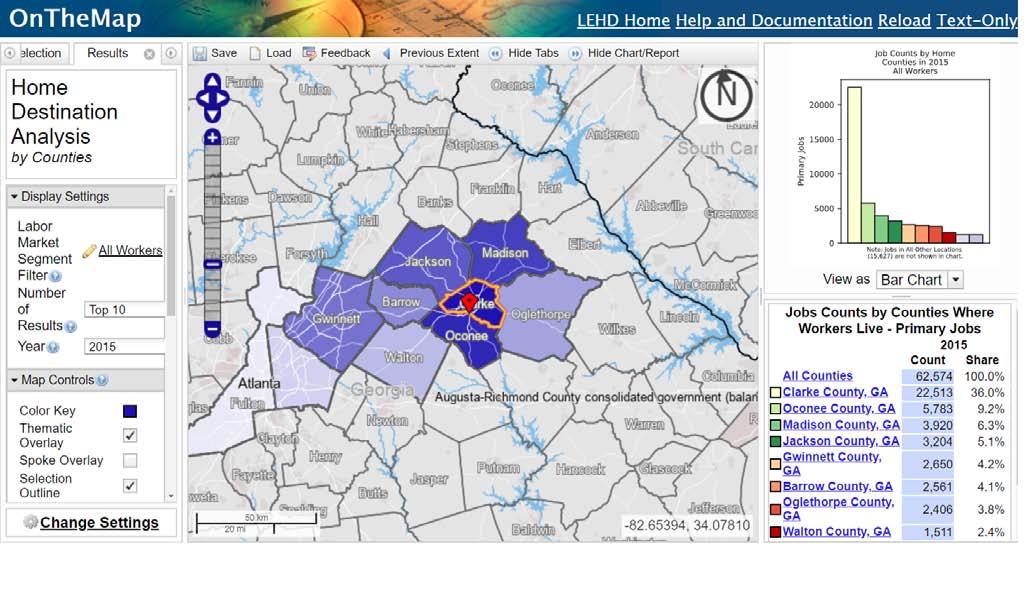
° OnTheMap has data and maps to help explain commuting patterns based on where people work and live. It goes as detailed as zip codes but also includes state, county, and Workforce
Investment Areas as well. To explore commuting maps, visit onthemap.ces.census.gov.
For additional LMI data resources, see Appendix F.
HOW TO USE THE DATA
Now that you know what information you are looking for and where to find it, you are probably wondering what to do with it. When it comes to alignment, it is helpful to define a region and pick three to five key indicators that you think best make the case to get everyone on board with your alignment plans.
Defining your region can be difficult. For many districts it is easier to stick to a single county. However, if surrounding counties heavily influence your local economy, then it can be helpful to include them. Additionally, if your county has very few employers, then it may be beneficial to take a larger regional approach. In alignment, the rule of thumb is that your region should include places where your students can reasonably travel for work-based or other experiential learning opportunities since this is a large part of quality alignment.
It is important to look at historical data, current data, and projections: The balance of these three, as well as talking to partners, will help you see the big picture. Some of the most common indicators used for
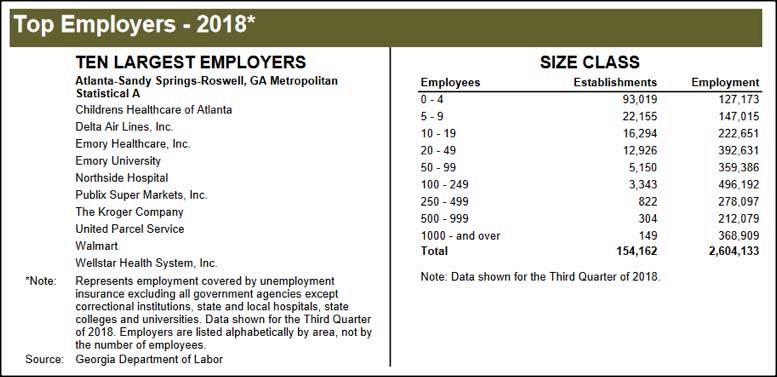
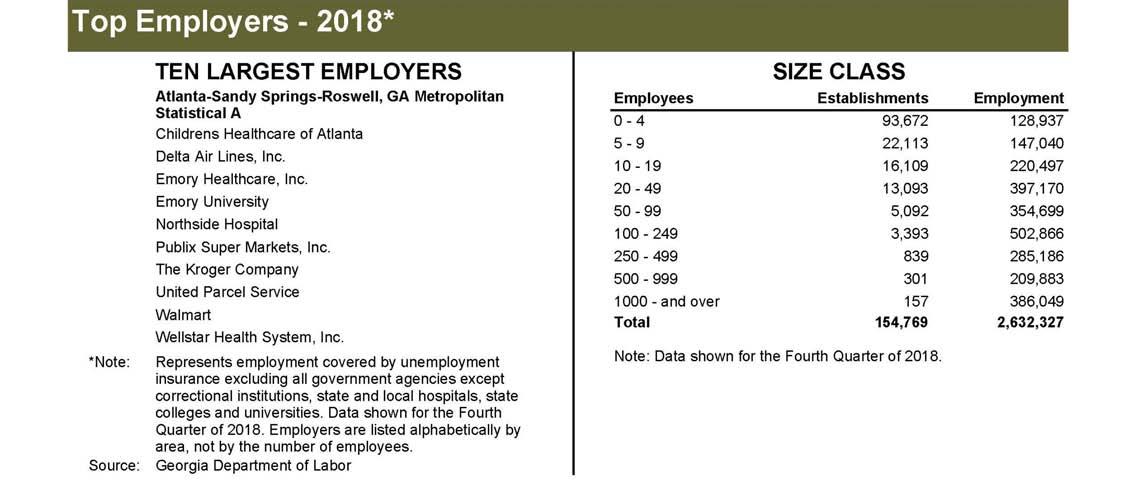
alignment are population projections, current employment levels in each industry, employment projections by industry, fastest growing occupations, typical education needed for an entry-level position, high school graduation outcomes, and largest employers in the area.
Once you pick which indicators you want to use, it is important to present the data in a way that everyone can understand. Educators may understand the education data easily but not the economic data, while community and business partners may understand economic and labor data but be confused about the educational data. Providing a combination of several types of indicators can make the conversation about creating new programs or aligning current ones easier.
Continue to reference the data throughout the alignment process, and circle back to it if people forget why they are participating in the process or the importance of alignment for all stakeholders. Making decisions based on the data will help schools know what to offer, help students be prepared for jobs in the community, and help businesses build their workforce pipeline.
KEY LABOR MARKET QUESTIONS FOR ALIGNMENT AND WHERE TO FIND THE ANSWERS
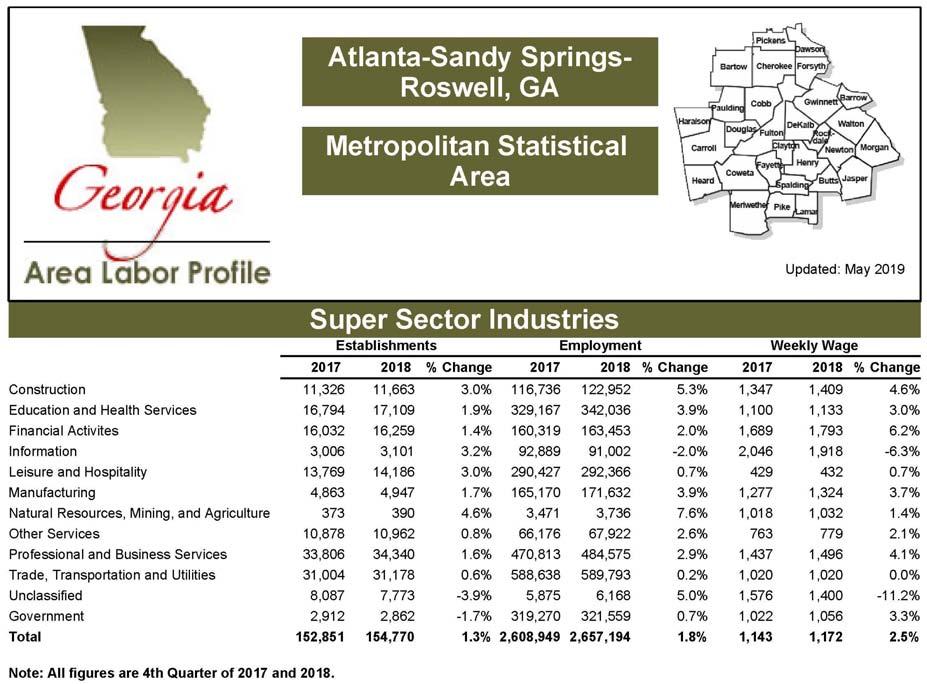
What are the largest industries in my region? Several different sources provide this information. For Georgiaspecific data, Georgia DOL creates area labor profiles for each county that can be found on its Labor Market Explorer site. This overview includes a wide variety of information, but some of the most useful parts are the industry mix and the top 10 largest employers in the county and surrounding area. If you are looking for additional industry information, the County Business Patterns page under Topics on GeorgiaData is a good resource. It provides the number of establishments, employees, and average annual wages for each industry by county.

What are the fastest growing jobs in my region? From the Georgia Labor Market Explorer homepage, you can click on “Occupational Outlooks.” This will give you a few options for occupational growth data, including fastest growing occupations, occupations with the most annual openings, and declining occupations. Most of the Georgia DOL labor data are presented by Local Workforce Development Area (LWDA), so you will select your area to view relevant data in an Excel spreadsheet.
What are the highest paying jobs in my region? Georgia DOL also provides occupational wage data on its website. This informationcan be sorted by the county labor draw area, MSA, or even my education and training level.
Where are people in my region commuting to and from for work? OnTheMap can help you define your region by allowing you to look at where people who work in your community live and where those who live in your community commute to for work.


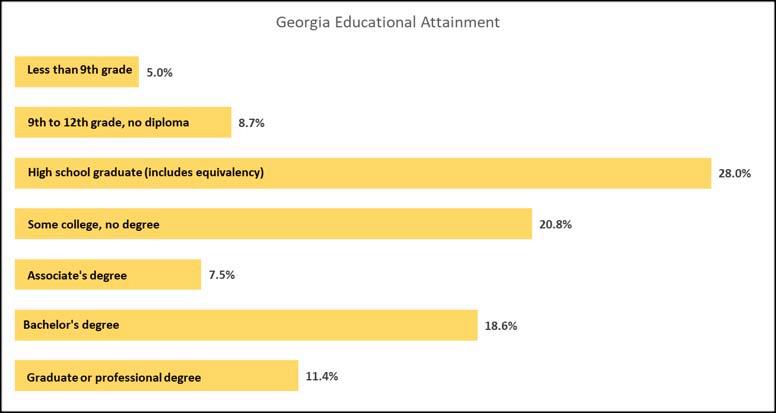
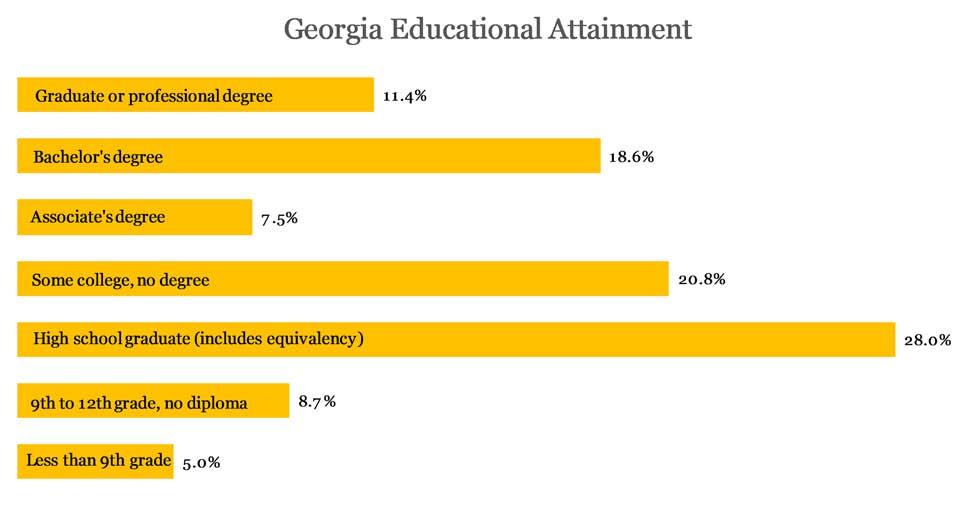
What are the current training and education levels of my community’s workforce? Use the American FactFinder tool to access American Community Survey data that show the educational attainment of your county or region’s population ages 25+.


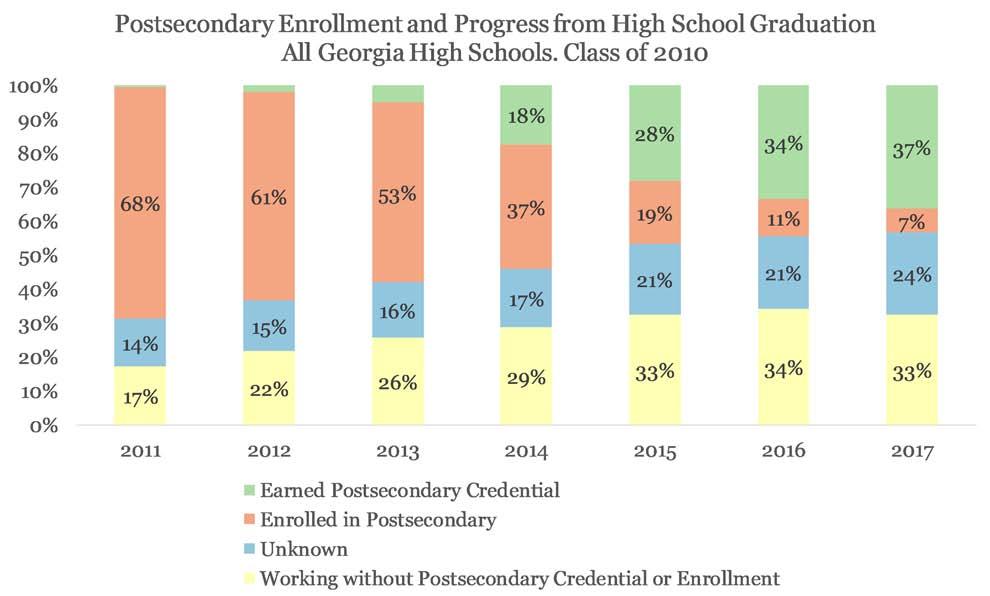
Where do the students from our high school(s) go after graduation? The GOSA High School Graduate Outcomes dashboard shows you how many students from a high school or district go on to pursue a career, additional education, etc. These data are presented by graduation cohort, so you can see how students’ post graduation decisions change over time.

Source: hsgrad.gosa.ga.gov/

