24 minute read
2 LITERATURE REVIEW

from 105547

2.1 COVID-19 IN THE CONTEXT OF RIO DE JANEIRO
When the public health emergency of COVID-19 was declared a pandemic on March 11, 2020, WHO took the lead concerning the initial guidelines that should be followed in addressing the health emergency. As a definitive solution to fight the disease was not available through the development of drugs or vaccines, the possible path of prevention would be adopting practices related to water, sanitation, and hygiene (WASH) (WHO, 2020). This provides for adequate sanitary facilities so that hand hygiene is carried out properly with drinking water and that contact surfaces are also adequately sanitized. Another essential aspect of preventing the spread of the disease is the adoption of social isolation and individual protection measures, such as the use of masks.
Advertisement
These measures end up affecting the functioning of cities, which, in some cases, even adopted lockdowns, with the closing of restaurants, cinemas, theaters, schools, gyms, among others public facilities, that is, an extreme effort in which most non-essentials activities are imposed some restrictions and people are confined to their homes. Thus, countries adopted procedures related to individual guidelines, such as social isolation, hygiene measures and the use of masks, and collective actions, such as activity restriction and mass testing. The way in which these measures were adopted and how the population was oriented had an impact on the performance of each country in facing the pandemic.
What can be seen in the graph below (Figure 1) is that Brazil's performance in tackling the pandemic is not considered acceptable in comparison to the largest global economies and the BRICS bloc (Brazil, Russia, India, China, and South Africa). It is possible to verify that Brazil is the only one of the selected countries to have shown a worsening trend in terms of the pandemic after a year of confrontation.
In Rio de Janeiro, schools were closed in March, and many of them adopted remote education. This situation is set amidst the lack of proper environments in which to carry out classes and adequate equipment, such as computers and the internet, a problem that can be posed to both students and teachers. According to data from Censo Escolar4 (INEP, 2019) and Instituto Brasileiro de Geografia e Estatística (IBGE)5 (2018), more than 60% of students enrolled in the municipality are in the public school system, precisely the one that lacks the most significant resources. In addition to the difficulty in continuing educational activities, there are impacts on young people's mental health with the loss of social activities carried out in schools. Students are also expected to lose their bonds to school due to a height in unemployment rates and the need to boost families’ income, in addition to the migration of students from the private to the public school system (Pereira, 2020).
Health-wise, Brazil has a Unified Health System (Sistema Único de Saúde - SUS) that guarantees public and free care to the entire population. However, due to its inability to provide quality care, part of the population with the highest income uses private health care. With the pandemic and its impact on employment and income, a migration of a part of the population served by the private health system to the public health system must be observed.
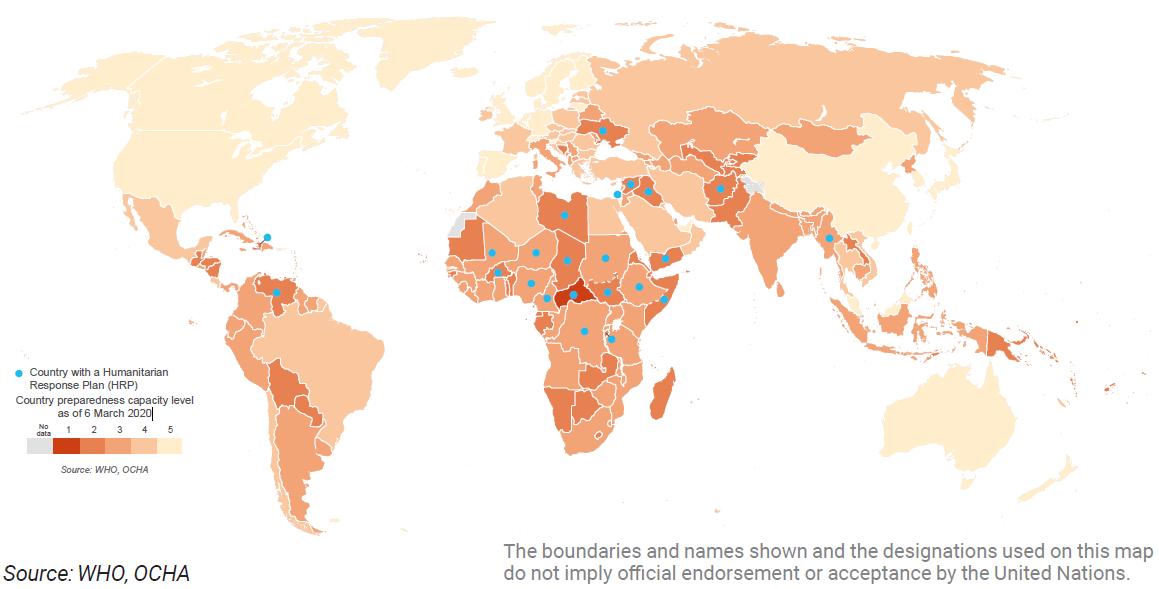
In the following map (Figure 2), it is possible to verify that the country had a good response capacity to COVID-19. However, each region of the country's situation is quite heterogeneous, in which the best health resources are often found in large urban centers.
In the city of Rio de Janeiro, according to the Cadastro Nacional de Estabelecimentos de Saúde (CNES)6 (2019), in the public system, there are approximately 7.86 ICU beds per 100 thousand inhabitants and 79.69 hospital beds per 100 thousand inhabitants. When the total numbers are observed (public and private health systems), the number of ICU beds increases to 38.5 per 100 thousand inhabitants and beds to 162.41 per 100 thousand inhabitants.
On the employment side, more than 68% of Rio de Janeiro's economic activity is dependent on the service sector, encompassing commerce, public administration, transport, telecommunications, rentals, and services provided to companies and families (Barboza et al., 2020). The country experienced a recession between 2015 and 2016, which generated significant unemployment. In 2019, while many places in the country witnessed a surge of job openings, in Rio de Janeiro, more than 7 thousand jobs were lost. COVID-19, in this scenario, dramatically affects the city's economy because of the high contribution of the service sector.
Furthermore, even before COVID-19, in 2019, unemployment in the city affected more vulnerable groups, such as women, young people, the poor, and the low-skilled. Regarding informality, the rate reached almost 36% of the city workforce (Ottoni et al., 2020). Even in March 2020, these groups were already identified as those who would be suffering the greatest risk in the face of the health crisis (UN, 2020). Thus, according to the predominant type of work that is carried out in the city, the pandemic maximizes the issue of unemployment as a large portion of the population does not have occupations compatible with remote work.
The sanitation issue is another point of attention related to the COVID-19 pandemic in Rio de Janeiro, considering that hygiene is an essential factor in combating the pandemic. Sanitation in the city is not universal. According to Instituto Trata Brasil7 (2020), 97.41% of the population has access to water supply and 85.14% to sewage supply. However, the percentage of collected sewage that is treated in comparison to water consumption is 42.87%. Thus, among the 100 largest cities in Brazil, Rio de Janeiro ranks 52 in the sanitation ranking.
Finally, the adoption of social isolation as a measure to combat COVID-19 finds an unfavorable housing scenario. As already mentioned in item 1.4, almost 20% of households are in slums with a high population density. It is estimated that more than 10% of households in the city have three or more residents per bedroom (IBGE, 2010).
2.2 SPATIAL ANALYSIS AND PUBLIC HEALTH
The conception that we have of GIS nowadays began to emerge in the 1960s, with the development of computerized map systems and the launch of remote sensing satellites of the Earth's surface. According to Smith et al. (2021, ¶ 2),
The term ‘GIS’ is widely attributed to Roger Tomlinson and colleagues, who used it in 1963 to describe their activities in building a digital natural resource inventory system for Canada (Tomlinson 1967, 1970). The history of the field has been charted in an edited volume by Foresman (1998) containing contributions by many of its early protagonists. A timeline of many of the formative influences upon the field is provided in Longley et al. (2015, p. 20). The research makes the unassailable point that the success of GIS as an area of activity has been driven by the success of its applications in solving real world problems.
Previous to the conception of GIS, but nonetheless part of its nature is spatial analysis, which can answer several questions related to data that have a geographical component. The table below (Figure 3) provides some examples of the types of questions that may appear in spatial analysis
Condition What is...? What is the population of this city?
Localization Where is...? What are the areas with a slope above 20%?
Trend
What has changed...? Was this land productive five years ago?
Routing Where to go.. ? What is the best way to the subway?
Pattern What is the pattern...? What is the distribution of dengue (disease) in Fortaleza?
Model What happens if...?
What is the impact on the climate if we deforest the Amazon?
In the health care field, these questions can also be asked to answer, for example, who fell ill, and where or when the disease occurred (Hino et al., 2006).
The spatial analysis conducted by John Snow in 1854, aiming to study the relationship between the occurrence of cholera in London and the supply of water in different supply pumps in the city (Snow, 1999), is a classic study of spatial analysis and can also be applied to public health. By mapping the locations of cholera deaths and whether the water supply came from a collection point upstream or downstream of the sewage discharge into the River Thames (Figure 4), Snow was able to demonstrate the relationship between the disease and water contamination conclusively.
The applications of GIS in public health are diverse, especially in the field of epidemiology, where geographic information can be used to search for causes and effects related to the health of the population (León, 2007).

One of the main approaches of mapping in epidemiology is identifying risks according to geographic regions, merging information related to the frequency of occurrence, spatial distribution, and factors that offer health hazard and that do not have a homogeneous distribution in all social groups. Knowledge of this information is essential to reduce or eliminate the health risks to a specific population and, in a preventive sense, avert the emergence of dangerous situations in public health.
According to the Ministério da Saúde (2006), the main applications of spatial analysis in public health are:
- Disease mapping, through the construction of maps of epidemiological indicators;
- Ecological studies, measuring the association between aggregated indicators;
- Health and environment, relating different layers of data on environment and health;
- Detection of clusters, identifying clusters related to the highest incidence of diseases and variables of interest;
- Diffusion processes, evaluating the evolution of the spatial distribution of diseases in time and space;
- Study of trajectory between locations, aiming to analyze health care networks; Going further, these analyses can be grouped into three major fields of knowledge (Figure 5), assisting in the planning, evaluation, and monitoring of programs implemented in public health and decision-making by politicians and managers.
Spa al distribu on of diseases and determina on of pa erns elimita on of ris areas apping of basic health indicators nalysis of research hypotheses from the understanding of di usion and e posure to speci c agents lanning of disease preven on and control ac vi es. nalysis of the spa al distribu on of health services lanning and op mi a on of health resources ccessibility study se of health services nalysis of the pa ent ow to determine areas of demand for health resources rban disease ecology
Study of social, demographic and environmental factors in ci es nalysis of how pollu on, overpopula on, stress and poverty a ect human health in ci es i erences in the use of space by di erent social groups due to economic and poli cal pressures on society
These possibilities of using GIS in public health allow essential questions to be answered to understand important phenomena in the field of health surveillance (Ministério da Saúde, 2006), such as
• what is the pattern of case distribution of a disease in space;
• whether there is any relationship between a disease, possible sources of contamination, or means of dissemination;
• what is the evidence about the transmissibility of a disease, whether it is transmitted from individual to individual or through a common source.
Regarding the methods used in the spatial analysis of information related to public health, according to Hino et al. (2006), they can be divided into:
- Visualization: the mapping of health events is the primary tool, ranging from the point distribution of events to complex overlays of disease incidence maps which describe the distribution of certain variables of interest
- Exploratory data analysis: used to describe spatial patterns and the relationship between maps. Some exploratory techniques will take the form of graphs (histograms, scatterplots, among others), while others will be cartographic in nature
- Modeling: used when it is intended to formally test a hypothesis or estimate relationships, such as, for example, between the incidence of a given disease and environmental variables.
Thus, it is possible to verify the adherence in the use of spatial analyzes with a focus on public health, especially with the use of GIS tools. However, some problems were noticed (Abdullahi et al., 2010), such as the lack of standardization and information about the source of the data produced, given that there are many different sources in the health field that produce geographic information; some information produced in the health field is generated by specific applications, making integration with other databases difficult, which also causes problems related to interoperability.
In addition to these factors, in Brazil, the lack of databases for specific health information, as well as other types of information that are added to spatial analyzes, such as socioeconomic and demographic data, can be mentioned as a historical problem for spatial analyzes in public health (Chiaravalloti-Neto, 2016). This problem has been gradually overcome with the greater availability of geographic databases and health information systems.
2.3 SPATIAL ANALYSIS AND COVID-19
At the beginning of the pandemic, the studies carried out to understand its evolution in space and time have as background several different applications. In Brazil and internationally, these studies aim to characterize the dynamics and dissemination of the pandemic in the territory and its flows to provide a more significant base of information for society and support governmental decisions. There is also the concern to relate the data of COVID-19 to other social and demographic variables in order to flesh out the vulnerabilities of certain groups in facing the pandemic. The use of online mapping systems and GIS tools are fundamental in understanding a pandemic that has quickly spread in space.
In the Brazilian context, the spatiotemporal analysis of COVID-19, using the official government databases, was used to understand the spread of the disease in the municipalities of the state of Rondônia. Through the mappings performed, it was observed that the number of ICU beds offered by the state was insufficient, which could result in the collapse of the health system (Belforte et al., 2020).
Considering that the number of infected and victims of COVID-19 is not enough information to understand the disease’s spatial and temporal dynamics, Cardoso et al. (2020) report the initiative for a COVID-19 mapping portal in the municipality of São Gonçalo, in the state of Rio de Janeiro. In addition to informing the population about the evolution of the disease in space, the maps produced aimed to assist public managers in responding to health emergencies.
Aguiar (2020) seeks to understand, through mappings, how the transit of people between cities impacted the spread of the virus in the world, according to the routes traveled and accounting for those arriving by air travel in Brazil. In the country, at first, the virus followed a path of dissemination through air transport, later reaching more distant regions through highways and waterways. Knowledge and control of disease flows are essential for an efficient allocation of resources to face the pandemic.
The spatiotemporal evolution of the COVID-19 cases in Niterói, in the state of Rio de Janeiro, was studied in relation to the city’s neighborhoods, relating some social indicators, such as income, number of elderly people, and hospitals’ bac drop. The elaboration of maps based on the study carried out by Leal et al. (2020) identifies the neighborhoods in which the pandemic had the most remarkable development related to elderly people’s presence in those places. Also, the study demonstrates the principal axes for the spread of the disease in the city. It is observed that the neighborhood with the highest prevalence of cases is the one with the highest concentration of elderly people and the highest concentration of income in the city at the beginning of the pandemic.
At the international level, Sodoré et al. (2020) conduct a study similar to that of Aguiar (2020) when carrying out mappings to understand the dynamics of flows and spatial diffusion of COVID-19 in Burkina Faso, West Africa, which is an impoverished country, with social problems and poor health infrastructure, and it has one of the highest mortality rates by COVID-19 on the African continent. As in Brazil, in that country, the wealthier classes imported the virus from trips abroad, with the city of Paris, France, being observed as the main hub for the dissemination of COVID-19 to the capitals of countries in western Africa. Burkina Faso’s capital, Ouagadougou, is the epicenter of the disease’s spatial spread, which ends up spreading the virus to smaller cities within a radius of influence of about 100 km.
Boulos & Geraghty (2020) discuss how GIS has helped to fight the pandemic, presenting some initiatives that have been developed since its emergence. Thus, Johns Hopkins University’s initiative can be mentioned, which uses Esri’s applications to provide dashboards with the pandemic information around the world. The World Health Organization has made available a dashboard for monitoring the pandemic, also based on Esri’s applications. Another initiative, HealthMap compiles real-time information about COVID-19 based on different data sources, as does BlueDot, which uses machine learning and natural processing language to extract information from COVID-19 and its developments from different sources around the world. China has also launched some platforms, such as the “close contact detector”, which helps in the identification and proximity to possible people who are contaminated by COVID-19 or suspected, helping in decision making by the user. There is also a tracking system in the Guangzhou metro that helps in tracking contact in the event of possible contagion. Finally, WorldPop and EpiRisk use mobility data to build predictive risk maps. In addition to providing accessible information to the general population, these GIS-based mapping platforms help combat misinformation about the pandemic.
In Pakistan, Sawar et al. (2020) list some challenges related to the use of GIS to monitor the pandemic in the country, among them, the development and application of GIS tools; the identification of pandemic outbreaks in space, with case monitoring, segmentation, and dynamic mapping of the evolution of the pandemic; the management of the data that are important for the understanding of the pandemic and that will be used in the mapping; making predictions based on hypothesis testing and risk maps concerning the demands for medicines; monitoring the chain supply and risk transportation; keep track of how the spread of social sentiment in space and other relevant discoveries take place. The study concludes that the best use of GIS tools provides a faster and more effective response by the country’s authorities in combating the pandemic, such as, instead of decreeing a widescale lockdown throughout the country, identifying areas that need to adopt more restrictive measures.
Using spatial statistics, Kim & Bostwick (2020) verify the correlation, in the community areas of Chicago, USA, between the risk of death by COVID-19, the social vulnerability index, the health risk score constructed for the city, and the population concentration of African-Americans, exposing how COVID-19 affects social strata differently, being yet another factor in exposing inequalities.
A similar approach is carried out by Tao et al. (2020) in the state of Florida, USA, an analysis relating the accessibility to COVID-19 tests to certain groups, such as African-Americans, Asians, low-income groups, and the elderly, verifying that an effort should be made to safeguard the most vulnerable population more efficiently.
At the national level in the USA, Mollalo et al. (2020) list 35 variables in different groups (socioeconomic, environmental, behavioral, topographic, and demographic) that can explain the spatial variability of the incidence of cases of COVID-19, using models such as the geographically weighted regression (GWR) and the multiscale geographically weighted regression (MGWR). The variables that can explain the variability in the incidence of cases of COVID-19, four from the initial group of 35, which are median household income, income inequality, percentage of nurse practitioners, and percentage of black female population Maps were built with the spatial distribution of the coefficients found for each variable, as well as a map with the local distribution related to the four selected variables. It was found that the MGWR model being the most appropriate to explain the greatest variations, reaching an R2 of 68.1%.
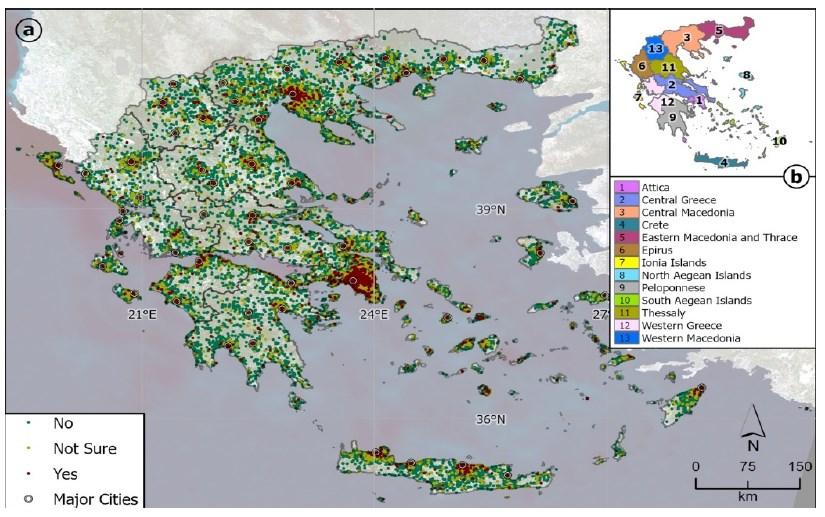
Antoniou et al. (2020) note the use of crowdsourcing as a tool for mass surveys in Greece. For this, a simple question was asked using Survey123 for ArcGIS if the person had had any symptoms of COVID-19. The interviewee provided his location after selecting one of the three possible responses (No, Not sure, and Yes). The survey was released on March 16, 2020, through social media, e-mails, and some appearances on TV and communication with the press. The responses fed a real-time dashboard (Figure 6a). In about a month, more than 200,000 responses were obtained across the country, most of them concentrated in the first days after the release, verifying the relationship between the number of responses, the population concentration, and the number of COVID-19 cases based on official numbers. Thus, it was verified the application of this initiative in the identification of hot spots of the disease, and it can be a tool to be used by the public power in securing quick responses by the population as an alternative to the use of tracing apps. In Figure 6b in the sequence, it possible to see the responses’ locations obtained in the survey all over Greece.

2.4 MONITORING OF COVID-19 USING GEOPORTALS
The rapid spread of the new coronavirus, which has a high rate of contagion, driven by the large circulation of people globally through harbors and airports, ensured a geographical dimension different from that experienced in other pandemics. The few months that separate the detection of Sars-Cov-2 in December 2019 in China, until the pandemic decree by WHO in March 2020, was accompanied by a series of initiatives to monitor the evolution of the disease in space and in time, being one of the best known on a global level the Johns Hopkins University (JHU) (2020) initiative, named COVID-19 Dashboard, which already has more than 1.6 billion unique accesses (MundoGEO, 2020b) and provides information on the evolution of the disease in real-time.
The tool presents various information about the evolution of the pandemic, such as active and accumulated cases, deaths, and recoveries in 191 countries and regions of the world. Also, in January 2020, data were collected and processed manually (Dong et al., 2020), with the need to make the tool more automated with the development of the disease. In addition, to provide transparency to the general population, authorities, and researchers regarding the pandemic’s evolution, the initiative makes available for downloading the data used to feed the dashboard in a repository.
On these initiatives to monitor the evolution of the pandemic in space in real-time, Silva (2020, ¶ 2) points out that:
(...) they are extremely important to inform the population about the contagion of the disease, whether at the local, regional or global level. Thus, it is possible to verify both the evolution of contagion and the occurrence of deaths resulting from infection by COVID-19. Reading and interpreting this scenario provides support for decision making at the government level, such as the adoption of restrictive measures and social isolation8
8 The original text was translated from Portuguese by the author and can be read at https://mundogeo.com/2020/04/08/artigo-geotecnologias-na-identificacao-de-impactos-sociais-devido-acovid-19/. Retrieved November 11, 2020.
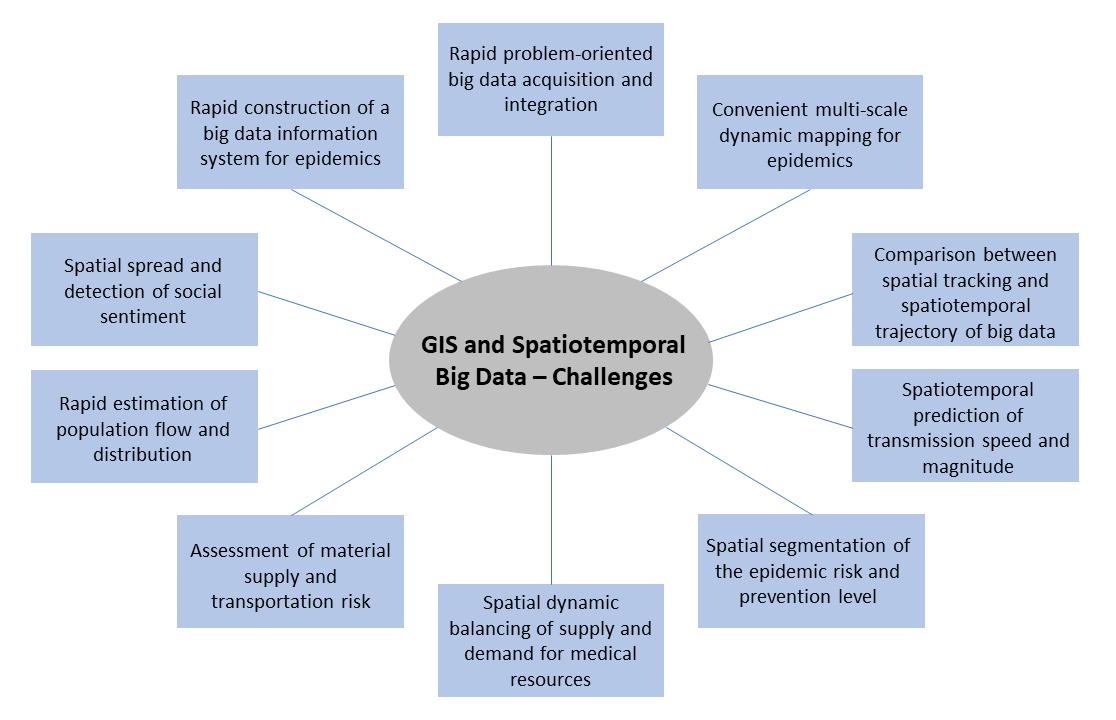
Observing this large volume of information being produced daily, from several different locations, it can be noticed the problem of processing the information obtained and the integration of different databases. In this regard, it is possible to state that many monitoring platforms of COVID-19 need to work with information from the perspective of spatial big data. Thus, in Figure 7, it is possible to observe some challenges related to the use of GIS with big data from a space-time perspective.
In the ten challenges presented, it is possible to highlight some points raised by the authors, such as the integration of bases from different sources produced in different contexts, scales, and spatial references. Furthermore, the short time for updating information and developing applications, given the rapid development of the pandemic and taking into account that they need to be friendly to the general public and present large volumes of data on multiple scales (continents, countries, regions, counties, cities, etc.). This information is extremely relevant to recognize the path and speed of the spread of the disease and to make predictions of how it will behave in the future and in different contexts. Finally, this perspective on mental health and feelings related to the pandemic is relevant in the context of GIS, considering that humanity experienced an unexpected health emergency (at least, for a large portion of the population), generating an unprecedented level of uncertainty, which can be perceived in different ways depending on the context and location.
There are initiatives by different social segments in Brazil in the online mapping of COVID19 in space and time. As the country has continental dimensions and is divided into federations (states), the number of COVID-19 mapping initiatives is quite extensive, being developed by universities, public and private institutions, state governments and city halls, NGOs, among others. As a very heterogeneous country, the spread of COVID-19 was felt in different ways in each region.
Thus, with the focus of the present study being Rio de Janeiro, Figure 8 below shows some initiatives that have been developed to tackle the COVID-19 situation. The number of portals for mapping the disease is not intended to be exhaustive, only to present the main initiatives that reach the municipal level of Rio de Janeiro or that were developed specifically for the city. The figure lists the main approaches related to COVID-19 and how spatial information is presented.
Site Name Particular Subject Region
Ideia Big Data
Covid por CEP
Rio de Janeiro
Analysis of COVID19 and its impact on politics, behavior, among others
Brazil and the World
Spatial Information Developers Link
There are maps to illustrate some analyzes, but it is not a mapping platform
Private company (IDEIA)
COVID-19 active cases and deaths according to postal code Rio de Janeiro Geoportal Independent initiative based on official data https://ideiabigdata.com/covid19/ https://covidporcep.rio.br/
Observatório COVID-19 BR
Provides information on COVID-19 cases, deaths, contagion dynamics, occupation of the hospital network, among others
Brazil, states, and municipalities
Depending on the subject there are thematic maps to represent the data
Independent initiative by several researchers https://covid19br.github.io
Painel Rio COVID-19
Provides information on confirmed cases, recoveries, deaths and active cases of COVID-19, among others
Rio de Janeiro Geoportal Rio de Janeiro City Hall https://experience.arcgis.com/exp erience/38efc69787a346959c9315 68bd9e2cc4
MonitoraCovid -19
Portal GEOCOVID-19 Brasil
COVID-19 Analytics
O IBGE apoiando o combate à COVID-19
Coronavírus Brasil
Daily cases, accumulated cases, deaths, combat measures, statistical analysis, among others
COVID-19 cases and deaths, projections, isolation, and reports
Brazil, states, and municipalities
There are interactive maps depending on the theme, but it is not a geoportal
Brazil, states, and municipalities Geoportal
Pandemic-related statistics and forecasting models Brazil
Data and statistics related to the pandemic, such as unemployment rate, impacts on the health network
Data and statistics on daily and accumulated cases, recoveries, deaths, among others
Retrieved November 8, 2020.
Brazil, states, and municipalities
Brazil, regions, states, and municipalities
There are maps to illustrate some analyzes, but it is not a mapping platform
Website that collects a variety of information. There are links to interactive maps.
There are interactive maps, but it is not a geoportal
Oswaldo Cruz Foundation (FIOCRUZ)
Interinstitutional network initiative
Pontifical Catholic University of Rio de Janeiro (PUCRJ) and others
Brazilian Institute of Geography and Statistics (IBGE)
Ministry of Health https://bigdatacovid19.icict.fiocruz.br http://covid.mapbiomas.org https://covid19analytics.com.br https://covid19.ibge.gov.br https://covid.saude.gov.br
2.5 GIS AND COLLABORATIVE MAPPING
Collaborative mapping plays an extremely relevant role in connecting traditional communities and all the knowledge they have accumulated over time with the decisionmaking process related to the territory’s use. In this way, often-marginalized demographics assume a role that guarantees autonomy and preservation of their identity, besides approximating local knowledge to the technical-academic environment (Araújo & Nascimento, 2012).
Even in this context, GIS are understood as one of the instruments used in collaborative mapping (FIDA, 2009, p. 17), being increasingly accessible to a large part of the population, making the process more democratic and participatory.
Collaborative mapping in the context of the technologies available today has evolved into the so-called Volunteered Geographic Information (VGI). According to Goodchild (2007), some technologies were essential for the development of VGI, such as Web 2.0, georeferencing, geotags, GPS, graphics, and broadband communication:
- The advent of Web 2.0 allowed greater user interaction on the network, which allowed them to be not only a consumer of content but also someone capable of feeding content to the network. This context culminated in the concept of Geoweb, in which it is possible to share geographic information over the internet (Bravo & Sluter, 2018). It was observed, then, the generation of different collaborative mapping products, such as OpenStreetMap.
- The georeferencing of several systems allows interoperability between platforms, such as, for example, between data collected in the field on a device that uses GPS, an online mapping platform, and GIS software.
- The insertion of geographic information through geotags allows the inclusion of geographic location on websites, photographs, among others.
- The incorporation of GPS in general-purpose devices, allowing the acquiring of coordinates, location, measurements, etc.
- The improvement in the quality of graphics and map visualizations, including in 3D.
- The ability to communicate through a fast internet connection, which allows the transfer of large volumes of data.
Thus, a new way of observing phenomena that occurs on the Earth’s surface has developed in recent decades. This context allowed people who did not necessarily have knowledge in cartography to become engaged in mapping endeavors or events of collective interest, acting in the mapping of disasters, reporting traffic events, robberies, among others.
VGI ensures greater agility in the production and dissemination of information. The collection of local information, on a large scale, for example, would require a high investment of time and financial resources that public authorities would probably not be able to invest, considering the number of demands and specific situations in a given location. Thus, it is possible that with the offer of current technologies, information will be produced and made available at a more compatible speed with the occurrence of the fact, enabling more timely responses to solve problems, including from the government
If, on the one hand, VGI empowers ordinary people to generate geographic information from their perspective of observation (Goodchild & Glennon, 2010), on the other hand, it segregates, even more, those on the margins of the digital inclusion process (Haworth & Bruce, 2015), being yet another factor in the deepening of inequalities.
Besides, there are factors in the generation of VGI that may cause unease and mistrust, related to the privacy and security of data provided voluntarily (Haworth & Bruce, 2015), as well as the fact that non-expert individuals provide information that can end up generating low-quality information and credibility (Elwood et al., 2012).
According to Bravo (2018), it is necessary to differentiate some related concepts, such as “crowdsourcing”, collaborative mapping, and VGI. The first deals with online data collection from multiple sources; the second deals more with the empowerment of communities, as previously mentioned, and information sharing; finally, the VGI is information generated voluntarily and shared by people who do not necessarily have specific knowledge in mapping
The increasingly intuitive and friendly systems have given the possibility not only of the professional with technical knowledge to be part of this collective construction but also of the layperson, in what came to be called VGI (Volunteered Geographic Information), favoring the quick obtainment of geographic information, which can be relevant in the construction of warning systems in place in cities (related to floods, public safety, among others), as well as in the context of a public health emergency such as the one the world is going through. Thus, ordinary people can become a progressively important link in the process of producing information, administration, and decision-making in their locality.
2.6 SURVEY123 FOR ARCGIS
2.6.1 AN OVERVIEW
Survey123 for ArcGIS is a solution developed by the Environmental Systems Research Institute (Esri) for creating, sharing, and analyzing surveys (Esri, 2021a). The tool allows the information to be collected via the web or by mobile devices, enabling several research applications that involve a community engagement process. According to Smith (2017), the software has features that help in the community engagement process, being a solution that presents easy integration with ArcGIS desktop and with Esri online platforms, allowing a deep spatial data analysis, in addition to being an intuitive software for the research developer and friendly for the interviewee.
The method of using the tool encompasses the steps described as 1-2-3 process (Esri, 2019): (1) ask questions, (2) make answers, and (3) make better decisions, as shown in Figure 9 below, which presents a schematic of this process.
The survey can be developed in two ways using the tool, through the Survey123 website or the desktop application, using Survey123 Connect, which allows for more sophisticated questionnaire creation using an XLSform.
The response capture process can take place through a field app that allows responses to be given online and offline. In this case there is a restriction, since access to research through the app is only performed by users who have an account with Esri. There is also the possibility of replying via the web browser.

Regarding data analysis’s possibilities to support decision-making, the Survey123 website allows the visualization of several statistics related to data capture. However, if Survey123 Connect is used, depending on the type of question elaborated in the questionnaire, the data analysis performed on the website is not understandable for forms elaborated in XLSform.
The responses given to Survey123 are stored as a hosted feature service, allowing the preparation of analyzes and maps in ArcGIS Online and integration with other Esri apps, such as Operations Dashboard, StoryMaps, and Collector. The data can also be exported in different formats, such as comma-separated values (CSV), shapefile, or geodatabase, making it possible to carry out various analyses.
2.6.2 CASE STUDIES
Survey123 can be used in different knowledge areas related to applications in the environment, health, and urban organization.
In the state of Montana, in the United States, the application was used to assist the work of Citizen scientists at Glacier National Park in field observation of loons, part of the Common Loon Citizen Science Project (Wold, 2021). The use of Survey123 by the researchers provides a database in which the researcher himself can follow the results of his actions by visualization of maps created instantly. Besides, it allows decision-making to occur more quickly so that the park remains healthy.
In the United States also, on the northeast Pacific coast, PBS Engineering and Environmental collects data in the field using Survey123 related to environmental site assessments and stormwater inspections for reporting, adding on-site photographs and maps (Esri, 2021b). In addition to automating data collection, one of the positive aspects of using the tool is that data collection does not require that whoever is collecting it to have GIS experience.
Survey123 is also used by the Lebanese Red Cross, where volunteers survey various issues of interest, such as recruiting blood donors and assessing refugees’ health (Esri, 2021c).
The data collected in the entity’s projects were integrated with ArcGIS Dashboards, which gives a real-time view of the data obtained and in ArcGIS for Power BI, making it possible to carry out data analysis.
Rio de Janeiro’s city hall used the data collected in a Survey123 to verify the interest of the local population in downtown neighborhoods (Prefeitura do Rio de Janeiro, 2021). The results feed into a Dashboard for ArcGIS that presents the main data collected. The results obtained from gathering the information help managers in making decisions about how to revitalize the city center.


