QUID PRO QUO -
JOEL JONES -

UNIT Y5 JJ
YEAR 5 @unit14_ucl
All work produced by Unit 14
-
www.bartlett.ucl.ac.uk/architecture
Copyright 2021
The Bartlett School of Architecture, UCL All rights reserved.

No part of this publication may be reproduced or transmitted in any form or by any means, electronic or mechanical, including photocopy, recording or any information storage and retrieval system without permission in writing from the publisher.

@unit14_ucl
 Cover design by Charlie Harris
joeltjones@yahoo.co.uk @joeljonesarch
QUID PRO QUO
MIXED-INCOME HOUSING IN LAGOS, NIGERIA
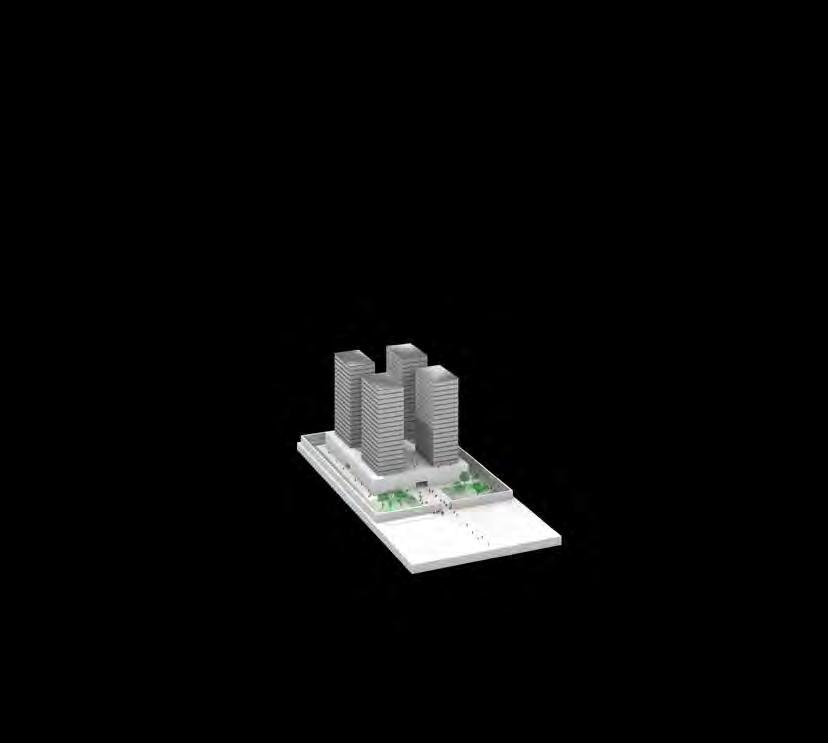
LAGOS, NIGERIA

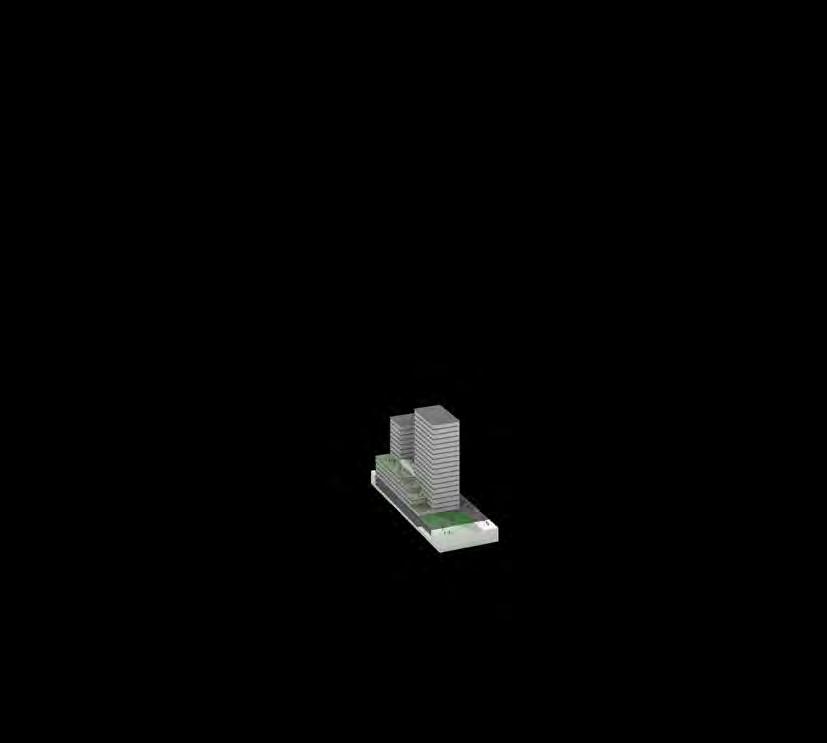
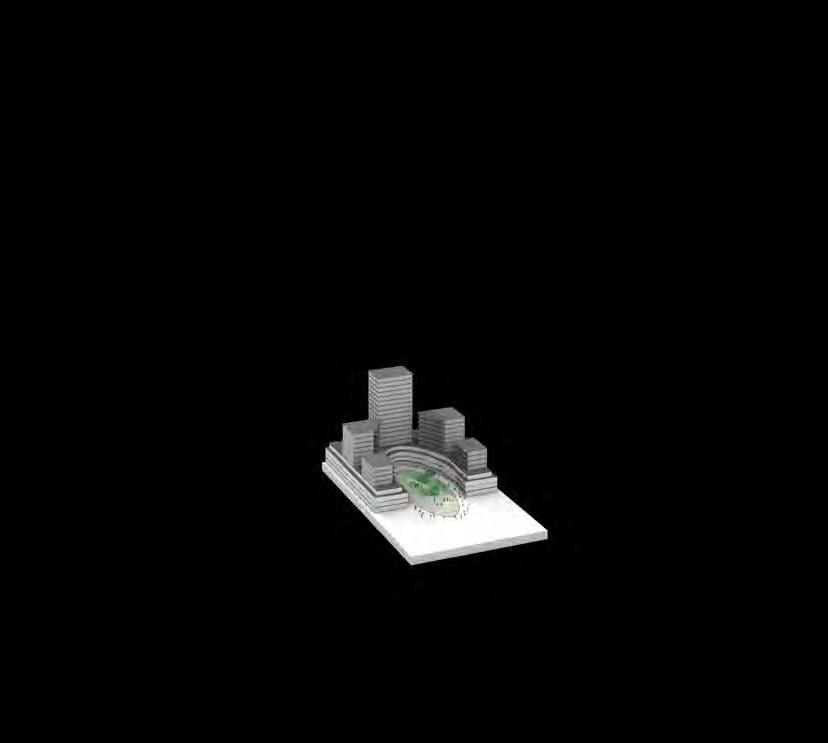
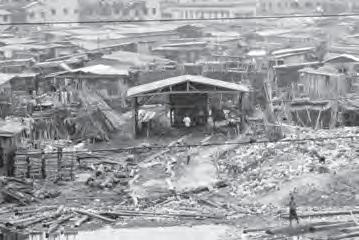
The project presents a proposal which aims to address the high levels of substandard living and unemployment in Lagos. The city’s dominant typology of new high-end developments are only affordable to wealthier residents. Consequently most low income earners in Lagos reside in informal settlements which provide the only affordable space remaining in the city. The scheme challenges this disparity and exemplifies how a mutually beneficial mixed housing development could provide low-income residents with affordable housing and business space aimed at providing services to high end residents.
The research highlighted certain livelihoods that are a lifeline for impoverished communities in Lagos. A further role of the new proposal was to facilitate these professions; prioritising the occupation of fishing into the commercial spaces, preserving both the source of income for the low-income earners and protecting this core part of their cultural identity.
JOEL JONES YEAR 5
Y5 JJ
Quid Pro Quo
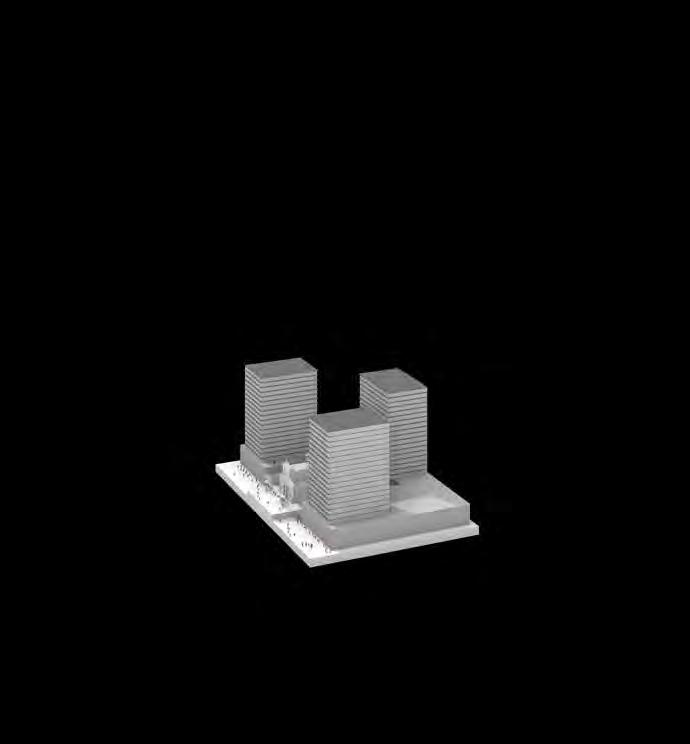
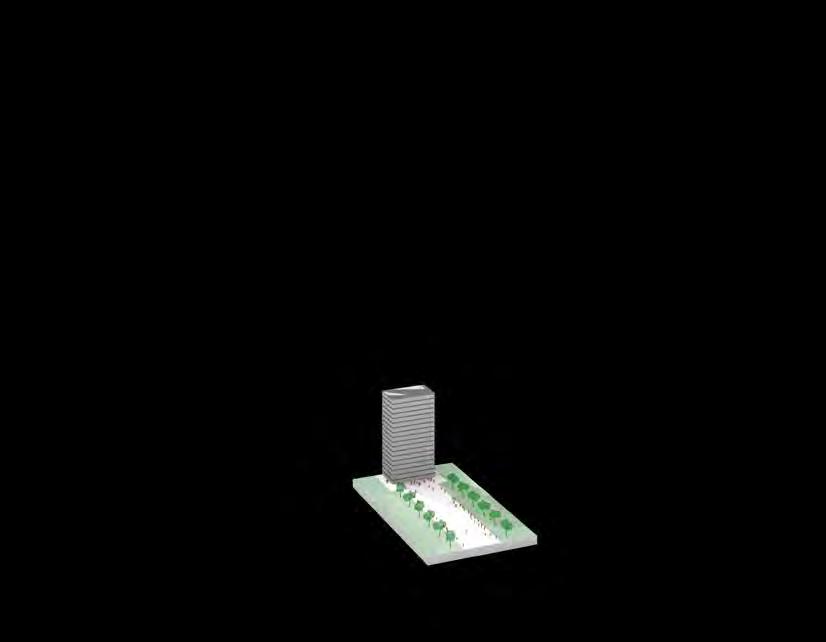
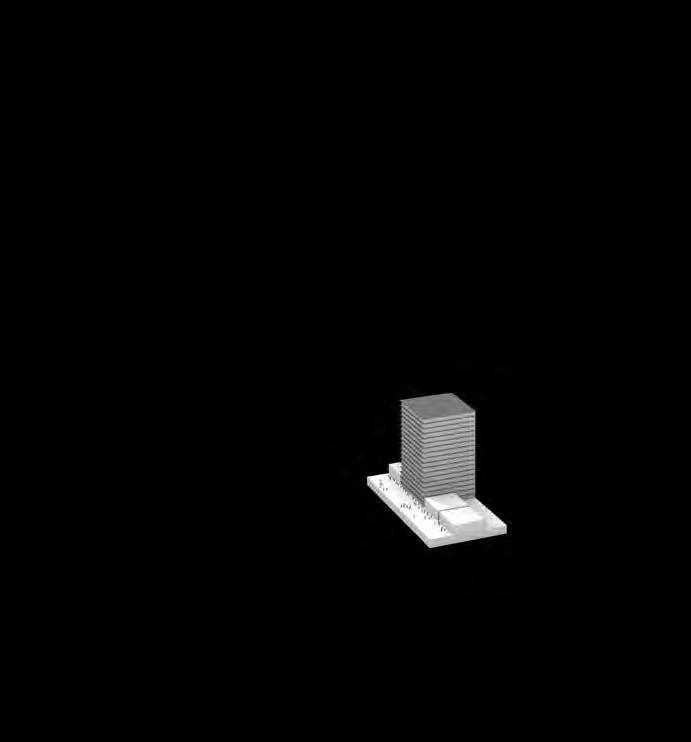
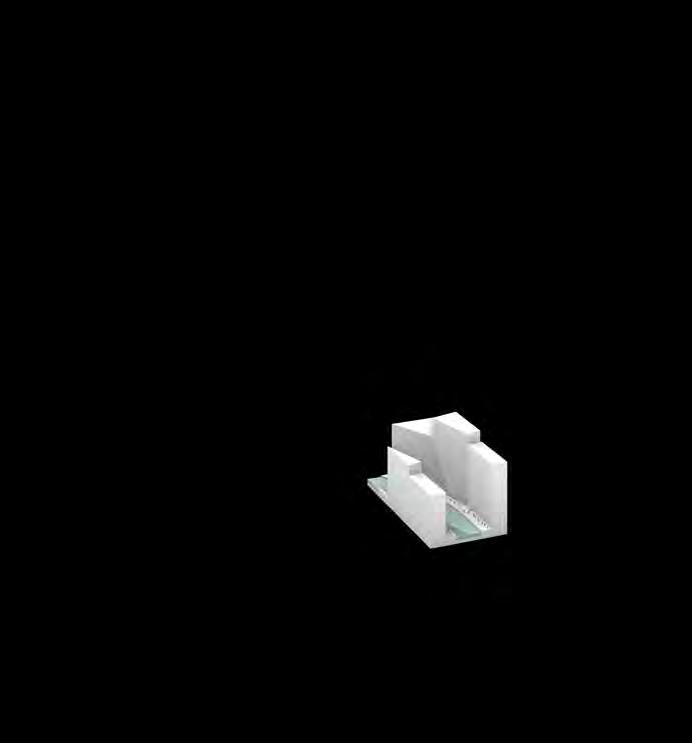
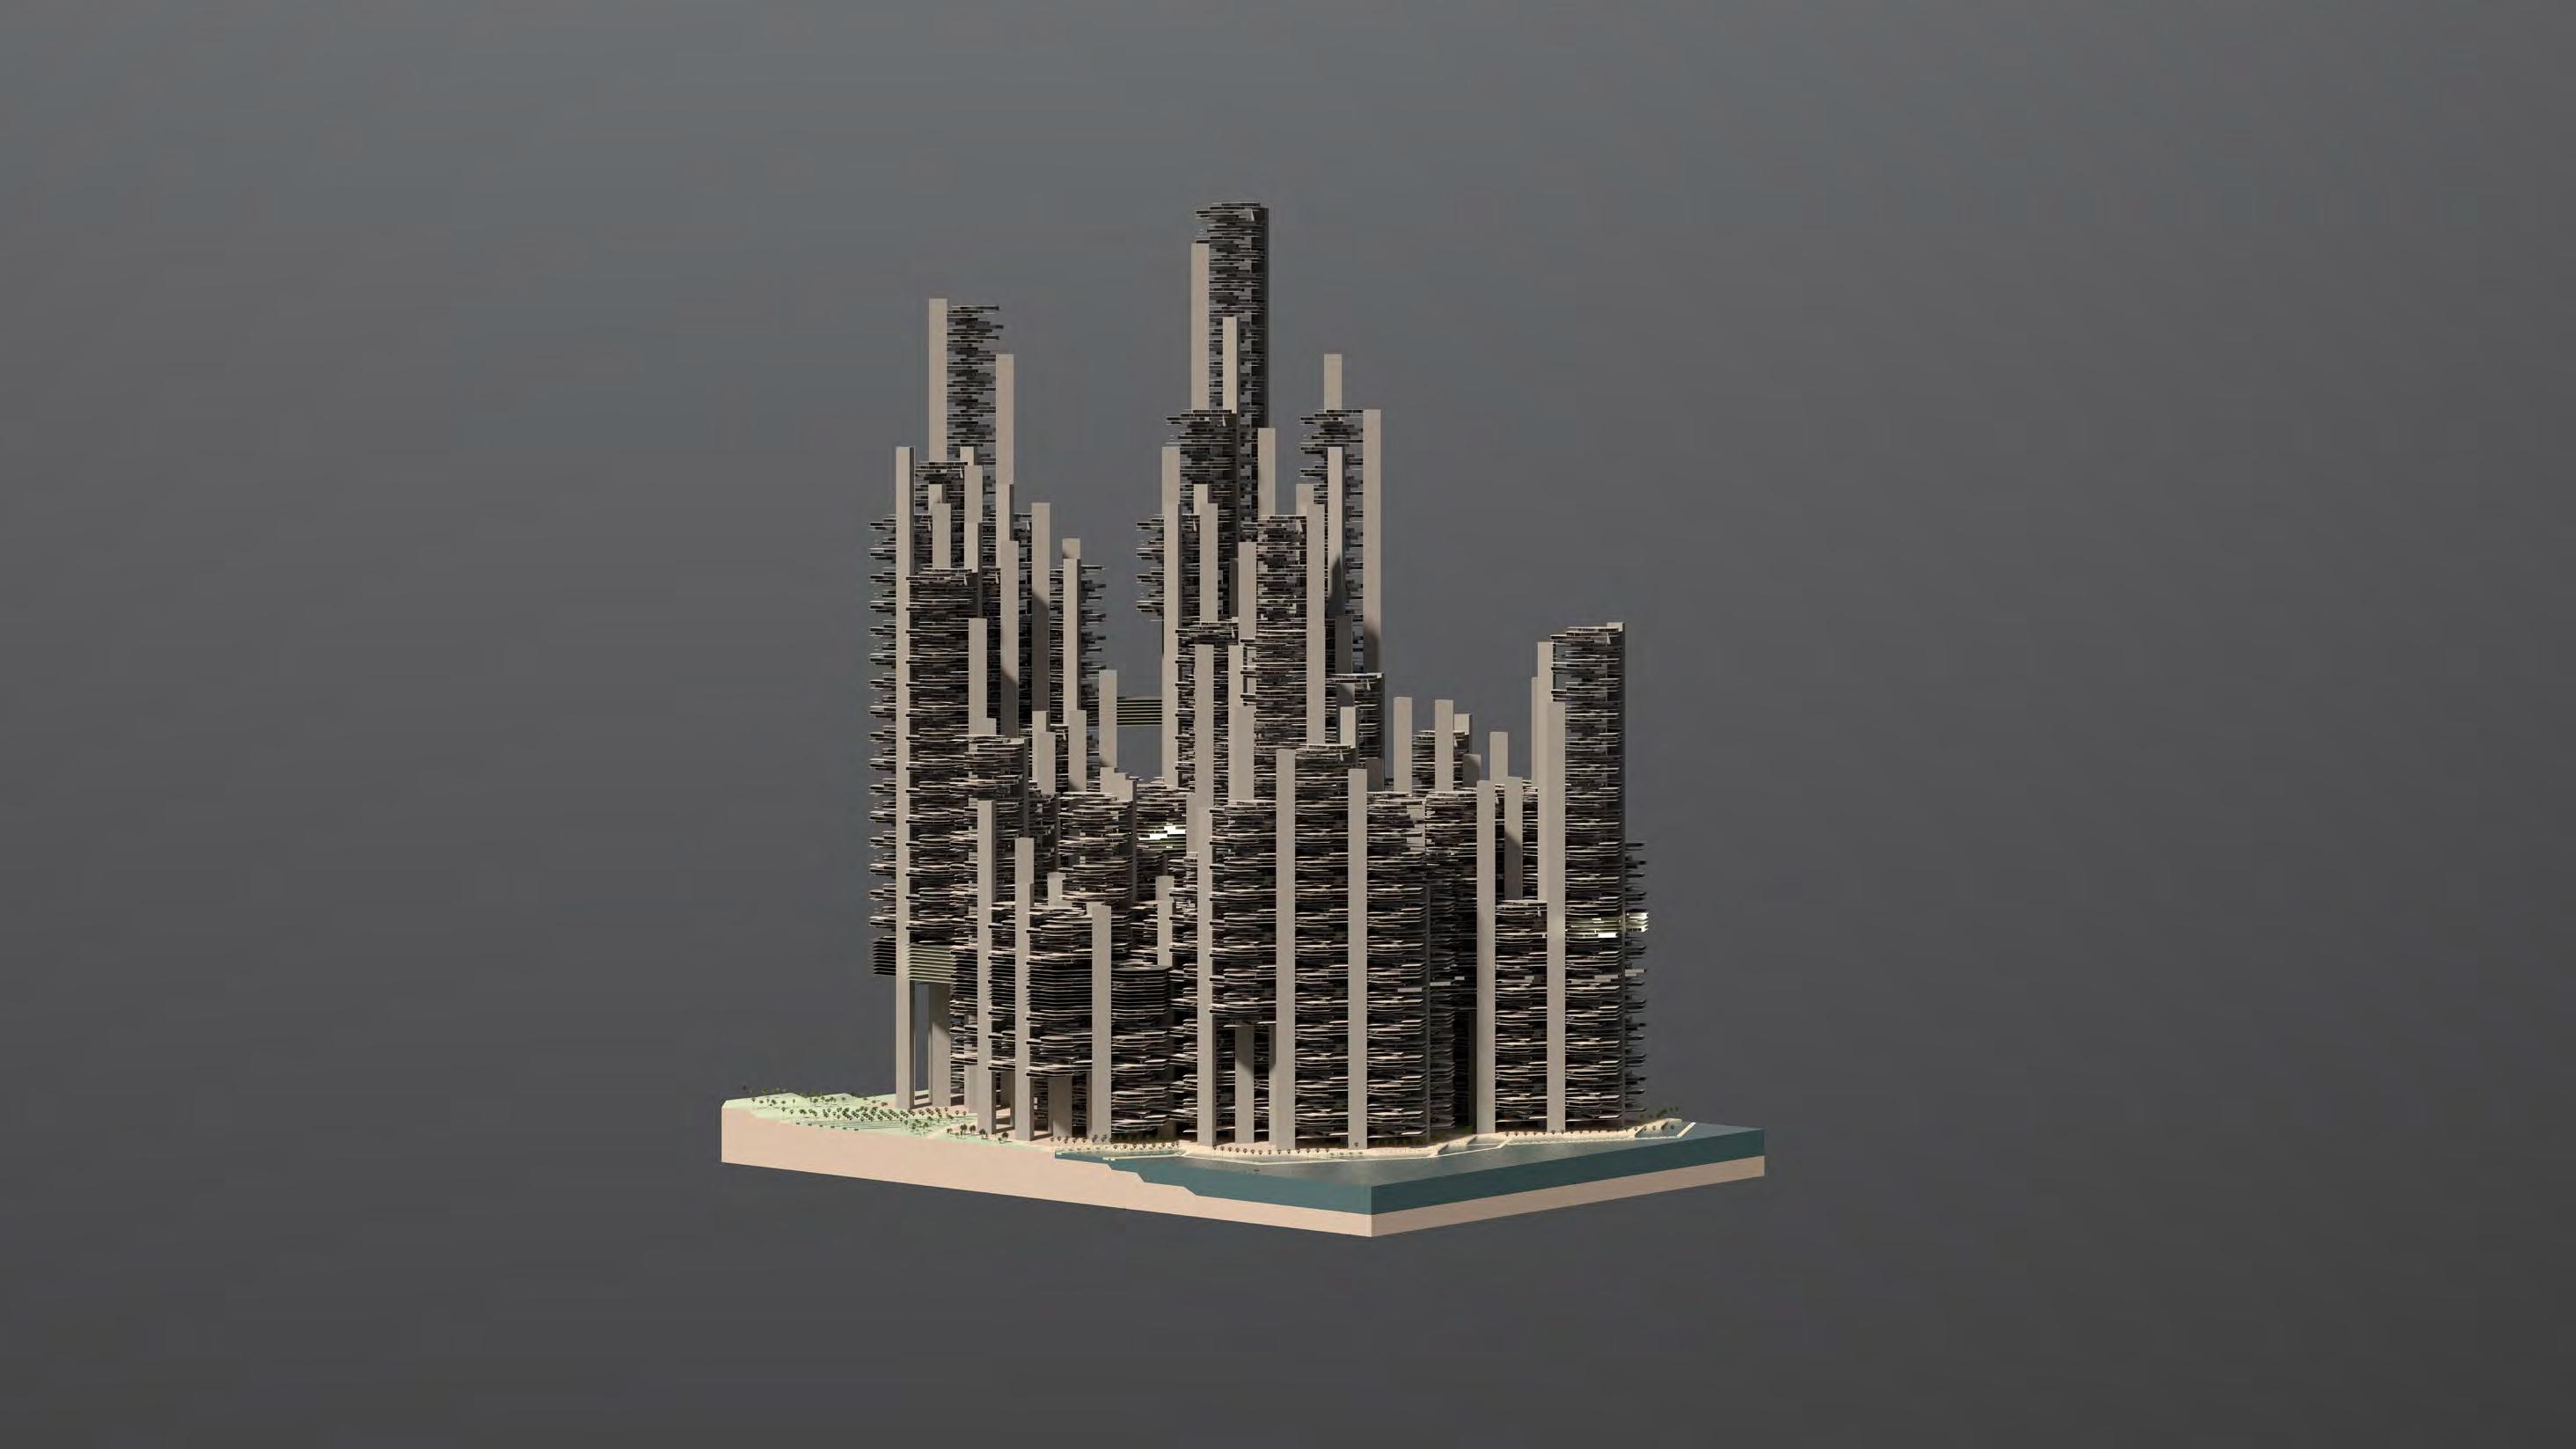
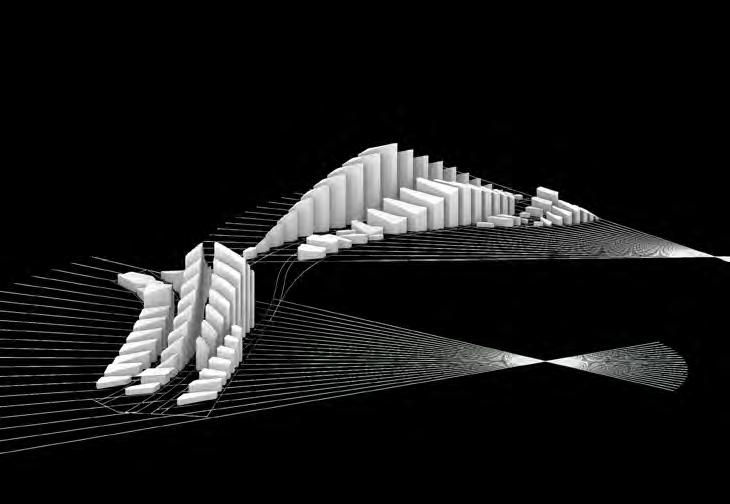
The project began with early research on towers and its relationship with urban density to provide an efficient means of affordable housing on the one hand and also prime real estate on the other. It was these polarised principles that drove the initial experiments of excess specifically as a result of rivalry within the built environment, arrived at by the medieval towers in Bologna, Italy.
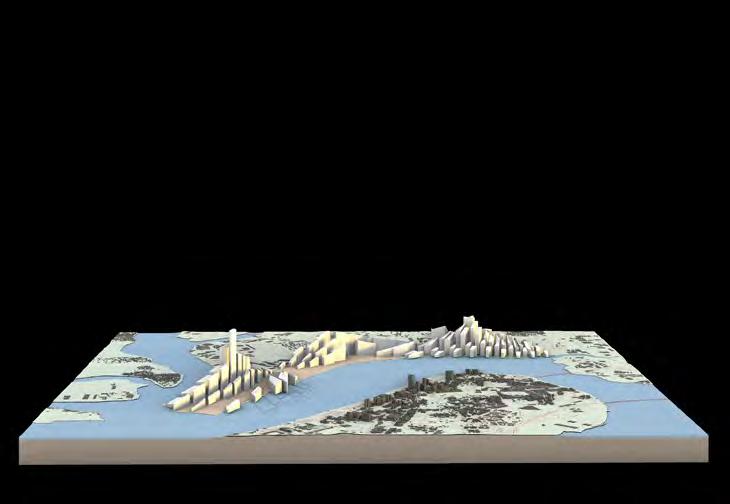
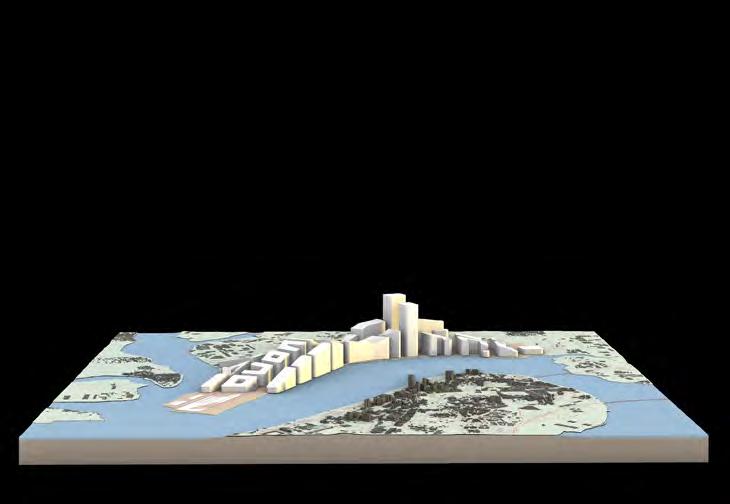
The project’s location was chosen to be in Lagos, Nigeria because of its affordable housing deficit, inadequate living standards for many, high levels of unemployment, and urban inequalities.
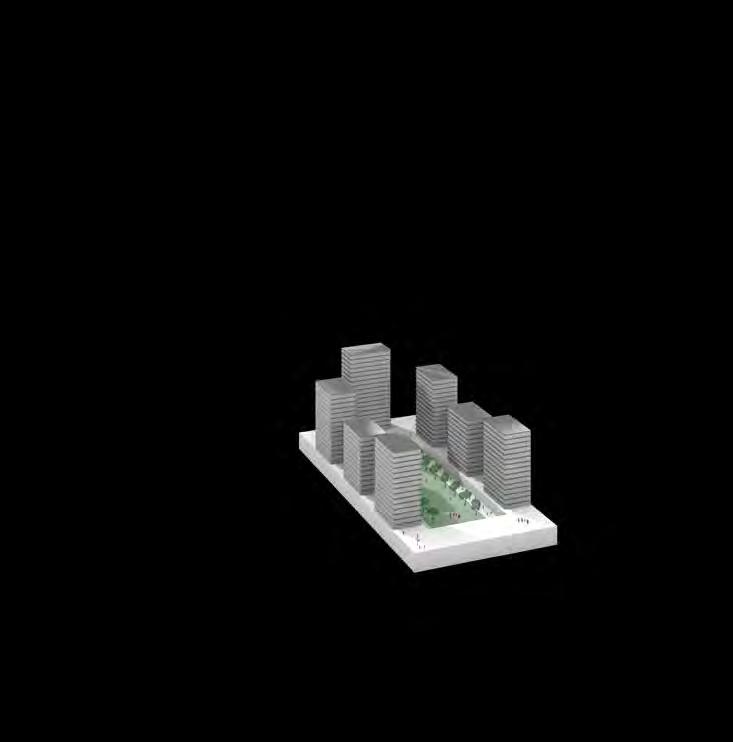
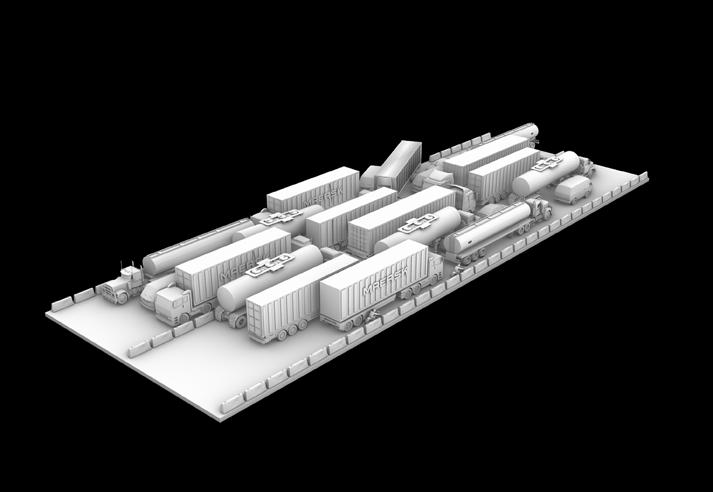
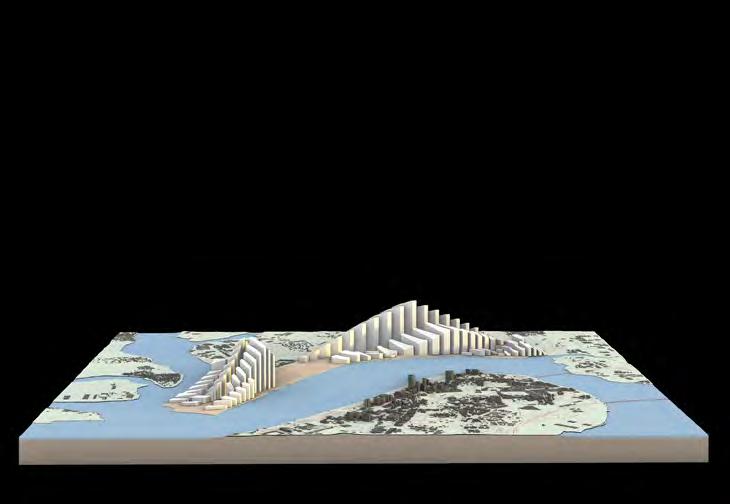
The final scheme provides an argument in support of societal needs over port operations and places the maritime industry at Apapa port in a less congested location on the outskirts of Lagos. With port business relocated to one of the new ports being constructed, port operations at Apapa can be relocated rather than terminated and remain a vital part of Lagos’ economy. The location of Apapa port in the centre is hindering both the city and the port’s ability to function. By relocating the port it will allow for an alternative use of the vacated site. This project therefore presents a detailed proposal which aims to address the high levels of substandard living and unemployment in Lagos. The scheme challenges the city’s dominant typology of new high-end development that are only affordable to wealthier residents. Consequently most low income earners in Lagos reside in informal settlements which provide the only affordable space to remain in the city. The scheme therefore exemplifies how a mutually beneficial mixed housing development could provide lowincome residents with affordable housing and business space aimed at providing services to high end residents. The research highlighted certain livelihoods that are a lifeline for impoverished communities in Lagos. The role of the new proposal was therefore tasked to facilitate these professions. The resultant design prioritises the occupation of fishing into the commercial spaces as it is not only a source of income for the low-income earners but it is also part of their cultural identity.
3 0 Contents
Early Research
Section 1: Early Research
Section 2: Urban Density
Section 3: Context and Brief
Section 4: Design Development
Section 5: Design Proposal
Section 6: Appendix
4 1 Early Research
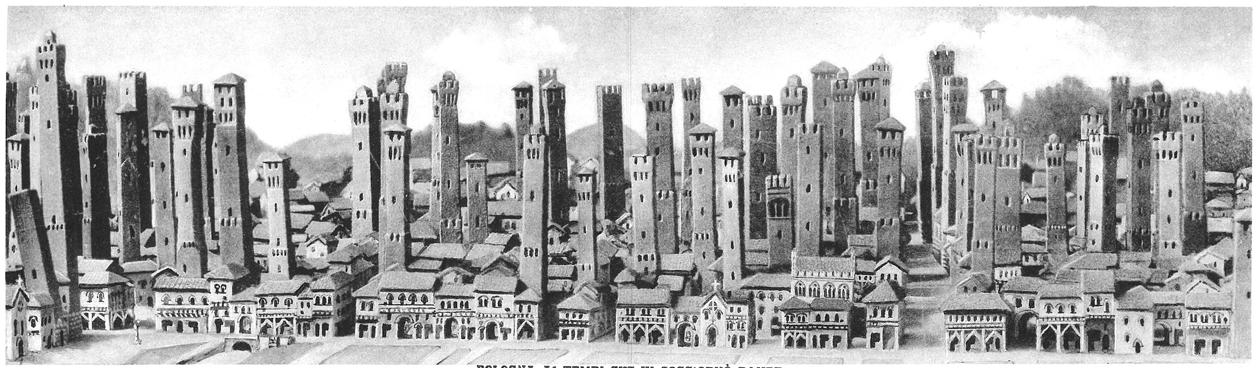
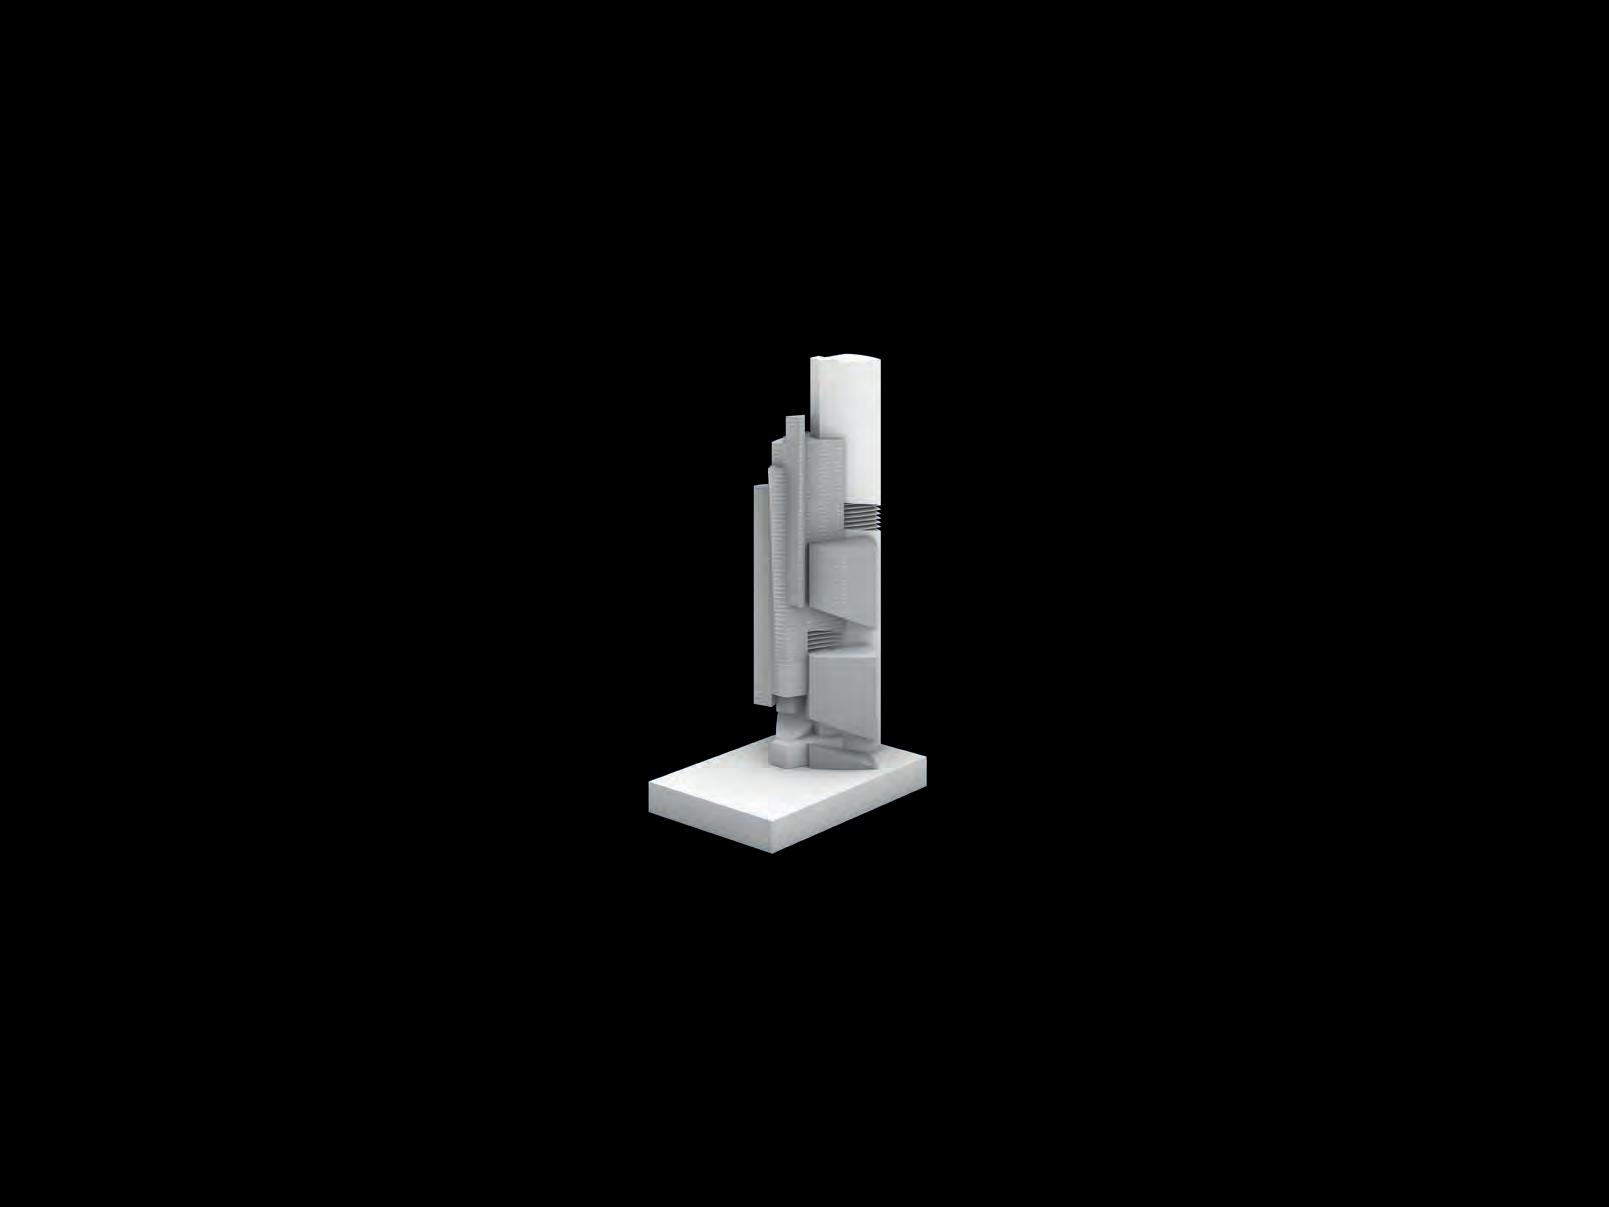
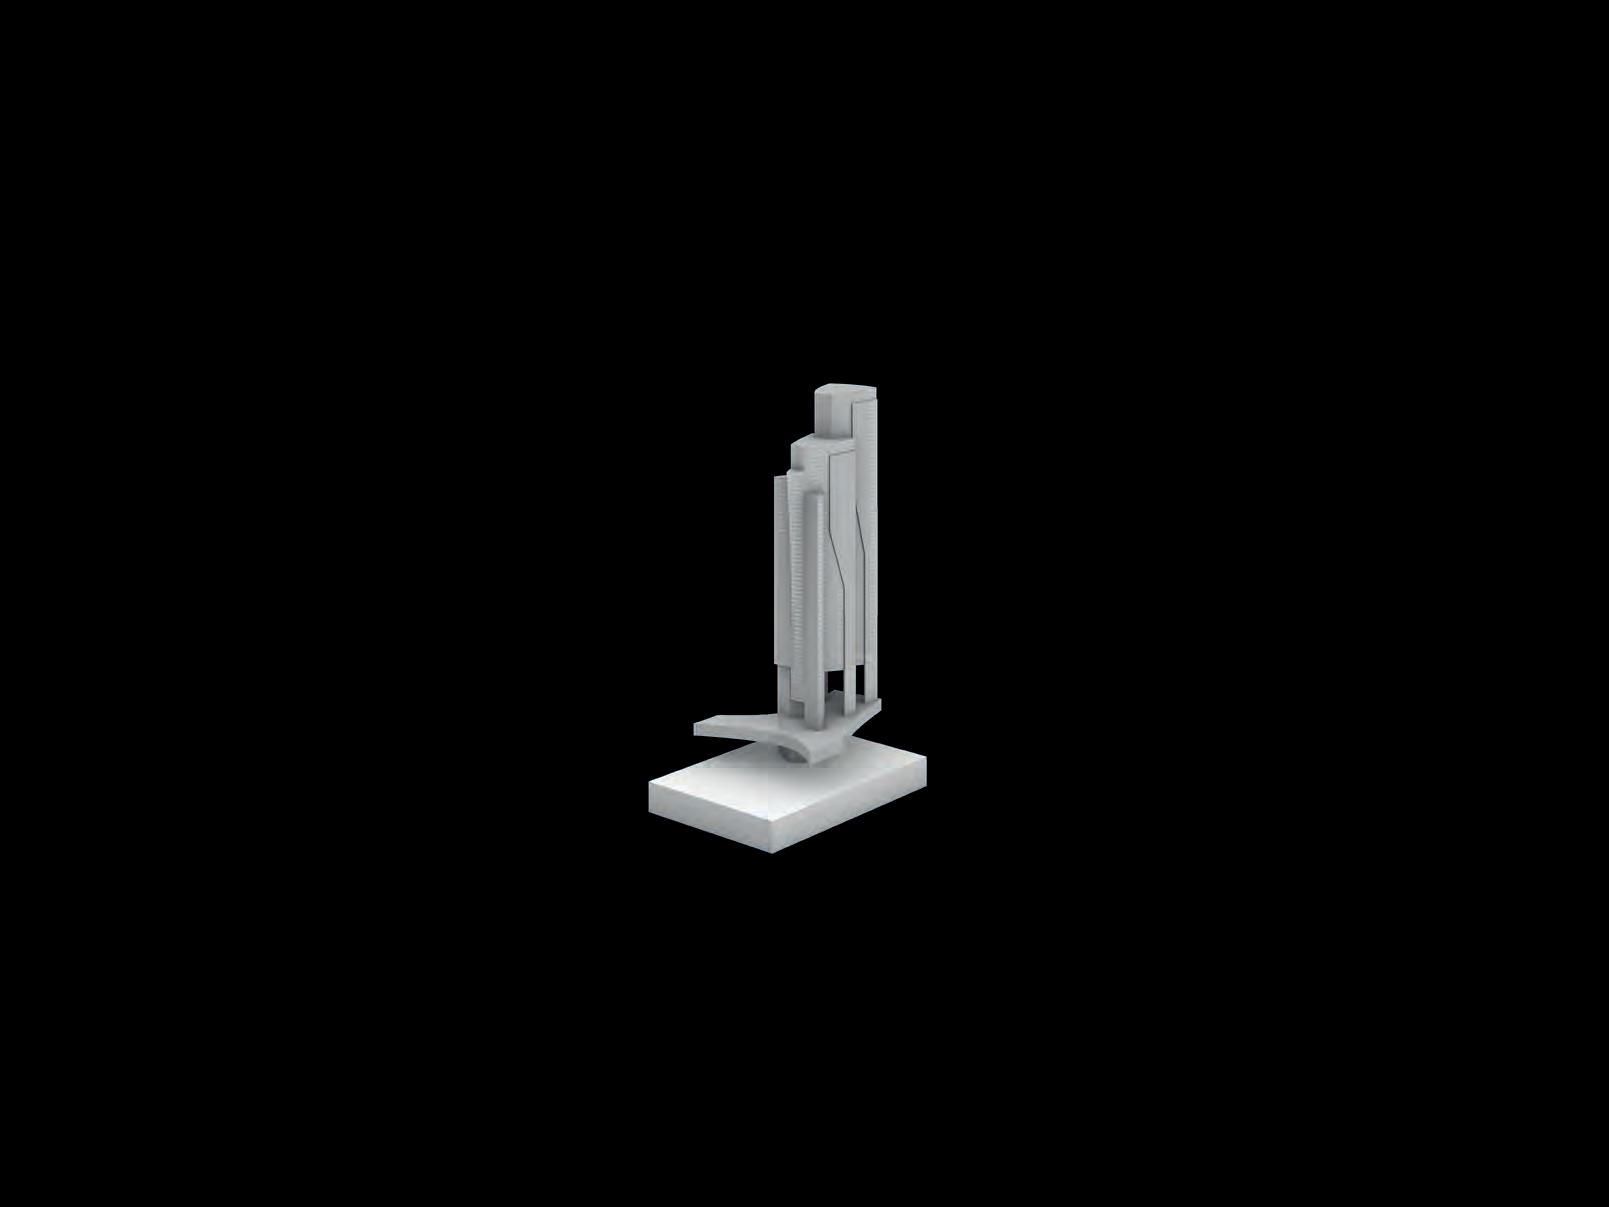
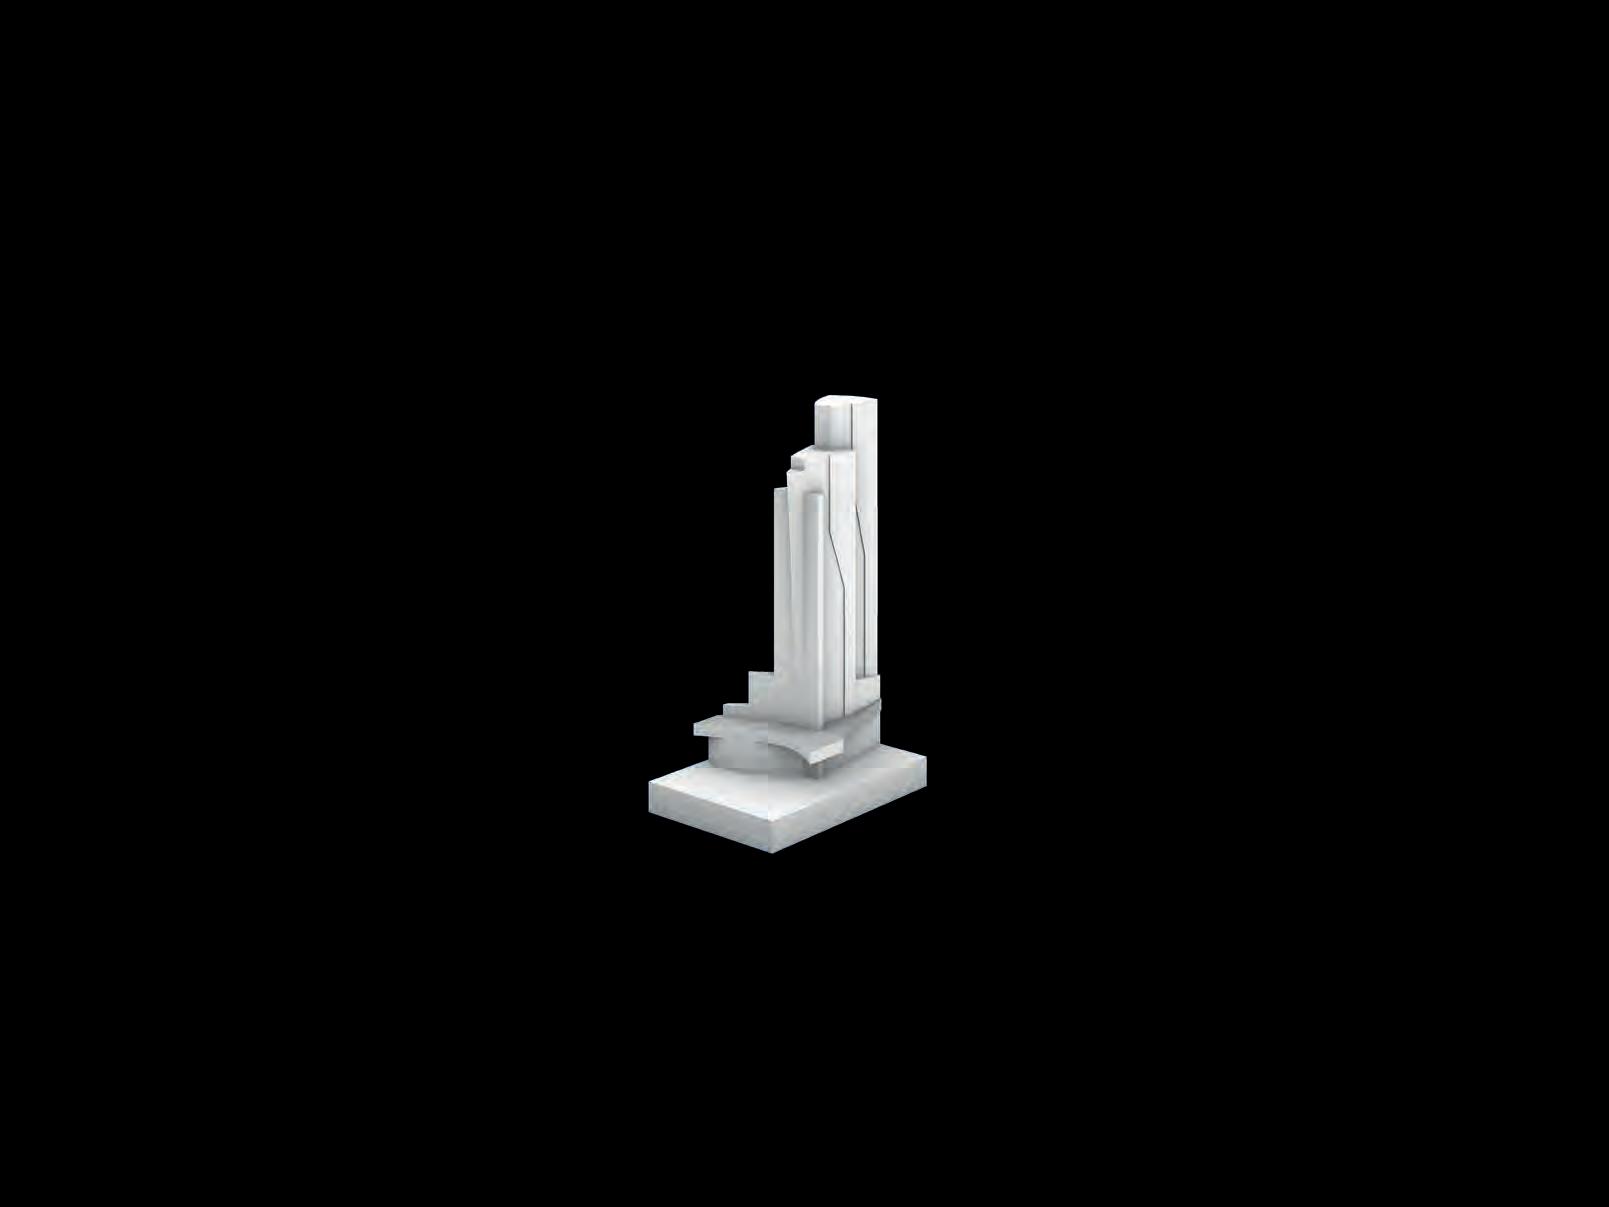
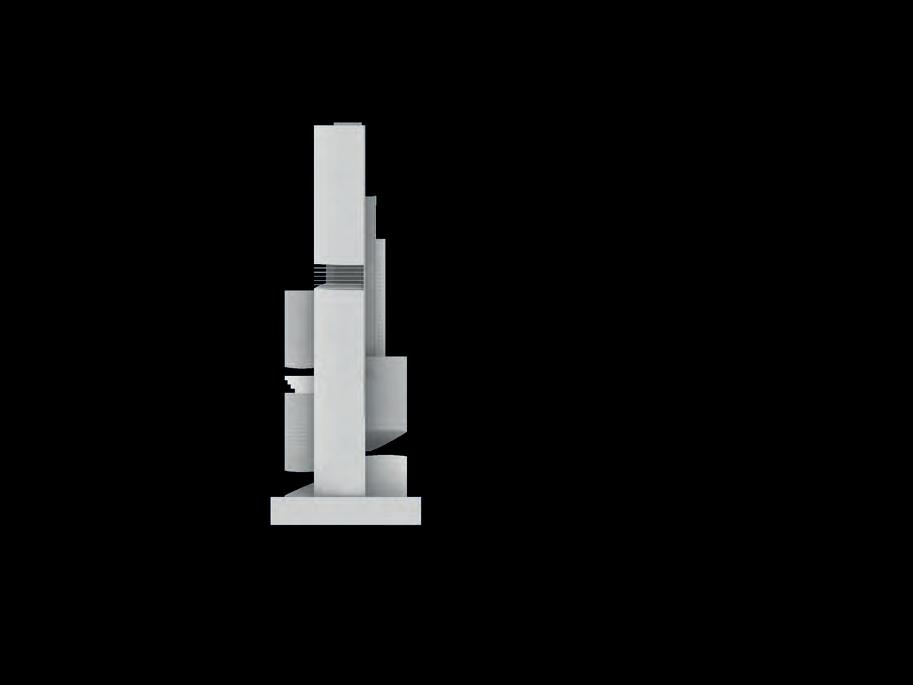
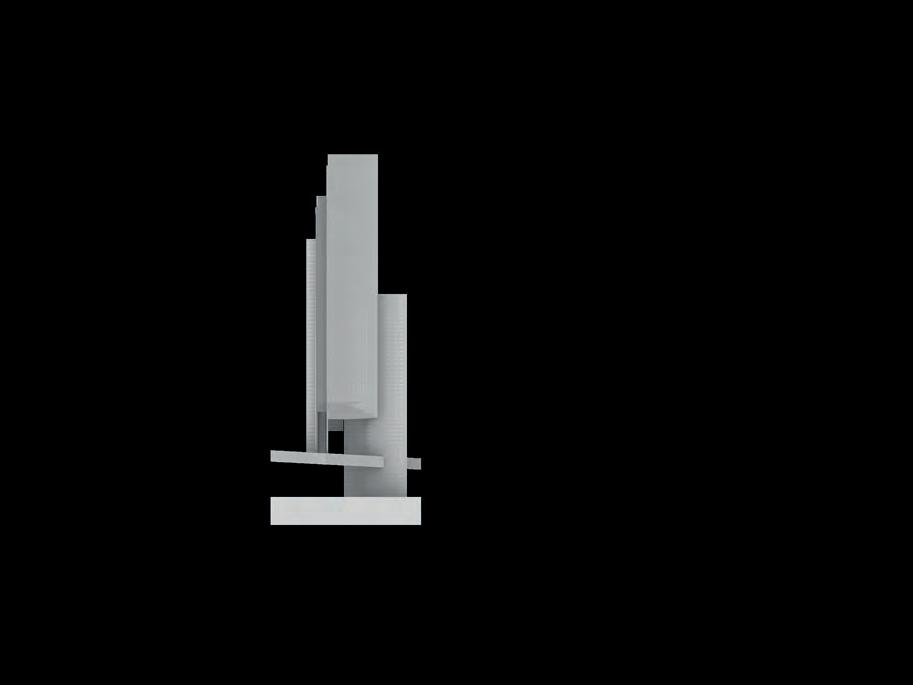
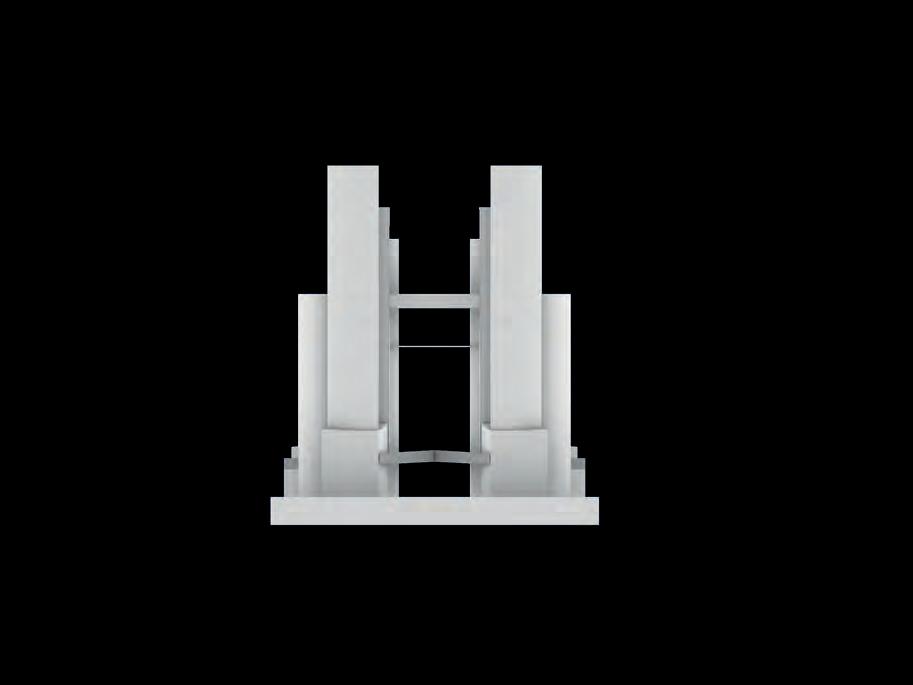
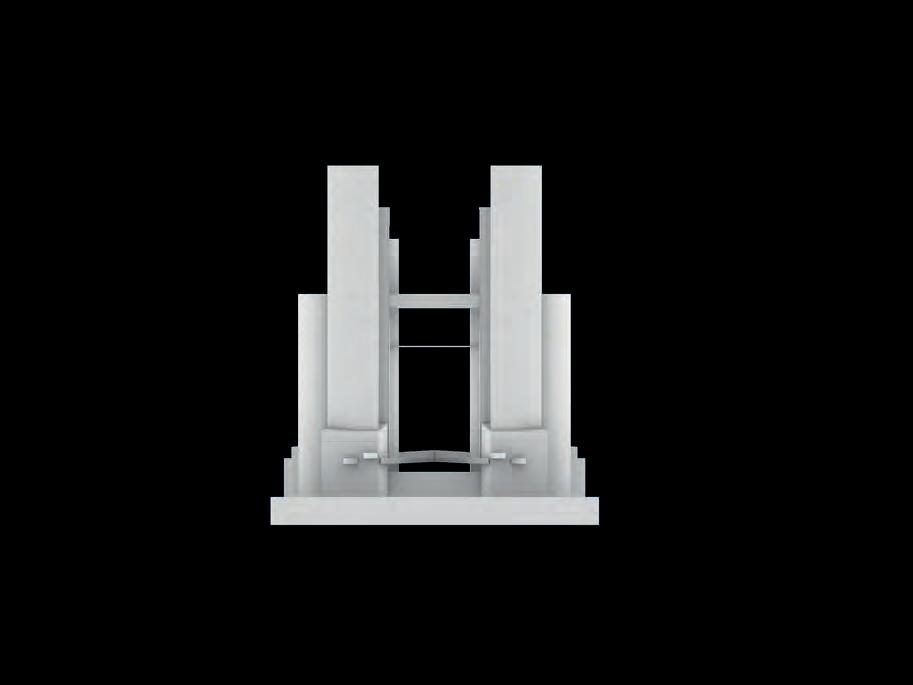
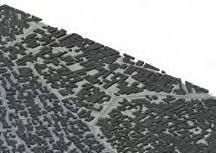
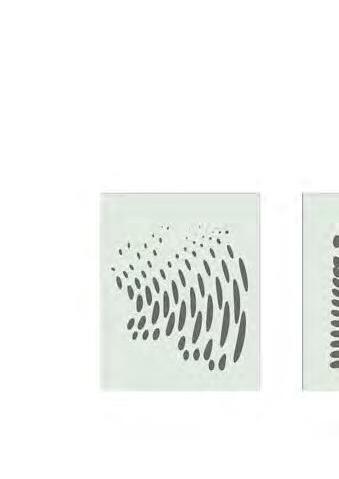
5 1 Early Research Bologna Towers Type; One-Upmanship Competing for height 1.1
Axonometric of Bologna Towers type
Postcard of the medieval towers of Bologna as symbols of power and prestige.
Elevation A of Bologna Towers type
Elevation B of Bologna Towers type
Taxonomy of One-upmanship
Generic typologies: One-upmanship in architecture
One-upmanship in the Built Environment
One-upmanship
Exclusive Access; Arrival
Cascading + Podium function (Amenities: Shopping)
Desirable views (positioned around / focal point): Park
Elevated (Ground plane exposure)

Desirable views (positioned around / focal point): canal, harbour, river, sea, lake
Court (Courtyard)
Edifice; Superiority
Exclusivity; Closed community
Imposing; Intimidate
Serviced
Crescent
Grand Approach

6 1
Exclusive Access; Arrival
1.2
Urban Spatial Structures Iterations 1.3

Monocentric
The monocentric city type contains its business activity at the centre of the city’s core.
Contained within this monocentric city are the towers which grow in height the more central they are, mimicking a central business district (CBD). As well as the towers, lower level blocks creating streets and squares are positioned towards the city centre.
Polycentric


The polycentric structure positions its economic activities around multiple economic zones so it is more evenly distributed.

7 1 Early Research Iterations; Urban Scale
Economic activity is positioned around the perimeter of the city.
Agglomeration
Edge City
Urban Density
Section 1: Early Research
Section 2: Urban Density
Section 3: Context and Brief
Section 4: Design Development
Section 5: Design Proposal
Section 6: Appendix
8 2 Urban Density
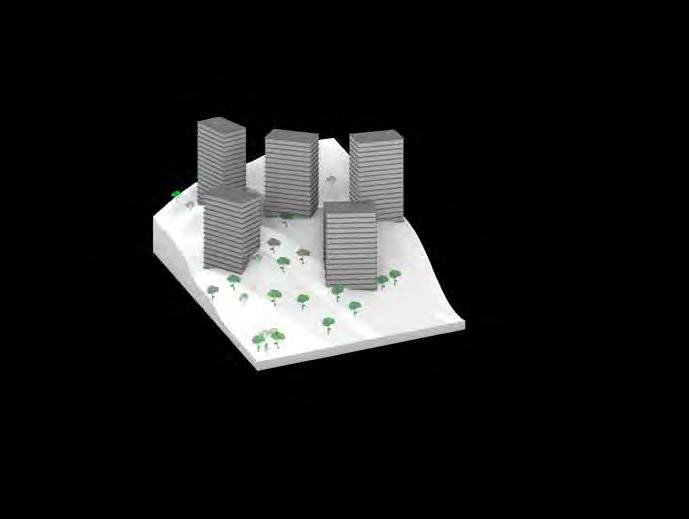
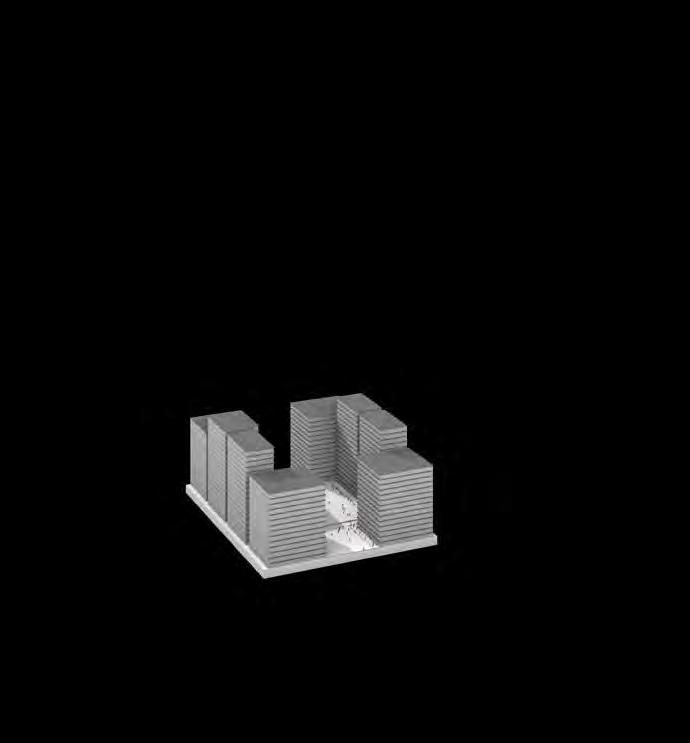
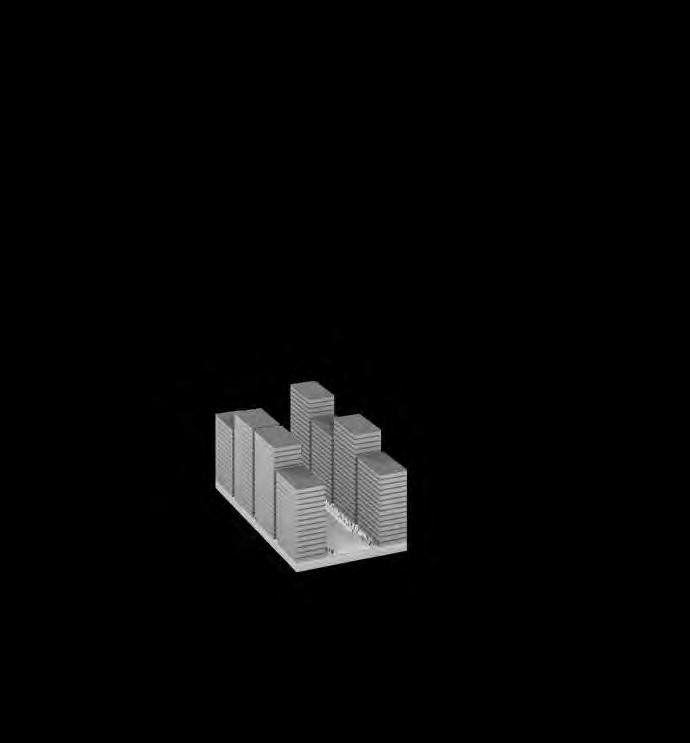
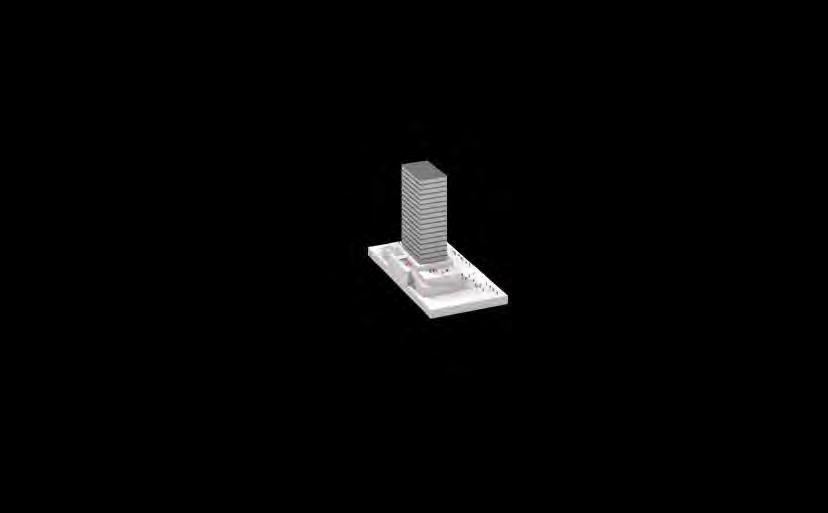
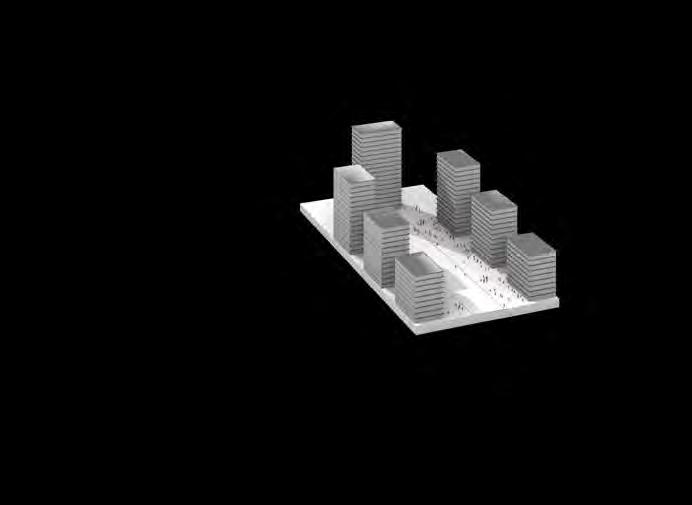
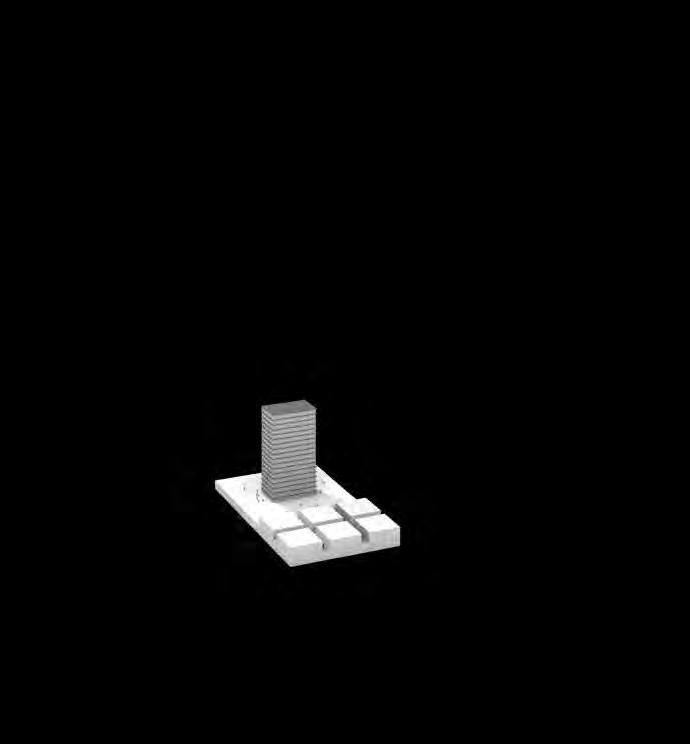
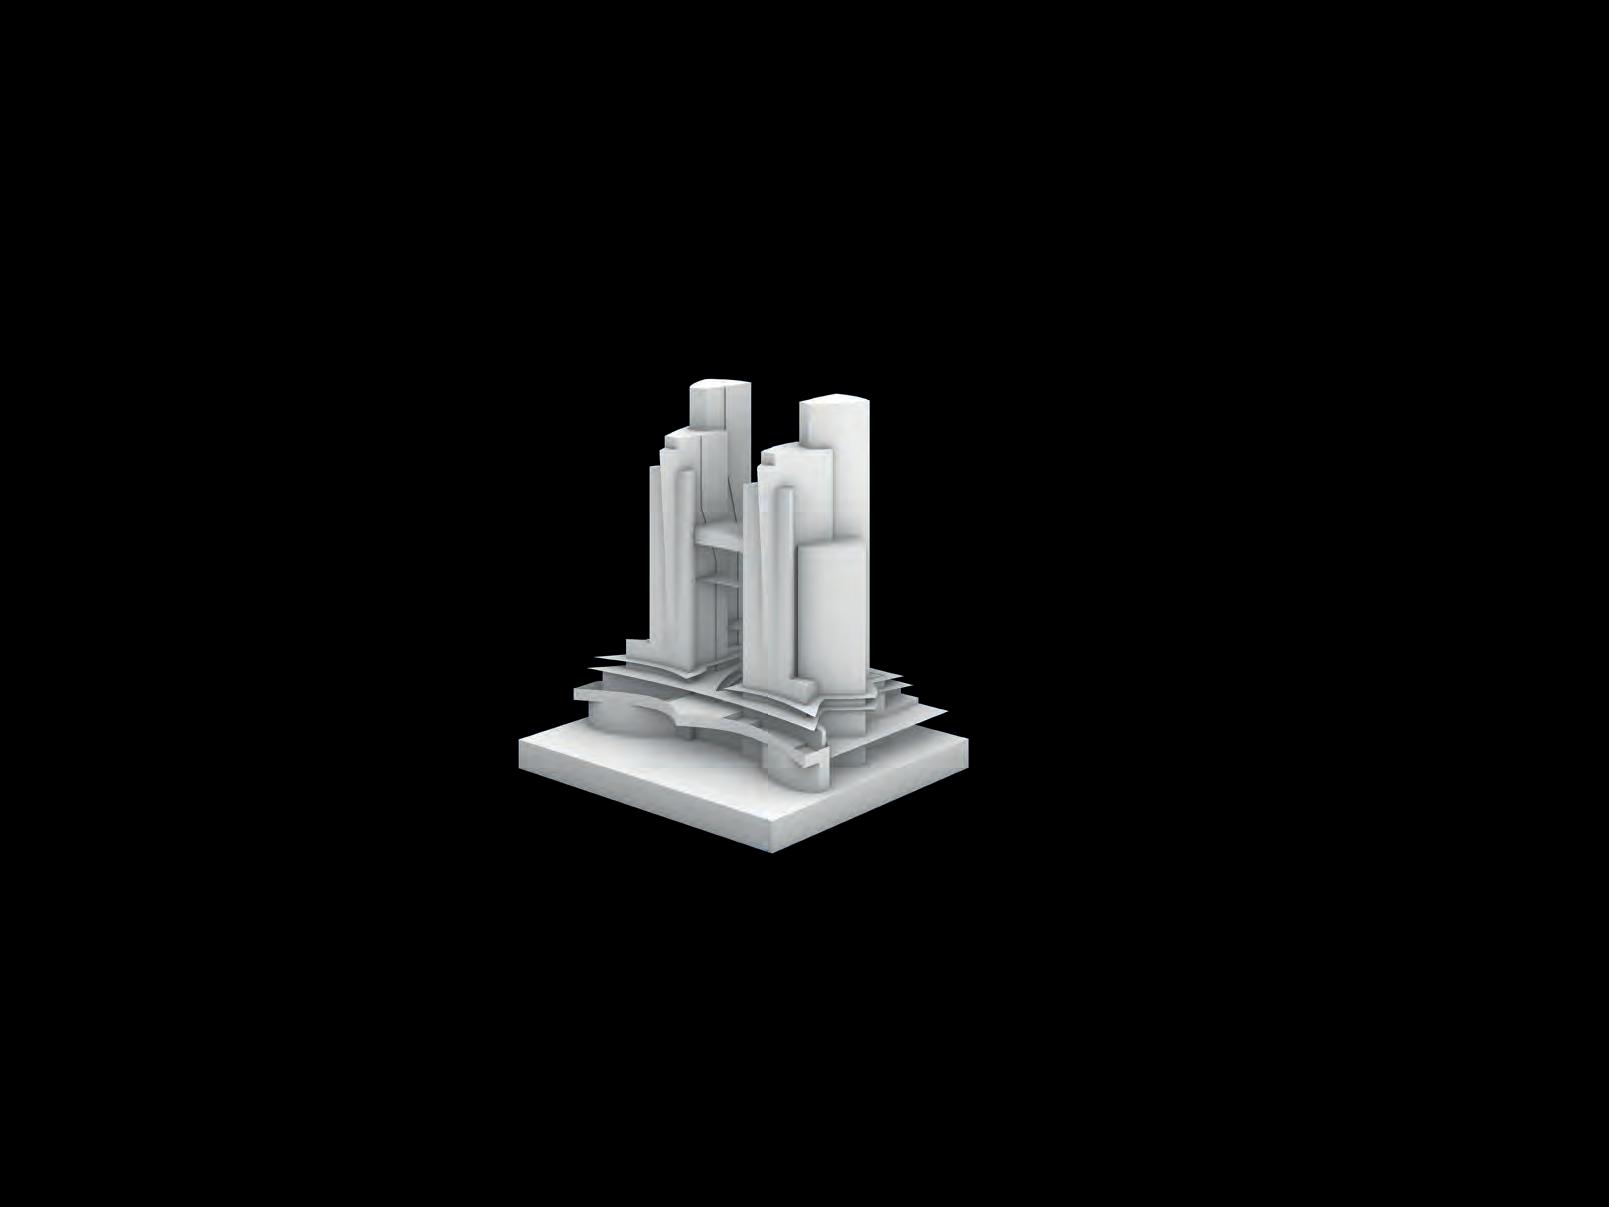
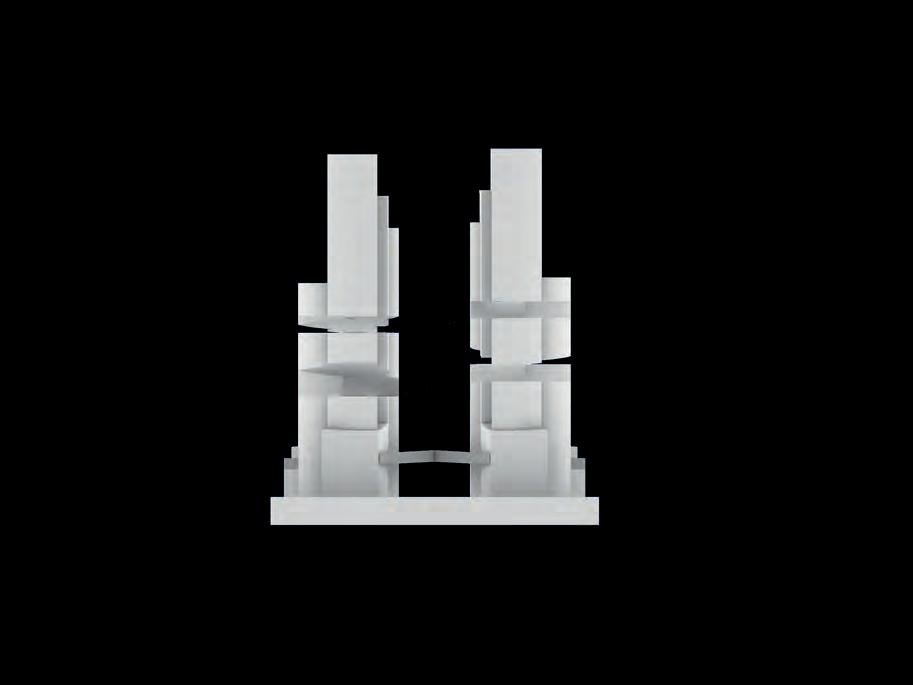
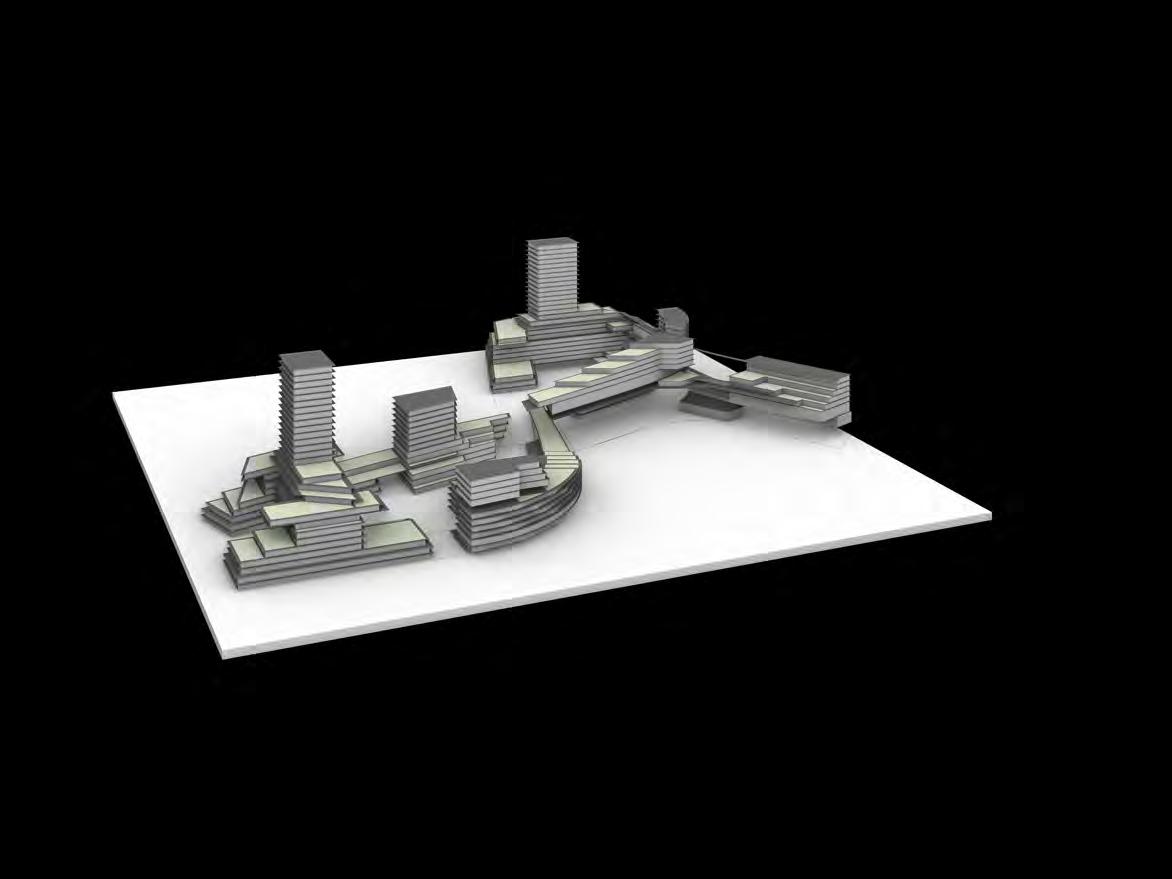
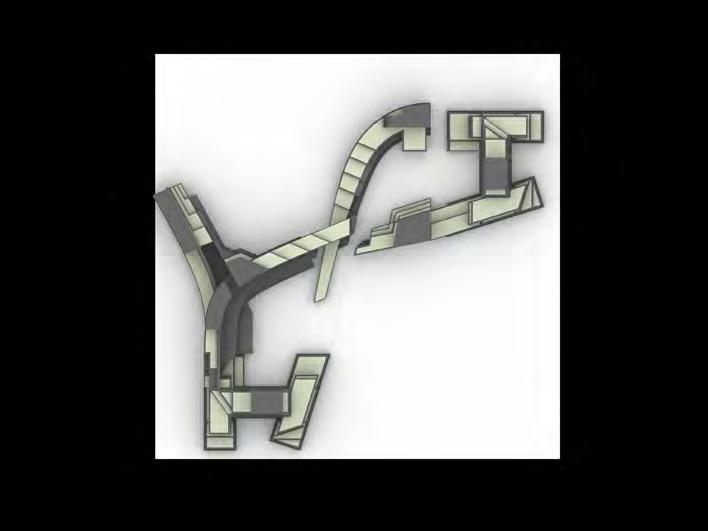
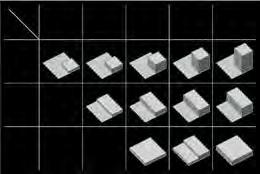
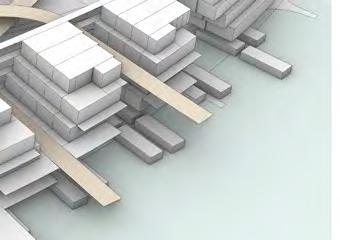
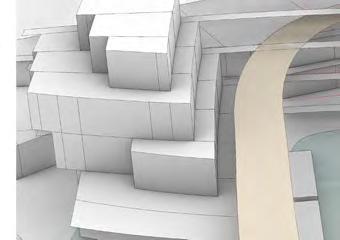
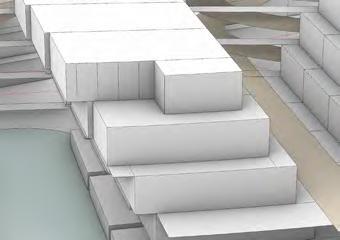
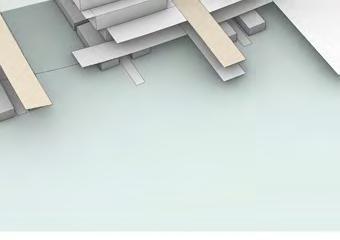
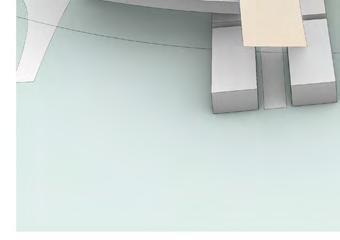
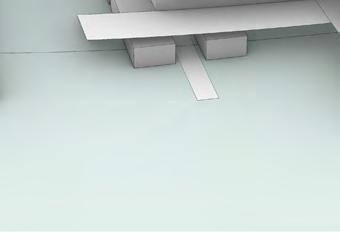
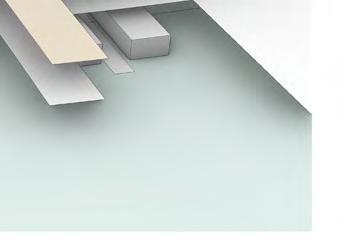
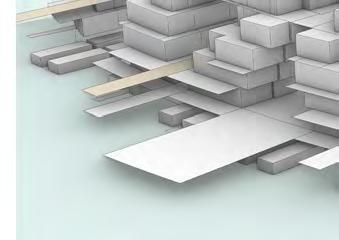
Form Development Tower Massing Study - 2.1
Form Development; Tower Massing Study


9
V01
V02
V03
V04
Ascending podium onto large open balcony or boulavard, open ground plane
Void introduced at the podium and tower junction to create a functional space.
The facade is angled to allow light onto the roof of the podium
Open voids within the tower's envelope to create upper level residential communal spaces
Ground level ascending facade receding into tower
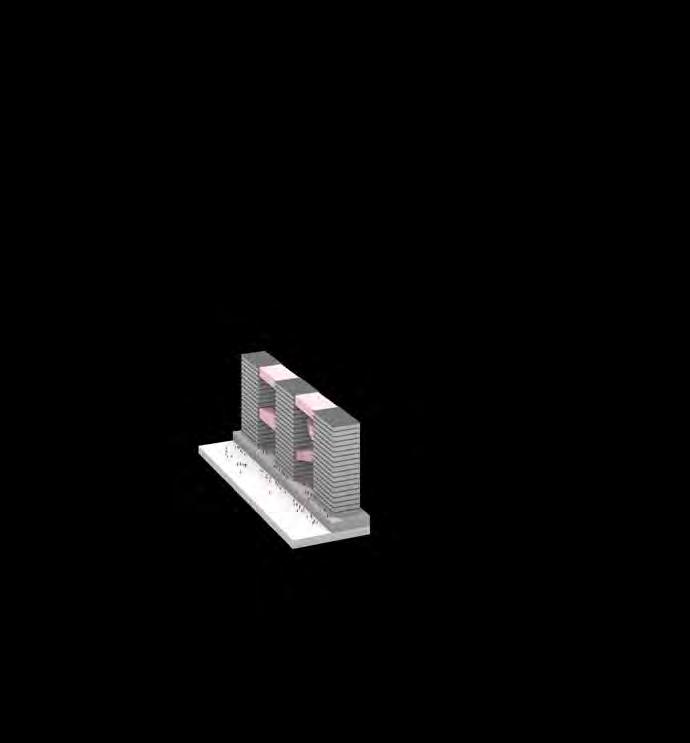
Introducing business spaces into the upper floors of the tower with box inserts
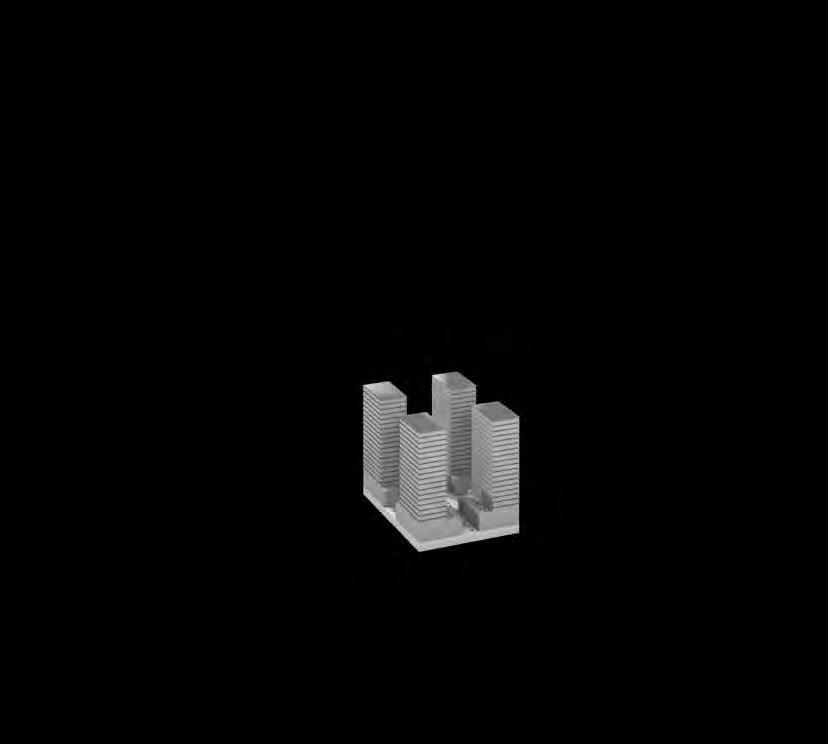
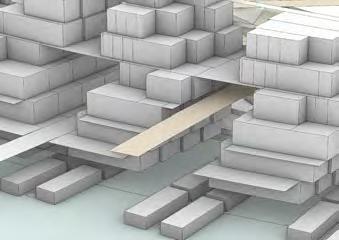
Form Development Tower Massing Study - 2.2
Form Development; Tower Massing Study


2 10
V05
V06
V07
V08
Underground vehicular route and parking with integrated access to the above complex
Linking 2 towers: skybridge introduced at 4 intervals
Linking 2 towers; sky bridge links at 3 intervals.
Receding balconies over the podium links the two towers at ground level
Linking 4 towers into a quad creates a 4 way junction.
Voids in the envelope alow circulation up the tower but also facilitate natural light, ventilation and cooling.
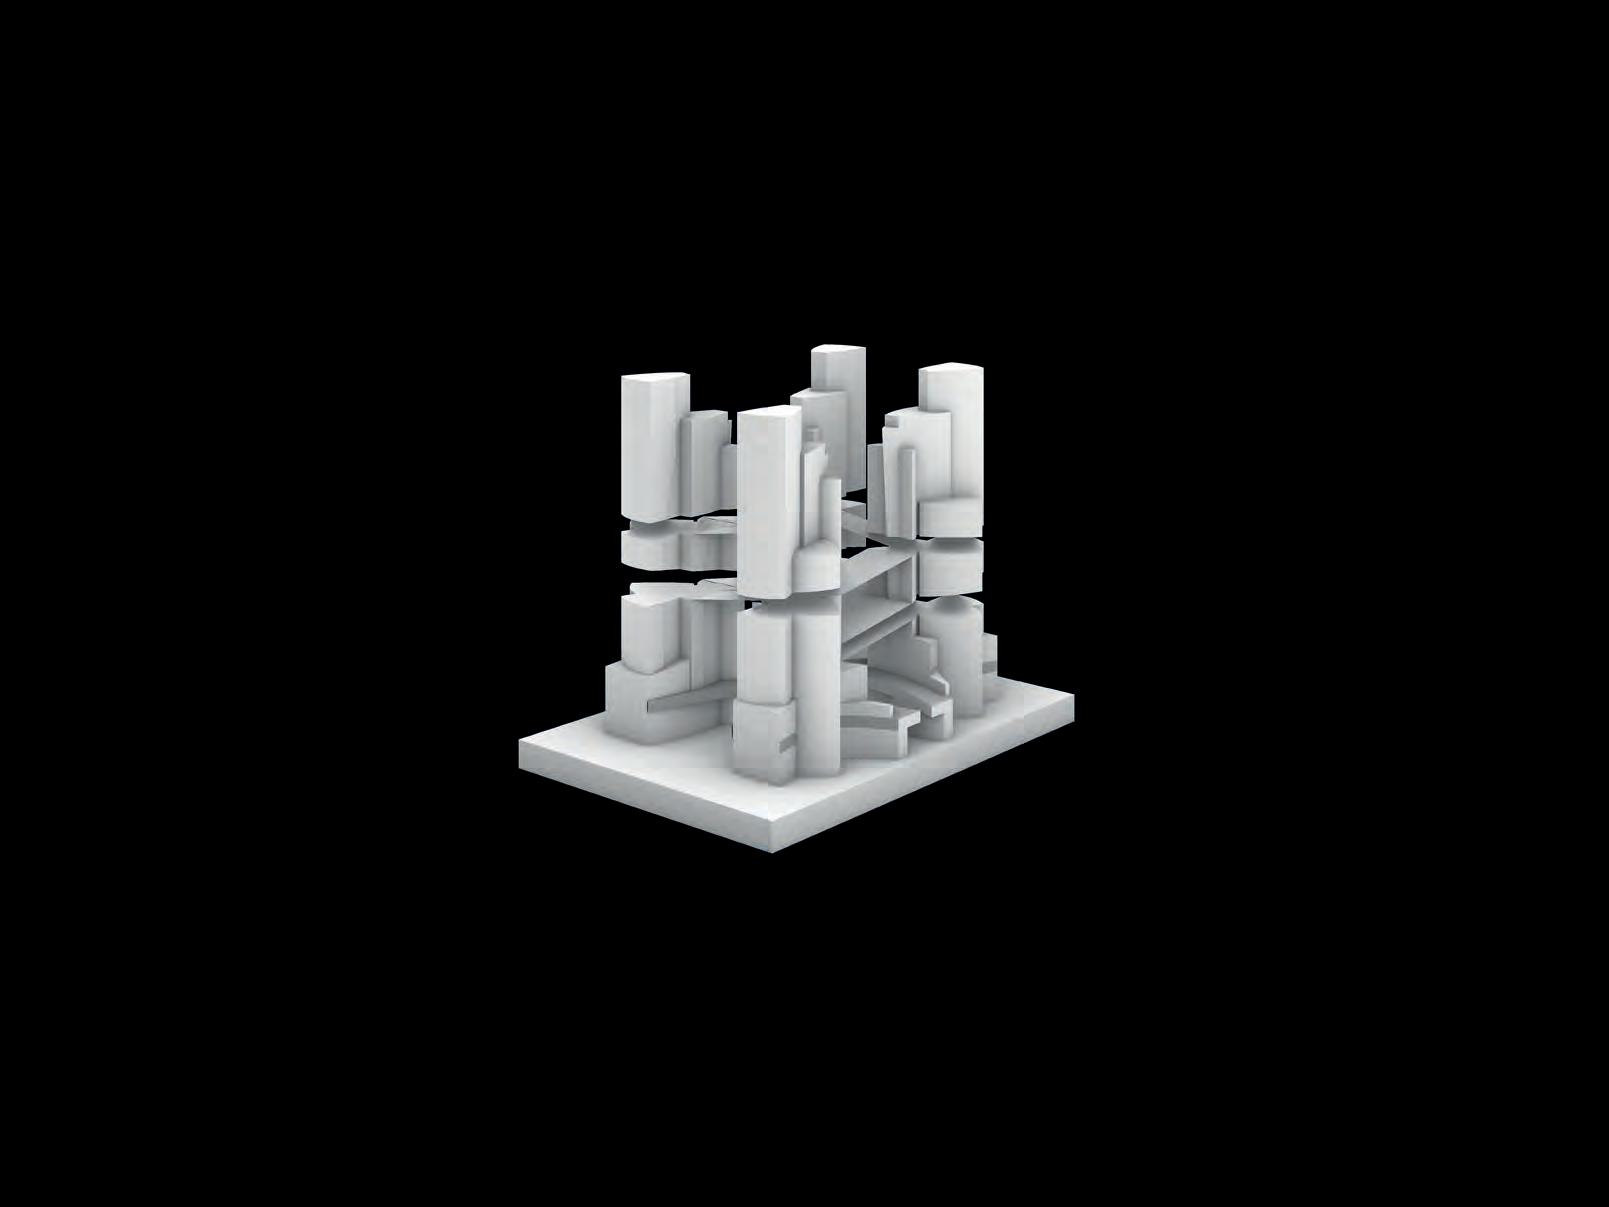
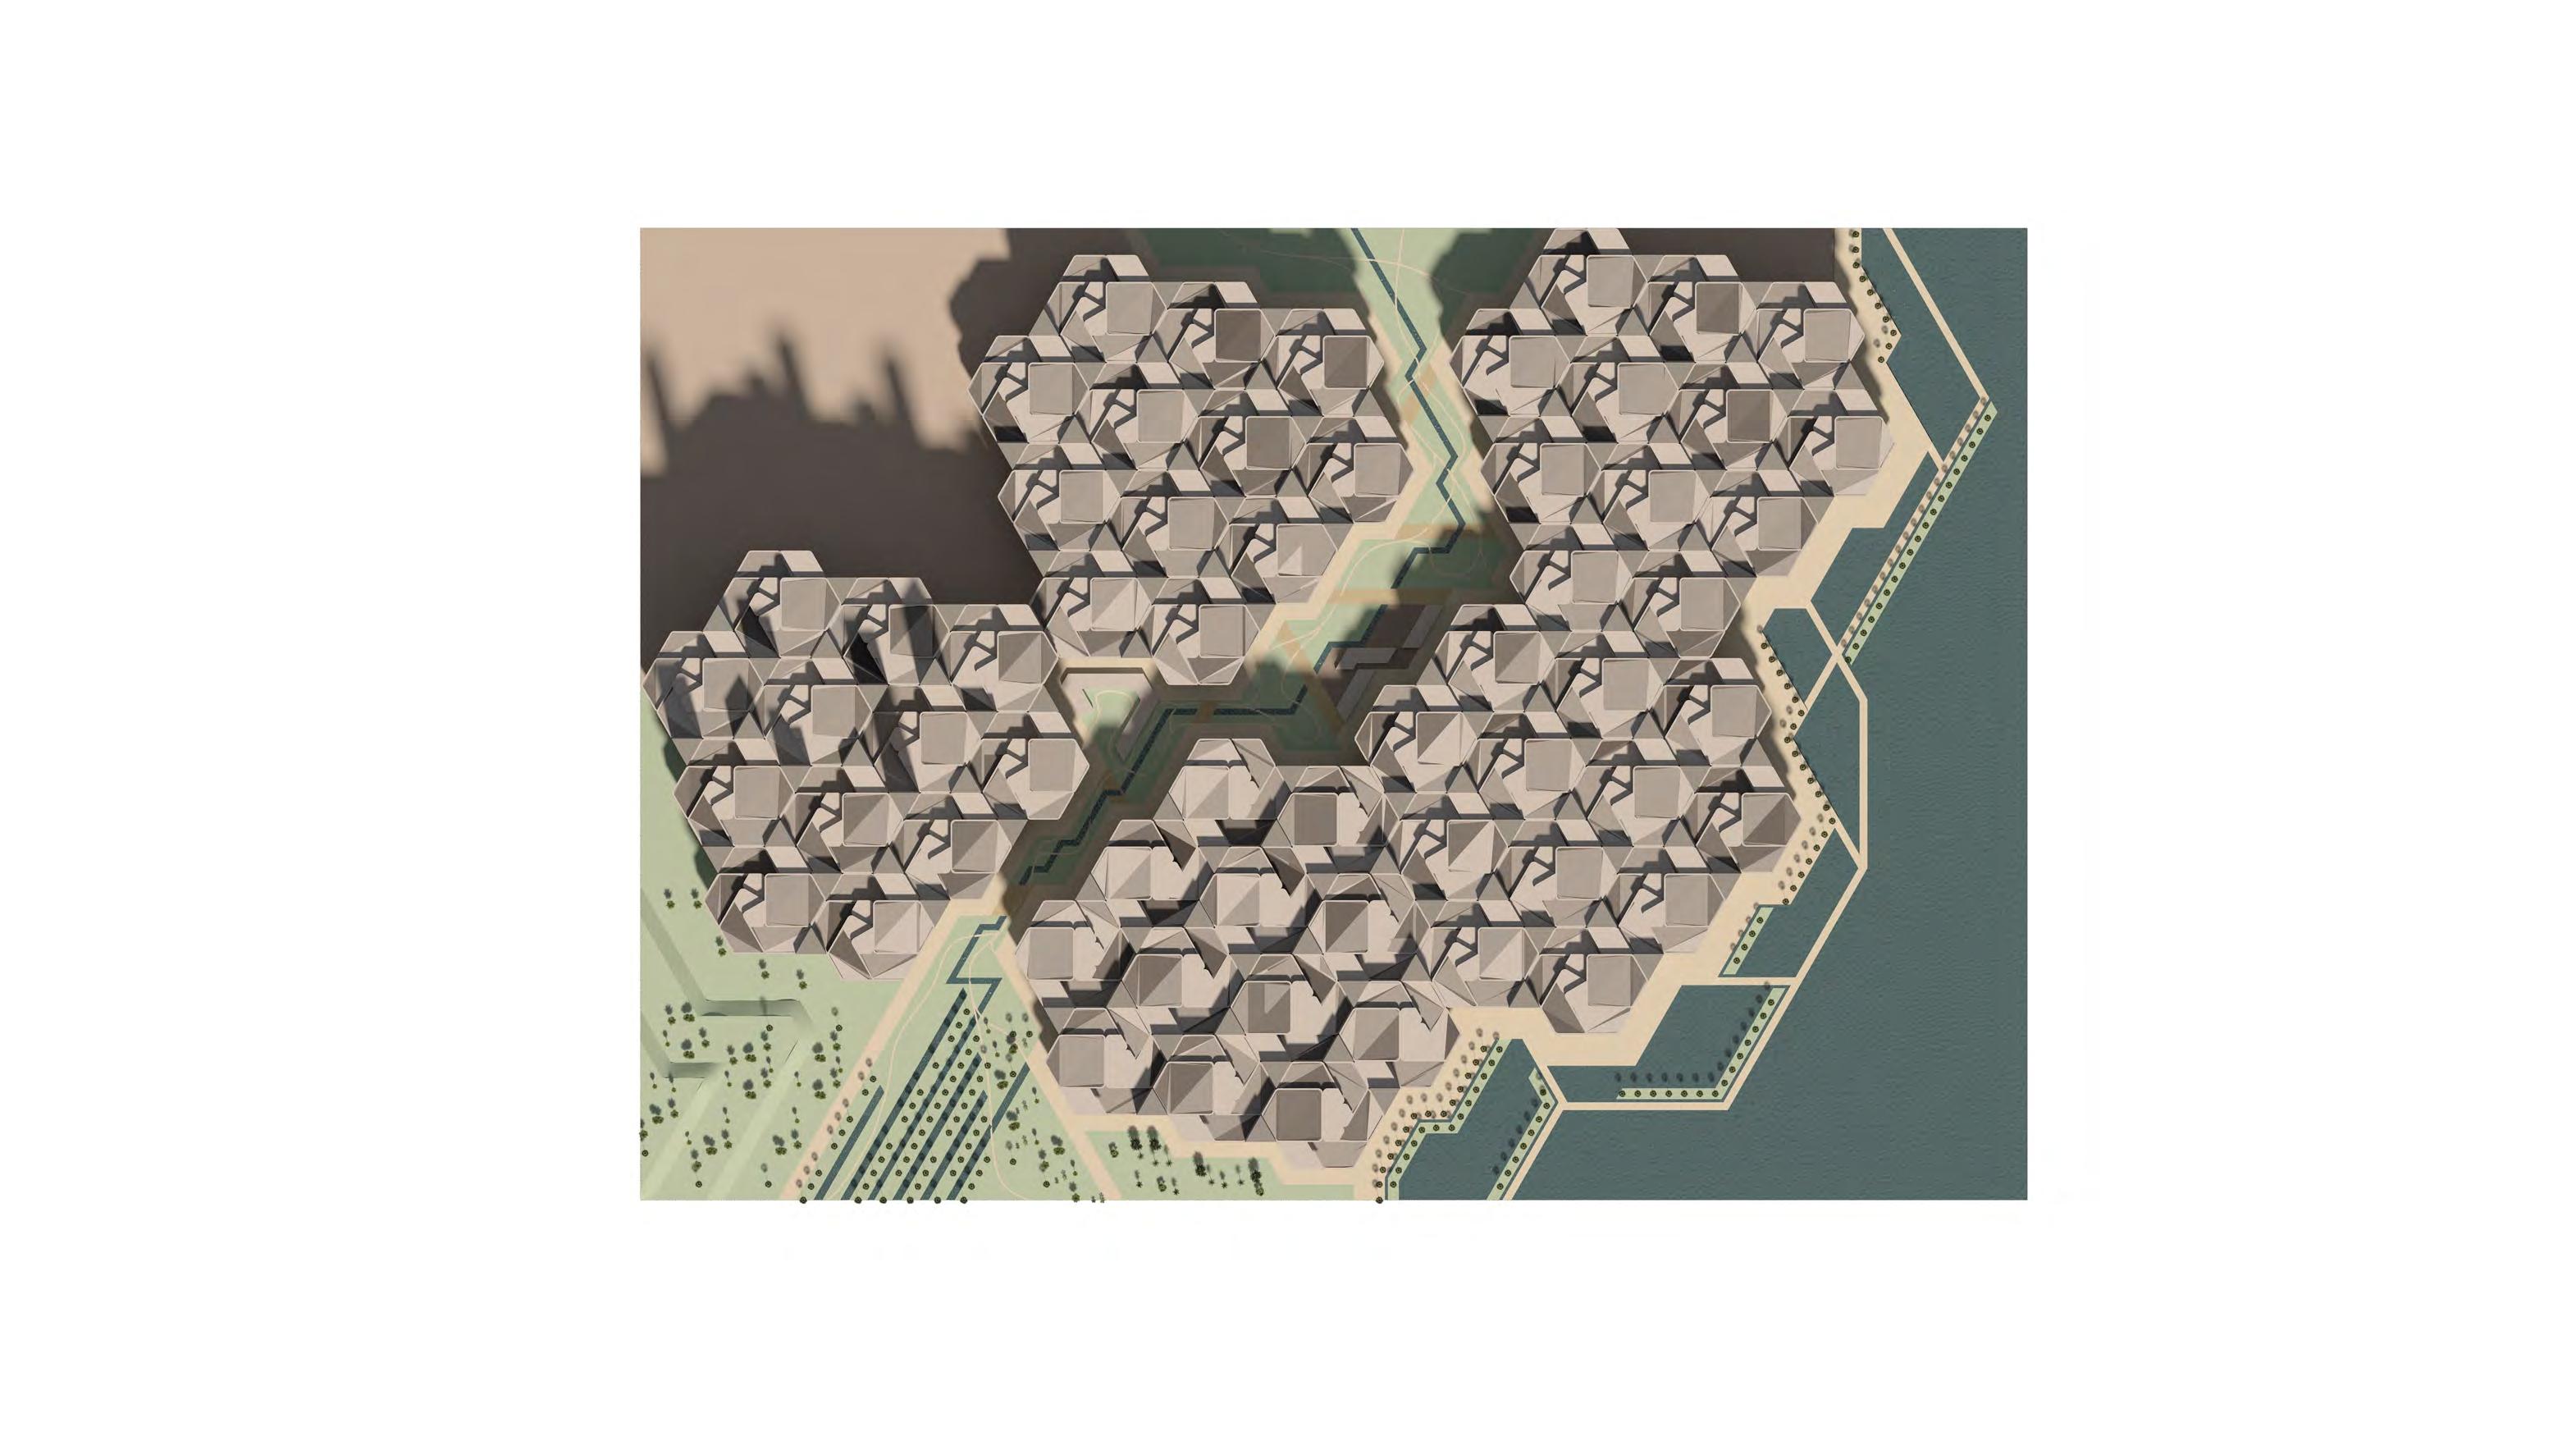
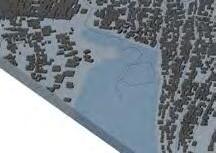
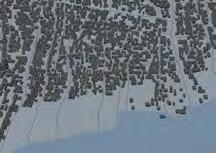
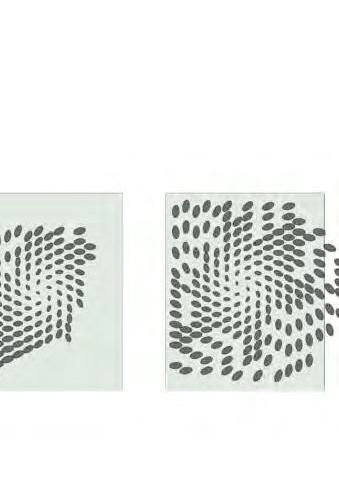
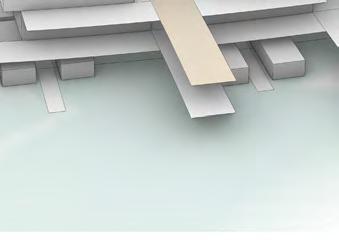
11 2 Urban Density Iterations of Hexagonal Grid type Ascending continuous terrace Multiple access routes funnelling to a recreational space Tapering void providing terrace space Multi-level terraces Green roof Stepped terraces surrounding arena or recreationalspace Cascading towers around a low level looping mall Permeable facade Elevated circulation linking Multi-level terraces Arena or recreational space Podium connecting towers Underpass Canopy roof following gradient of mall roof Iterations of Hexgonal Grid - 2.3


2 Urban Density Iterations of Hexagonal Grid type; Key Cutaway diagram Plan Underground vehicular traffic Ground level commercial function Recreational space Pourus facade Towers Underground vehicular parking with access into complex above Roof terrace with garden Roof terrace with pool Upper level accommodation
Ascending Continuous Terrace 2.4
Iterations of Type A

13 2 Urban Density Iterations of Hexagonal Grid type; Key A B A B Section A-A Section B-B Upper level accommodation Multi-level commercial space Recreational space Bridge over access Elevated tower podium roof exposure Multi level underground parking with access to the complex above Underground vehicular traffic Iterations of Type A Ascending Continuous Terrace; Sections 2.5

Programme; Lifestyle Programme; Business Living - high end Living - low end Hotel Commercial Offices Recreation Removed space for access Stock exchange; stocks and funds Private banks Insurance Safe deposit box Estate agents Auctions Collectibles stores; rare books, art, instruments, cars Exposition arena - Finance World Expo, Real Estate Summit Central business district (CBD) Equity; Private equity funds / Hedge funds Programme; One-upmanship lifestyle - 2.6
2 Iterations of Hexagonal Grid type; Plan View looking South-East View looking North-West View looking North-East Freeing ground plane Connecting towers Plan Increasing views Terraces around a courtyard Access under tower Plan Connecting towers Pourus design Iterations of Hexagonal Grid - 2.7
Rival Vertical Progressiveness (One-upmanship contructed overtime)


16 2 Urban Density Rival Vertical Progressiveness (one-upmanship built up overtime) One module (Axo) Deconstruction of one module (Plan)
2.8
(One-upmanship contructed overtime) 2.9
Rival Vertical Progressiveness
Rival Vertical Progressiveness (one-upmanship built up overtime)
2.10
Rival Vertical Progressiveness
(One-upmanship contructed overtime)
Urban Density 2 18 Rival Vertical Progressiveness (one-upmanship built up overtime)
Context and Brief
Section 1: Early Research
Section 2: Urban Density
Section 3: Context and Brief
Section 4: Design Development
Section 5: Design Proposal
Section 6: Appendix
19 3 Context and Brief
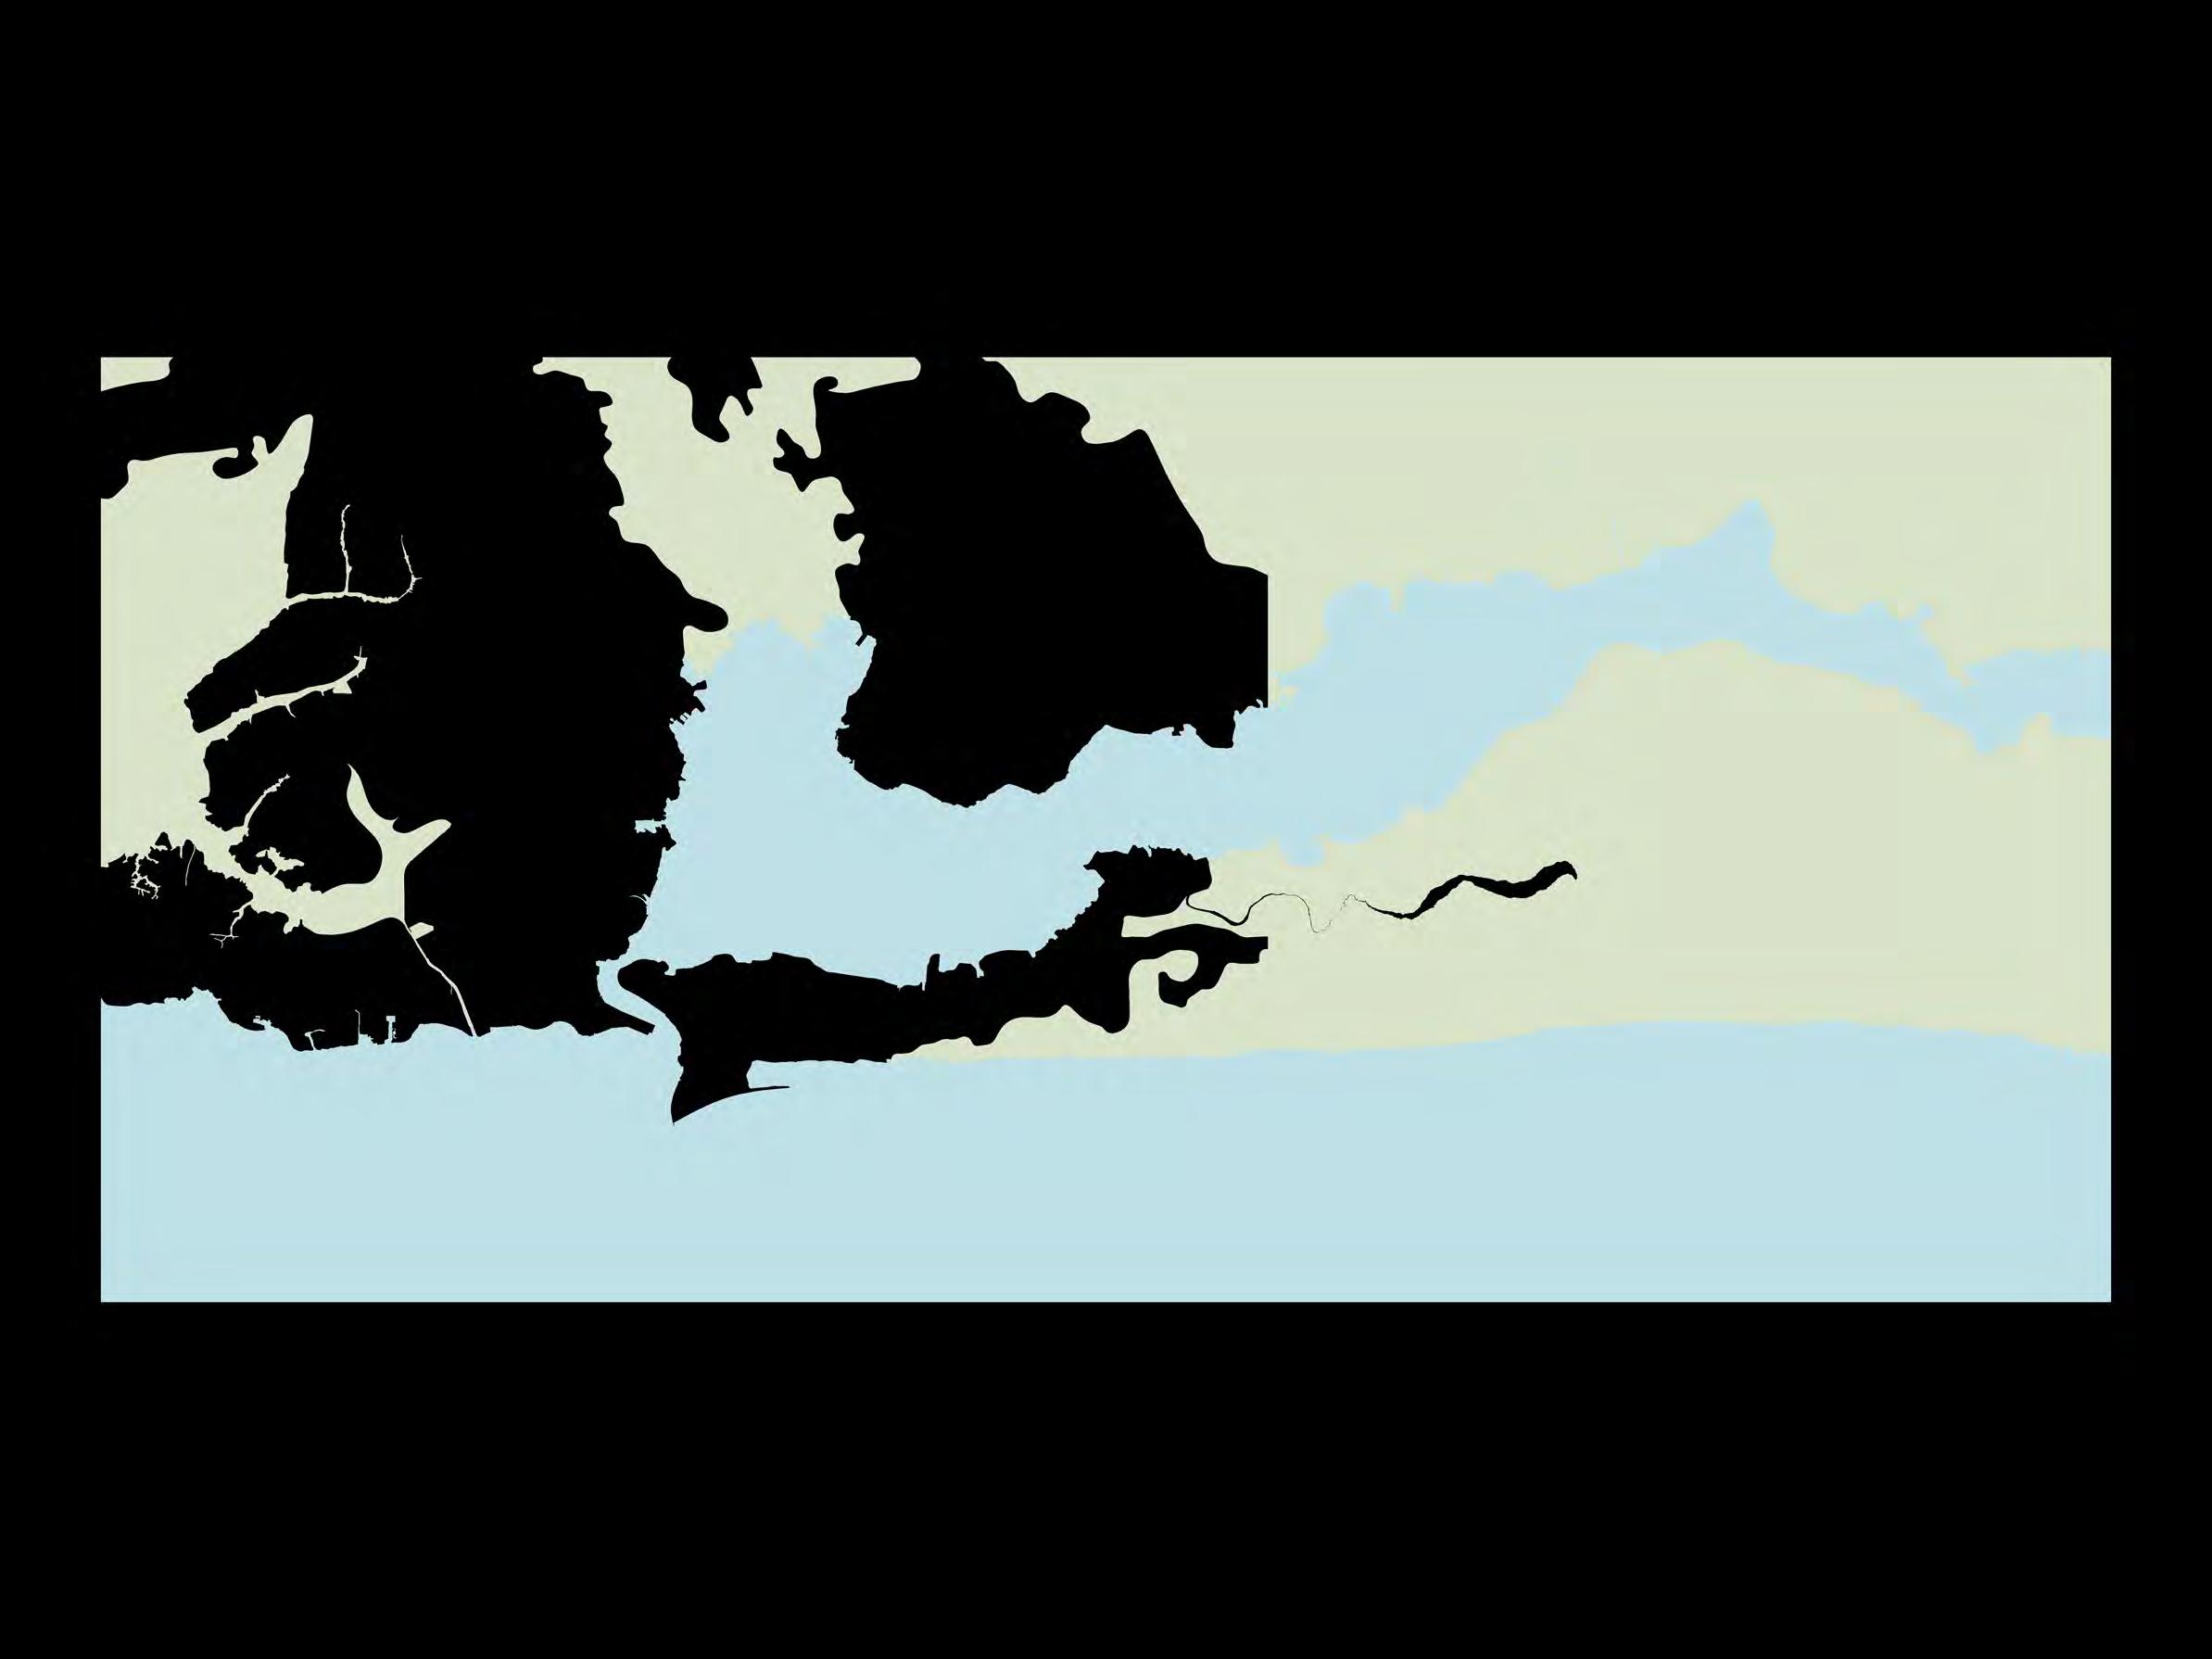
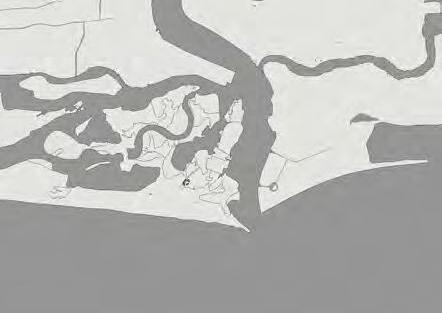
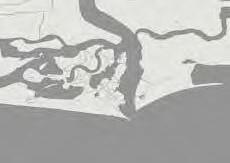
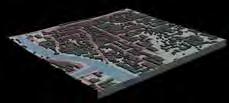
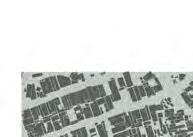
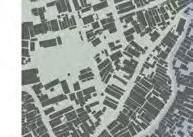
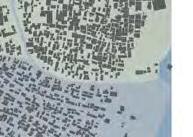
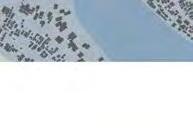
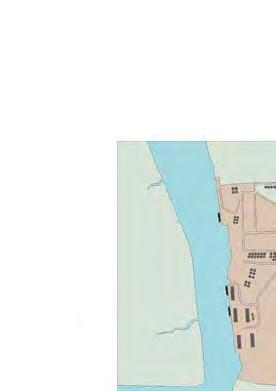
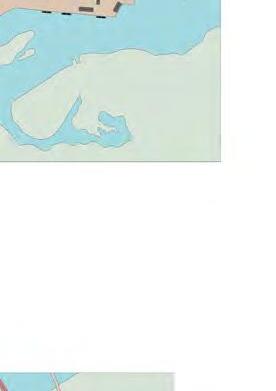
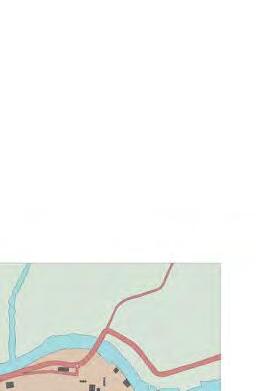
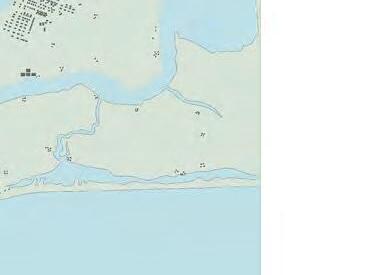
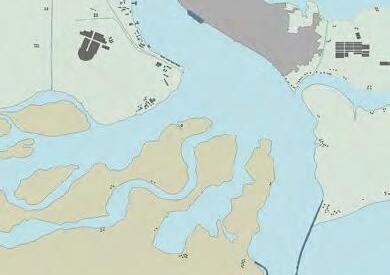
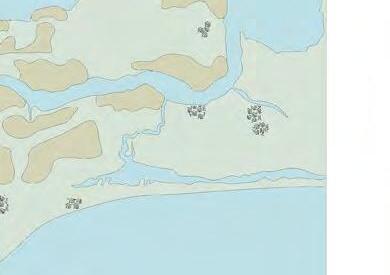
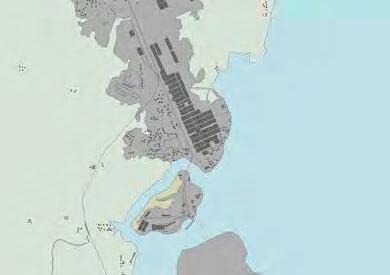
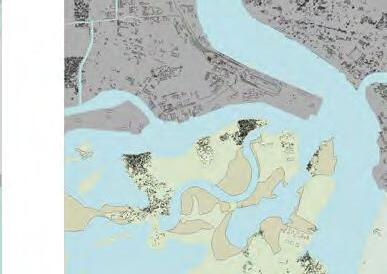
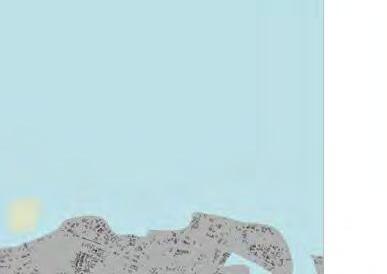
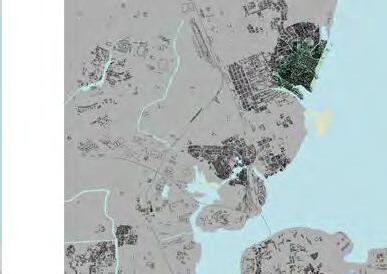
Map of Lagos City and Lagoon


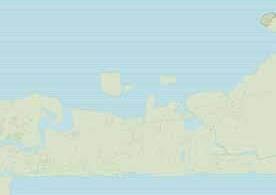


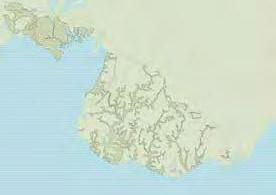


20 3 Context and Brief Land Natural sandbank Water; Sea, lagoon, rivers, Wetland Lagos City and Lagoon Scale: 1: 120 000 1KM 5KM 10KM 20KM Lagos Island Lagoon Eko Atlantic Artificial sandbank Sea of Guinea Key: Nigeria, Lagos highlighted Key: Africa; Nigeria highlighted
- 3.1


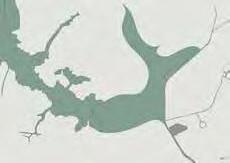
21 Scale: 1: 120 000 1KM 5KM 10KM 20KM 1965 1900 1990 2015 Stats from: https://www.researchgate.net/publication/228386611_Urban_sustainability_in_the_context_of_Lagos_mega-city/figures?lo=1 | 600 000 | 40 000 | 6 000 000 | 20 000 000 Lagos City; Growth Map Lagos Island Lagos Lagoon Key: Nigeria, Lagos highlighted Key: Africa; Nigeria highlighted Sea of Guinea
- 3.2
Lagos City; Growth Map
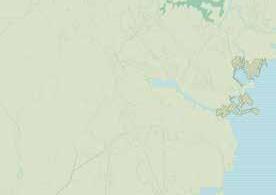
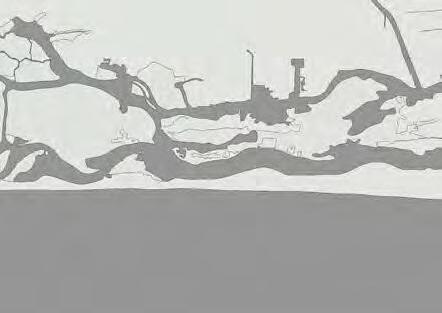
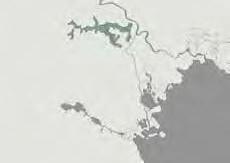
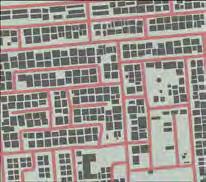
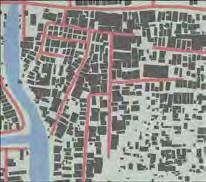
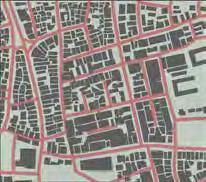
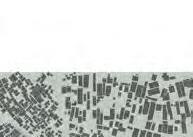
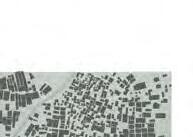
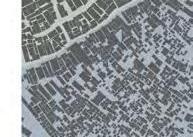
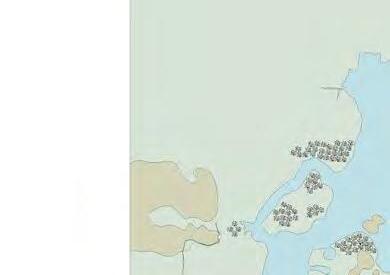
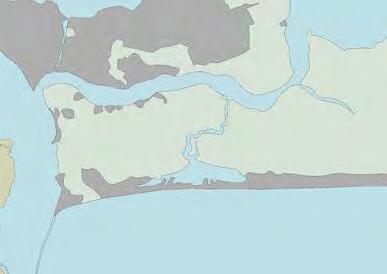
Lagos Developed Areas in 2020 - 3.3
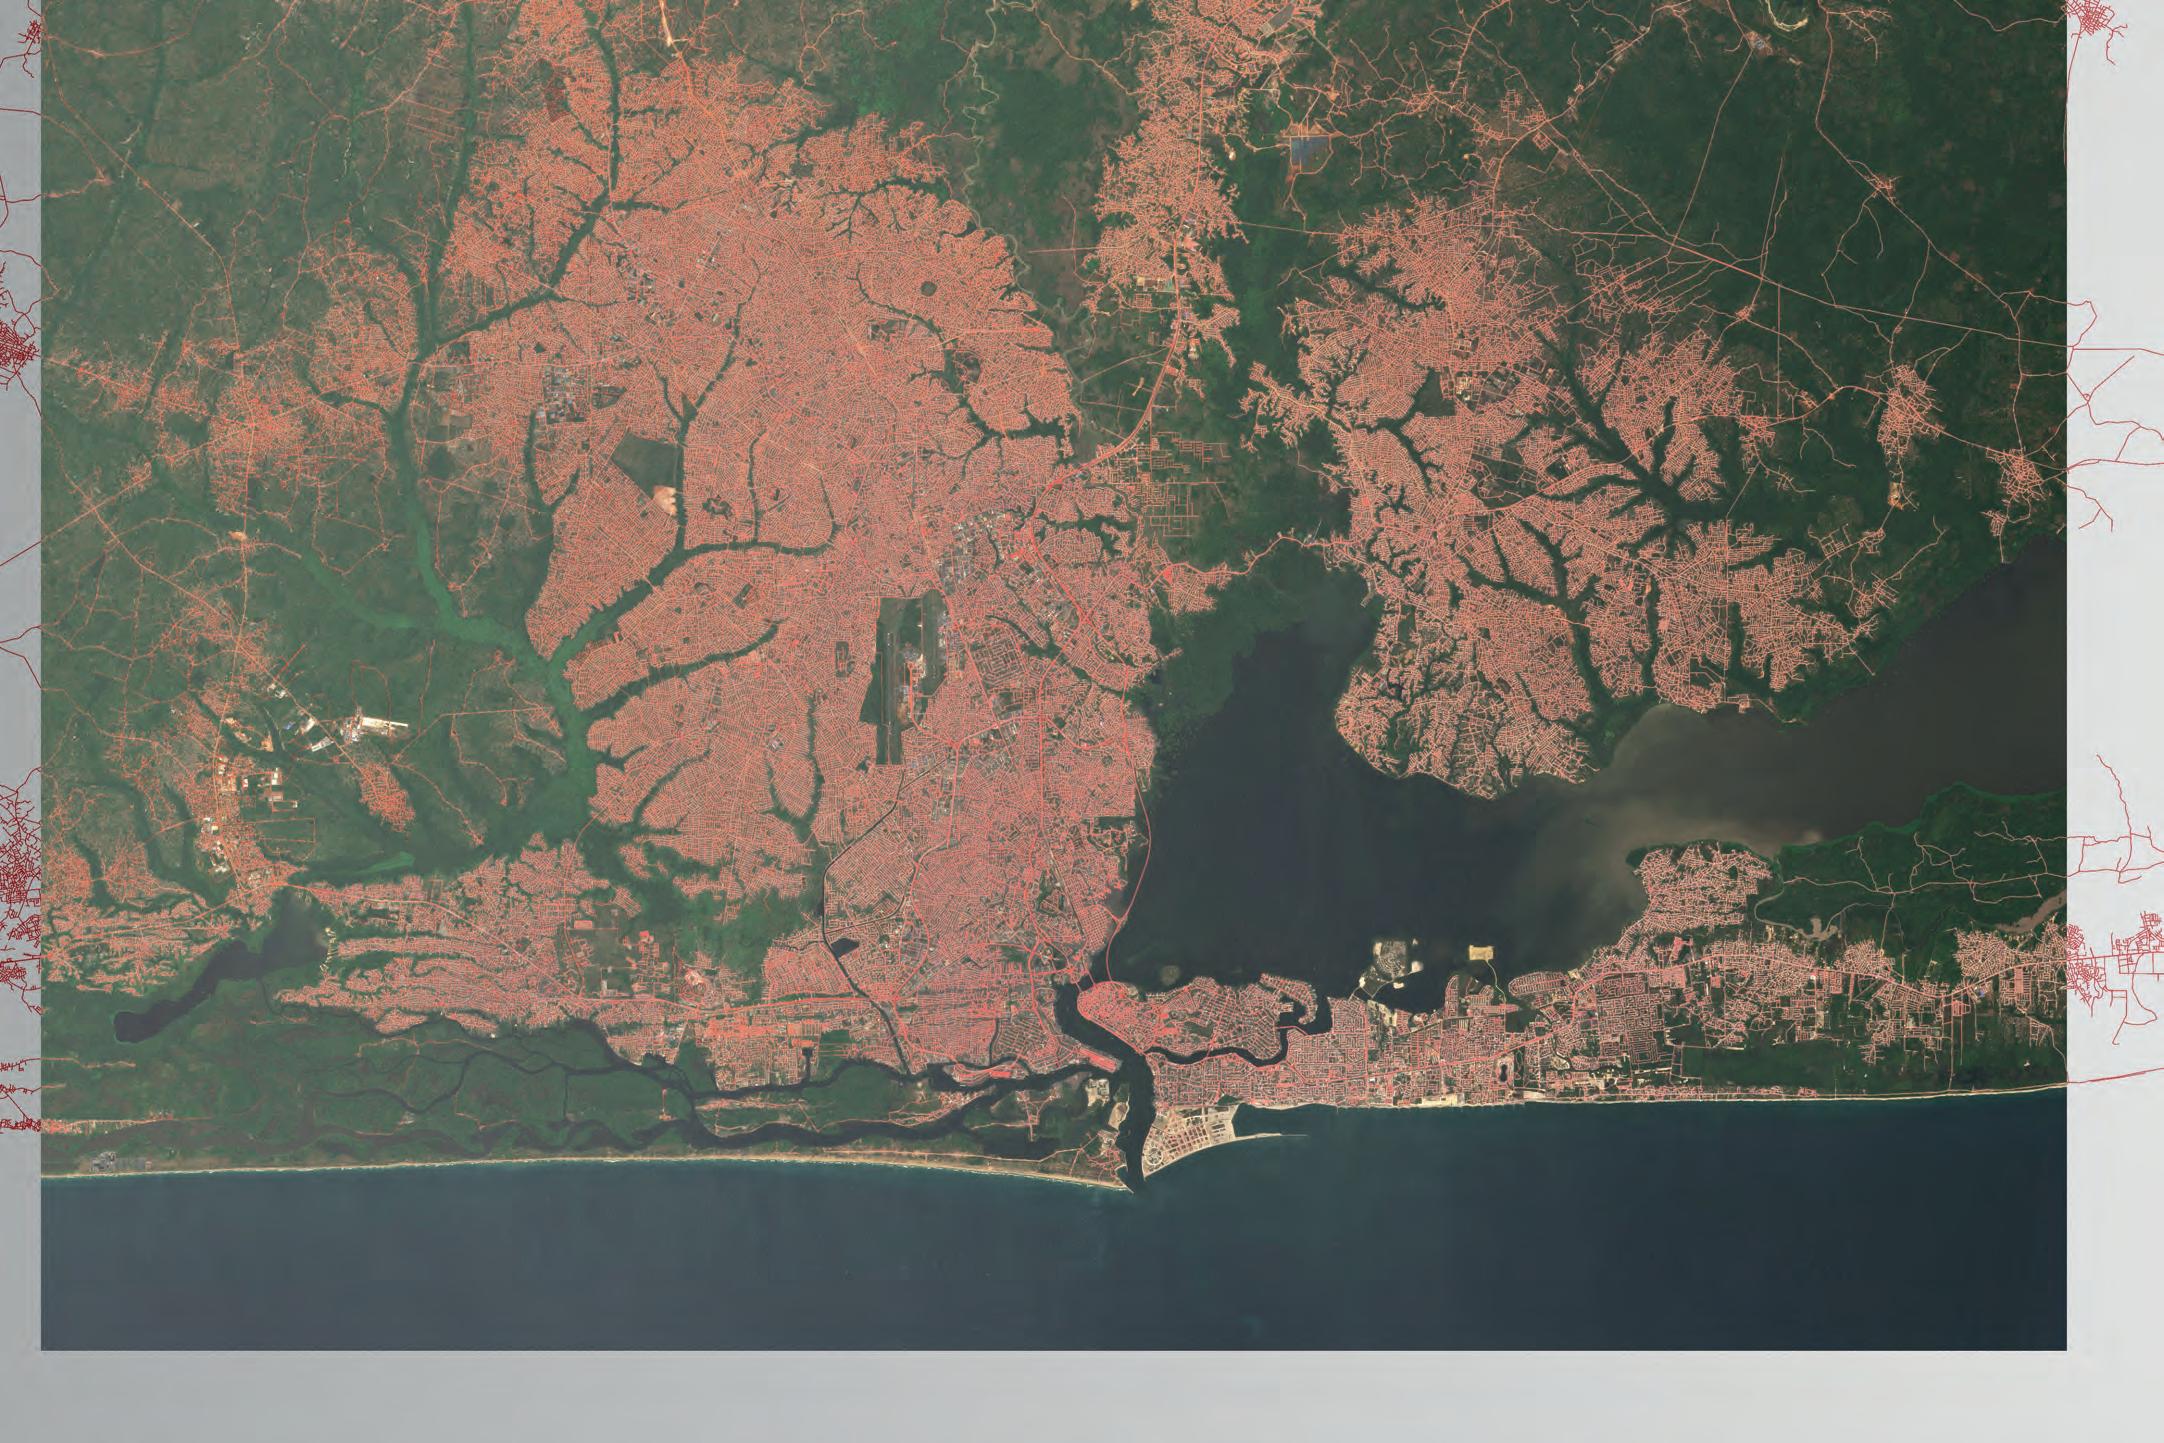
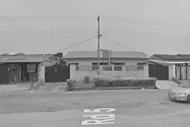
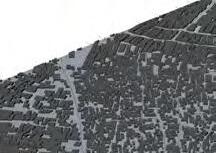
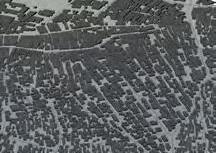
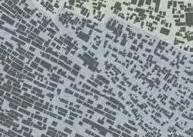
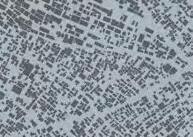
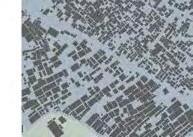
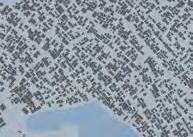
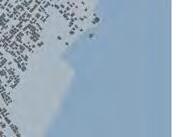
22 3 Context and Brief Photographic Map 2020 Ogun state Map showing densification situation and shortage of suitable land to build on
Lagos City; Density and Wealth Map - 3.4
Total population of Lagos: 15,000,000
Percentage of the total population that live in a slum: 66% https://worldpopulationreview.com/world-cities/lagos-population
Wealthy people in Lagos (Figures in dollars):
• Billionaires - 3
• Centi-millionaires (at least $100m) 20

• Multimillionaires (at least $10m) - 330
• At least $1 million - 6,300 https://newswirengr.com/2022/09/18/lagos-is-the-4th-city-with-most-millionaires-in-africa-report/
Informal settlement (ranked by density)
1. Agege (AG)
2. Ajegunle (AJ)
3.Amukoko (AM)
4. Badia (BA)
5. Bariga (BR)
6. Bodija (BO)
7.Ijeshatedo/Itire (IJ)
8. Ilaje (IL)
9.Iwaya (IW)
10.Makoko (MA)
11. Mushin (MU)
12.Oke-Offa Babasale (OK)
13. Somolu (SO)
Most expensive places to live:
1. Banana Island (BA)
2.Ikoyi (IK)
3.Eko Atlantic (EK)
4. Victoria Island (VI)
5. Magodo (MG)
6.Ikeja GRA (IK)
7. Maryland (MA)
8.Lekki (LE)
9. Surulere (SU)
10. Ajah (AJ)
5000 People per KM sq
Airport
District border
Land

Conservation area
Ocean / Lagoon
Most expensive places to live:
1.Banana Island (BA) - A: $1.6m, H: $28m
2.Ikoyi (IK) - A: $1.3m, H: $20m
3.Eko Atlantic (EK) - $860k, H: $1m
4.Victoria Island (VI) - $600k, H:$8.9m
5.Magodo (MG) - A: $330k, H: 820k
6.Ikeja GRA (IK) - $375k, H: $4m
7.Maryland (MA) - A: $290k, H:

8.Lekki (LE) - A: $250k, H: $1.7m
9.Surulere (SU) - A: $190k H: $5.2m
10.Ajah (AJ) - A: $150k , H: $730k
Key:
https://nigeriapropertycentre.com/for-sale/houses/lagos/
Density of the most expensive places to live:
1.Banana Island (BA) - 900pp / 1.63KM2


2.Ikoyi (IK)
3. Eko Atlantic (EK) - Expected 250,000pp / 25KM2
4.Victoria Island (VI) 217,362pp /

5. Magodo (MG)
6.Ikeja GRA (IK) 313,196pp / 46KM2
7. Maryland (MA)
8.Lekki (LE) 401,272pp / 755 KM2
9. Surulere (SU)
10. Ajah (AJ)
Key:
Density of the Informal settlements:
1.Agege (AG) - 459,939 (17km2)

2.Ajegunle (AJ) - 550,000 (11.19km2)
3.Amukoko (AM)
4. Badia (BA)
5. Bariga (BR)
6. Bodija (BO)
7.Ijeshatedo/Itire (IJ) -


8. Ilaje (IL)
9.Iwaya (IW)
10.Makoko (MA) - 85,000

11. Mushin (MU) 633,543
12.Oke-Offa Babasale (OK)
13.Somolu (SO) - 402,992 (14.6km2)
Lagos population (Last 5 years):
2023 15,945,912
2022 15,387,639
2021 14,862,111
2020 14,368,332
2019 13,903,620
Lagos population (10 year intervals):
2015 12,239,206
2005 8,859,399


1995 5,982,680
1985 3,500,464
1975 1,889,802
1965 1,135,439

1955 468,460
1950 325,218
https://worldpopulationreview.com/world-cities/lagos-population https://www.researchgate.net/publication/319669427_Increasing_population_urbanization_and_climatic_factors_in_Lagos_State_Nige ria_The_nexus_and_implications_on_water_demand_and_supply/figure s?lo=1
https://worldpopulationreview.com/world-cities/lagos-population
23 3 Context and Brief Scale: 1: 120 000 @ A2 1KM 5KM 10KM 20KM Lagos City; Density and Wealth Map
A: Average H: Highest pricetag m: Million US Dollars k: Thousand US Dollars
People:
Kilometers squared:
65 MA AG AM BA BR IJ IW MU SO EK BA LE VI KE MA IK AJ SU
‘pp’
‘KM2’
Urban Density Scale - 3.5


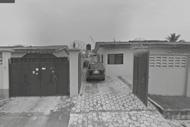
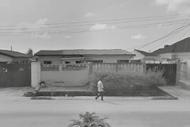
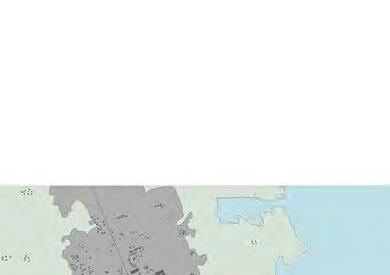
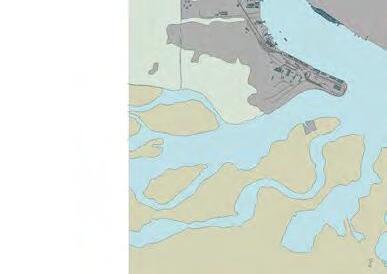
24 Context and Brief LE MA VI AP LI LE MA AP LI Lagos Urban Density Scale Apapa Population: 217,661 Makoko Population: 85,000 - 250,000 Site specification: Total site area (M2) (500mx500m): 250,000 Total built area (footprint, M2): 113,596 Total greenspace (M2): 0 Area of infrastructure (M2): 136,404 Area of water (M2): 201,465 Site specification: Total site area (M2) (500x500M): 250,000 Total built area (footprint, M2): 123,243 Total greenspace (M2): 2,540 Area of infrastructure (M2): 122,821 Area of water (M2): 0 Basic Statistics: Gross building area (M2): 714,809 Average FAR: 5.8 FAR range: 1-10 Density (people / KM2): 48,000 Site specification: Total site area (M2) (500x500M): 250,000 Total built area (footprint, M2): 118,816 Total greenspace (M2): 168 Area of infrastructure (M2): 127,798 Area of water (M2): 0 Basic Statistics: Gross building area (M2): 308,921 Average FAR: 2.6 FAR range: 1-4 Density (people / KM2): 64,000 Site specification: Total site area (M2) (500x500M): Total built area (footprint, M2): Total greenspace (M2): Area of infrastructure (M2): Area of water (M2): Basic Statistics: Gross building area (M2): Average FAR: FAR range: Density (people / KM2): BCR FAR Building Coverage Ration / Floor Area Ratio Map Key 25% 0.25 25% N/A N/A N/A 0.5 50% 1 100% 1.5 150% 2 200% 50% 100% Lagos Island, Idumagbo Av. Population: 209,437 Plan (500M x 500M) Plan (500M x 500M) Plan (500M x 500M) Plan (500M x 500M) Axonometric of plan Axonometric of plan Axonometric of plan Axonometric of plan Dominant building type: 3 - 7 storey mixed use residential / shop Dominant building type: 1-2 Storey residential home Dominant building type: 1-2 storey formal home Dominant building type: 1 - 2 storey informal home with shop front Lekki Population: 287,958
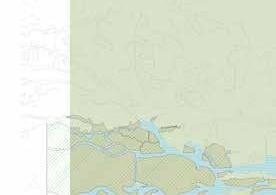
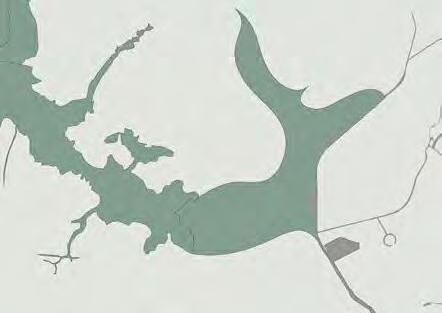
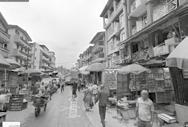
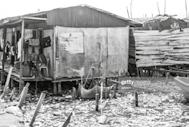
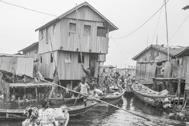
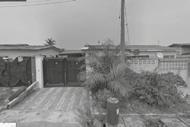
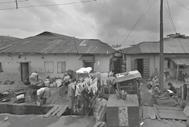
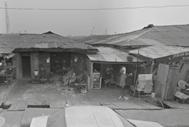
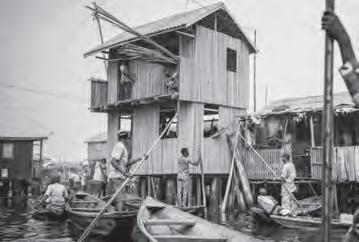
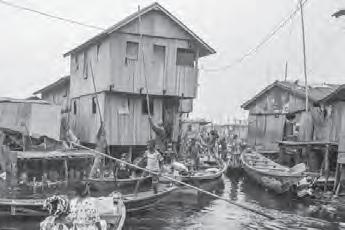
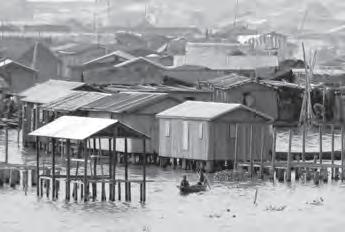
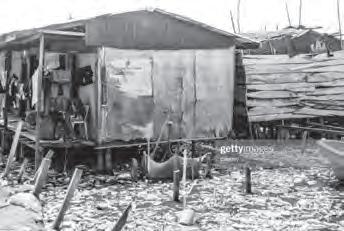
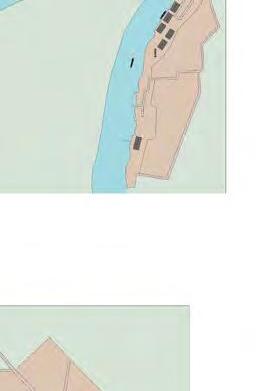
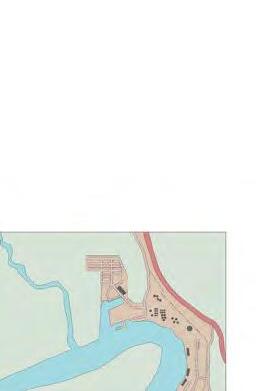
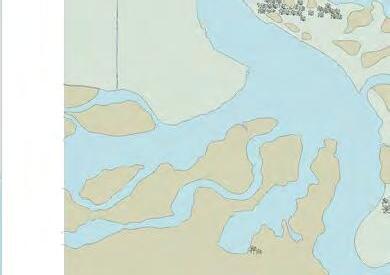
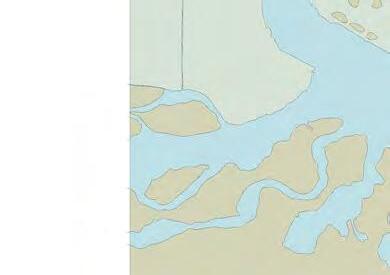
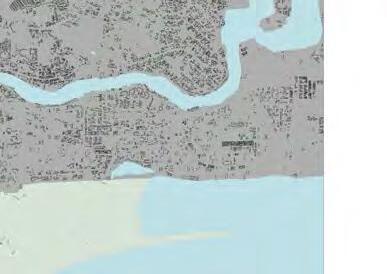
Makoko Residents Livlihoods -
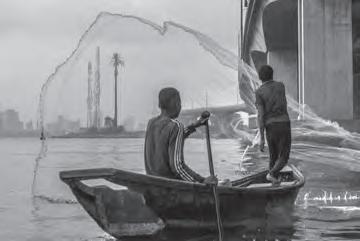
In the morning the men in the family go on their boat into the lagoon to fish. They return their caught fish to thier wives who cook cook them and hand it over to their children who sell the fish on the market.
Boats are generally the only means of travel around the settlement. Local slumdwellers sell their products on their boats and on the porches of their dwelling.

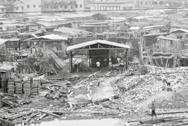
Makoko timber merchants transport wood via barges or rafts to Lagos mainly from the forrests in either Bayelsa, Cross Rivers, Ondo or Delta.
https://guardian.ng/stories/the-wood-merchants/
The Mokoko settlement has established facilities including schools, hospitals and various other trade
Local Makoko builders and carpenters construct the communities houses that they reside. Most of the dwellings are raised on stilts within the lagoon and some are located just in land.
25 3 Context and Brief
Lagos; Makoko residents livlihoods (within the settlement)
Wood Merchants School Construction
Lagoon trade Fishing
3.6


26 3 Context and Brief Lagos; Typologies, Excess scale Density 6 People Population: Floor Area Ratio Building Cover Ratio 8 People 10 People 5 People 4 People Settlement Scale - 3.7
Lagos’ Ultra High Net Worth individuals (UHNW) Inequality in Lagos 3.8

27 3 Context and Brief Aliko Dangote Total Lagos’ private wealth; 97 Billion Percentage of UHNW shown in red Key 50M 150M 100M Lagos’s wealthiest Residents (per 1 Billion dollars) Rest of Lagos private wealth (per 1 Billion dollars) Listed on Nigeria’s stock market Jimoh Ibrahim Airlines; Air Nigeria Gas stations; Global Fleet Oil & Gas Oil and gas industry; Forte Oil PLC Fashion; House of Fashion Oil and gas industry; Famfa oil Printing industry; Digital Reality Prints Property development; DaySpring Oil and gas services; Zenon Petroleum and Gas Power generation; Geregu Power Plc Shipping; SeaForce Banking; Zenith Bank Plc Agriculture Shipping Real estate Telecommunications Visafone Communications Investmenting and trading; CentreForce Ltd Insurance; Nicon Insurance Global Fleet Group (conglomerate - HQ in Lagos) Rose of Sharon Group (conglomerate - HQ in Lagos) Dangote Group (conglomerate - HQ in Lagos) Yinka Folawiyo Group (conglomerate - HQ in Lagos) Hospitality; Nicon Hotel Real estate holdings Banking Magazine; Newswatch Magazine Telecommunications; Globacom (Glo) Dangote oil and gas Logistics; Dangote transportation Property development MHF properties Building Materials; Dangote Cement Listed on Nigeria’s stock market Consumer goods; Sugar, pasta, salt, flour Oil Exploration; Conoil Banking Mike Adenuga Folorunso Alakija Jim Ovia Tunde Folawiyo Femi Otedola 18.7 Billion 1.1 Billion 6.2 Billion 1 Billion 0.9 Billion 0.65 Billion 1.8 Billion Lagos’ Ultra-High-Net-Worth individuals (UHNW) Wealthiest 7 Residents; Their wealth, businesses and towers $ $ $ $ $ $ $ $ $ $ $ $ $ $ $ $ $ $ $ $ $ $ $ $ $ $ $ $ $ $ $ $ $ $ $ $ $ $ $ $ $ $ $ $ $ $ $ $ $ $ $ $ $ $ $ $ $ $ $ $ $ $ $ $ $ $ $ $ $ $ $ $ $ $ $ $ $ $ $ $ $ $ $ $ $ $ $ $ $ $ $ $ $ $ $ $ $ $ $ $ $ $ $ $ $ $ $ $ $ $ $ $ $ $ $ $ $ $ $ $ $ $ $ $ $ $ $ $ $ $
Neighbouring state: Benin
Wealth Distribution in Nigeria
Nigeria’s State Boundaries
Nigeria State Boundaries; Wealthiest and Poorest States

Lagos state
Nigeria’s Wealthies States by GDP:
•Lagos | $33.679 Billion
•Bayelsa | $21.17 Billion
•Delta | $16.75 Billion
•Oyo | $16.112 Billion


•Imo | $14.21 Billion
•Kano | $12.39 Billion


•Edo | $11.89 Billion
•Akwa Ibom| $11.18 Billion
•Ogun | $10.47 Billion
•Kaduna | $10.33 Billion
Nigeria’s Poorest States by GDP:
•Jigawa | 72.1% poverty rate
•Gombe |73.2% poverty rate

•Adamawa |74.2% poverty rate
•Katsina |x% poverty rate
•Sokoto |81% poverty rate

https://buzznigeria.com/the-10-richest-states-in-nigeria-and-their-gdps/

Gulf of Guinea
Key: Africa; Nigeria highlighted


Key: Nigeria, Lagos highlighted
Neighbouring state: Cameroon


Neighbouring state: Niger Neighbouring state: Chad

28 3 Context and Brief
3.9
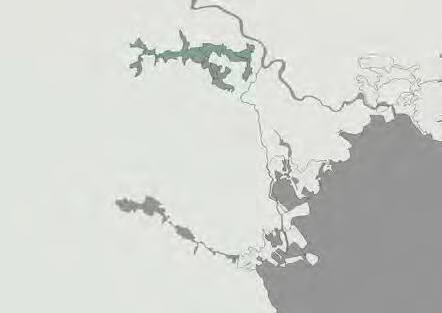
Primary Ports in Nigeria - 3.10


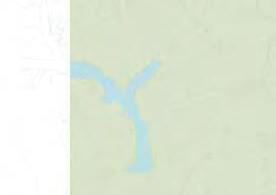
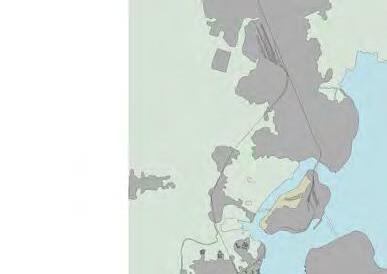
29 3 Context and Brief Lagos port complex Apapa ON -> LPC <TIN <DEL -> DEL <ONN <CAL <LPC -> TIN -> RIV -> CAL -> RIV <Statistics extracted from the Nigerian Port Statistics https://nigerianstat.gov.ng/elibrary/read/735 Lekki sea port Onne Port Harcourt Bonny Port Calabar Delta port (warri) Tin can island 2012 2013 2014 2015 2016 2017 5M 0M 10M 15M 20M Per million metric tonnes Port statistics based on metric tonnage per year Add timeline here of ports Akwa Ibom deep sea port Bakassi Main ports in Nigeria Key: Nigeria, Lagos highlighted Key: Africa; Nigeria highlighted Delta -> (Out) Delta <- (In) Lagos -> (Out) Lagos <- (In) Existing lines (narrow gauge) Nigerian railway key: Standard gauge (completed) Standard gauge (under construction) Designed and proposed extensions High speed train (Lagos - Abuja) Calabar -> (Out) Calabar <- (In) Onne -> (Out) Onne <- (In) Rivers -> (out) Rivers <- (In) Tin Can -> (Out) Tin Can <- (In)
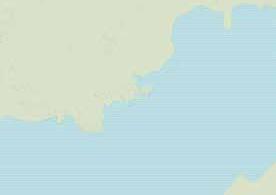
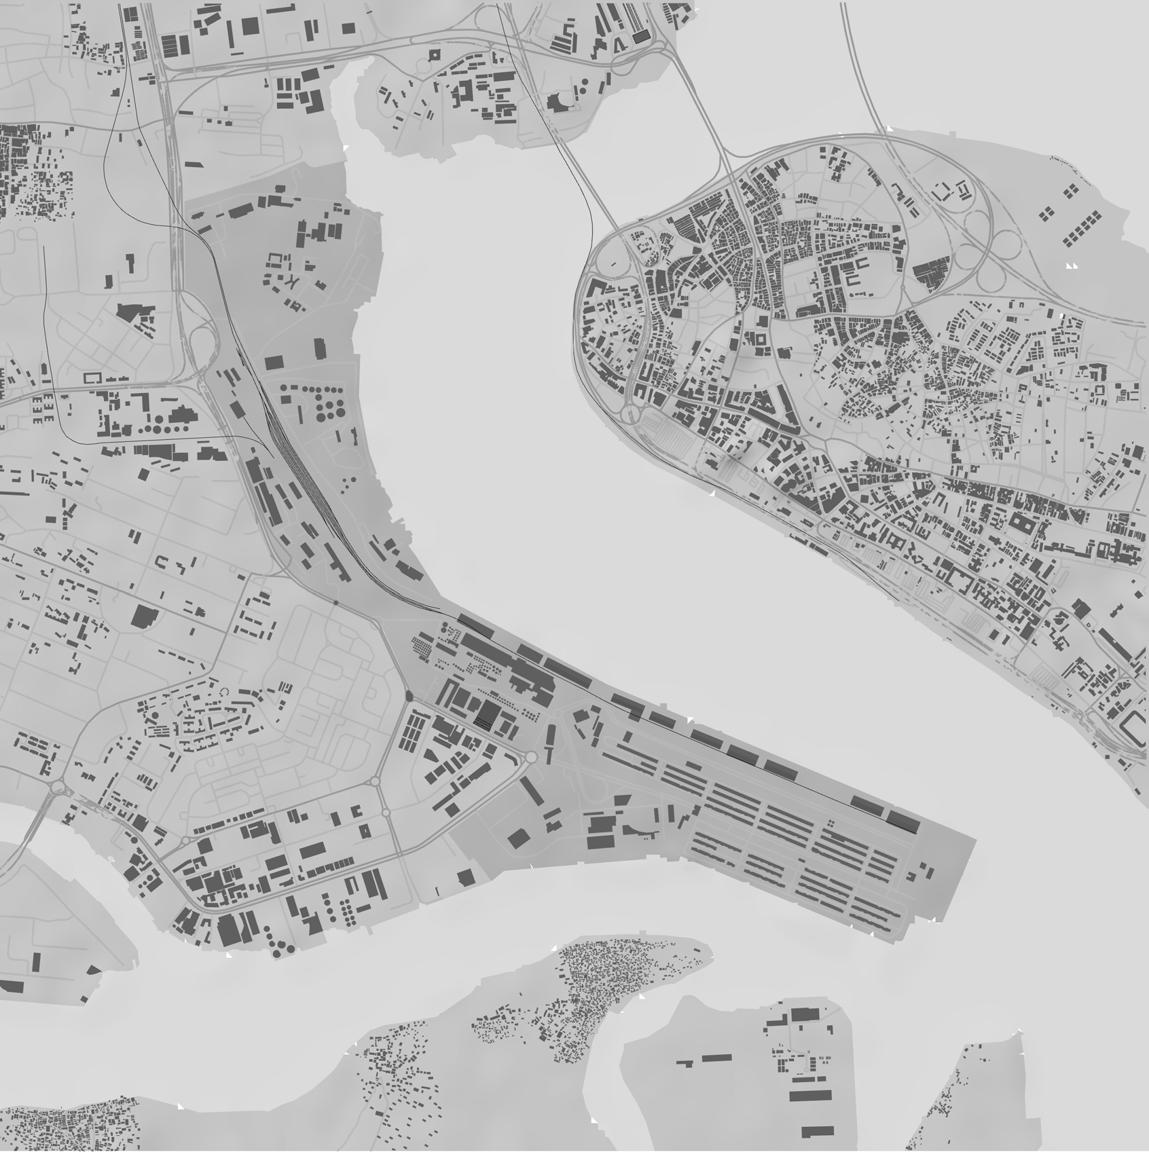
Nigeria’s Primary Ports -


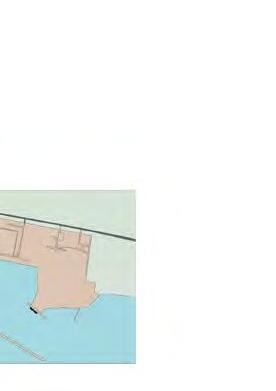

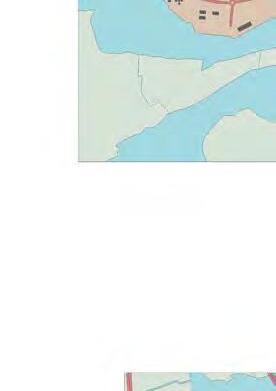

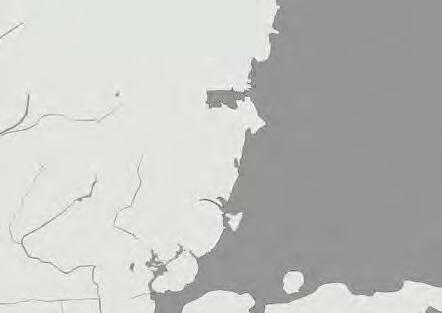
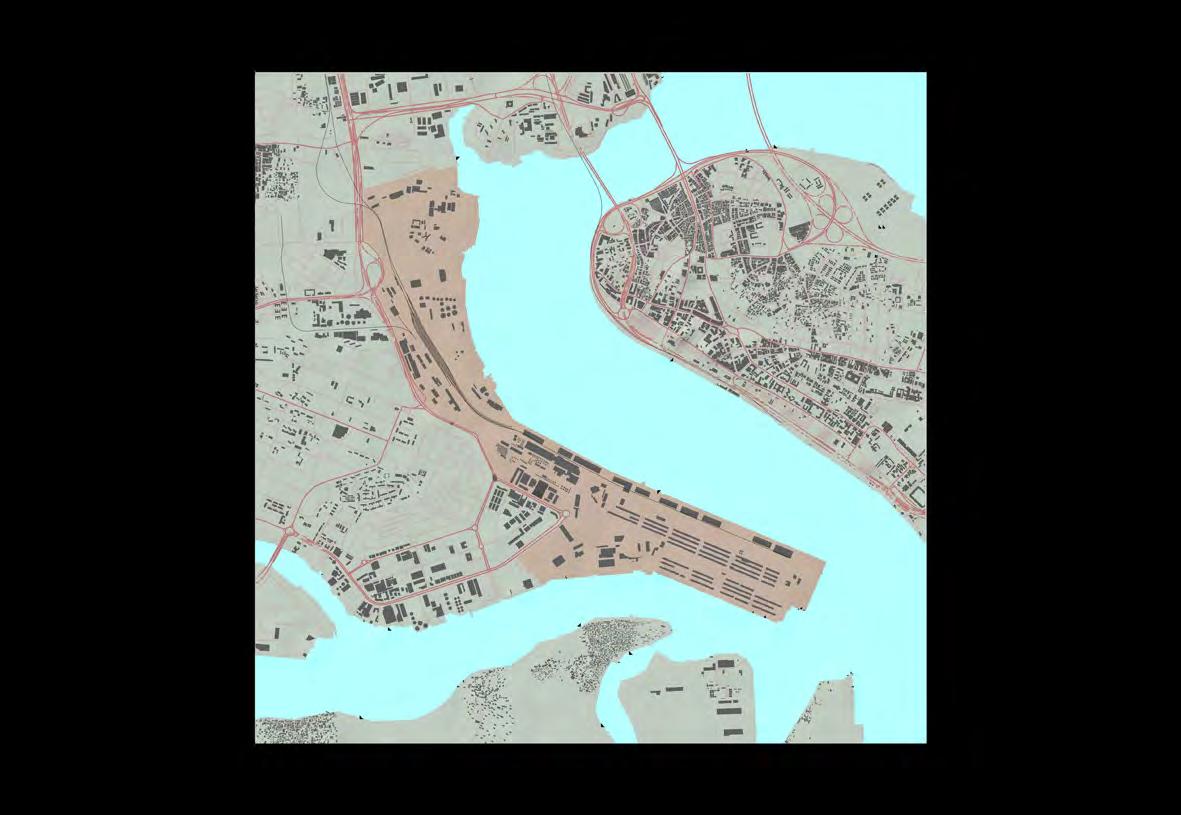
30 3 Context and Brief Warri port Forcados river Tin-Can island port complex Lagos port complex; Apapa wharf Lekki Port Delta port complex Rivers port complex; Port Harcourt Onne complex Calabar Location key Port Harcourt Bonny river Badagry river Tin-can island Apapa Snake island Lagos harbour Apapa wharf Lagos island Onne Calabar Apapa Apapa quays Kidney island Eagle island Nigerias’ primary ports NTS. but relative in size to each port Lagos Lekki Onne Harcourt Port Calabar Delta Tin-can Key Port boundary Port buildings Land Water Major roads Minor roads
3.11
Sections 1 - 8 3.12


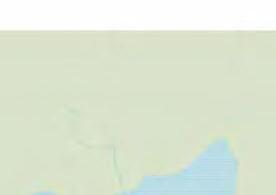
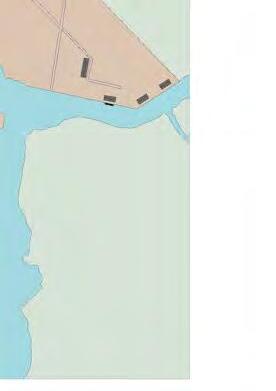
Existing Sections of Apapa Port and surrounding waterways

2 4 8 9 10 11 12 Lagos Island Badagry Creek Middle Creek Tamaro Commodore Channel Lagos Lagoon Apapa Wharf 13 14 15 16
3.13


Existing Sections of Apapa Port and surrounding waterways
Sections 9 - 16
Lagos’ Ports Including Apaa port exensions
Map of Apapa wharf extensions

1920 Wharf constructed
1951-7; First wharf extension
1962-8; Second wharf extension
1979; Third wharf extension
Petrochemical area
1977; Tincan island and Ro-Ro extension
2014; Eko support extension
1920; Wharf constructed
1951-7; First wharf extension
1962-8; Second wharf extension
1979; Third wharf extension
1977; Tincan island and Ro-Ro extension
2014; Eko support extension Ceased operation
33 3 Context and Brief
Commodore Channel
Customs wharf
Apapa wharf
Iddo island wharf
1005M 943M 365 M 780M 550M
400M
3.14
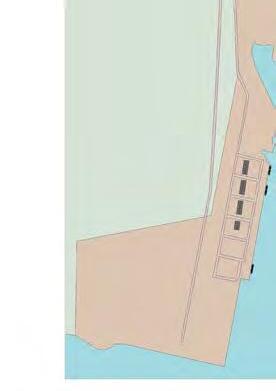
Apapa Port Existing Construction - 3.15
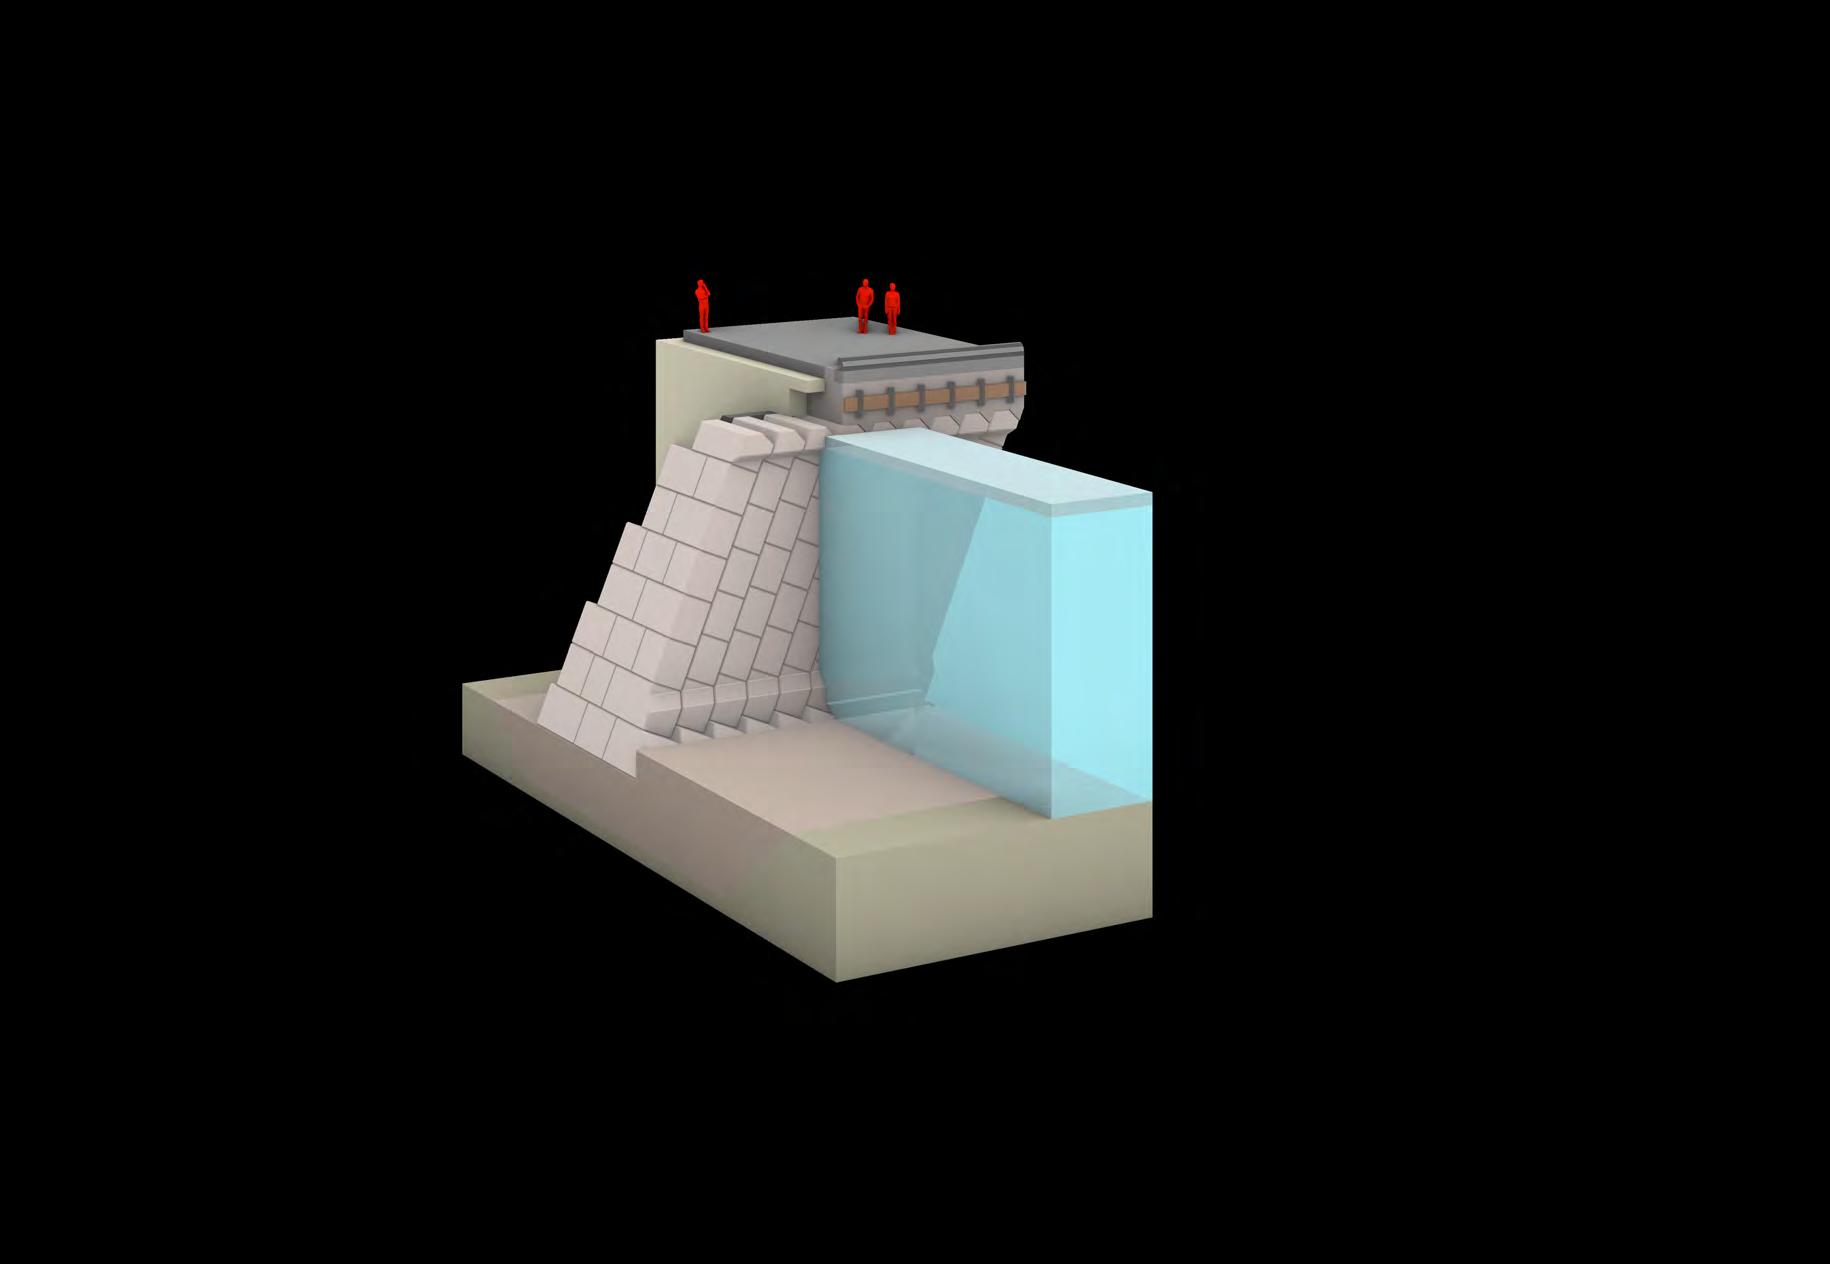
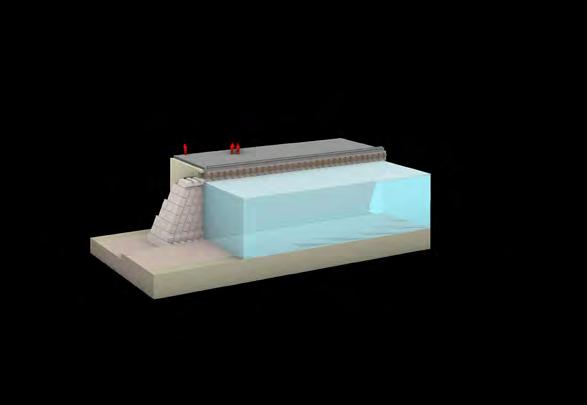
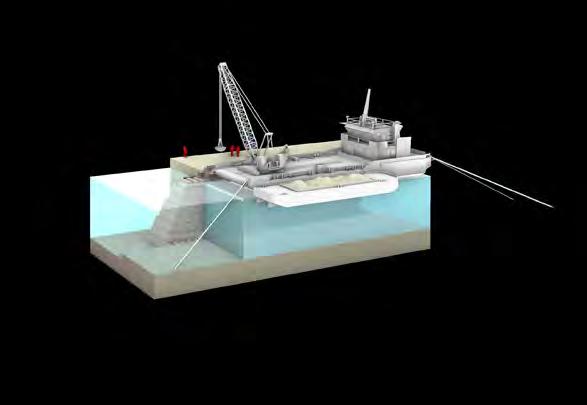
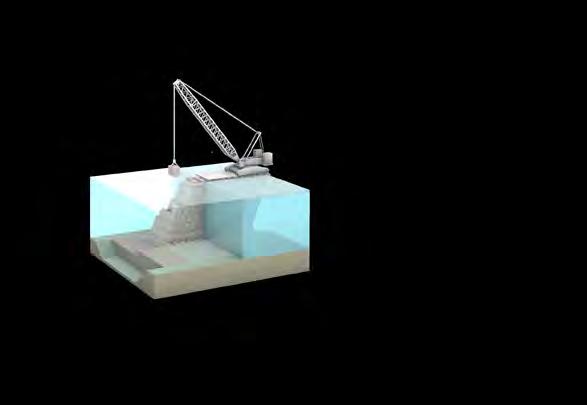

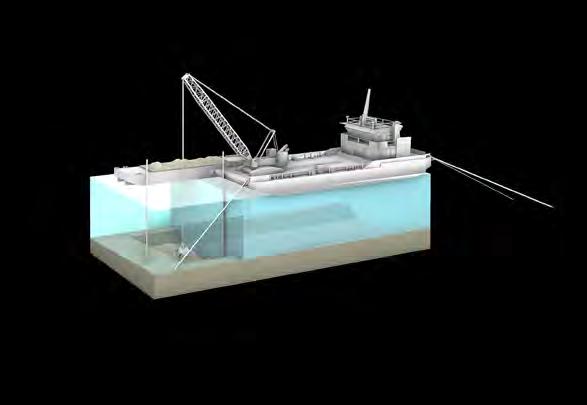
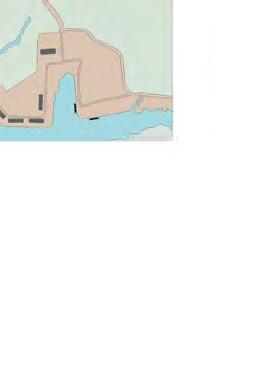
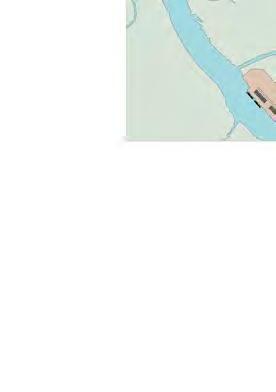
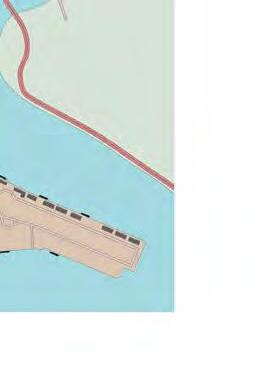
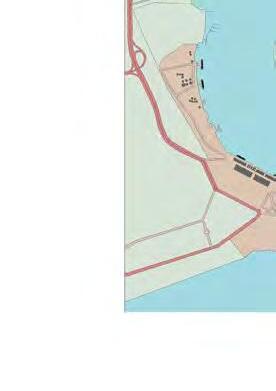
3 Context and Brief Apapa port construction Tin Can Island (sandbanks) Section of Apapa Wharf sea wall Map of Apapa wharf and surrounding area Existing Apapa wharf Reclaimed land; 1966 Apapa wharf extension Sand infill Rubble Timber fender Granite rubble base Existing lagoon bed Mean high water level Precast concrete blocks Mean low water level Apapa Commodore Channel Lagos island (central business district) Lagoon Apapa wharf extension Apapa wharf Badagry Creek Tincan island Tamaro Middle Creek Excavating existing seddiment to form a trench along the lagoon bed Granite rubble dumped from barges to create base layer for the concrete blocks Precast concrete blocks sourced from a mill 60 miles from Apapa Wharf are positioned into place with the guidance of underwater divers. The blocks are angled 60 degrees and slot into each other with the tongue-and-groove joints The area contained within the wharfs newly laid precast concrete block wall is filled in with dredged sand, sourced from the bed at the southmost part of the wharf extension The top layer installed as well as the Sediment extracted from lagooon bed and used as sand infill
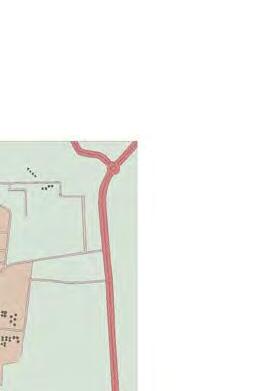
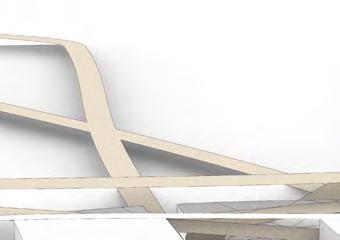
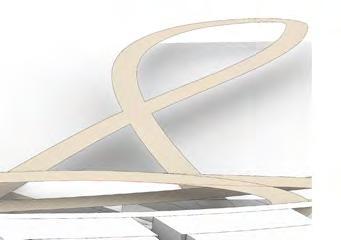
Apapa; Road Congestion - 3.16
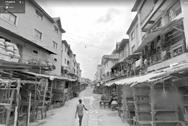
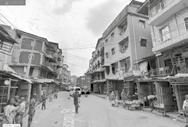
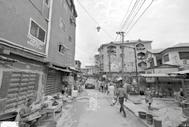
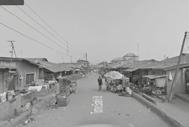
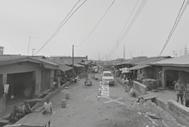
The rapid increase in population has meant that the Lagos infrastructure is being used over capacity. Consequently the city is renouned for long queues.
The new train line
Key:
Highway
Major roads
Minor roads
Trainline
Water
Land
Extremely high traffic according to (A. Oluwasegun, 2015)
Traffic in other parts of the city h
As a result of the volume of traffic in often stationary positions, street stalls sell goods along the side of the roads and at intersections. Street hawkers who also sell goods but directly to the vehicles operate between the running vehicles stuck in traffic.
The location of the site being directly opposite the central business district would be an idea location for accommodation for the people that work there
Unmaintained roads Flooding
Incoming port lorries park outside the port vacinity waiting to be processed, often using the inside lane of the road. This reduces use of the urban infrastructure and increases congestion in the surrounding area.
Adebayo. H. Oluwasegun, Using Geographical Information System (GIS) Techniques in Mapping Traffic Situation along Selected Road Corridors in Lagos Metropolis, Nigeria
35 3 Context and Brief
Apapa; road congestion
Timeline of Lagos 500 BC - 1952


36 3 Context and Brief Map 1500 1700 Main island referred to as: Onim (Portuguese name; 1760 Main island referred to as: Lagos (Portuguese for lake or lagoon; 1850 present day Main island referred to as: Curamo (Portuguese name; 1600-1760) Main island referred to as: Oko (Yoruba meaning a farm; 1450) Main island referred to as: Eko (Bini; a militarycamp; 1650) Colonial period 1851 1960; British empire in Lagos Map 1700 - 1800 Map 1935 Brazilian (Portuguese) quarter Isheri; First settlers from Awori; Yoruba sub group of fishermen and hunters First settlers from Awori; Yoruba fishermen and hunters 1400s Portuguese explorers arrive and bagan to trade, eventually followed by other Europeans 1472 Fell under the domain of the Kingdom of Benin 1500-1600 International trade; The presence of military personel from Benin resulted in an increase of trade, local people and people further inland could trade with European traders sited in the area, who would export the goods by boat. xxx Atlantic slave trade; Onim becomes centre of Atlantic slave trade 1600 -1700 Onim becomes small kingdom and a tributary to the Oyo Empire Onim developed strong diplomatic and economic links to South America 1800 Oyo Empire begins to collapse, allowing Lagos to assume the leading economic position regionally, becoming the most important market in the Yoruba territories as well as growing substantially 1835 For around two centuries the island served as major centre for the slave trade. In 1841 the current king, Oba Akitoye, attempts to ban slavery. Local merchants strongly oppose the intended move, and depose the king to Europe where he meets with British authorities (who had banned slave trading in 1807) 1841 ‘Reduction of Lagos’ or ‘Bombardment of Lagos”; The British reinstate king Oba Akitoye. British desire to replace slave trade with legitimate trade and spread Christianity. There were fears by locals that some Lagos people known as Saro people, would be reenslaved 1851 Treaty between Great Britain and Lagos; Liberate enslaved Africans, Expel European slave traders residing in Lagos, Allow British subjects to have trade access to Lagos. 1852 Lagos is annexed as a British protectorate Population 1861 Treaty of Cession; Lagos is annexed as British protectorate; ending the consular period and starting the British colonial period 1862 Lagos is incorporated into the Southern Nigeria protectorate 1906 Lagos becomes the capital of the British colony and protectorate of Nigeria 1901 Contact by Portuguese (1472) Founding fathers chose to erect a red pepper farm. The site is then occupied by the king and his palace. Becoming the centrepiece for a new propsperous village of farmers abd fishermen Stone moles Designated as new residential area; Ikoyi and Victoria island Designated as new industrial area Old customs wharf; Ebute Ero (1906) Oyo Empire in Lagos (1835 Oyo empire collapse) Nok civilisation (1500BC to 500 AD) 267,407 (1952) 126,474 (1931) 98,303 (1921) 73,766 (1911) 41,487 (1901) 37,452 (1881) 25,083 (1866)
3.17
Timeline of Lagos 1960 - 2023


37 3 Context and Brief Evolution of Lagos Map 1962 Lagos gains its independenace 1960 First republic (1960 1979)1967 Civil war (1967 1970)1979 Second republic (1979 - 1983)1993 Third republic (1993 1999)1999 Fourth republic (1999 present) Modern day Apapa wharf extension (1977)??? Apapa wharf extension (1977) Old customs wharf; Ebute Ero (1906) Floating docks Brazilian quarter Stone moles Colonial period Key Urban centre Urban expansion Terminal facilities Port-related activities Water depth; shallow Key Built up area Buildings Port-related activities Mangrove forrest Road Train Water depth; deep Water depth; deepest Major roads Rail 8,767,000 (2005) 15,946,000 (2023) 4,764,000 (1990) 1,476,837 (1975) 655,246 (1963)
3.18
Apapa Storm Surge Diagram
During
contributing
High water (Mean Springs) - +0.82M
Low water (Mean Springs) - +0.18M
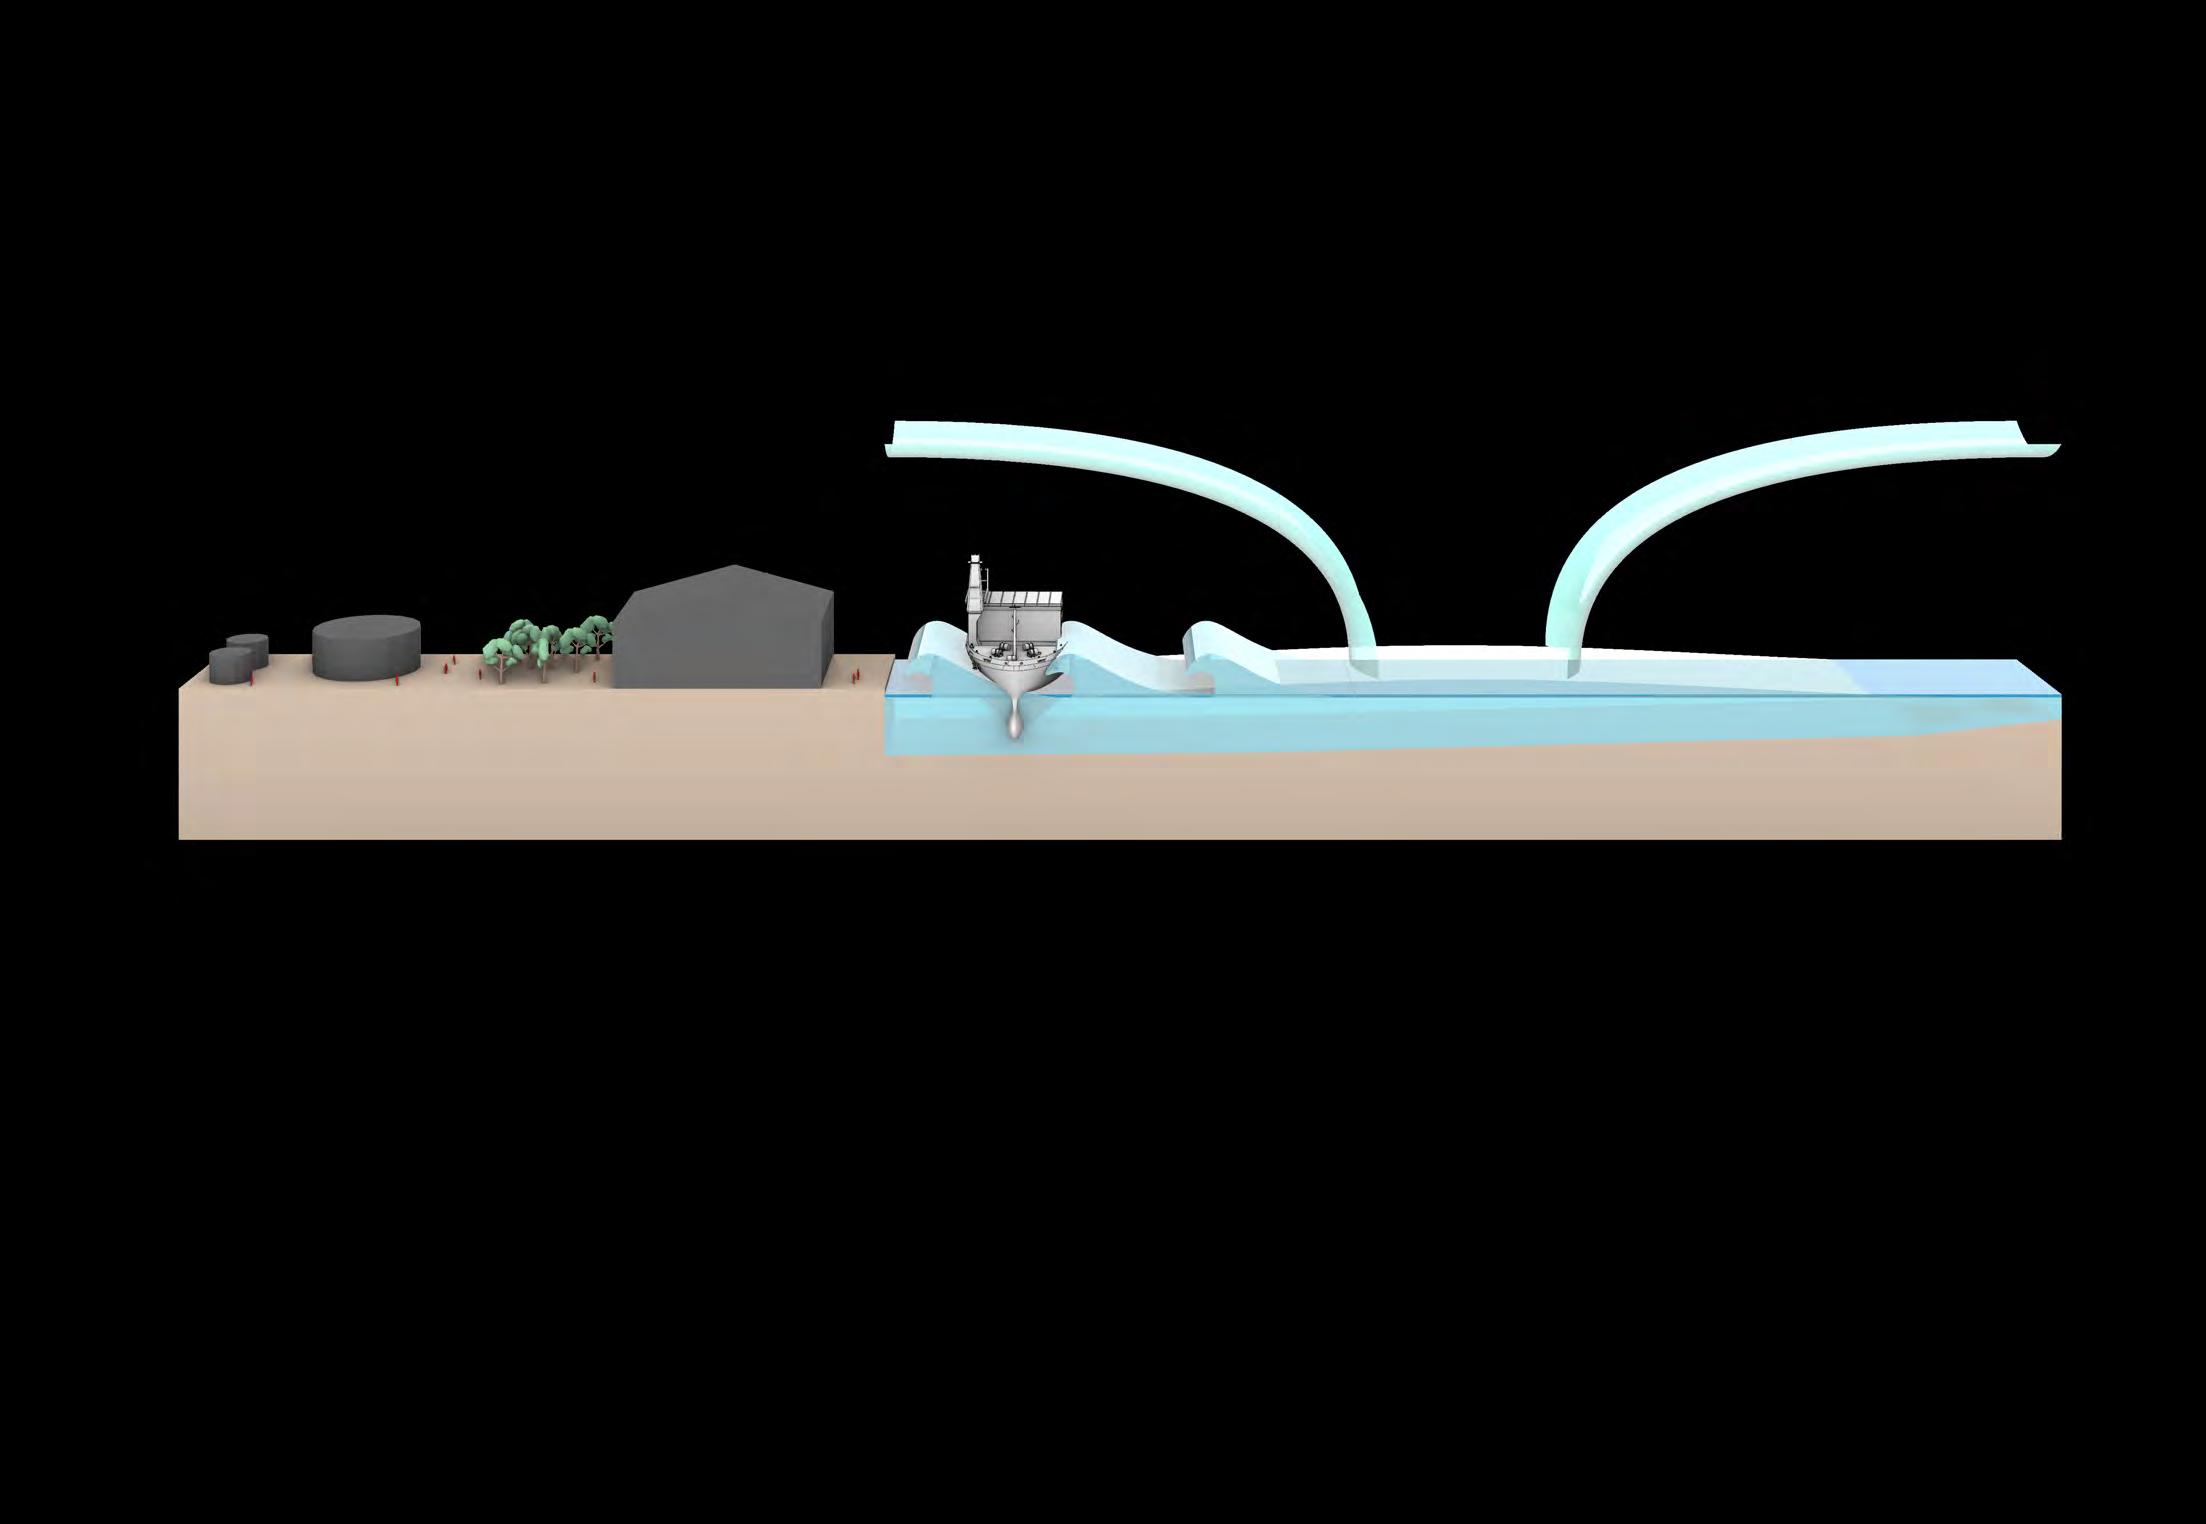
Datum of soundings (Lagoon level)
Datum of soundings (Lagoon bed)
Depth: 7.92
38 3 Context and Brief
Tin Can Island (sandbanks)
Apapa sea wall
Depth: 12.88 M Depth: 11.576 Heavy rain Pressure driven surge Wind driven surge Storm direction Heavy rain
Apapa Wharf G.L.
Strong winds High tide
2011 a combination of heavy rain, strong winds, high tide and
level
Rivers feeding into the lagoon
to increased water
- 3.19
Design Development
Section 1: Early Research
Section 2: Urban Density
Section 3: Context and Brief
Section 4: Design Development
Section 5: Design Proposal
Section 6: Appendix
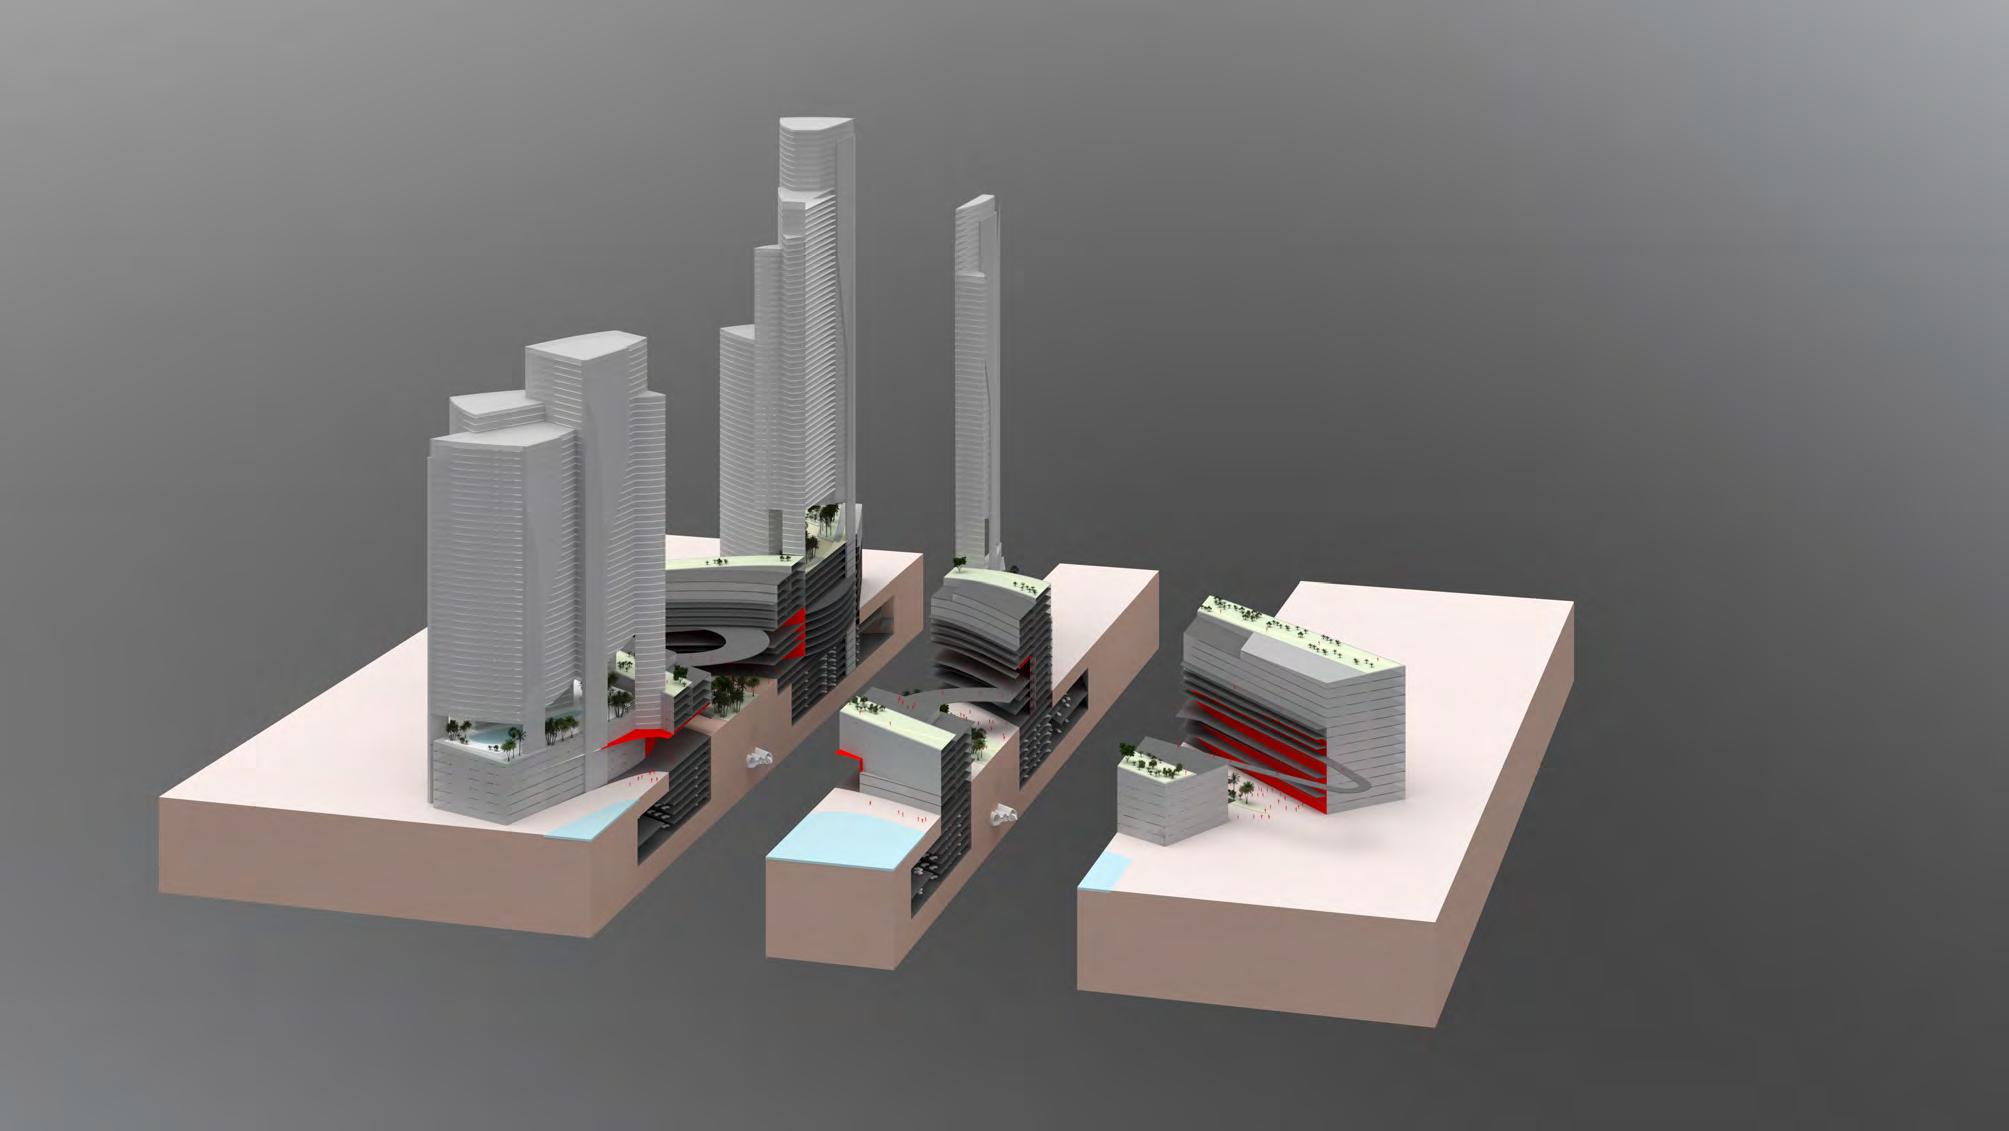
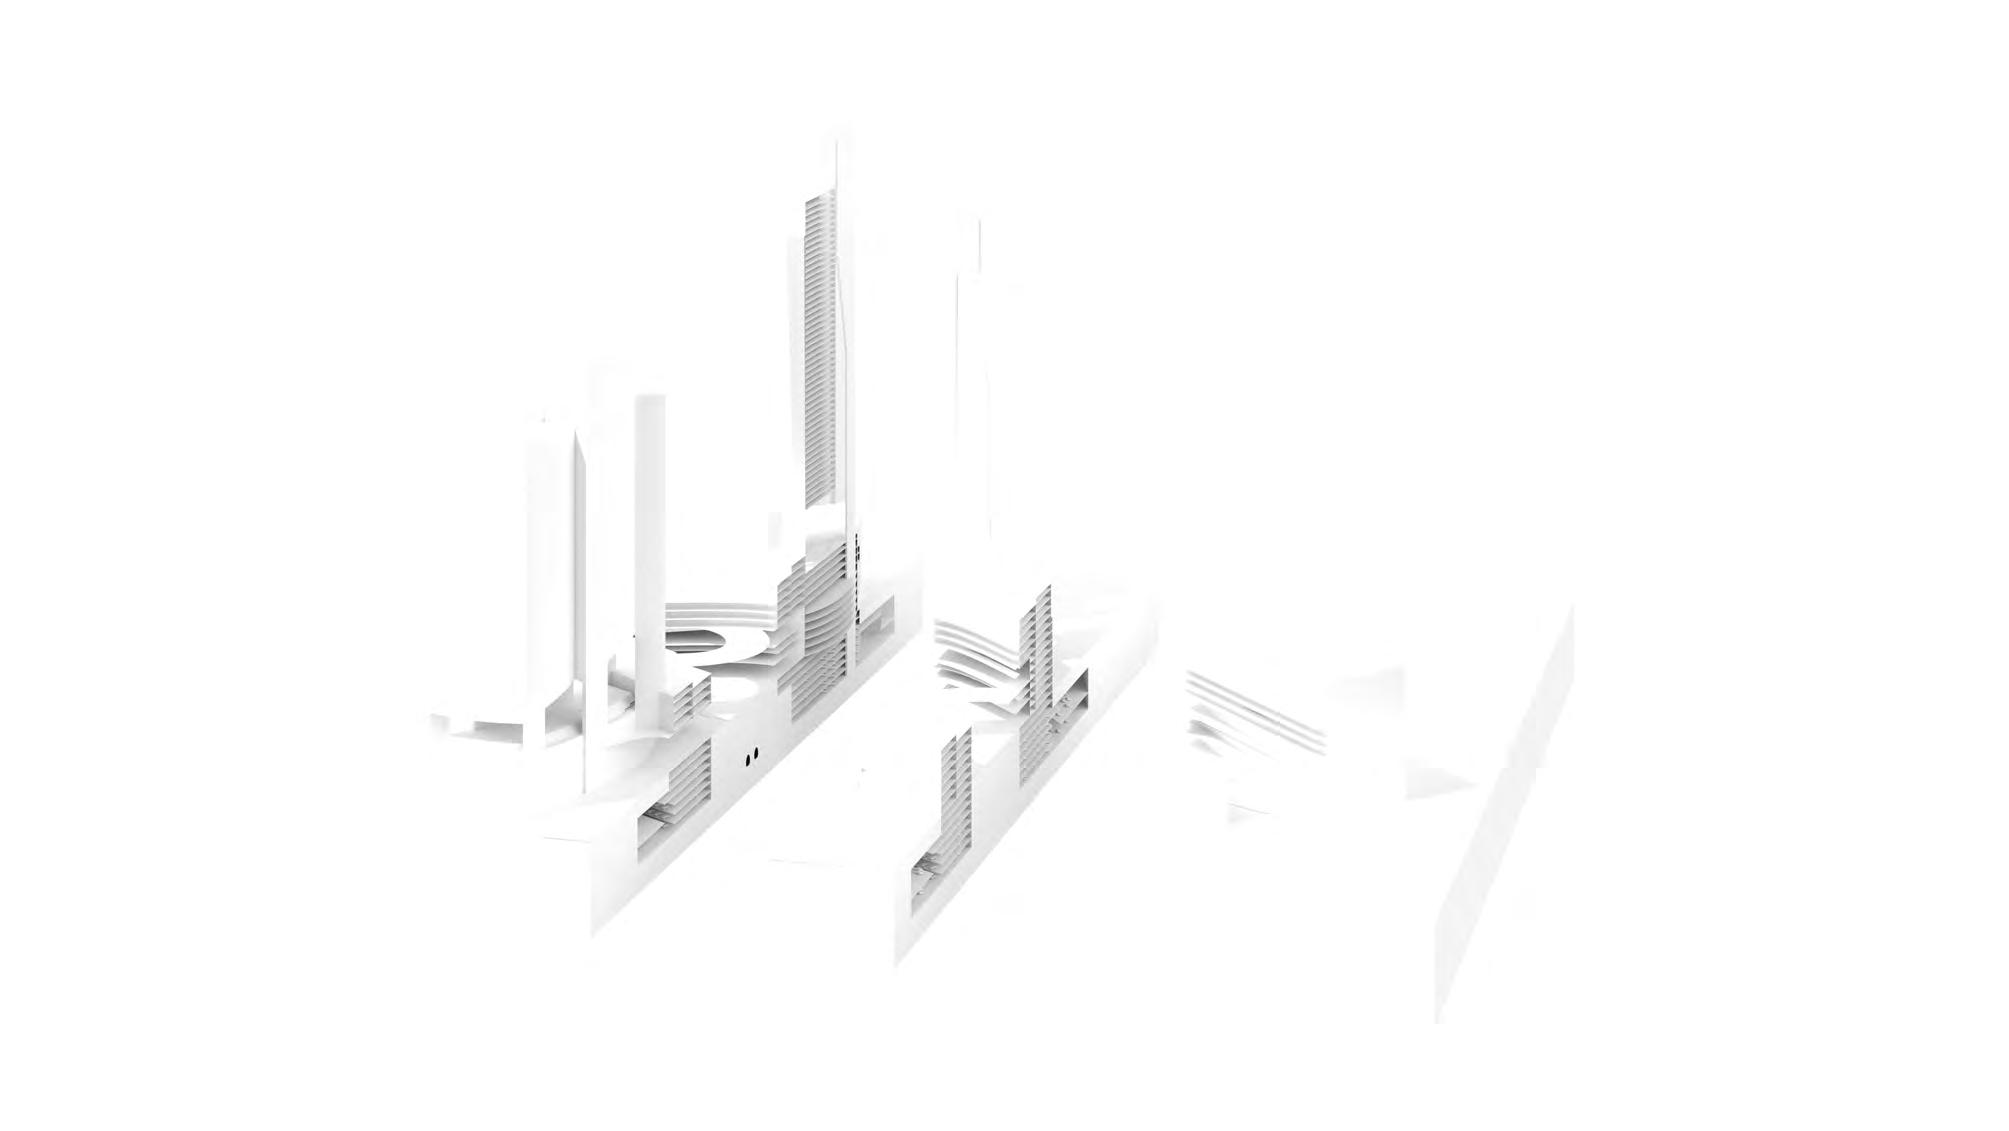
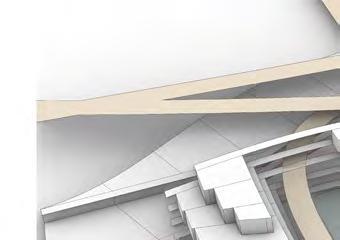
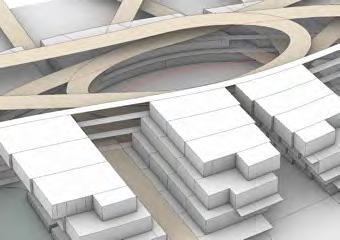
39 4 Design Development
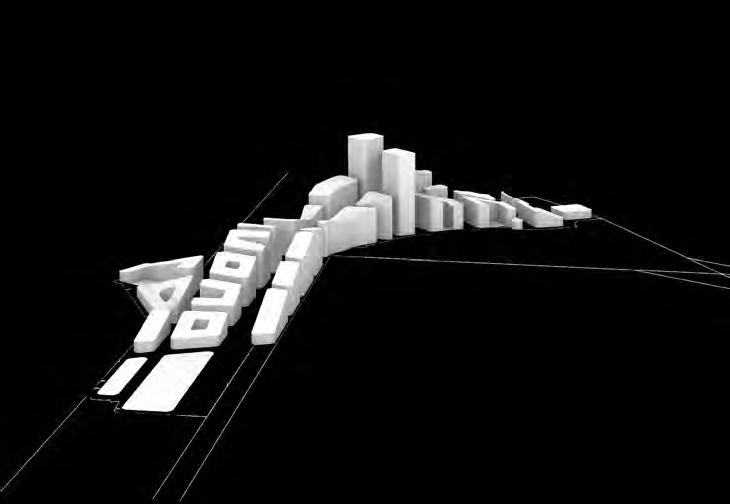
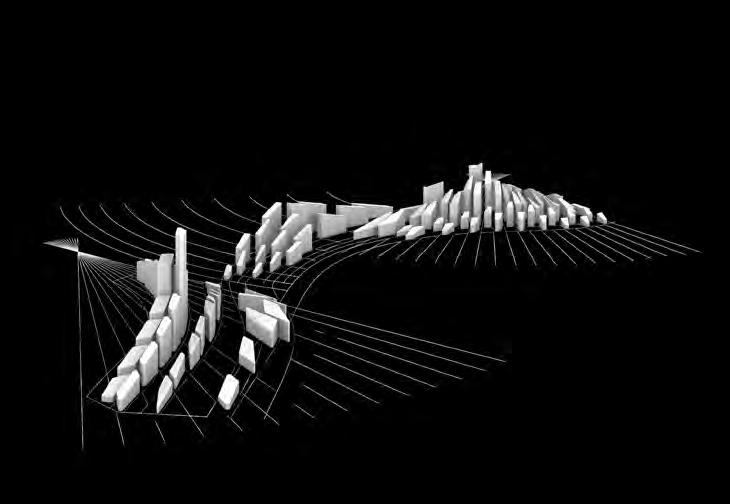
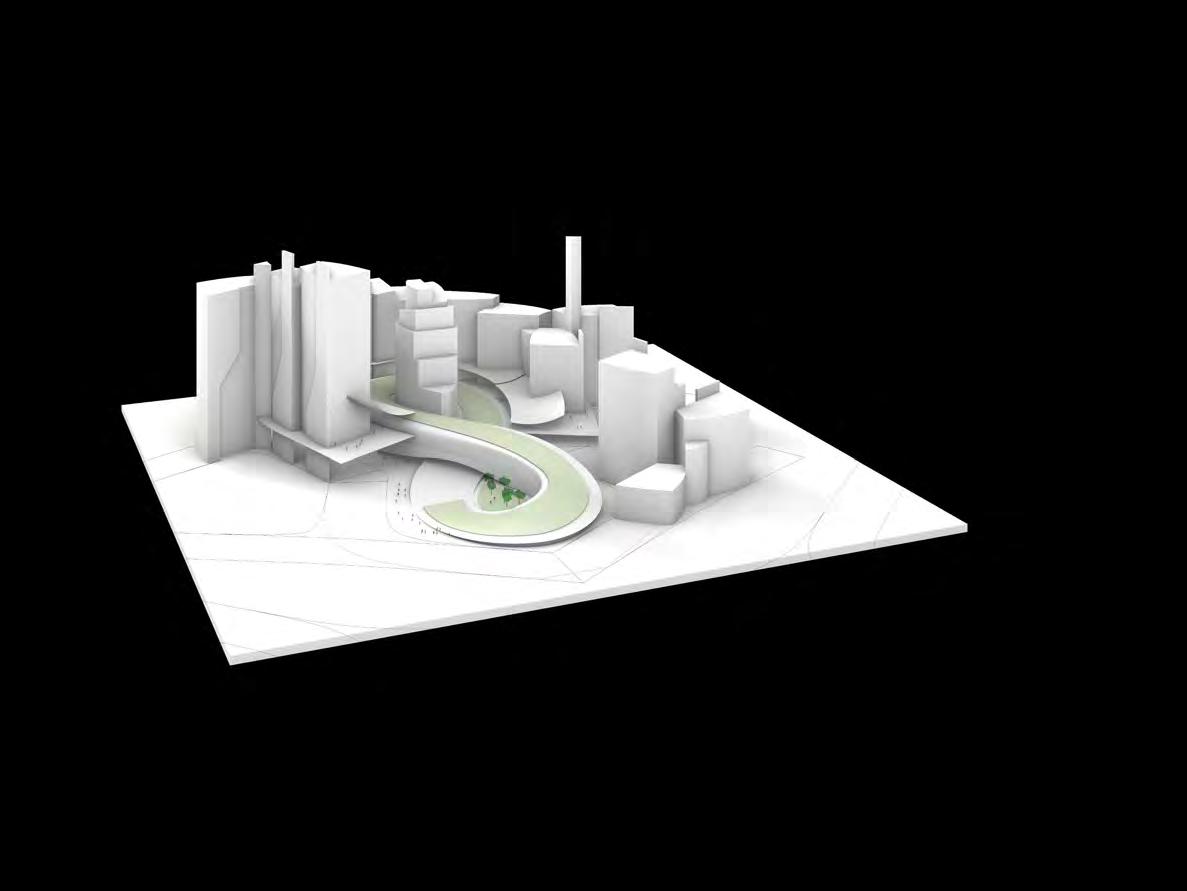
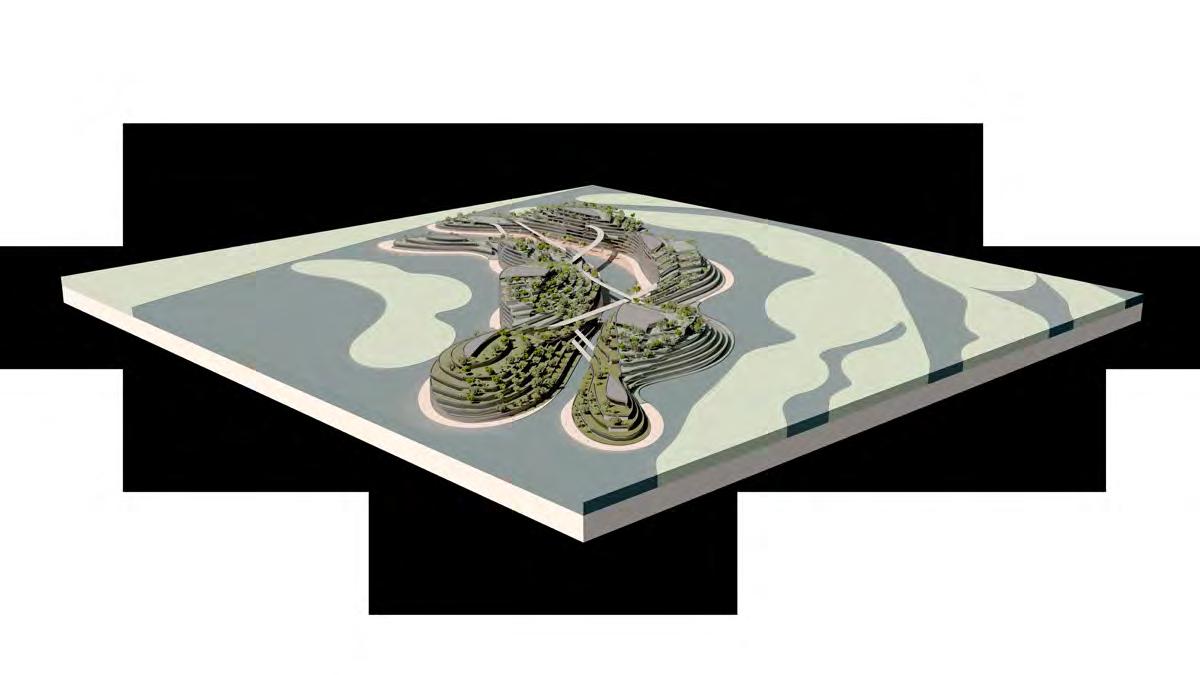
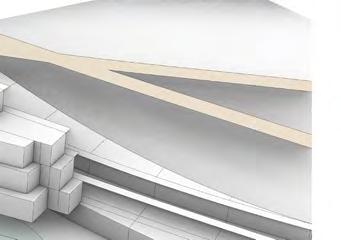
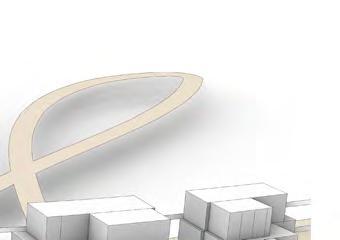
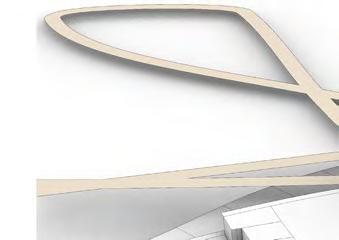
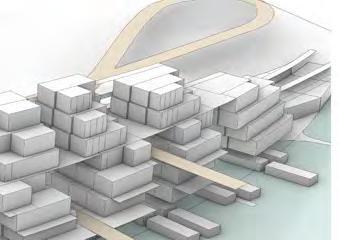
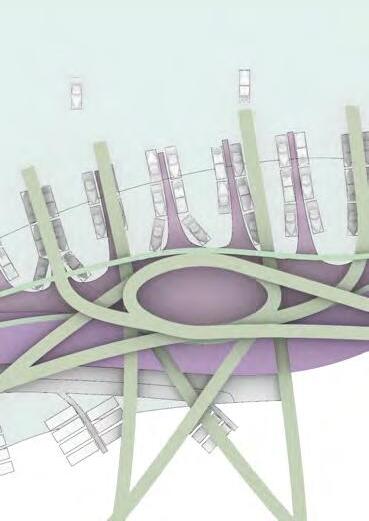
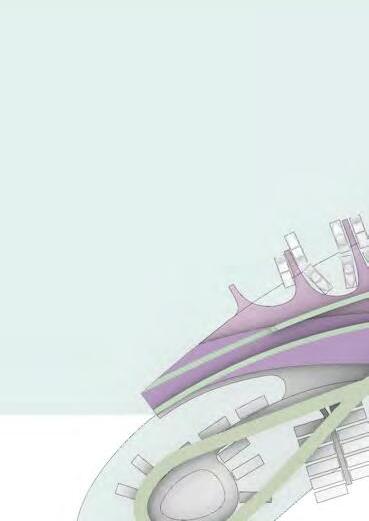
40 4 Design Development Parametric Urbanism - 4.1 Parametric UrbanismView towards the lagoon Oriented toward views; lagoon, urban opposite, ocean, Tin can island (sand banks) Progressive projections Transitions between elements (roads, rail) Existing industrial train line Road (major) Key: Road (minor) Site boundary Tower View towards the central business district accross the water View toward the ocean View toward the lagoon View projection


4 Design Development
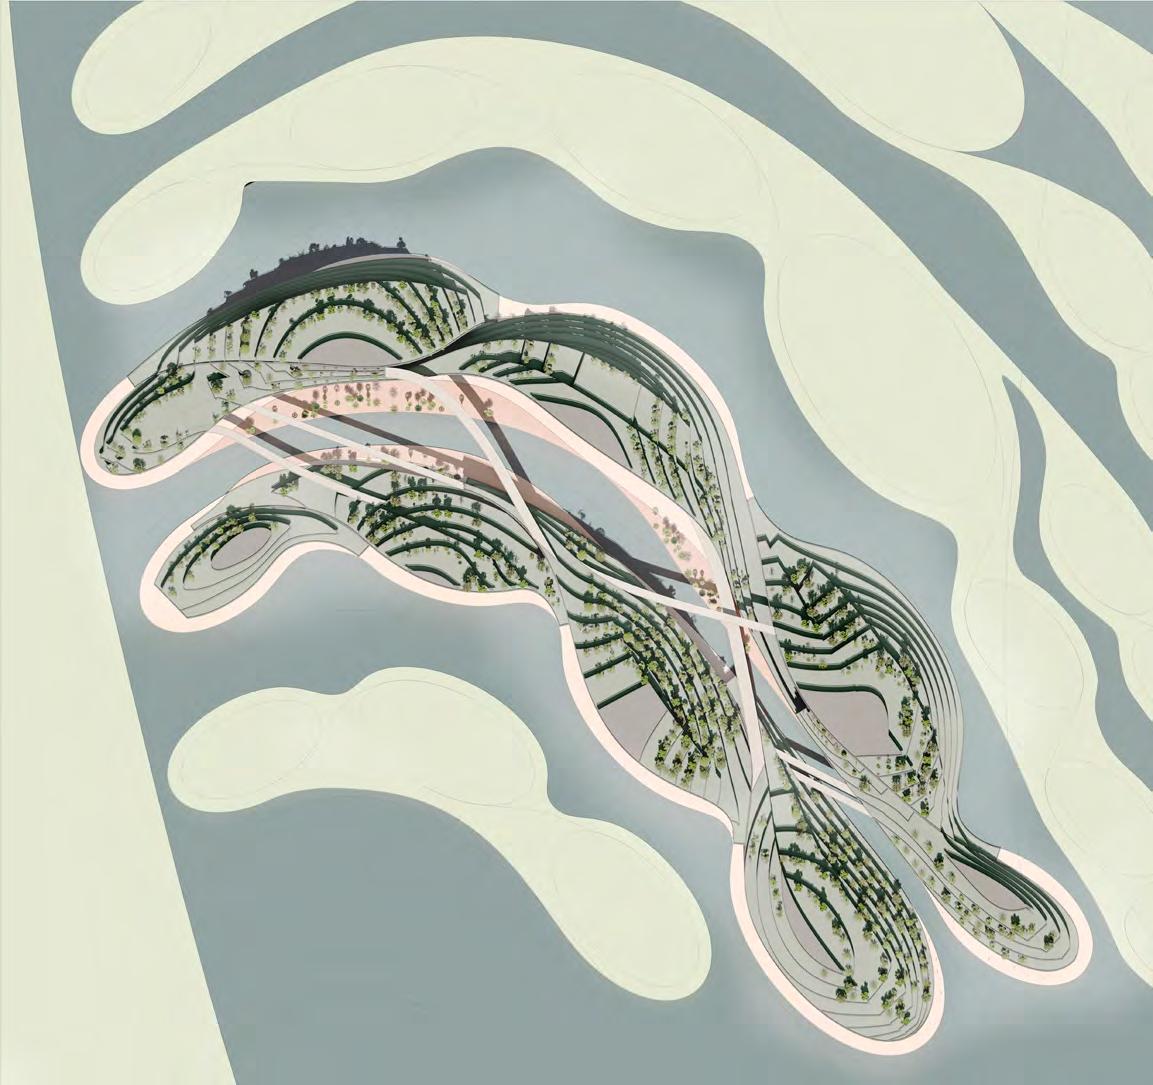
- 4.2 Transitioning land to lagoon Buildings on land Staggered grid type: Square grid type: Sine Simulation type (mixture of small + large) Origin: Square grid Input Input Origin: Ellipse size decreasing Ellipse size decreasing from the land boundary to the lagoon (large to small) Primary pattern Primary pattern Primary pattern Primary pattern Primary pattern Primary pattern Origin: Ellipse size decreasing Increased number of large ellipse compared to small ellipse. Distance between ellipse increased to accomodate Origin: Ellipse size decreasing Distance between ellipse has been incresed plus more of a gradual ellipse size change Origin: Ellipse size decreasing Sine type to give variation Distance between has been incresed plus more of a gradual ellipse size change Origin: Ellipse size increasing Distance between has been incresed plus more of a gradual ellipse size change Origin: Ellipse size increasing Ellipse size decreasing from the land boundary to the lagoon (large to small) Ellipse size increasing from the land boundary to the lagoon (small to large) Output Input Output Gaussian type (wave comprising large to small repeating) Origin: Staggered grid Bezier type (Gradual fade large to small) Origin: Square grid Sine Simulation (Condensed) Origin: Staggered grid
Transitioning Land to Lagoon
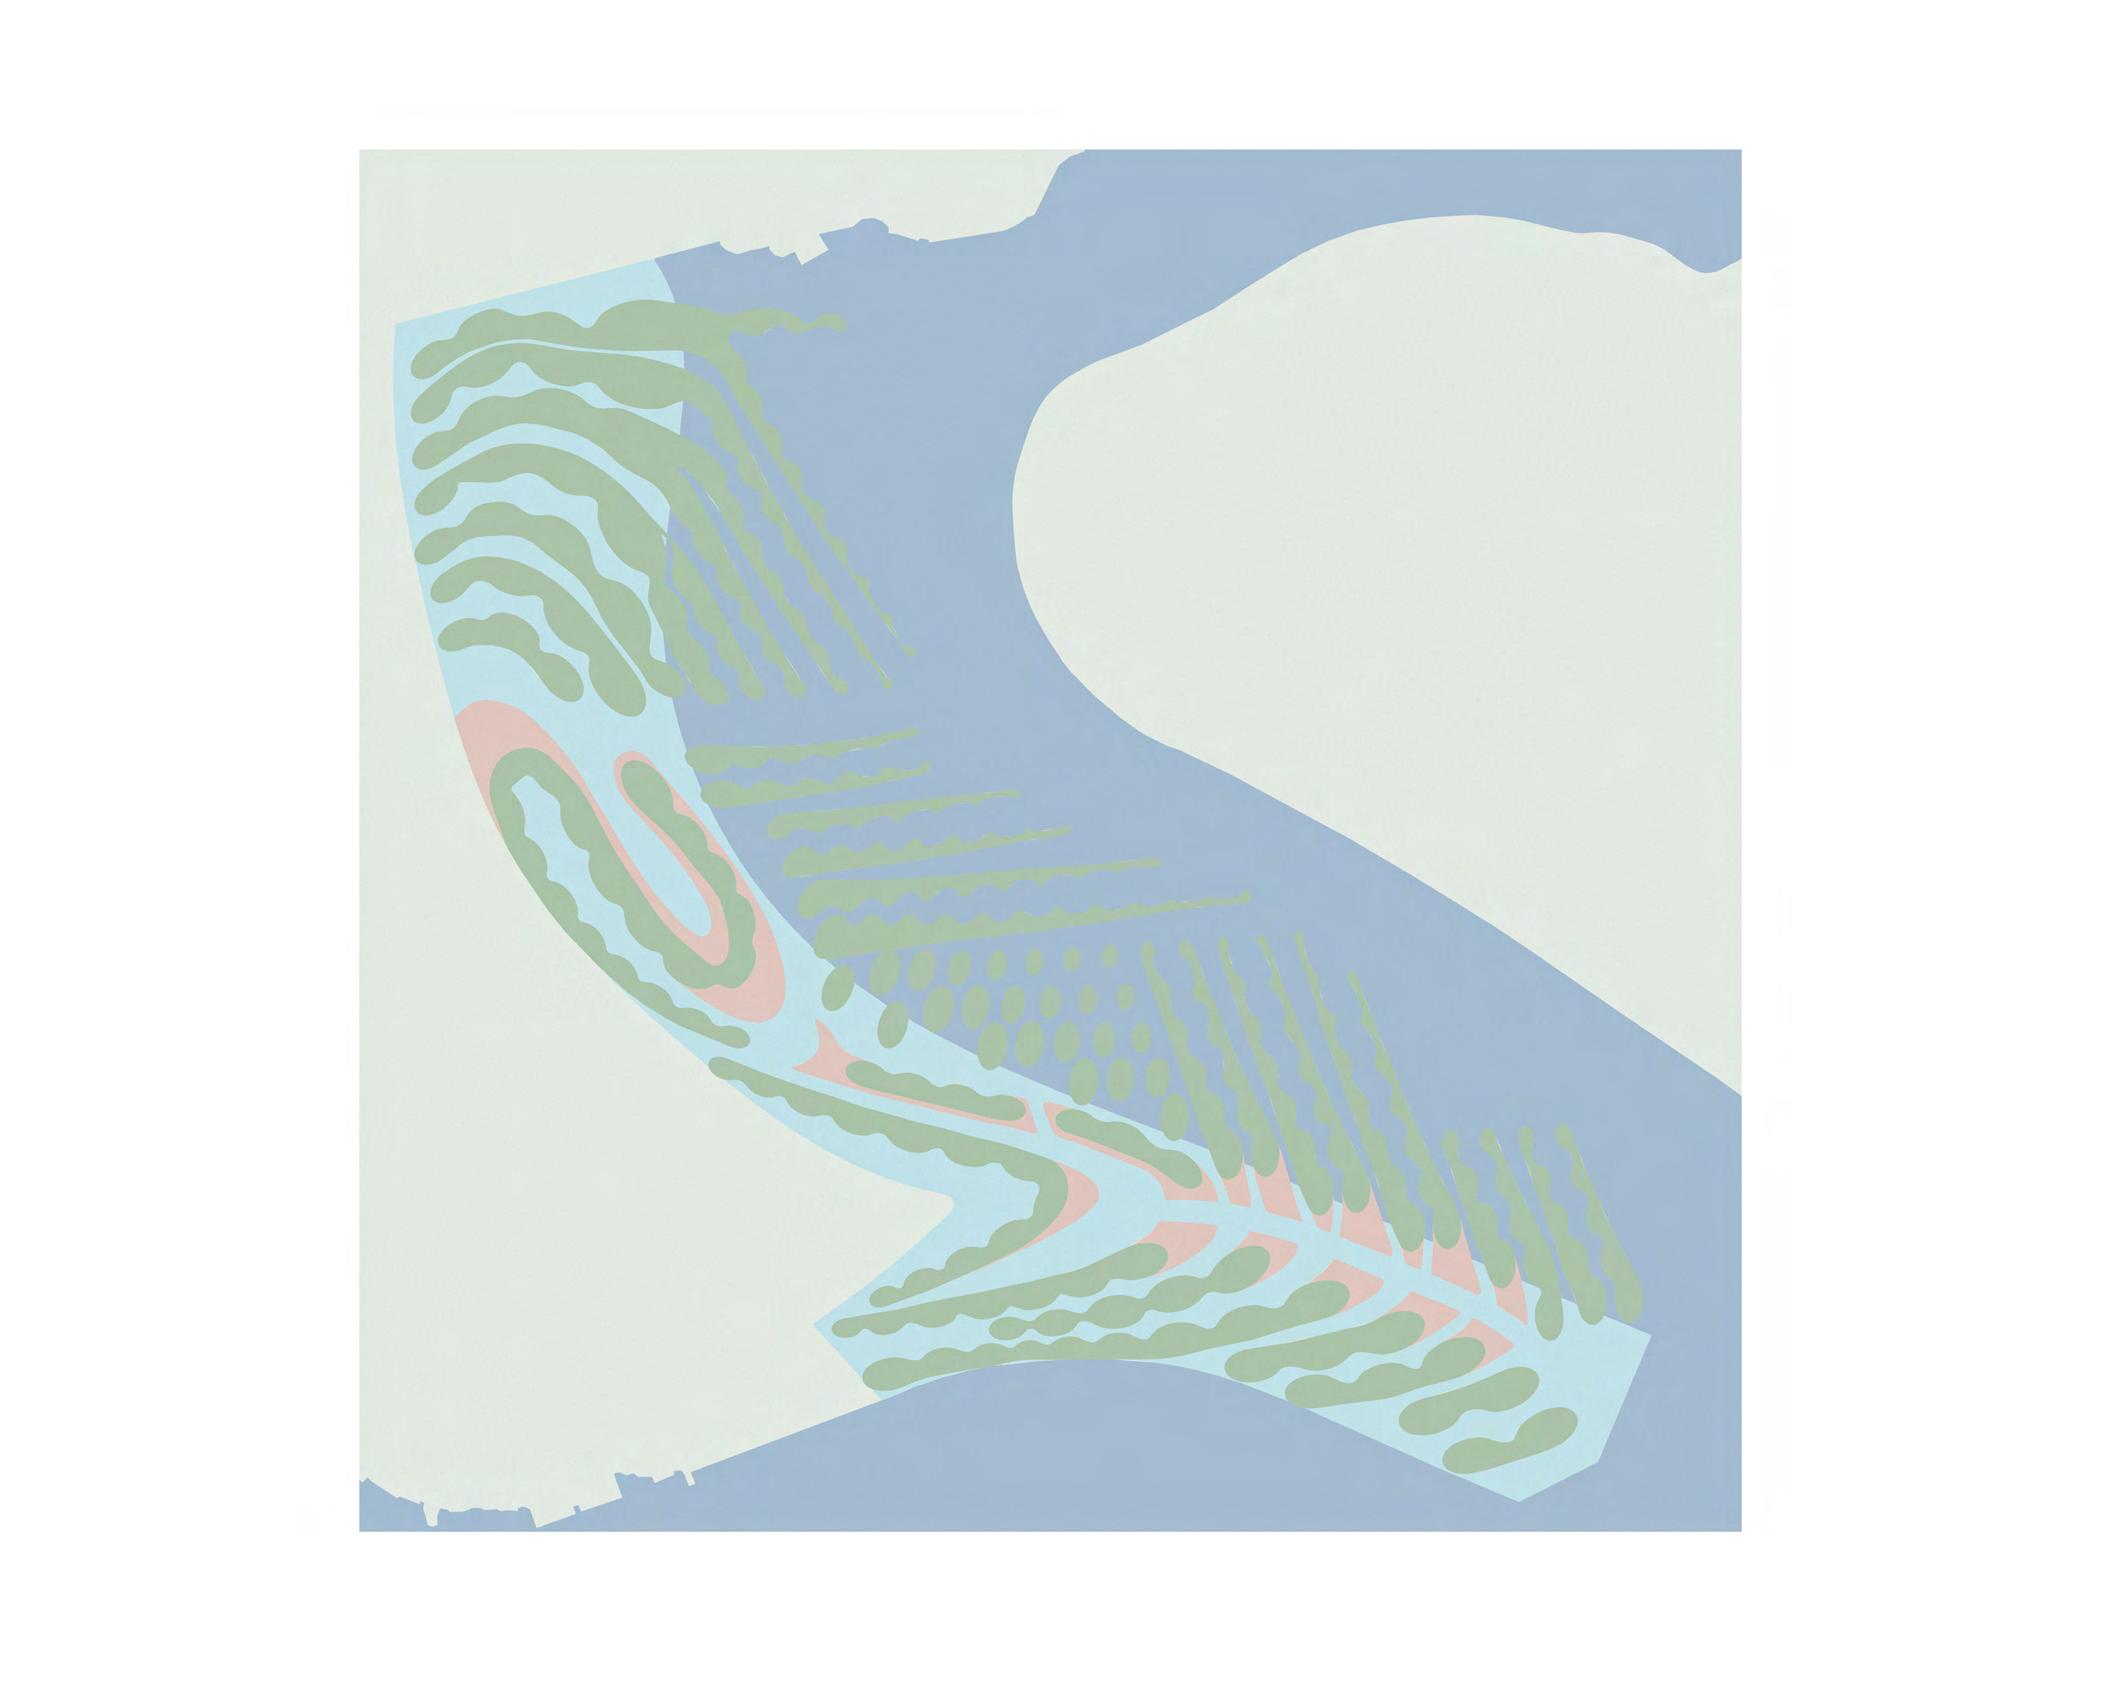
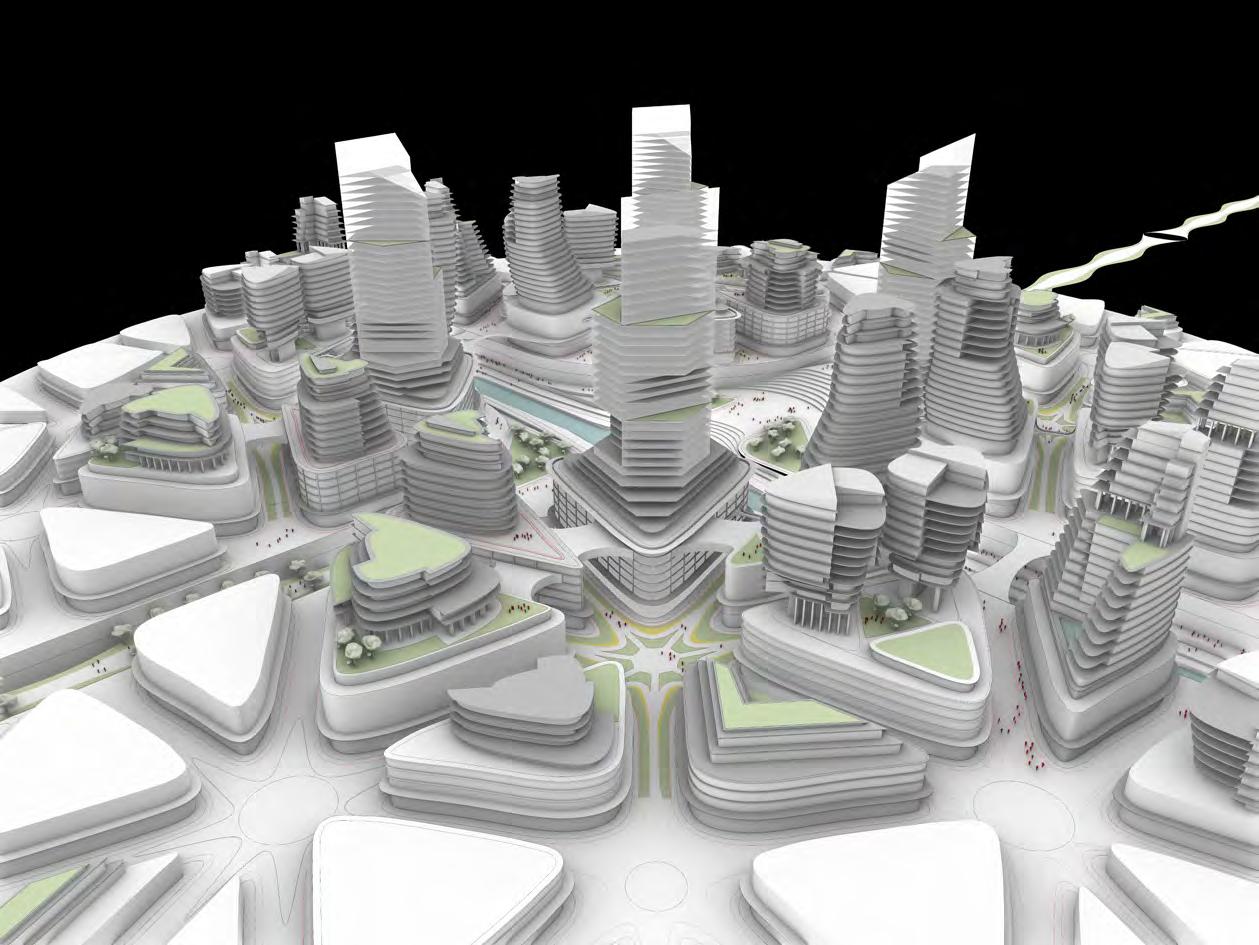
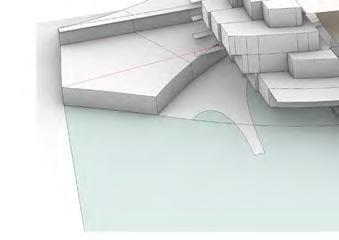
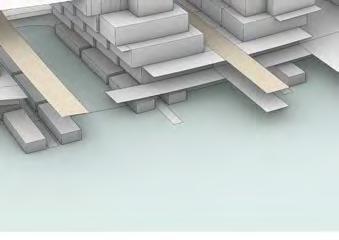
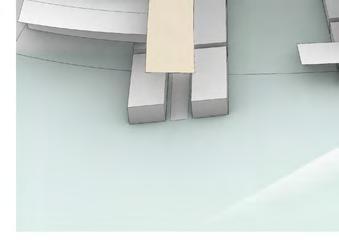
42 4 Design Development Masterplan - 4.3 Existing site and context Focus site Proposed patterns Proposed ellipse pattern transitioning the land and the lagoon 0.0 Grid: 4 KM x 4 KM Grid cells: 500 meters x 500 meters 0.5 1.0 1.5 2.0 2.5 3.0 3.5 4.0 0.0 0.5 1.0 1.5 2.0 2.5 3.0 3.5 4.0 New lagoon (previously land) New islands and canals Masterplan Existing land Ellipse pattern Lagoon Proposed pattern lines
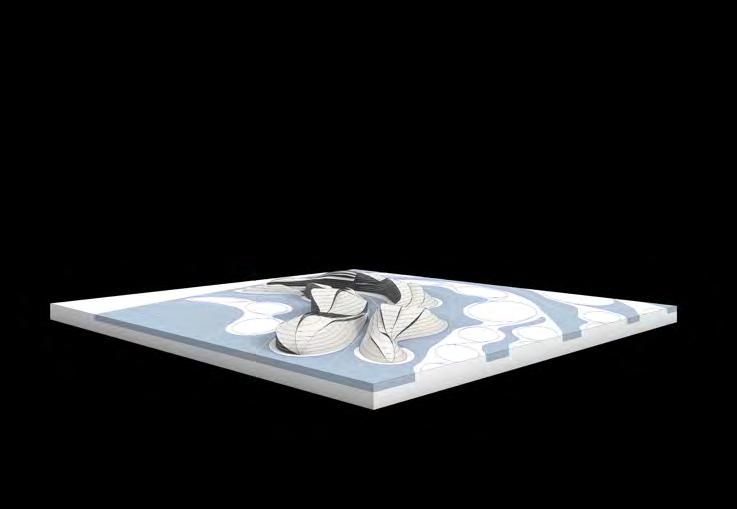
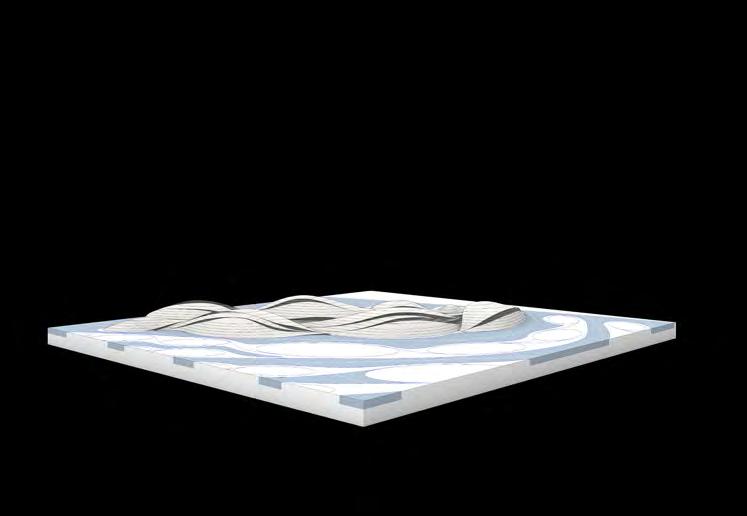
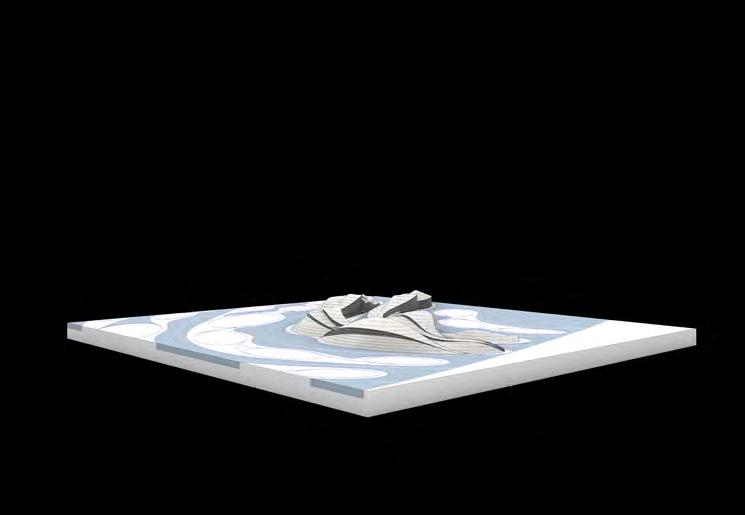
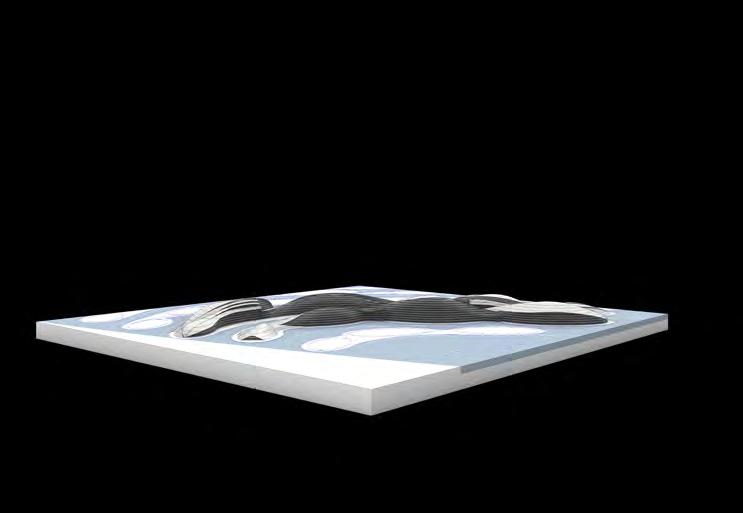
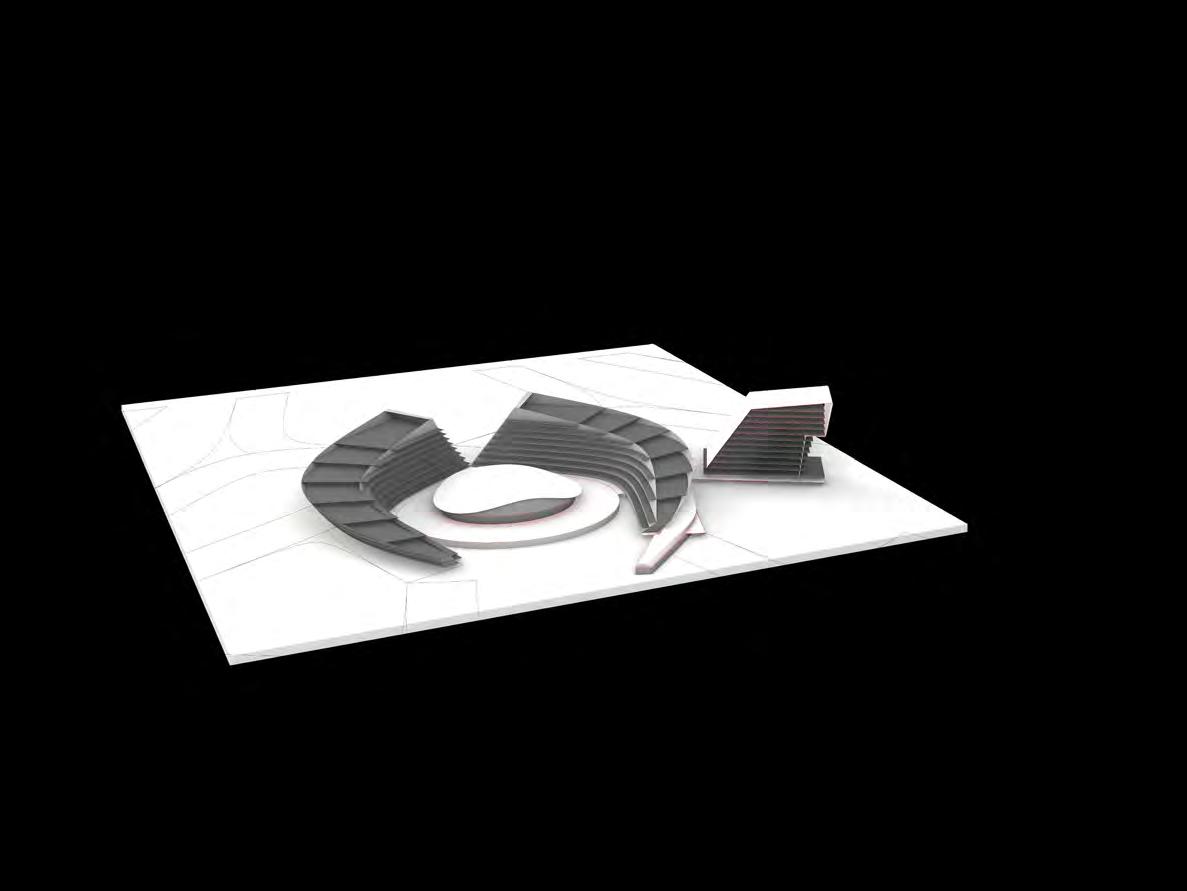
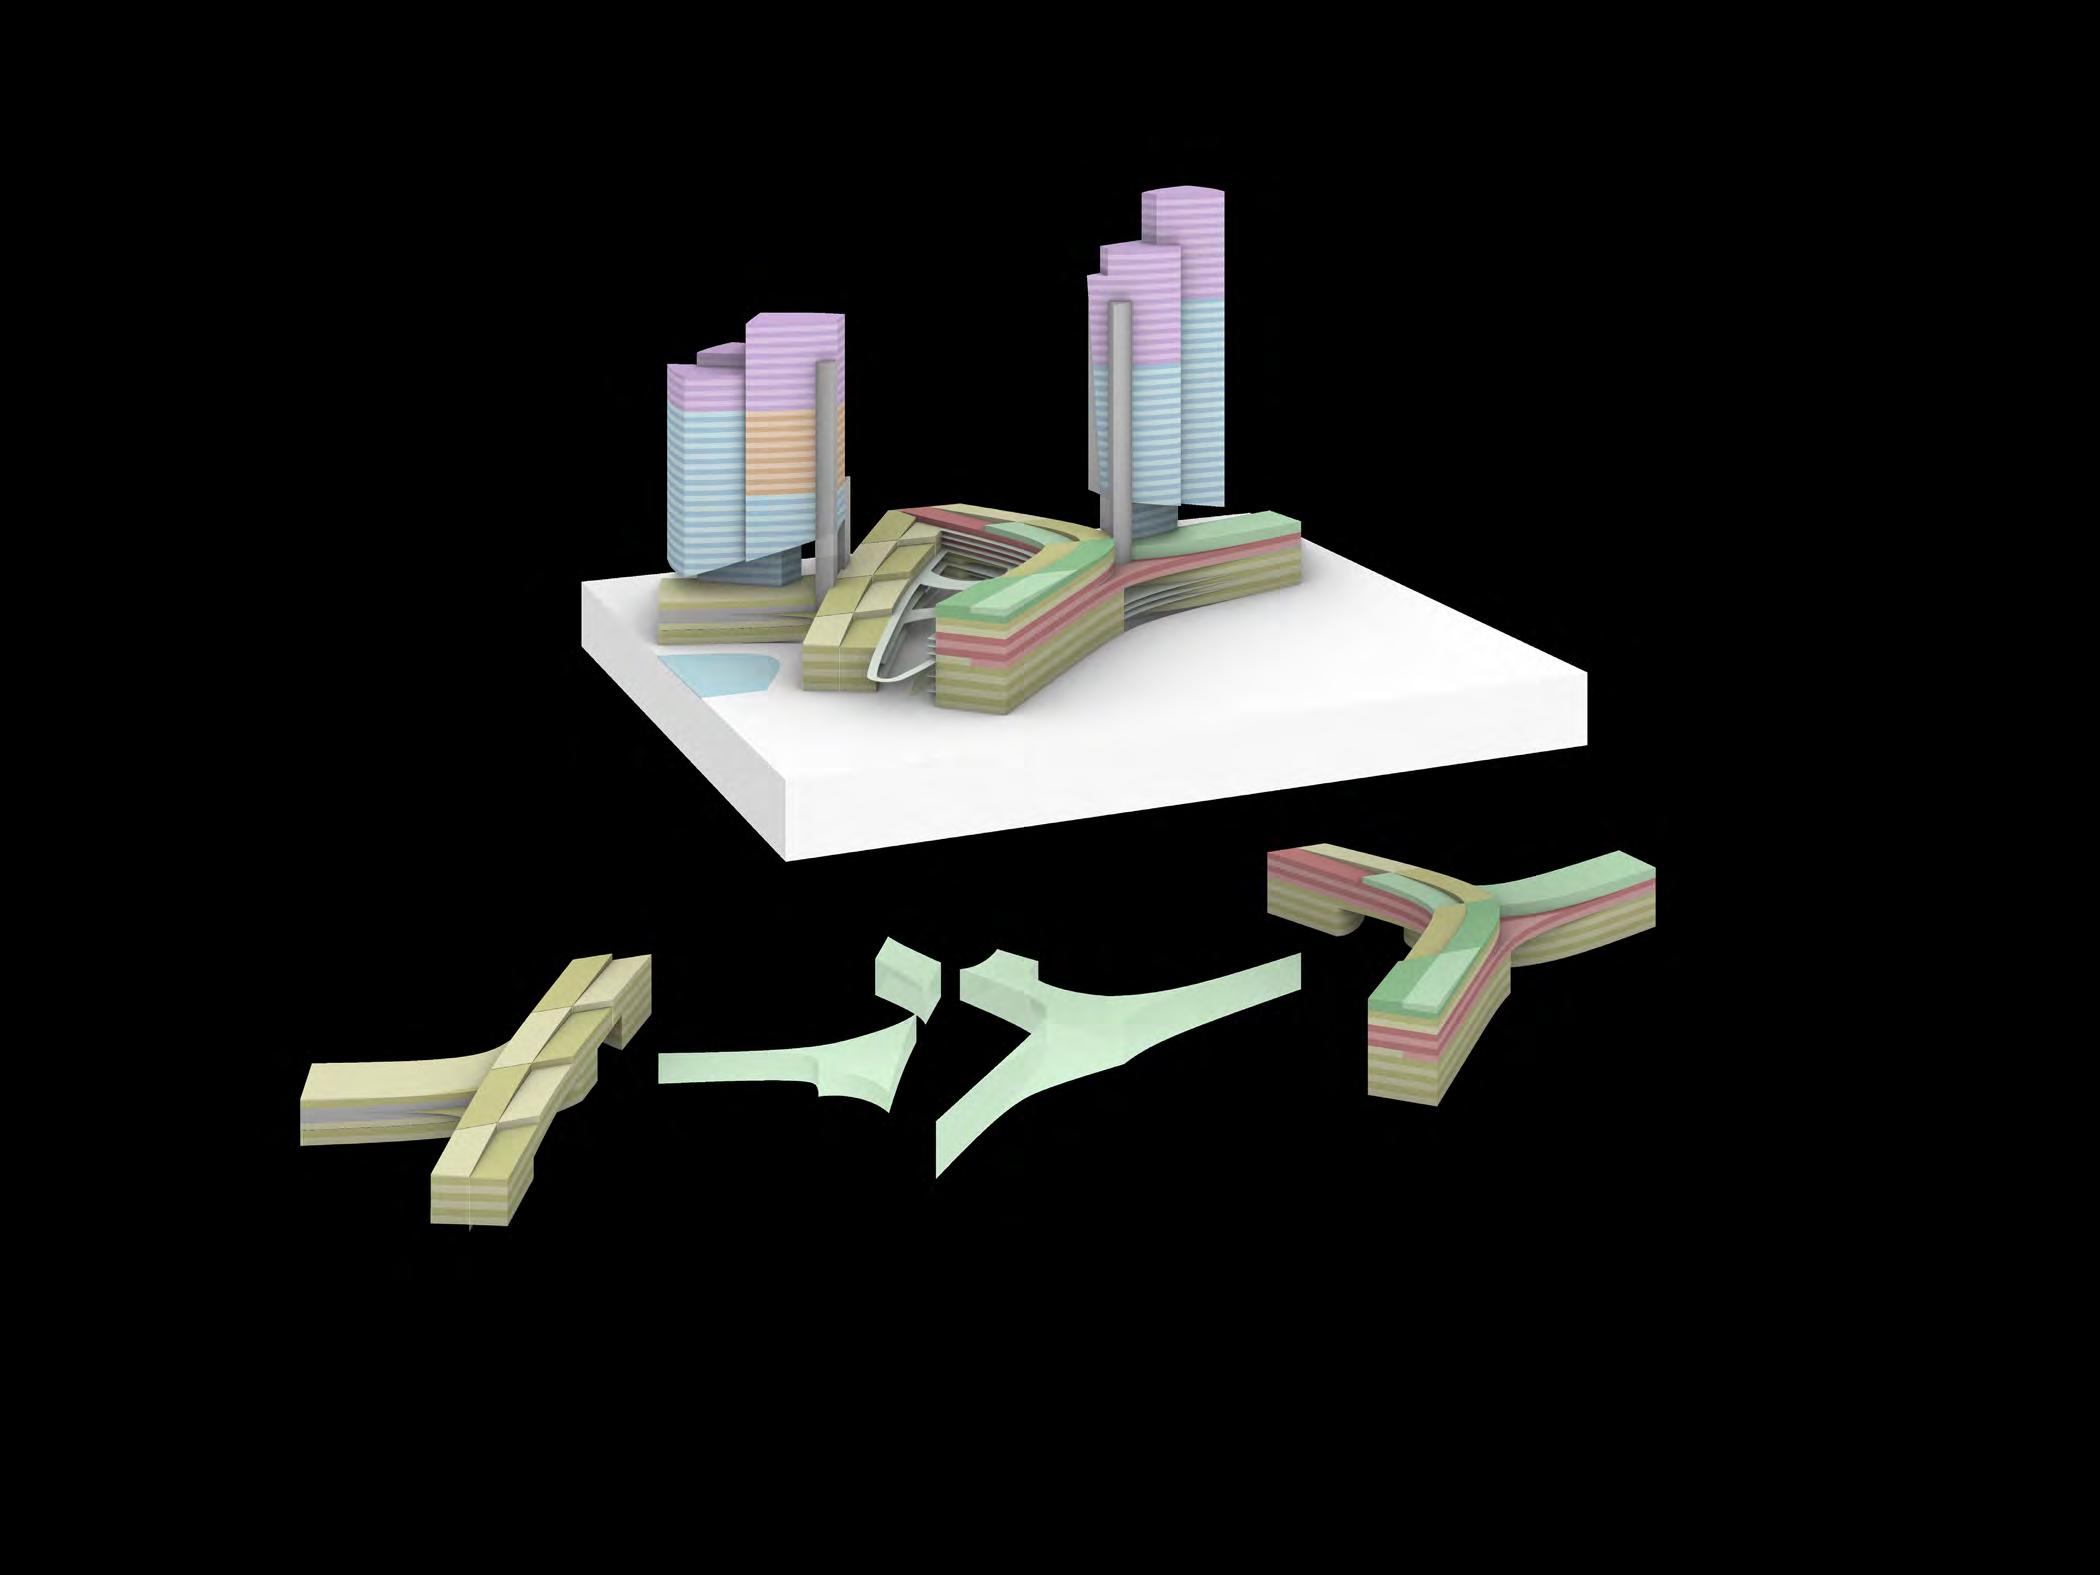
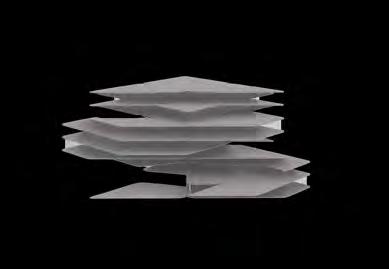
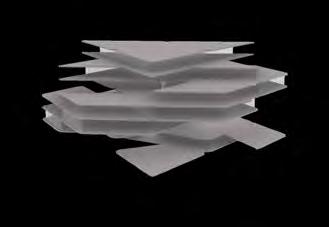
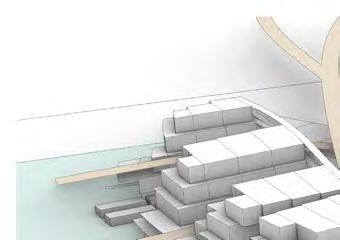
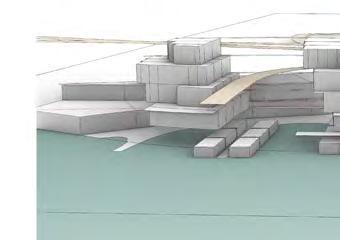
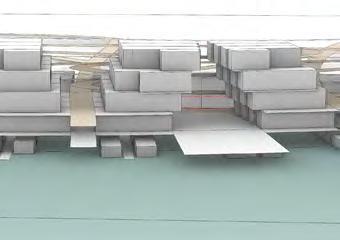
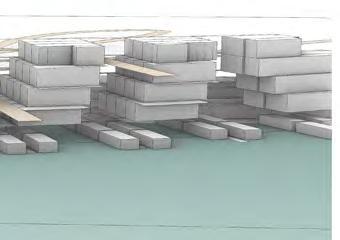
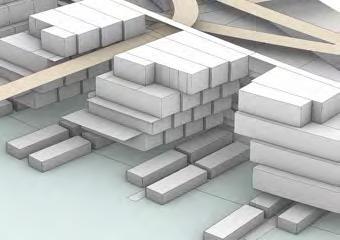
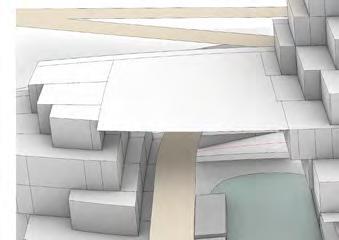
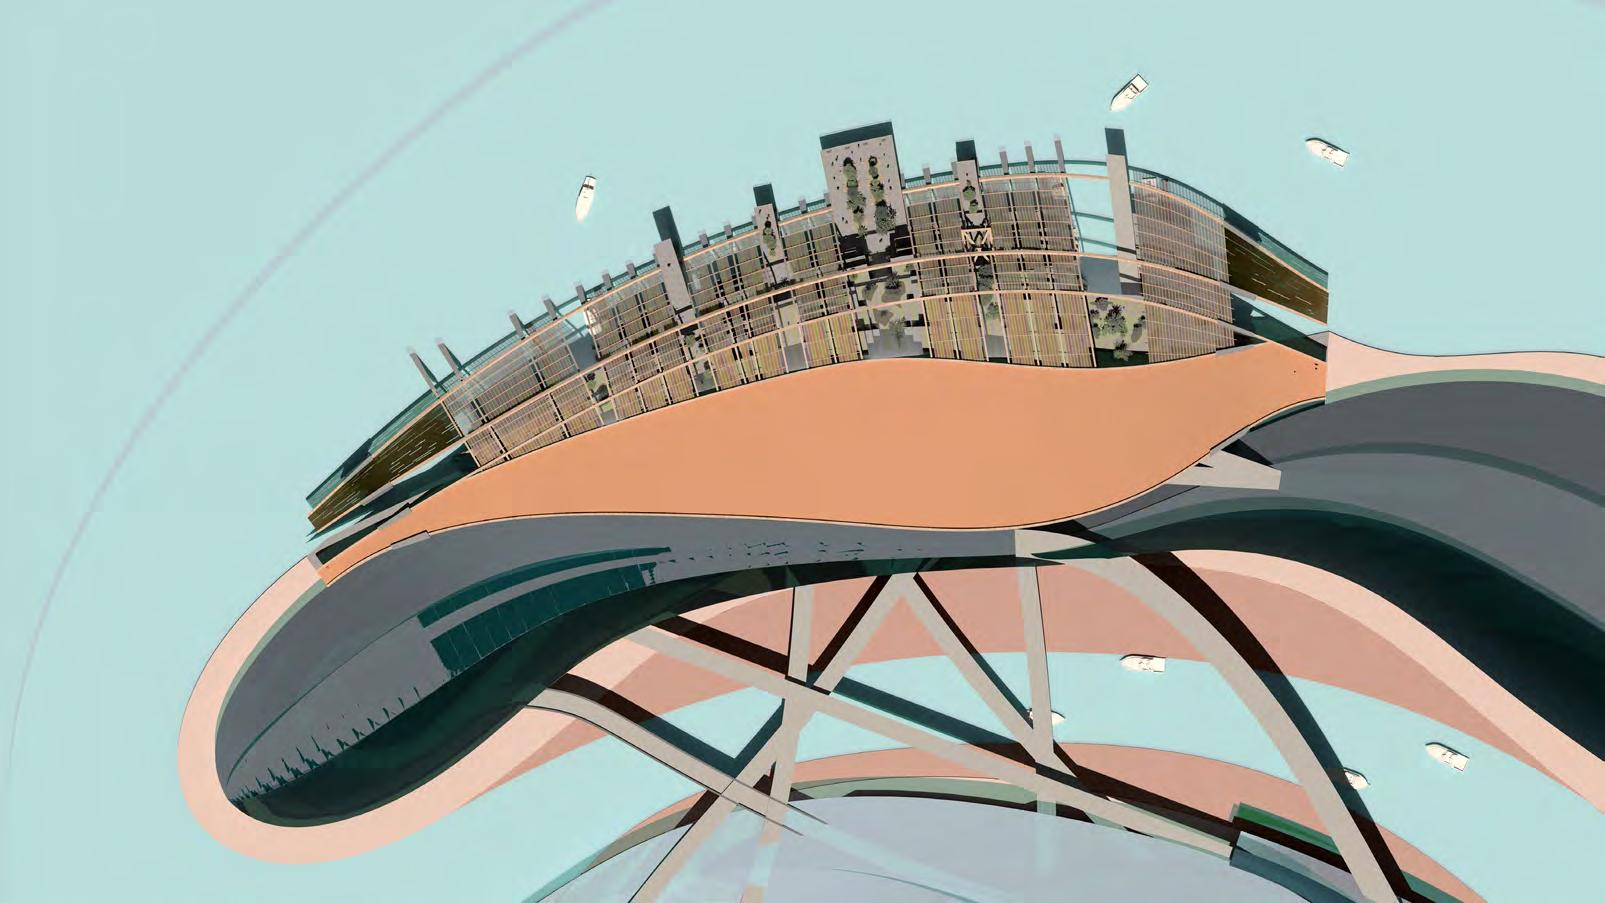
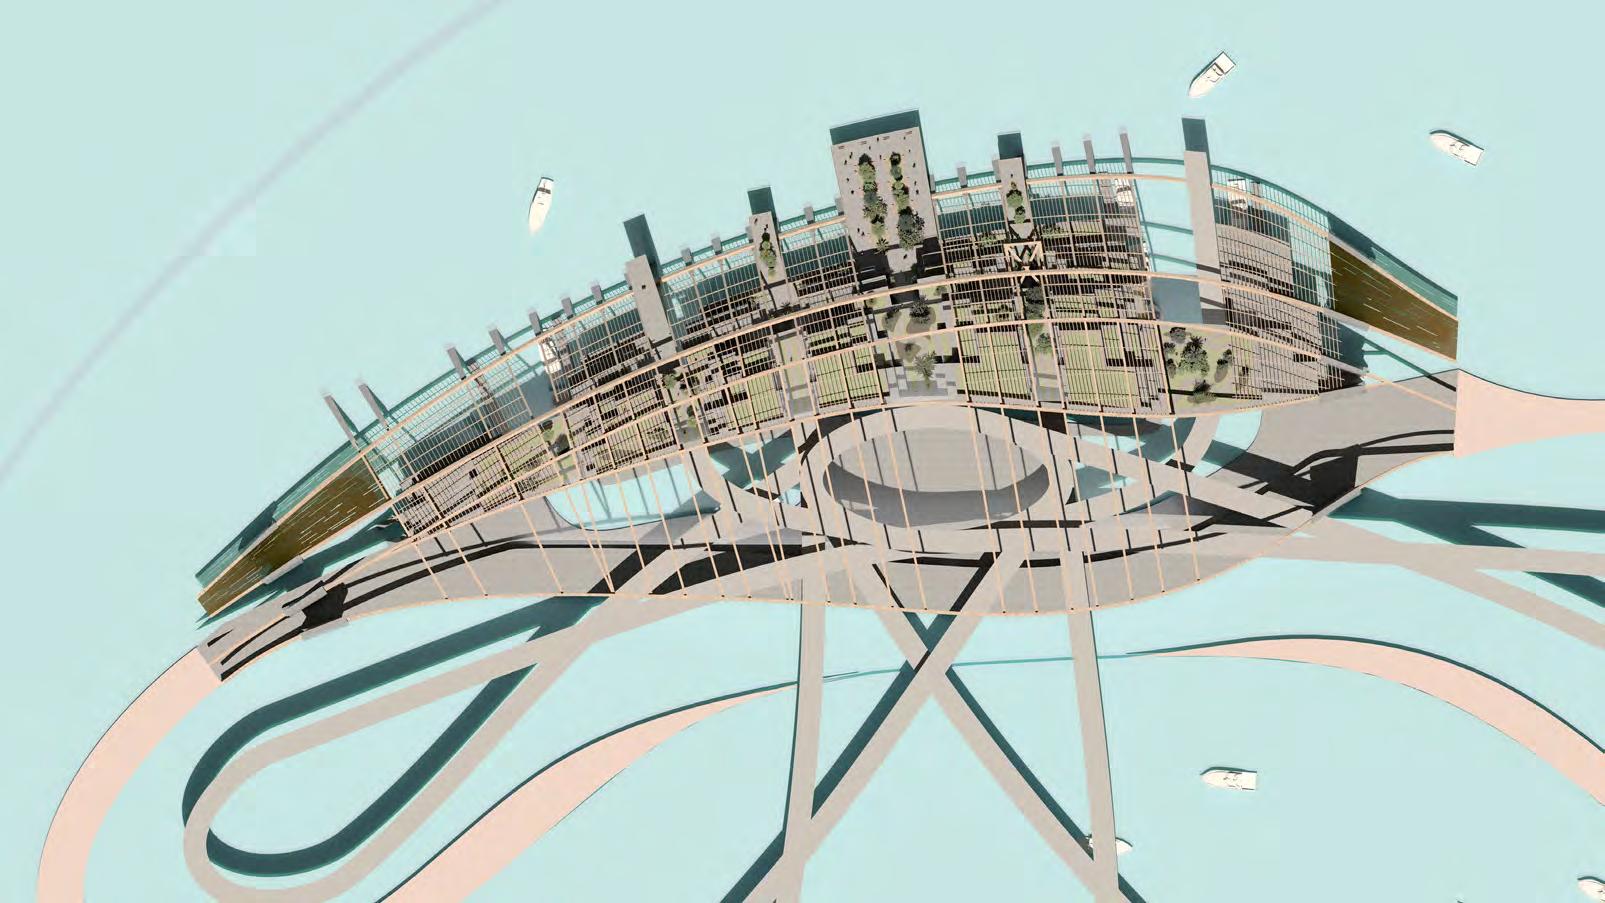
43 4 Design Development Developing Segment of Masterplan Shells 4.4 Shells View 1: View 2: View 3: View 4: View 5: View 6: View 7: View 8:
Floor Plates from Shells - 4.5
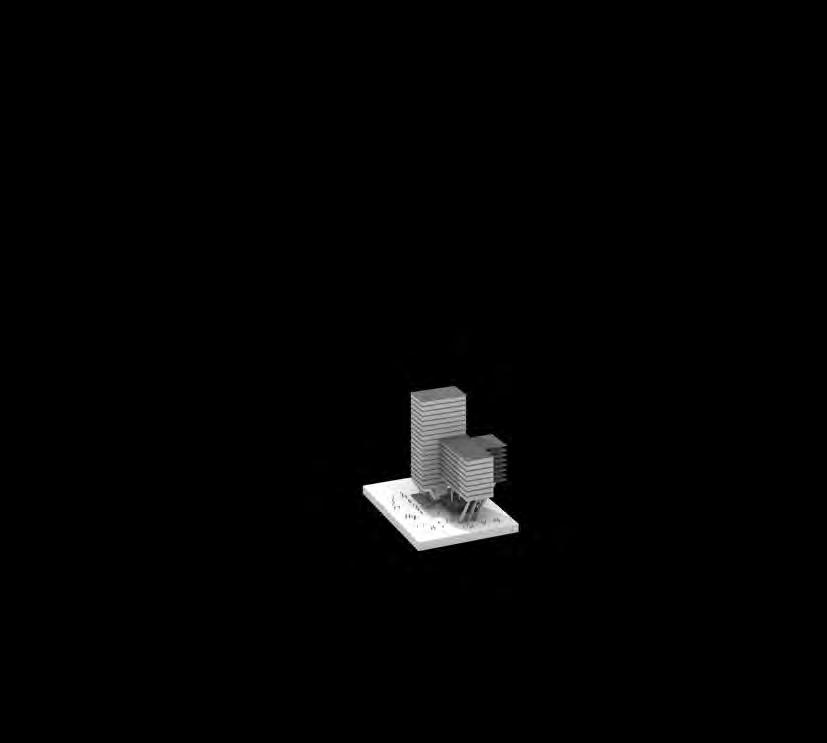
Design Development 5 Fragment
Aerial of floor plates
Axo 2 of floor plates looking West
Axo of floor plates looking East showing the islands
Floor plates from Shells - 4.6
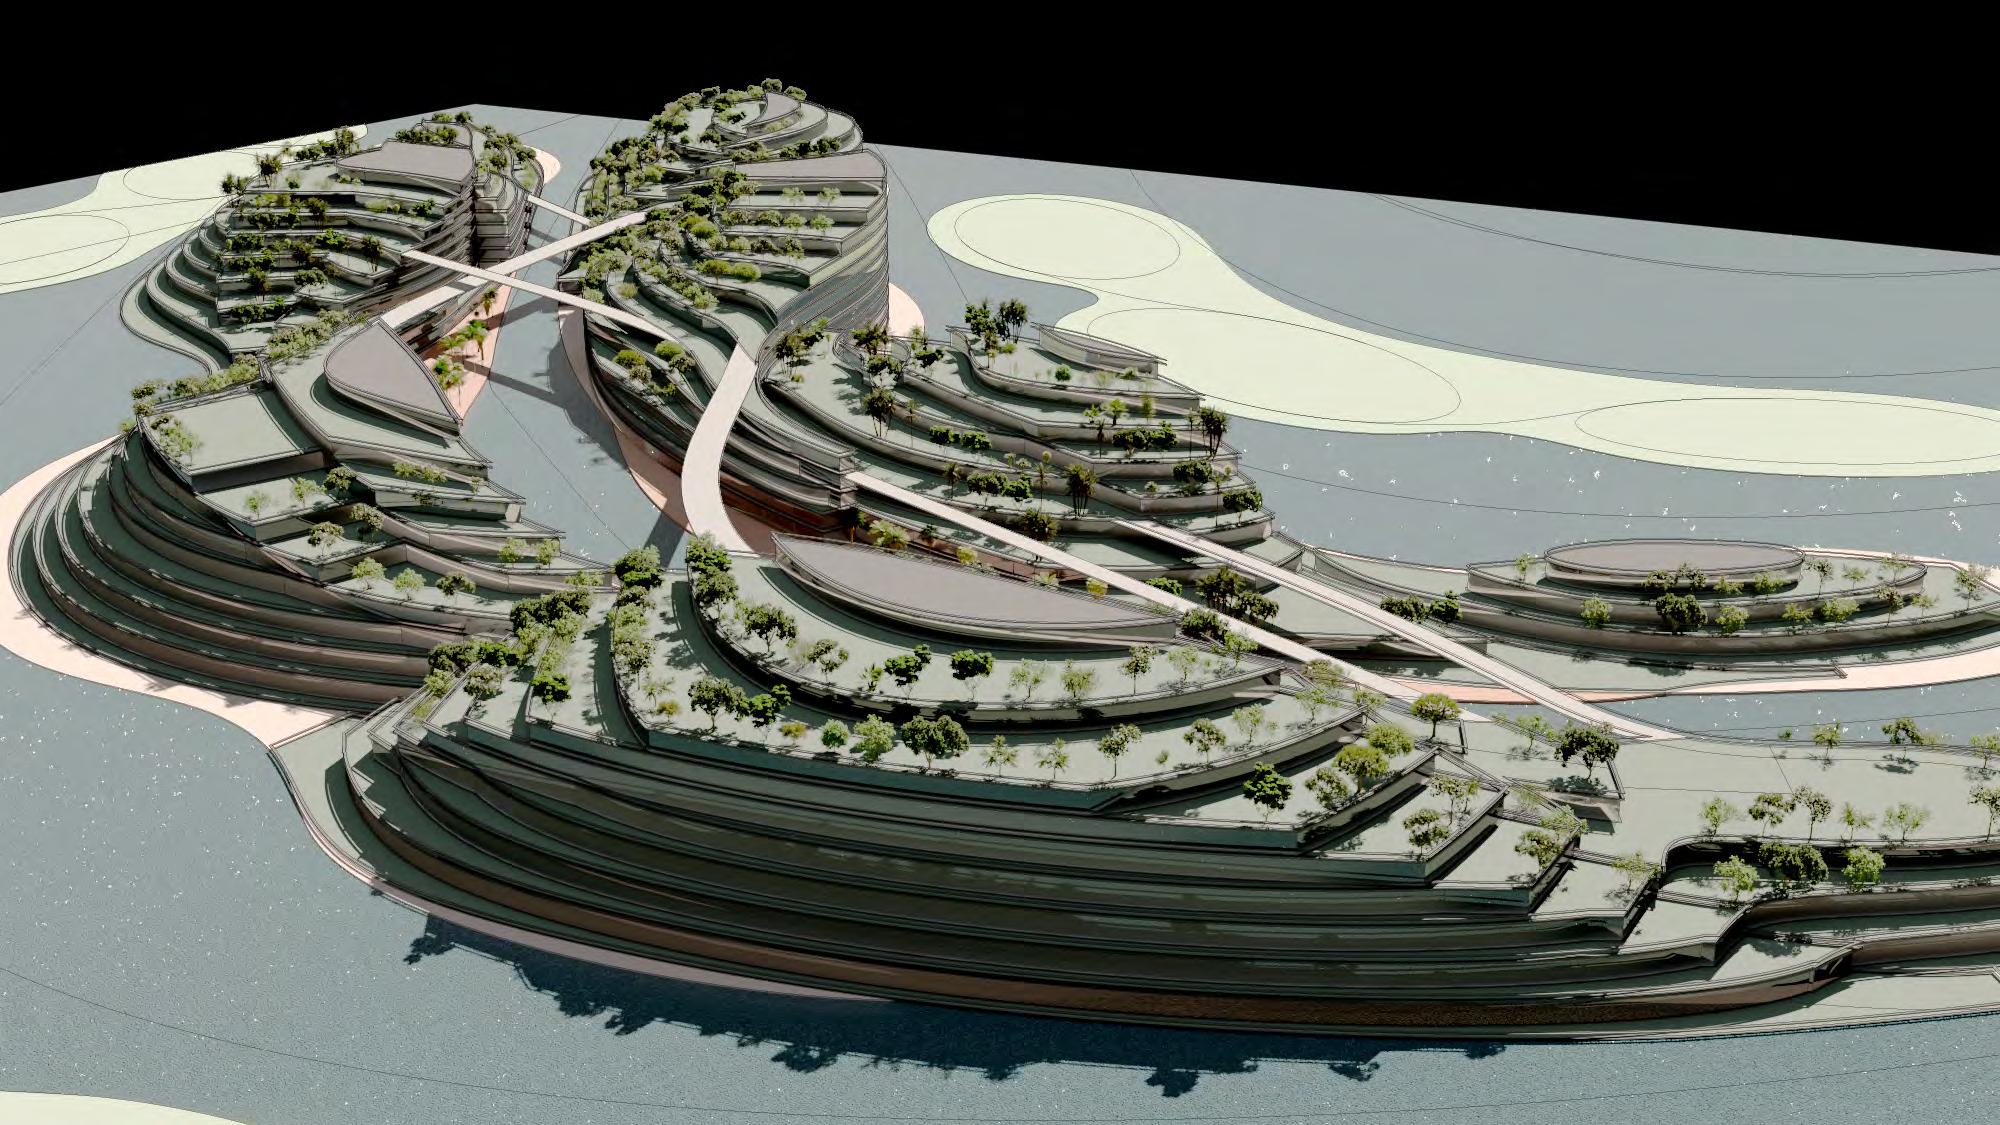
45 Design Development 5 Fragment
46 4 Design Development Fragment Floor Plates from Shells - 4.7
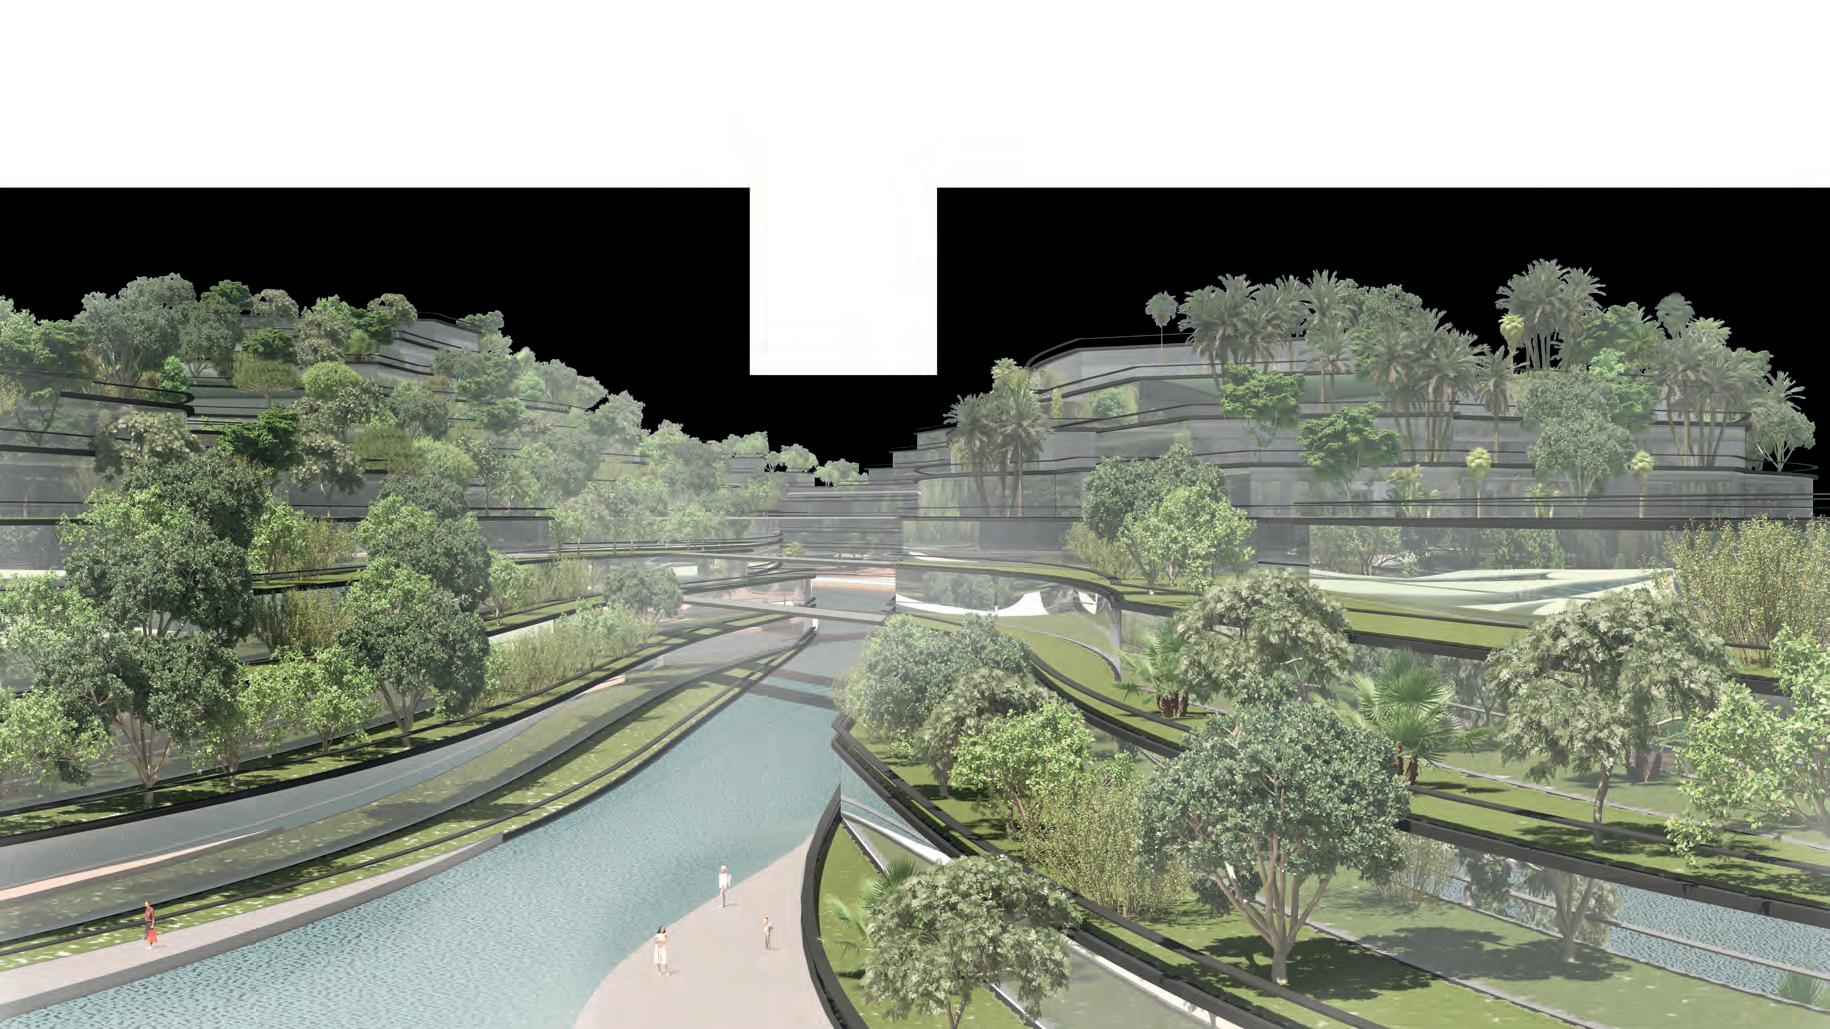
View 3 showing promenade below and upper level circulation
View 2 showing promenade below
View 1 roof terrace and promenade below


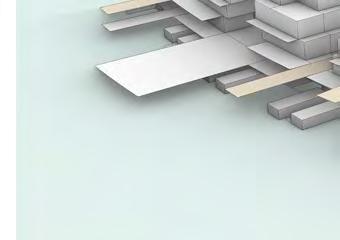


47 Design Development 5
4.8
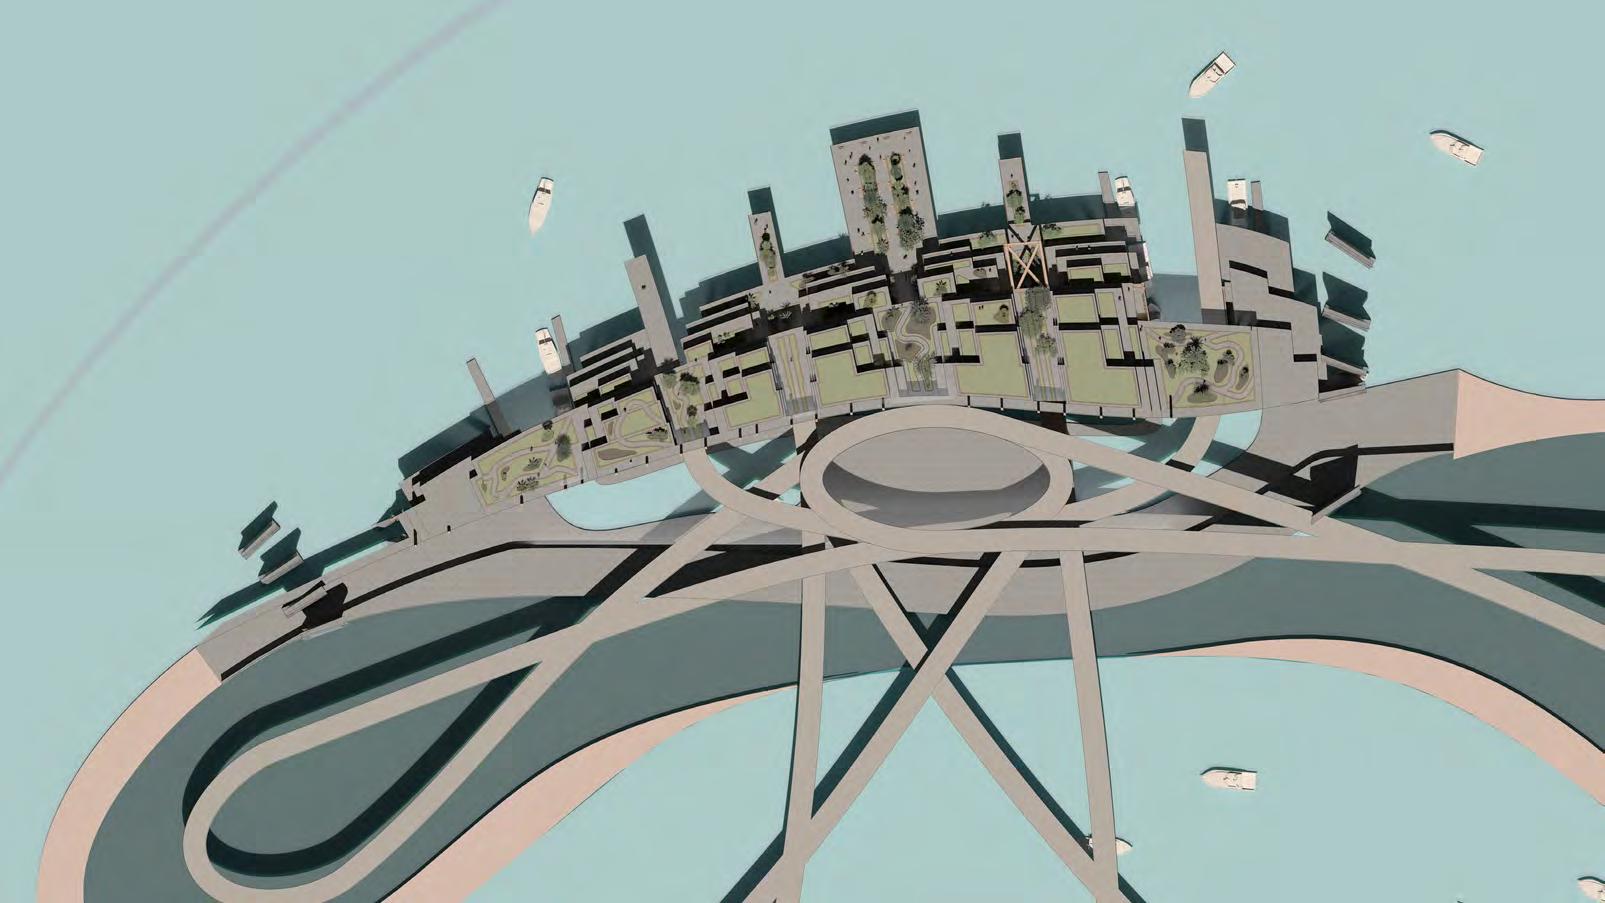
Dividing Floor Plates; Accommodation Iterations Iteration A


48 Design Development 5 Dividing
Iteration B 4.9
Floor Plates; Accommodation Iterations
Top floor plan and ground floor plan 4.10

Massing models; of Iteration B


Aerial view showing accommodation
Central atrium
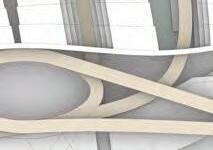
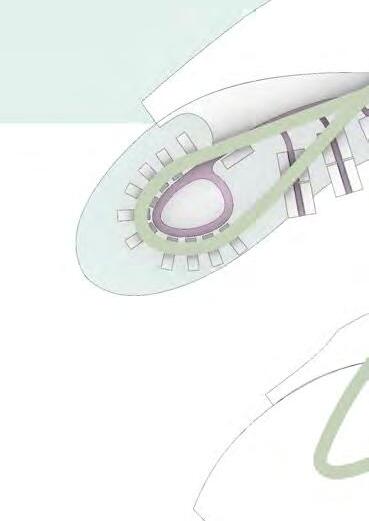
Accommodation
Fishing market Fishing shacks
Aerial view showing circulation


Piers leading from central core
Central core

49 4 Design Development
Masing models; Marina Iterations
Iterations A and B


Iteration A; Aerial view ground level marina


Iteration B; Aerial view ground level marina


50 4 Design Development
4.11
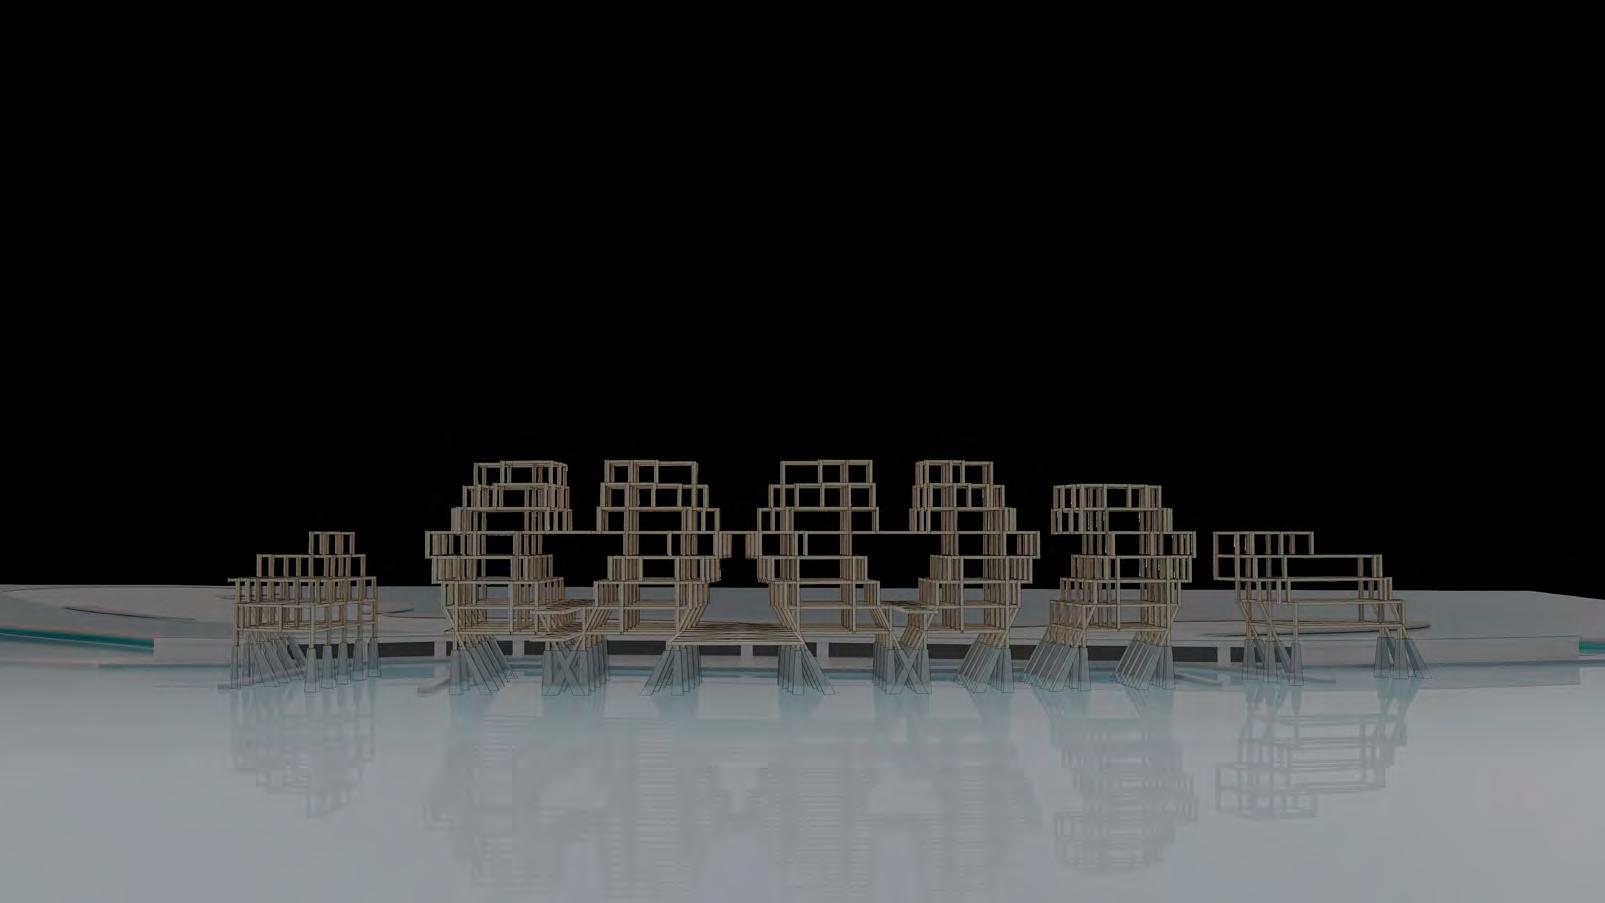
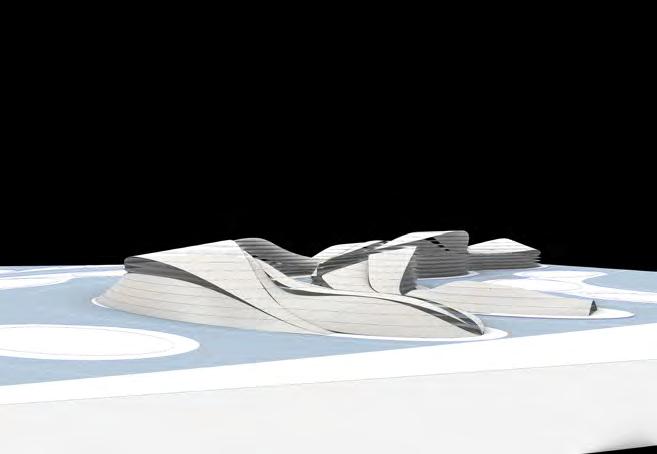
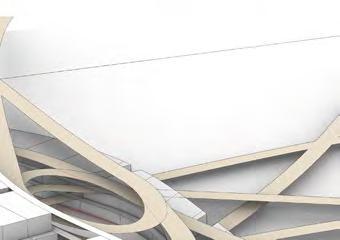
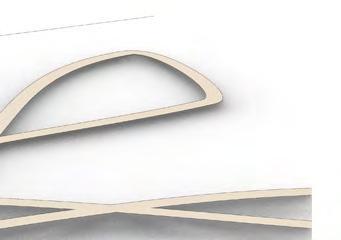
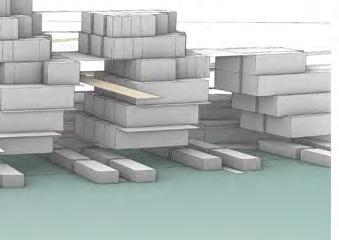
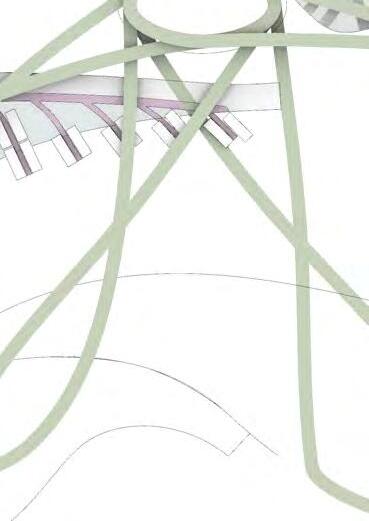
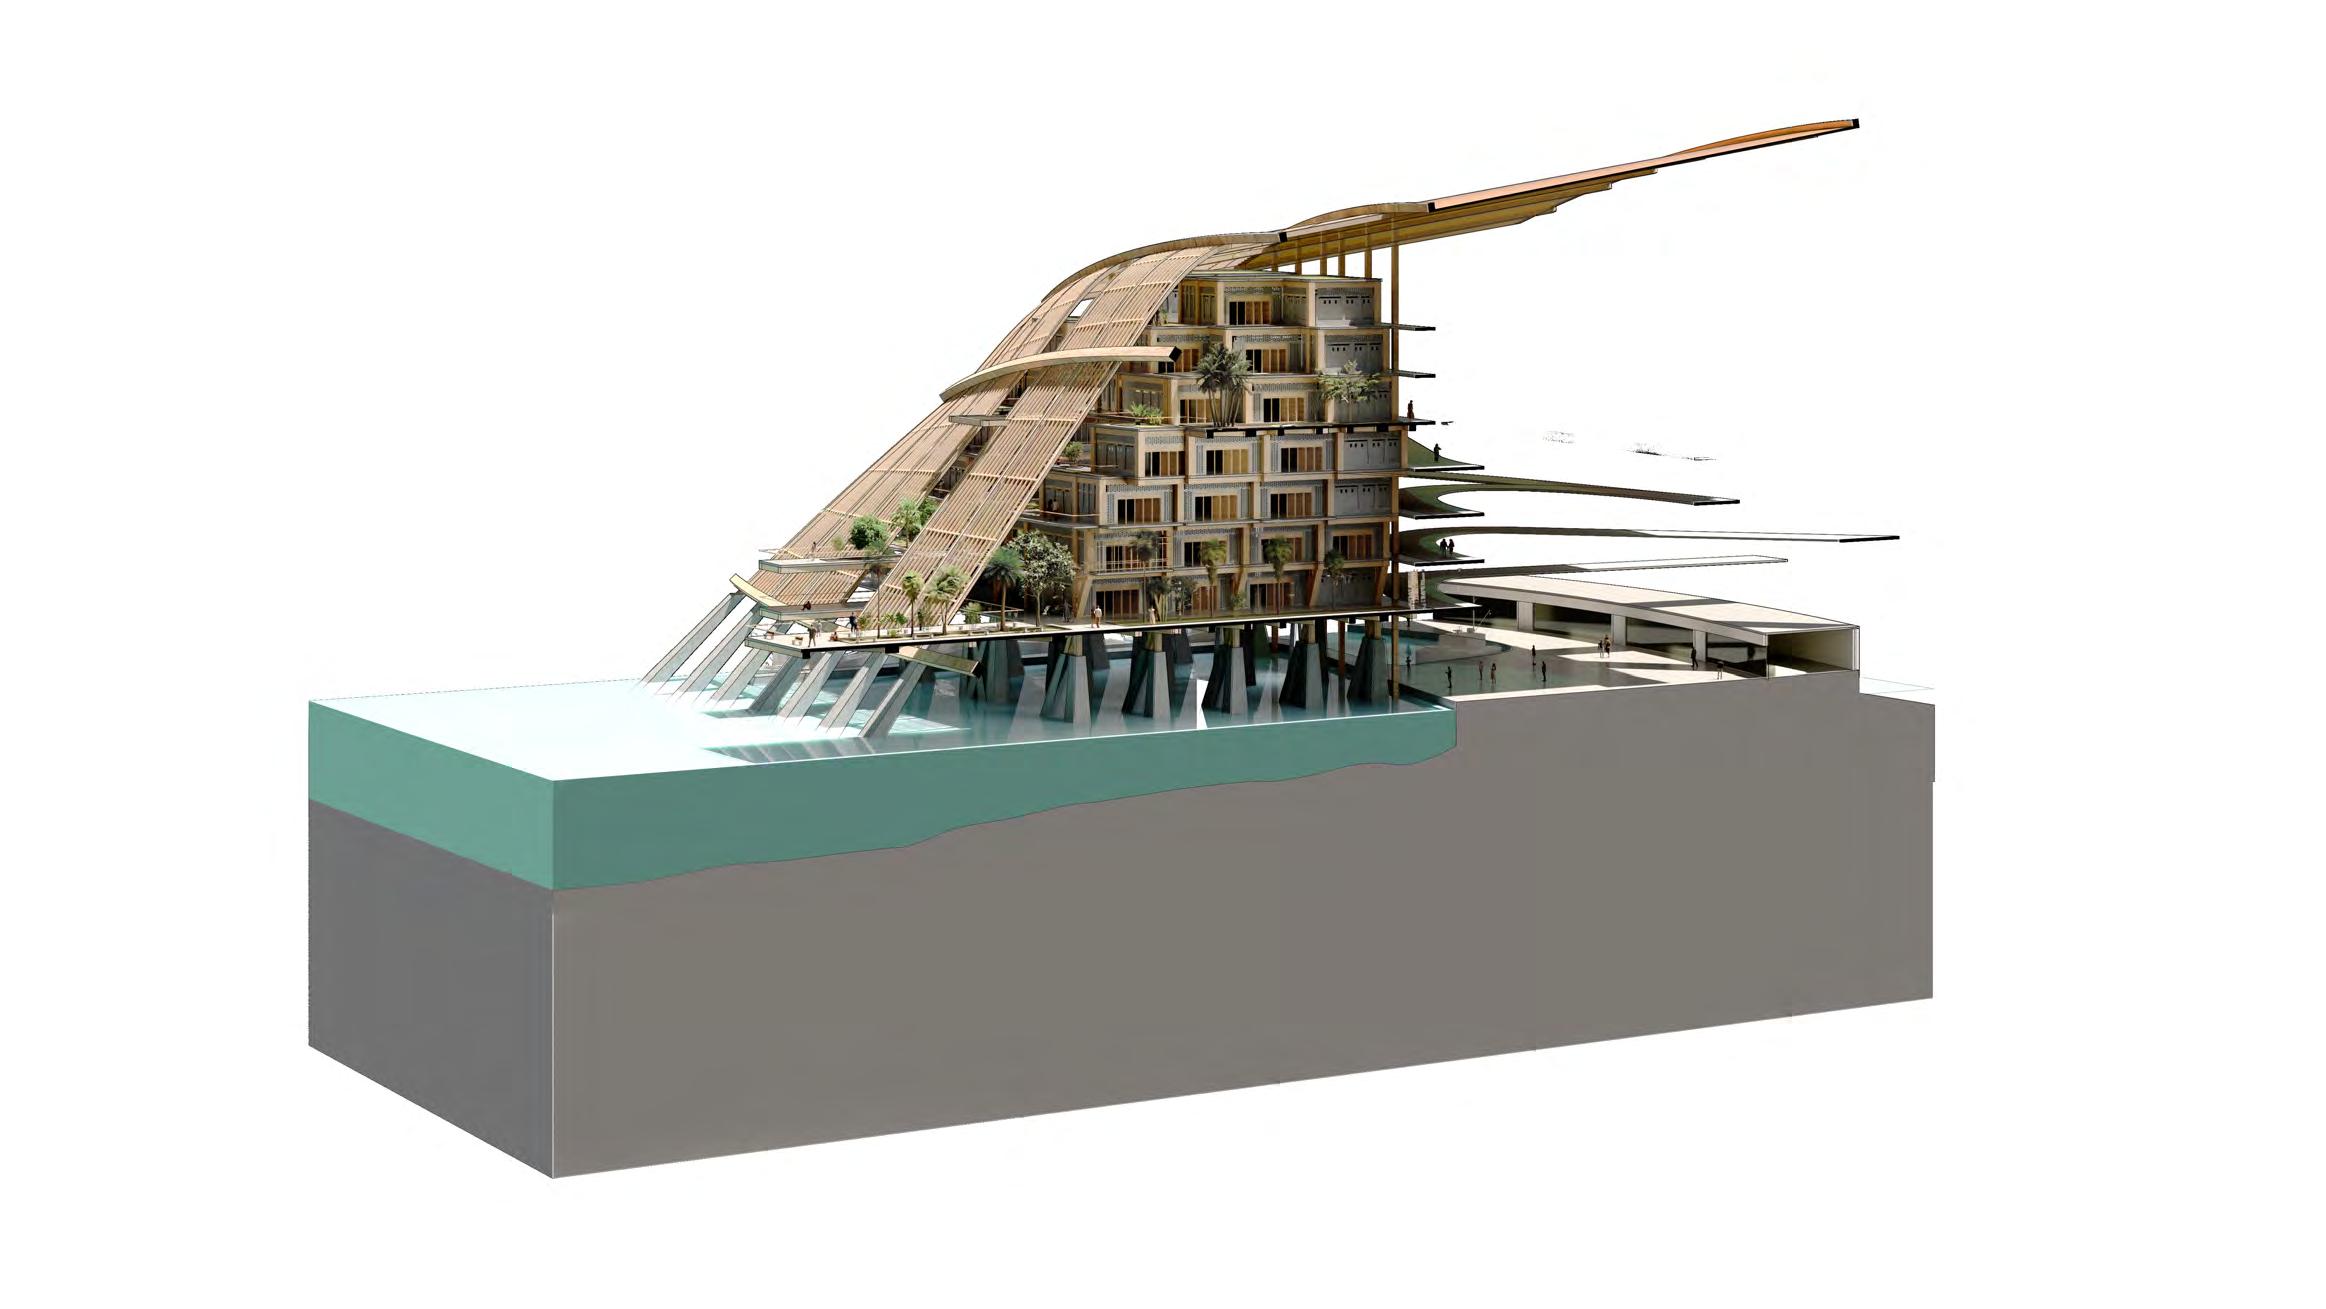
51 4 Design Development Structure - 4.12 Elevational view of structure of accommodation units
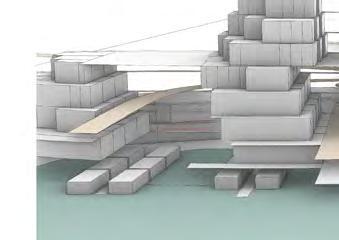
Elevation showing the primary structure of the shell
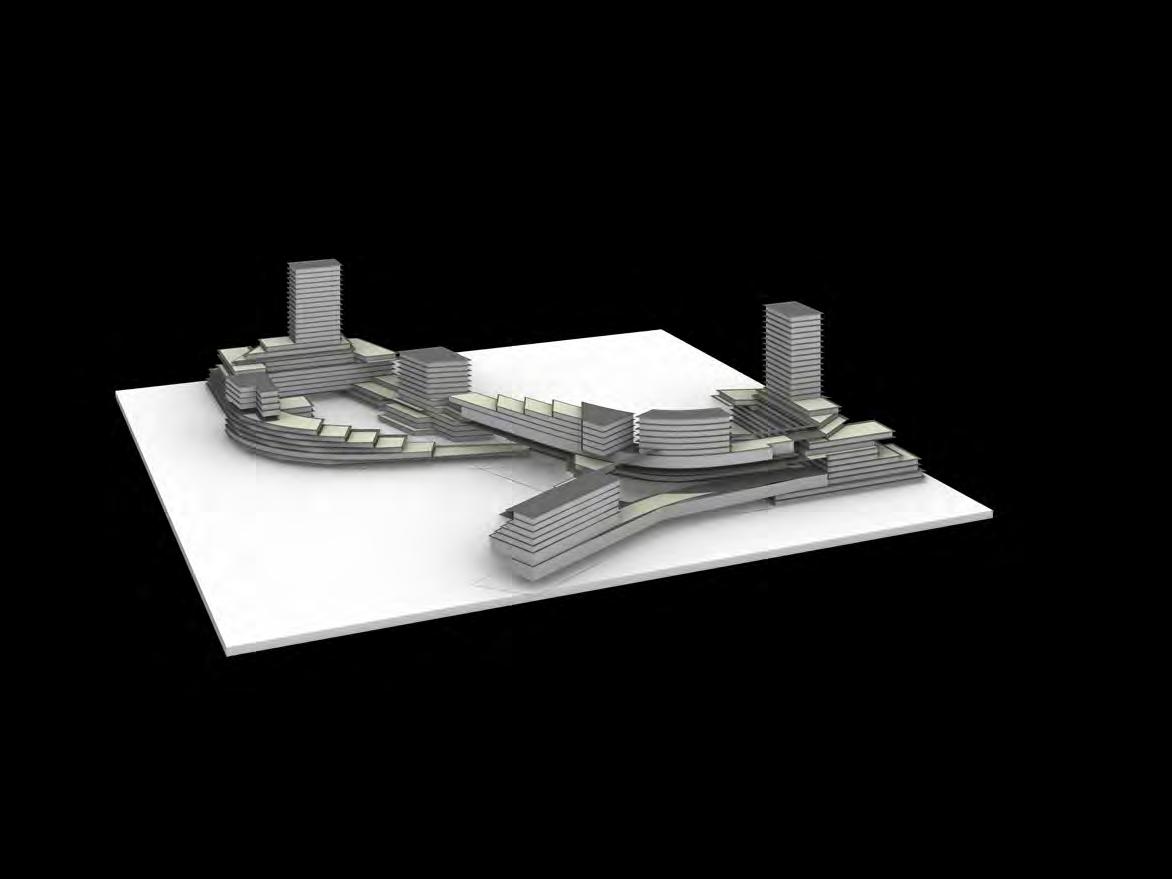
52 4 Design Development Plans Aerial view with shell and aerial view without shell 4.13
Aerial view showing shell
Aerial view showing structure and accommodation with the shell removed
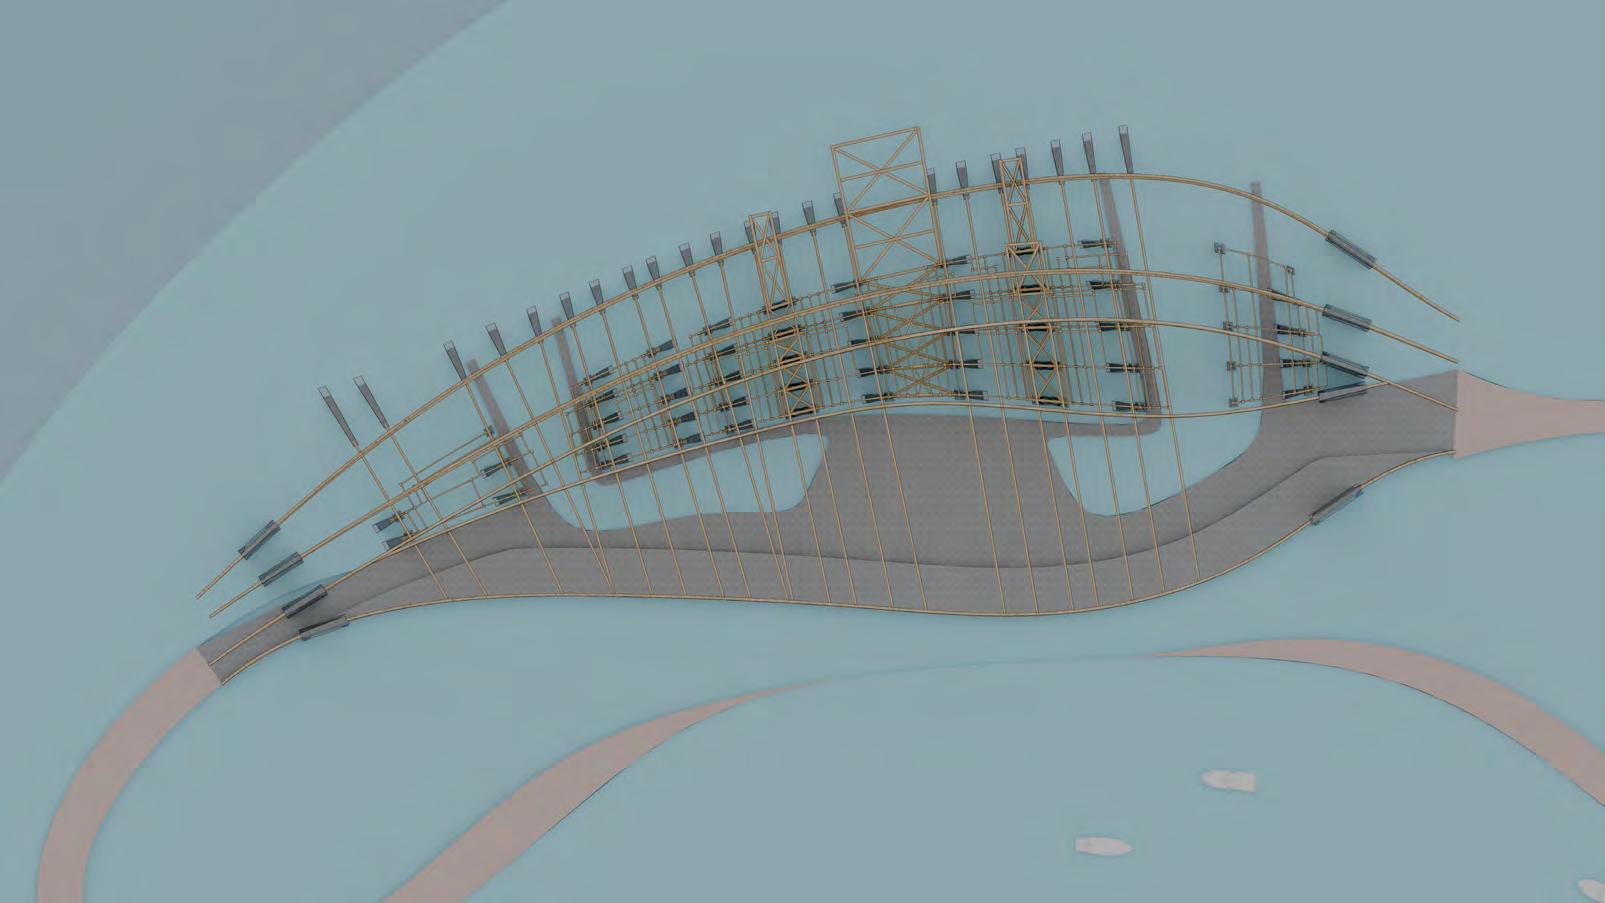
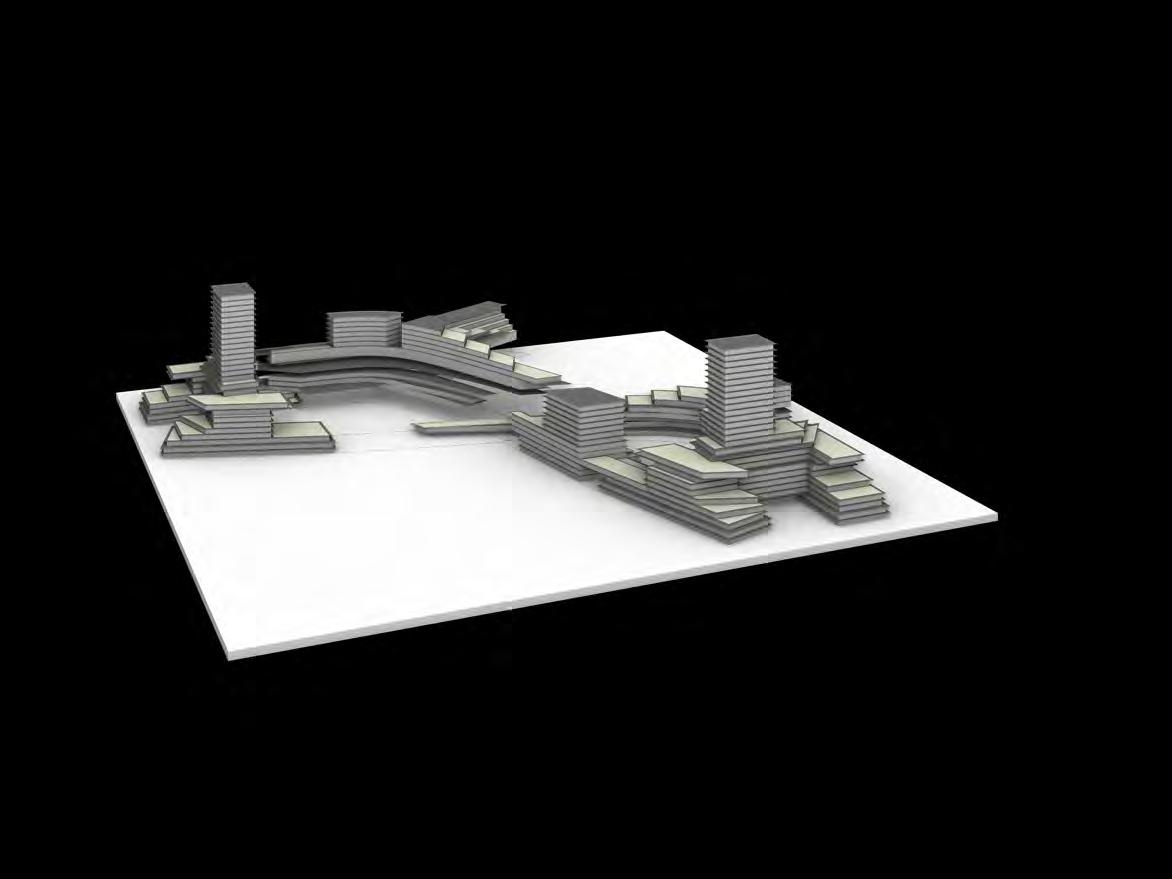
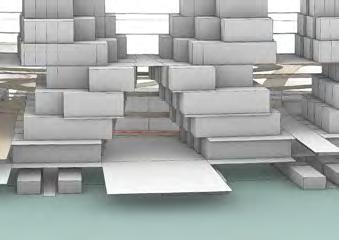
53 4 Design Development Plans Aerial view of accommodation and aerial view of structure 4.14
Aerial view showing showing accommodation Aerial view showing structure
Design Proposal
Section 1: Early Research
Section 2: Urban Density
Section 3: Context and Brief
Section 4: Design Development
Section 5: Design Proposal
Section 6: Appendix
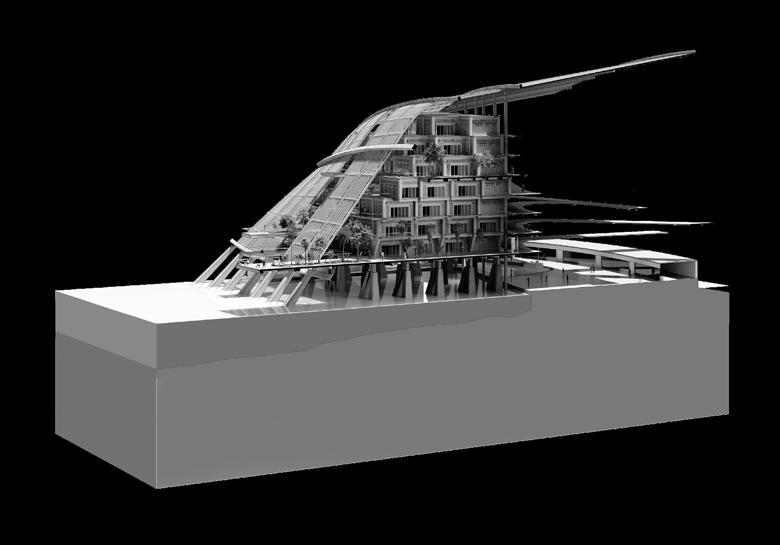
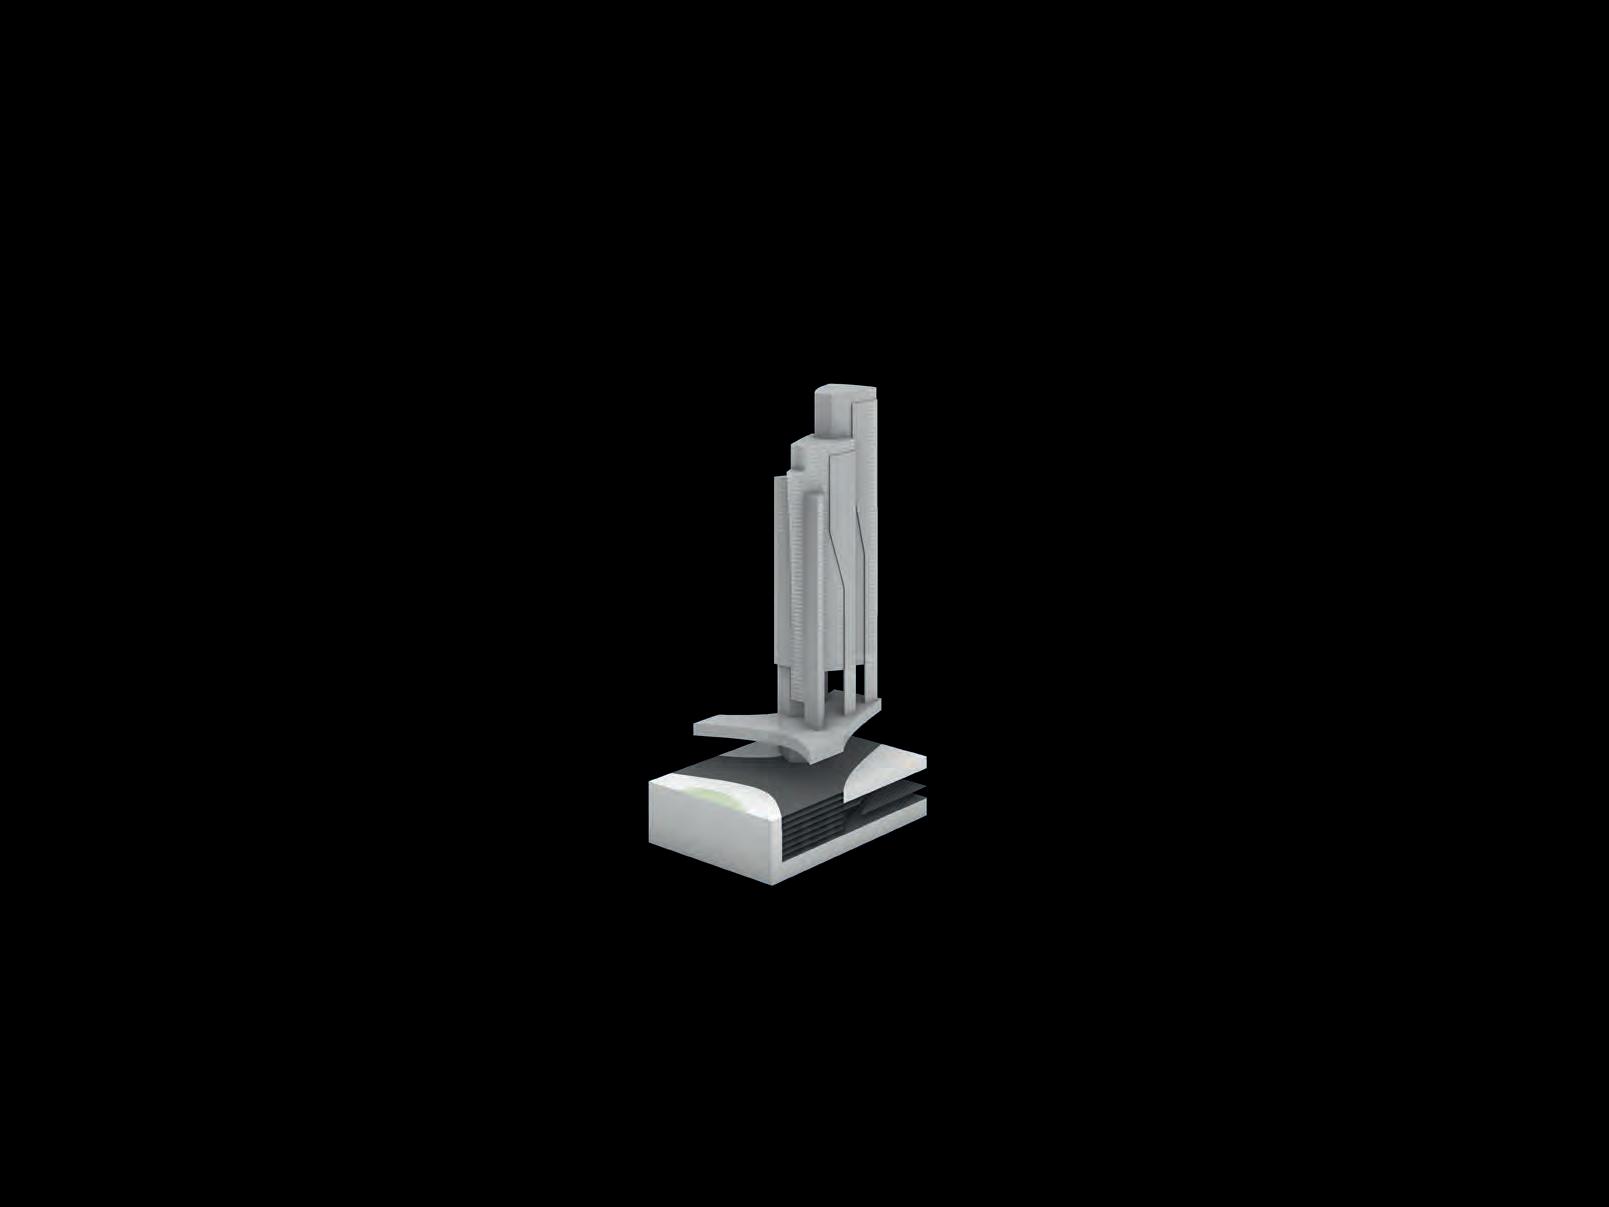
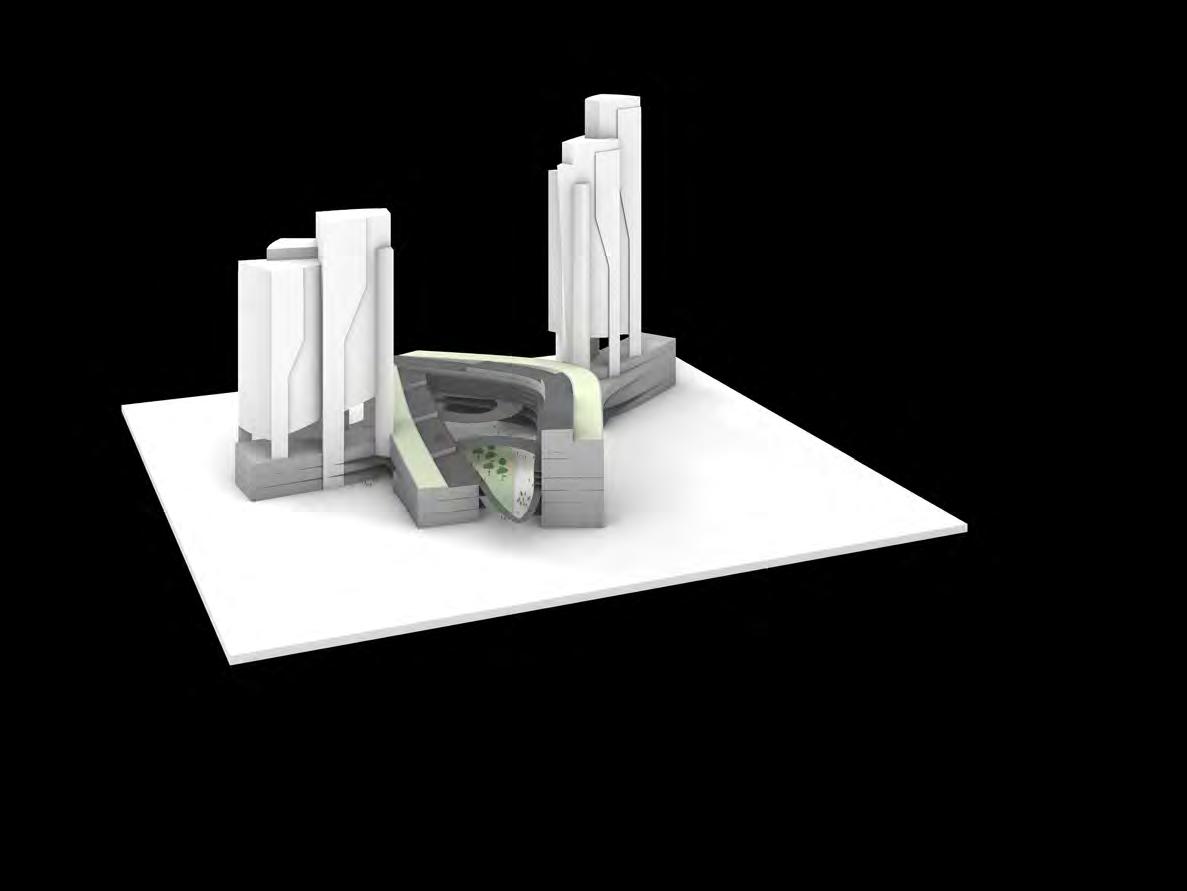
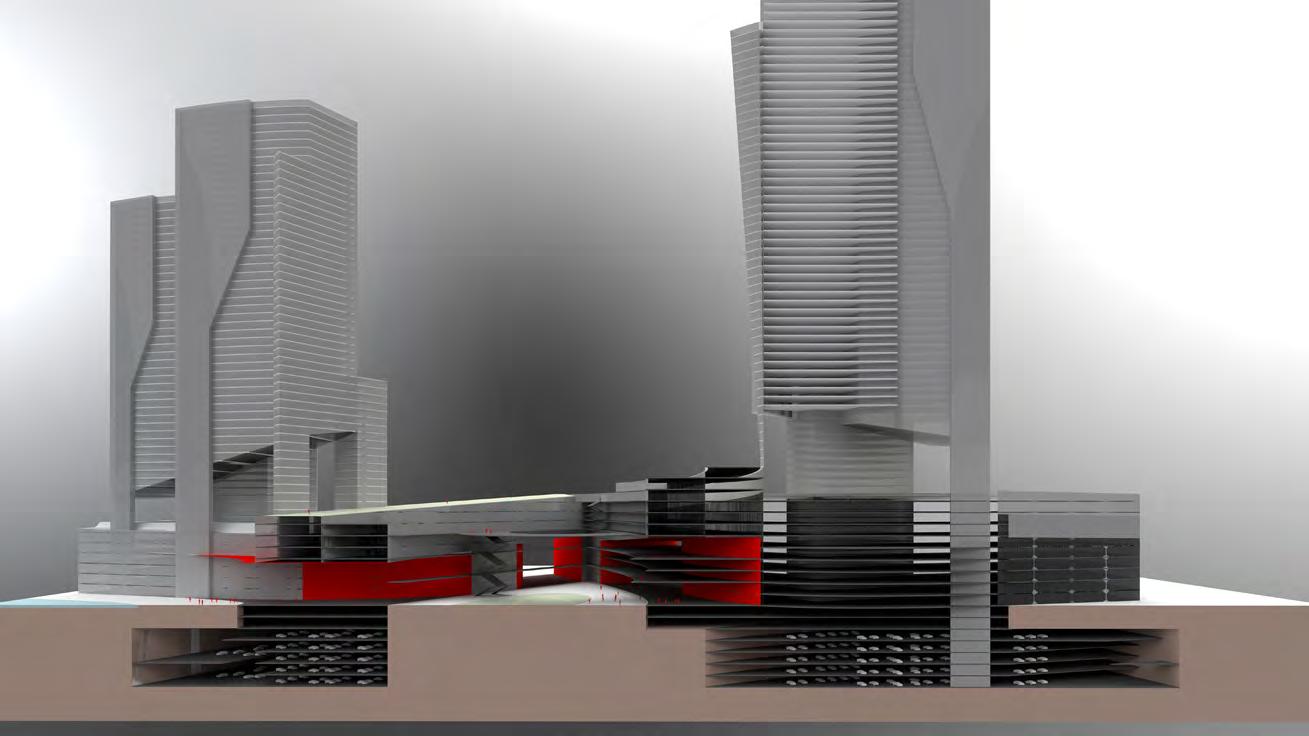
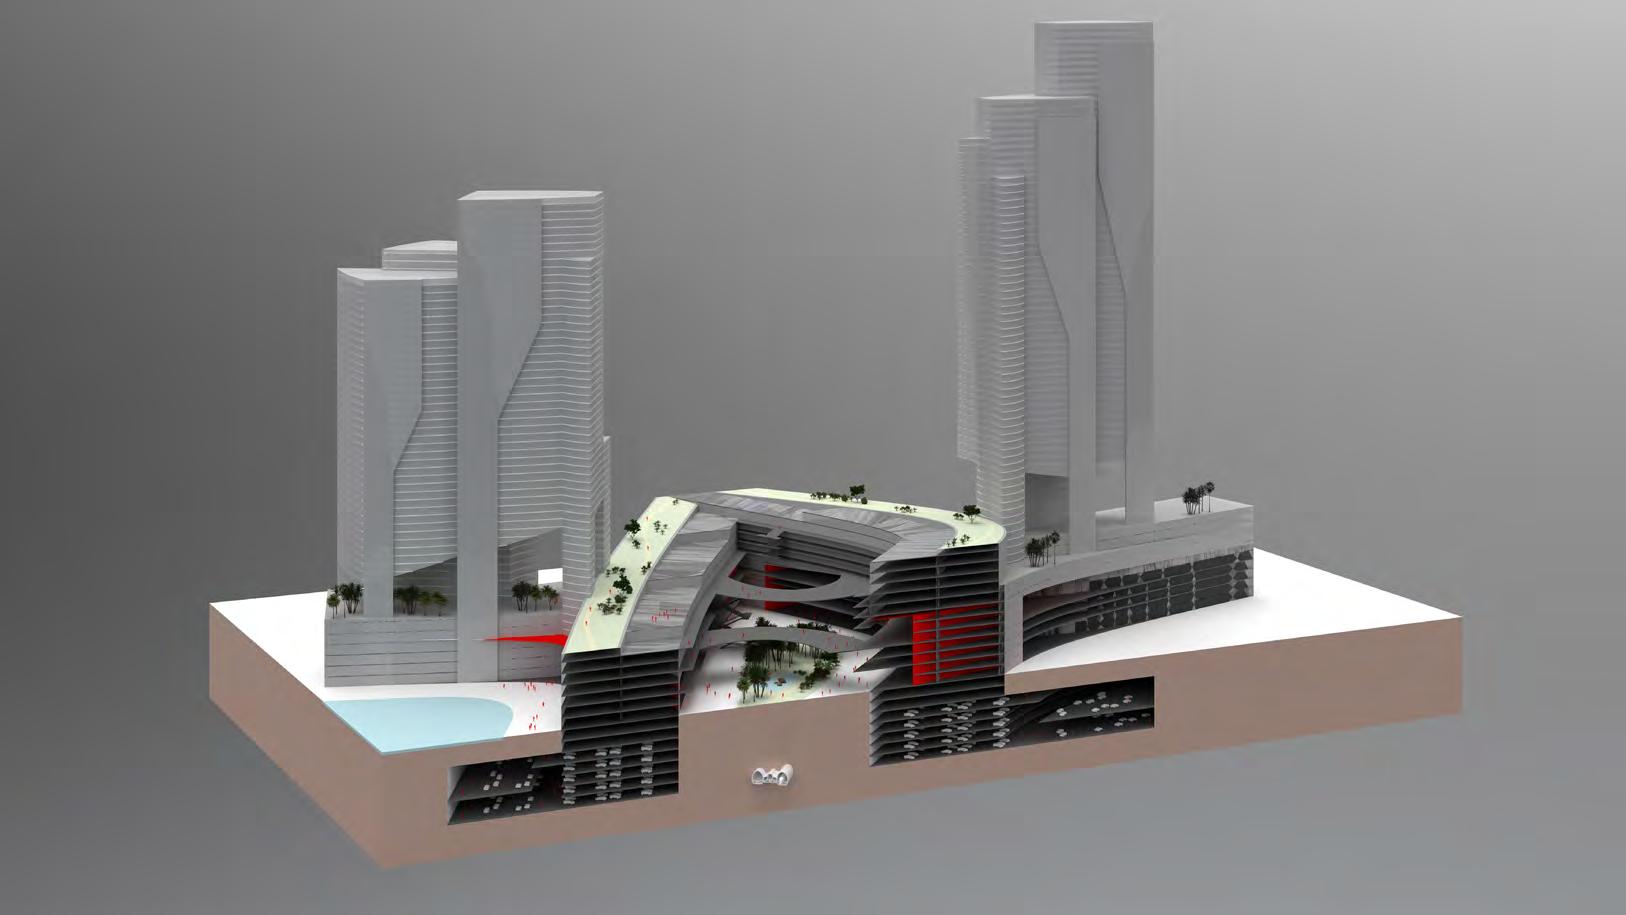
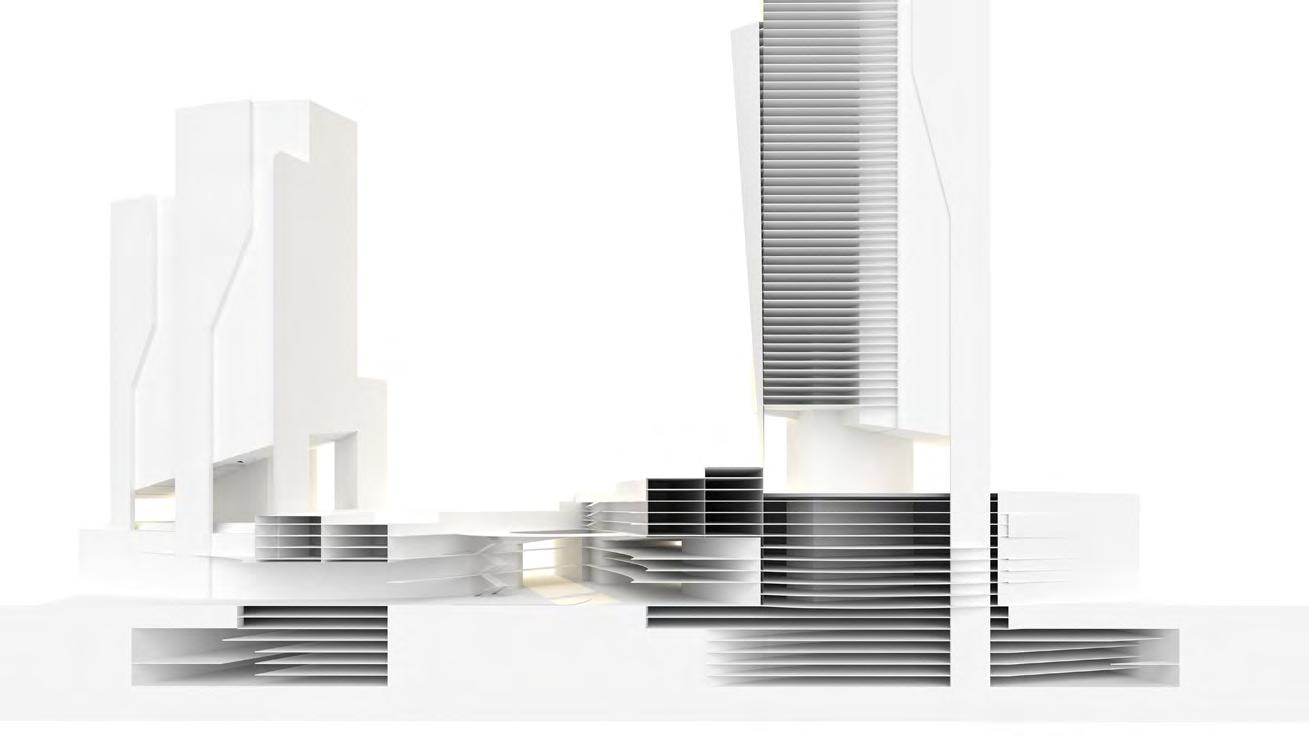
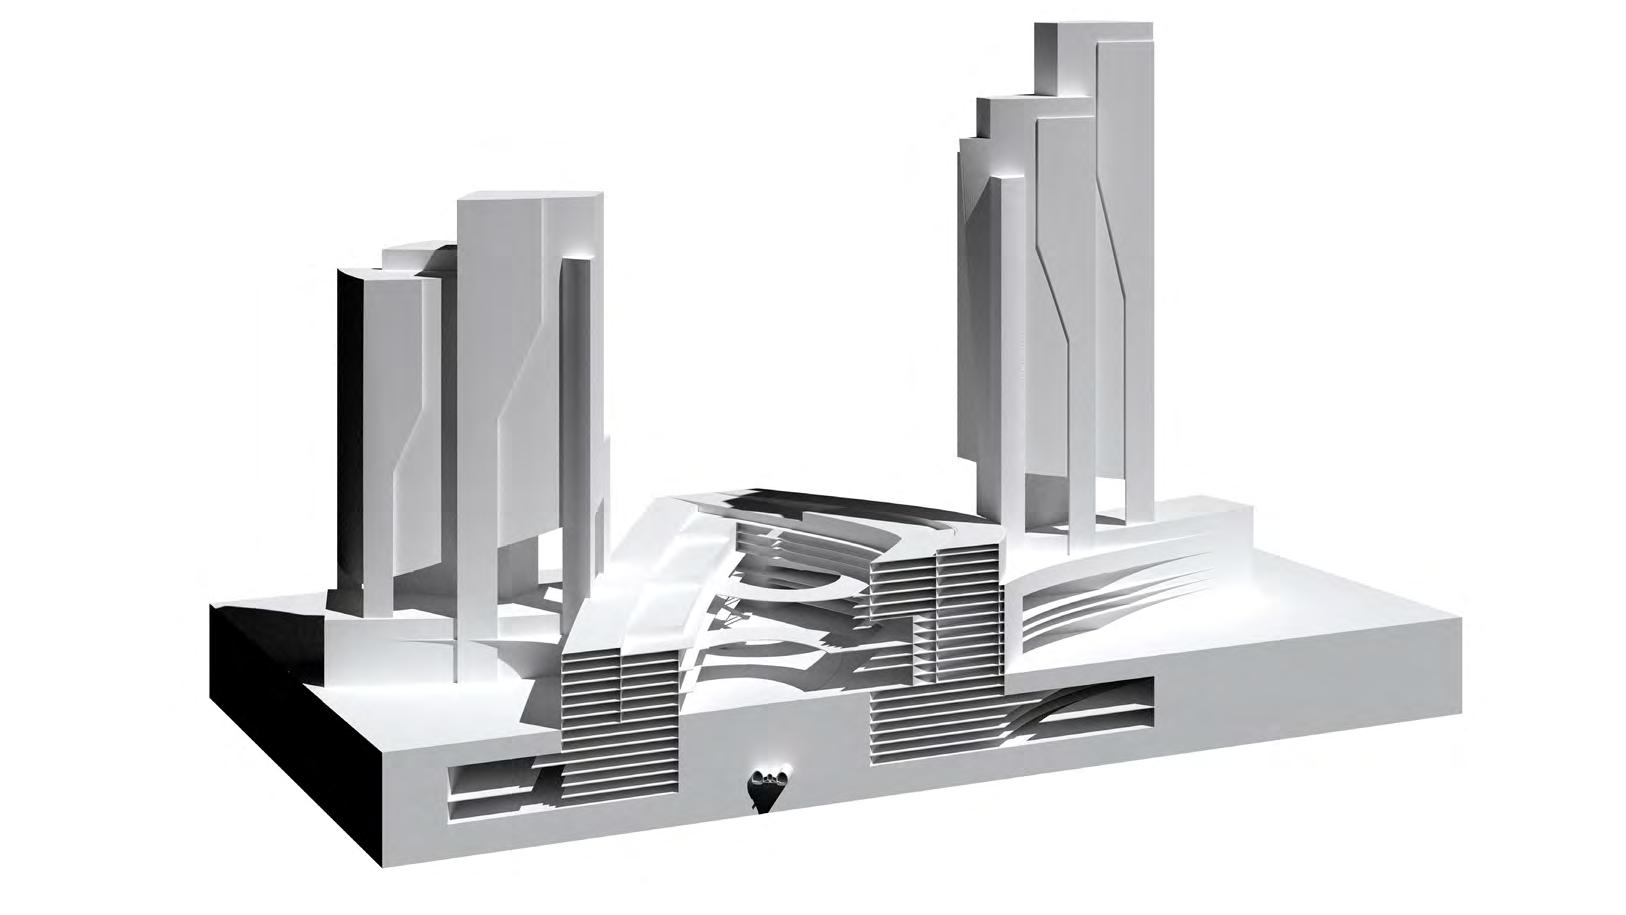
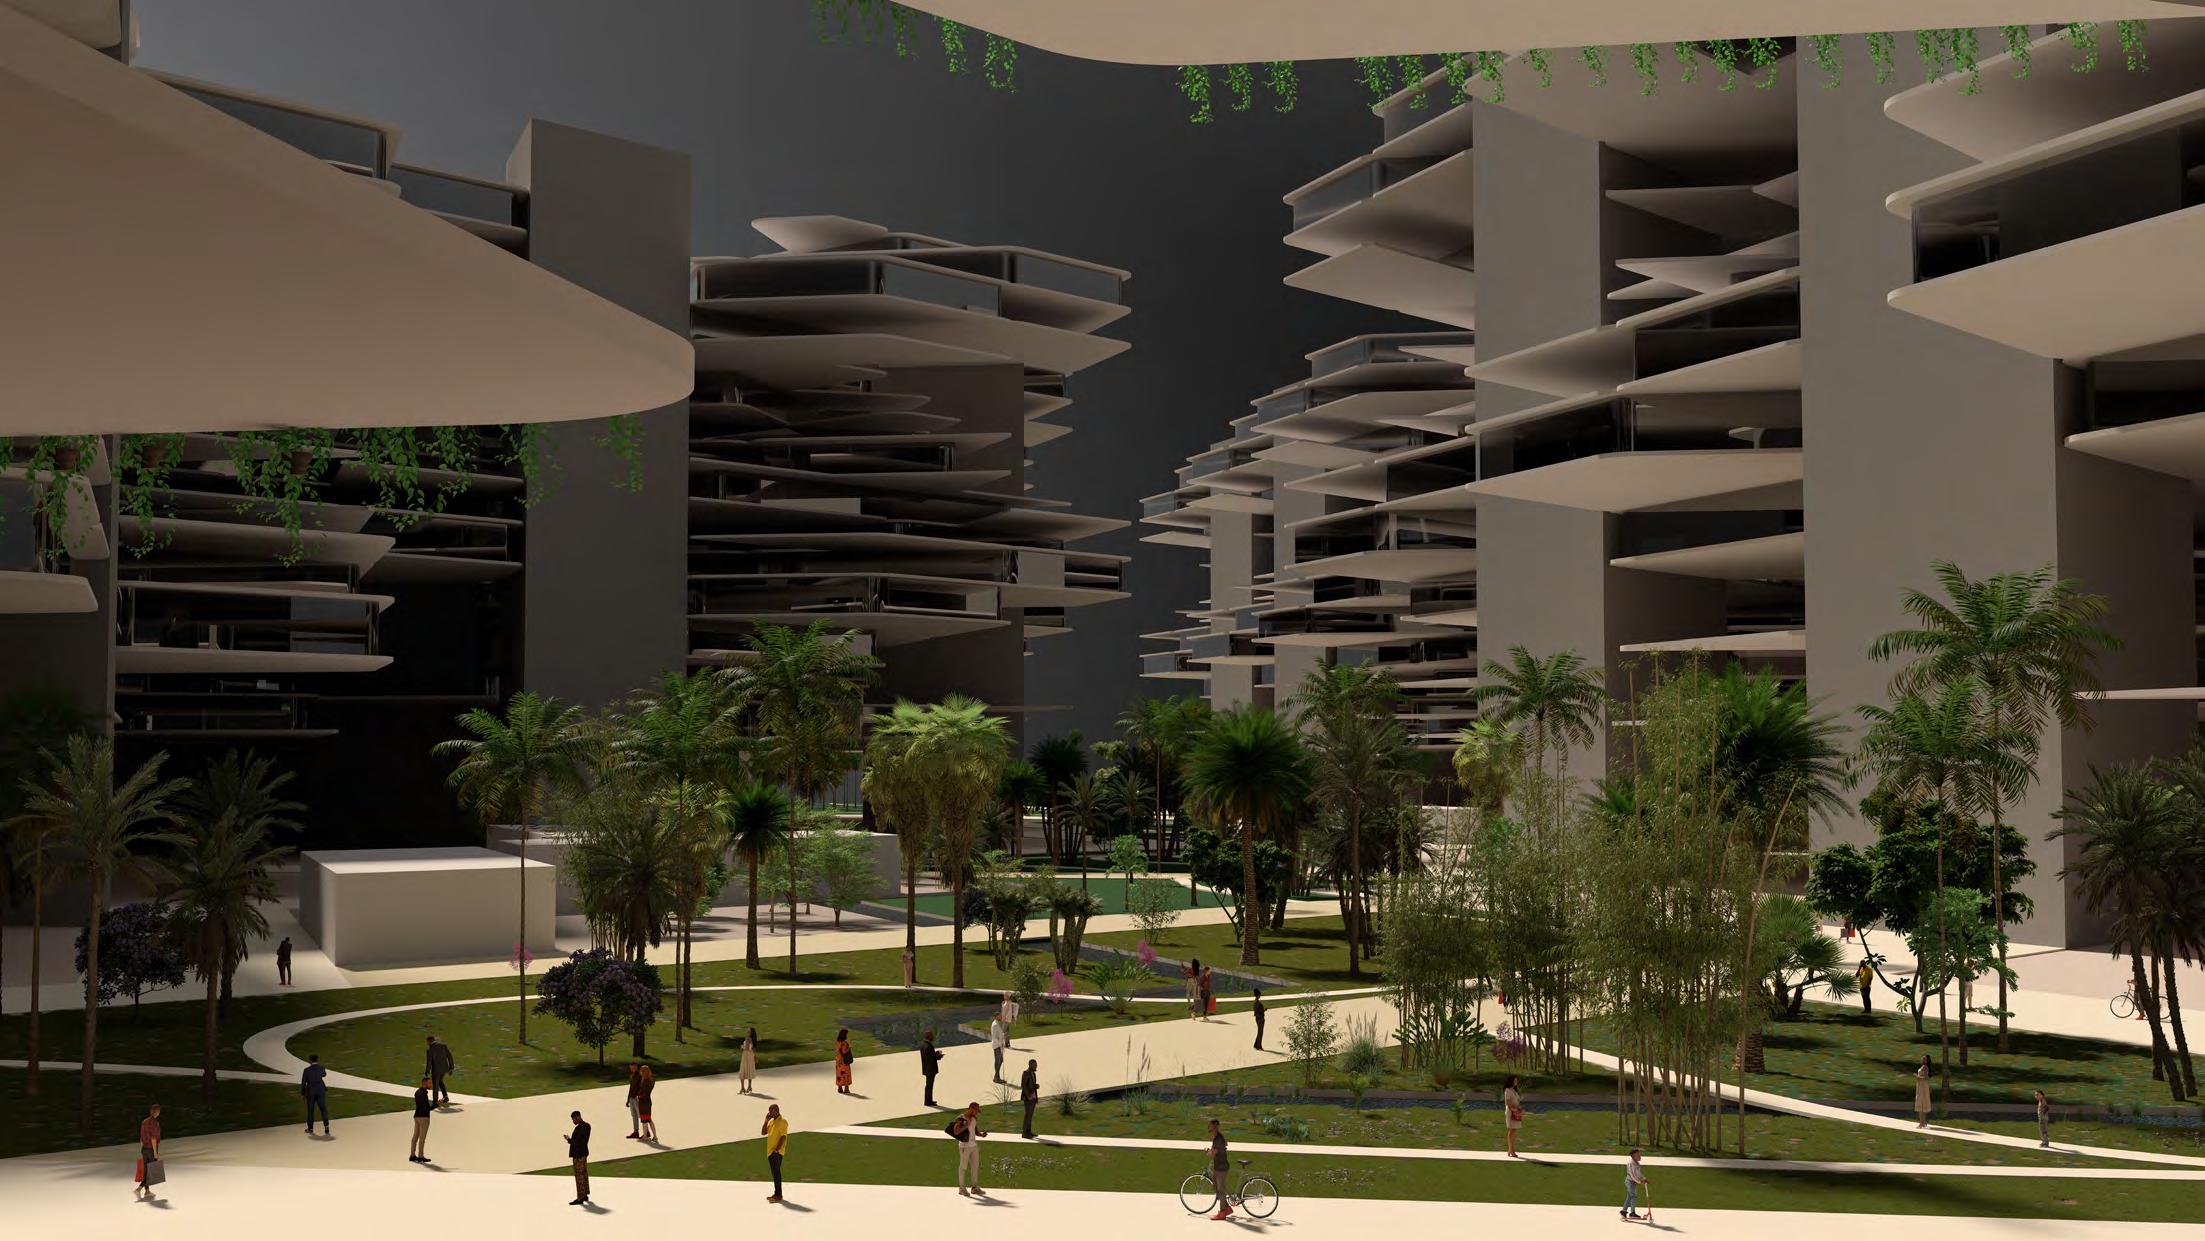
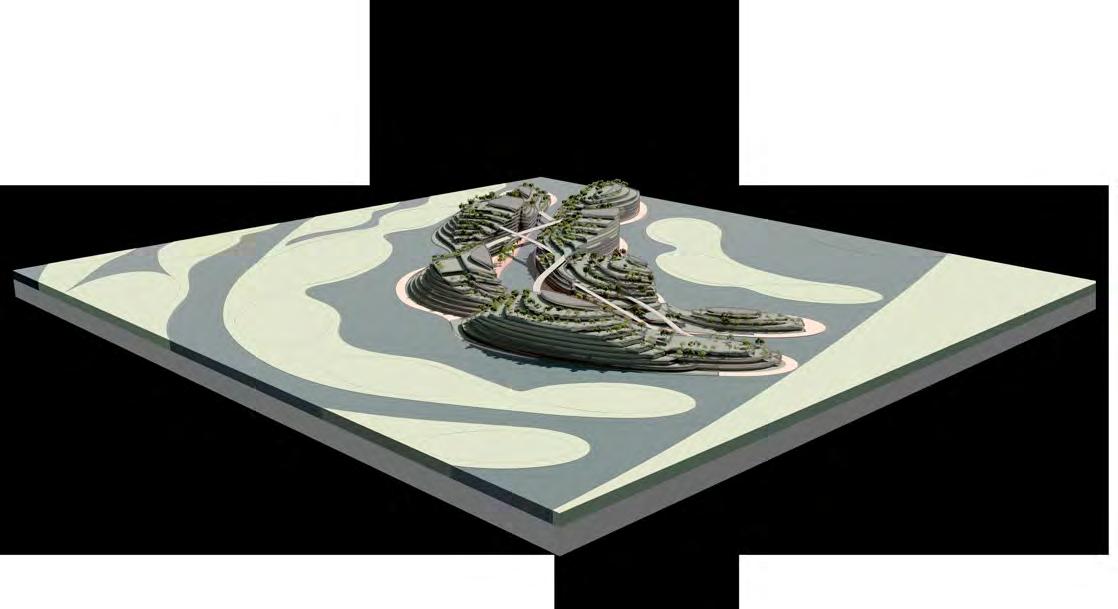
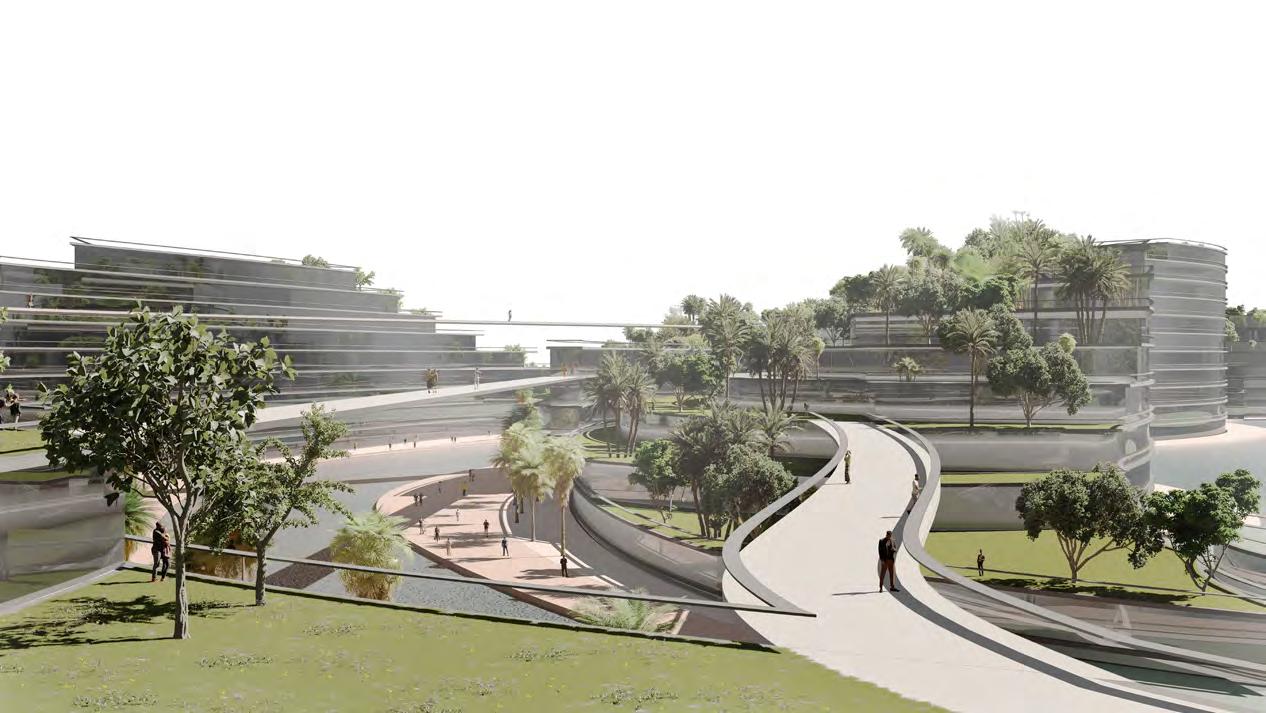
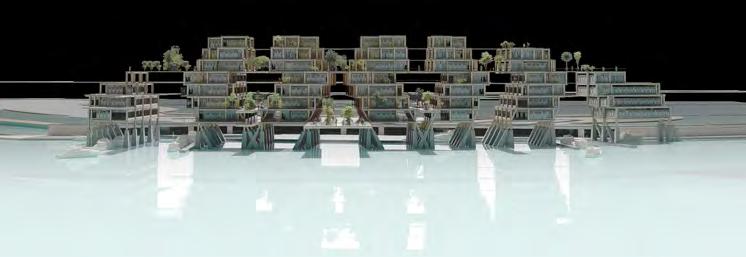
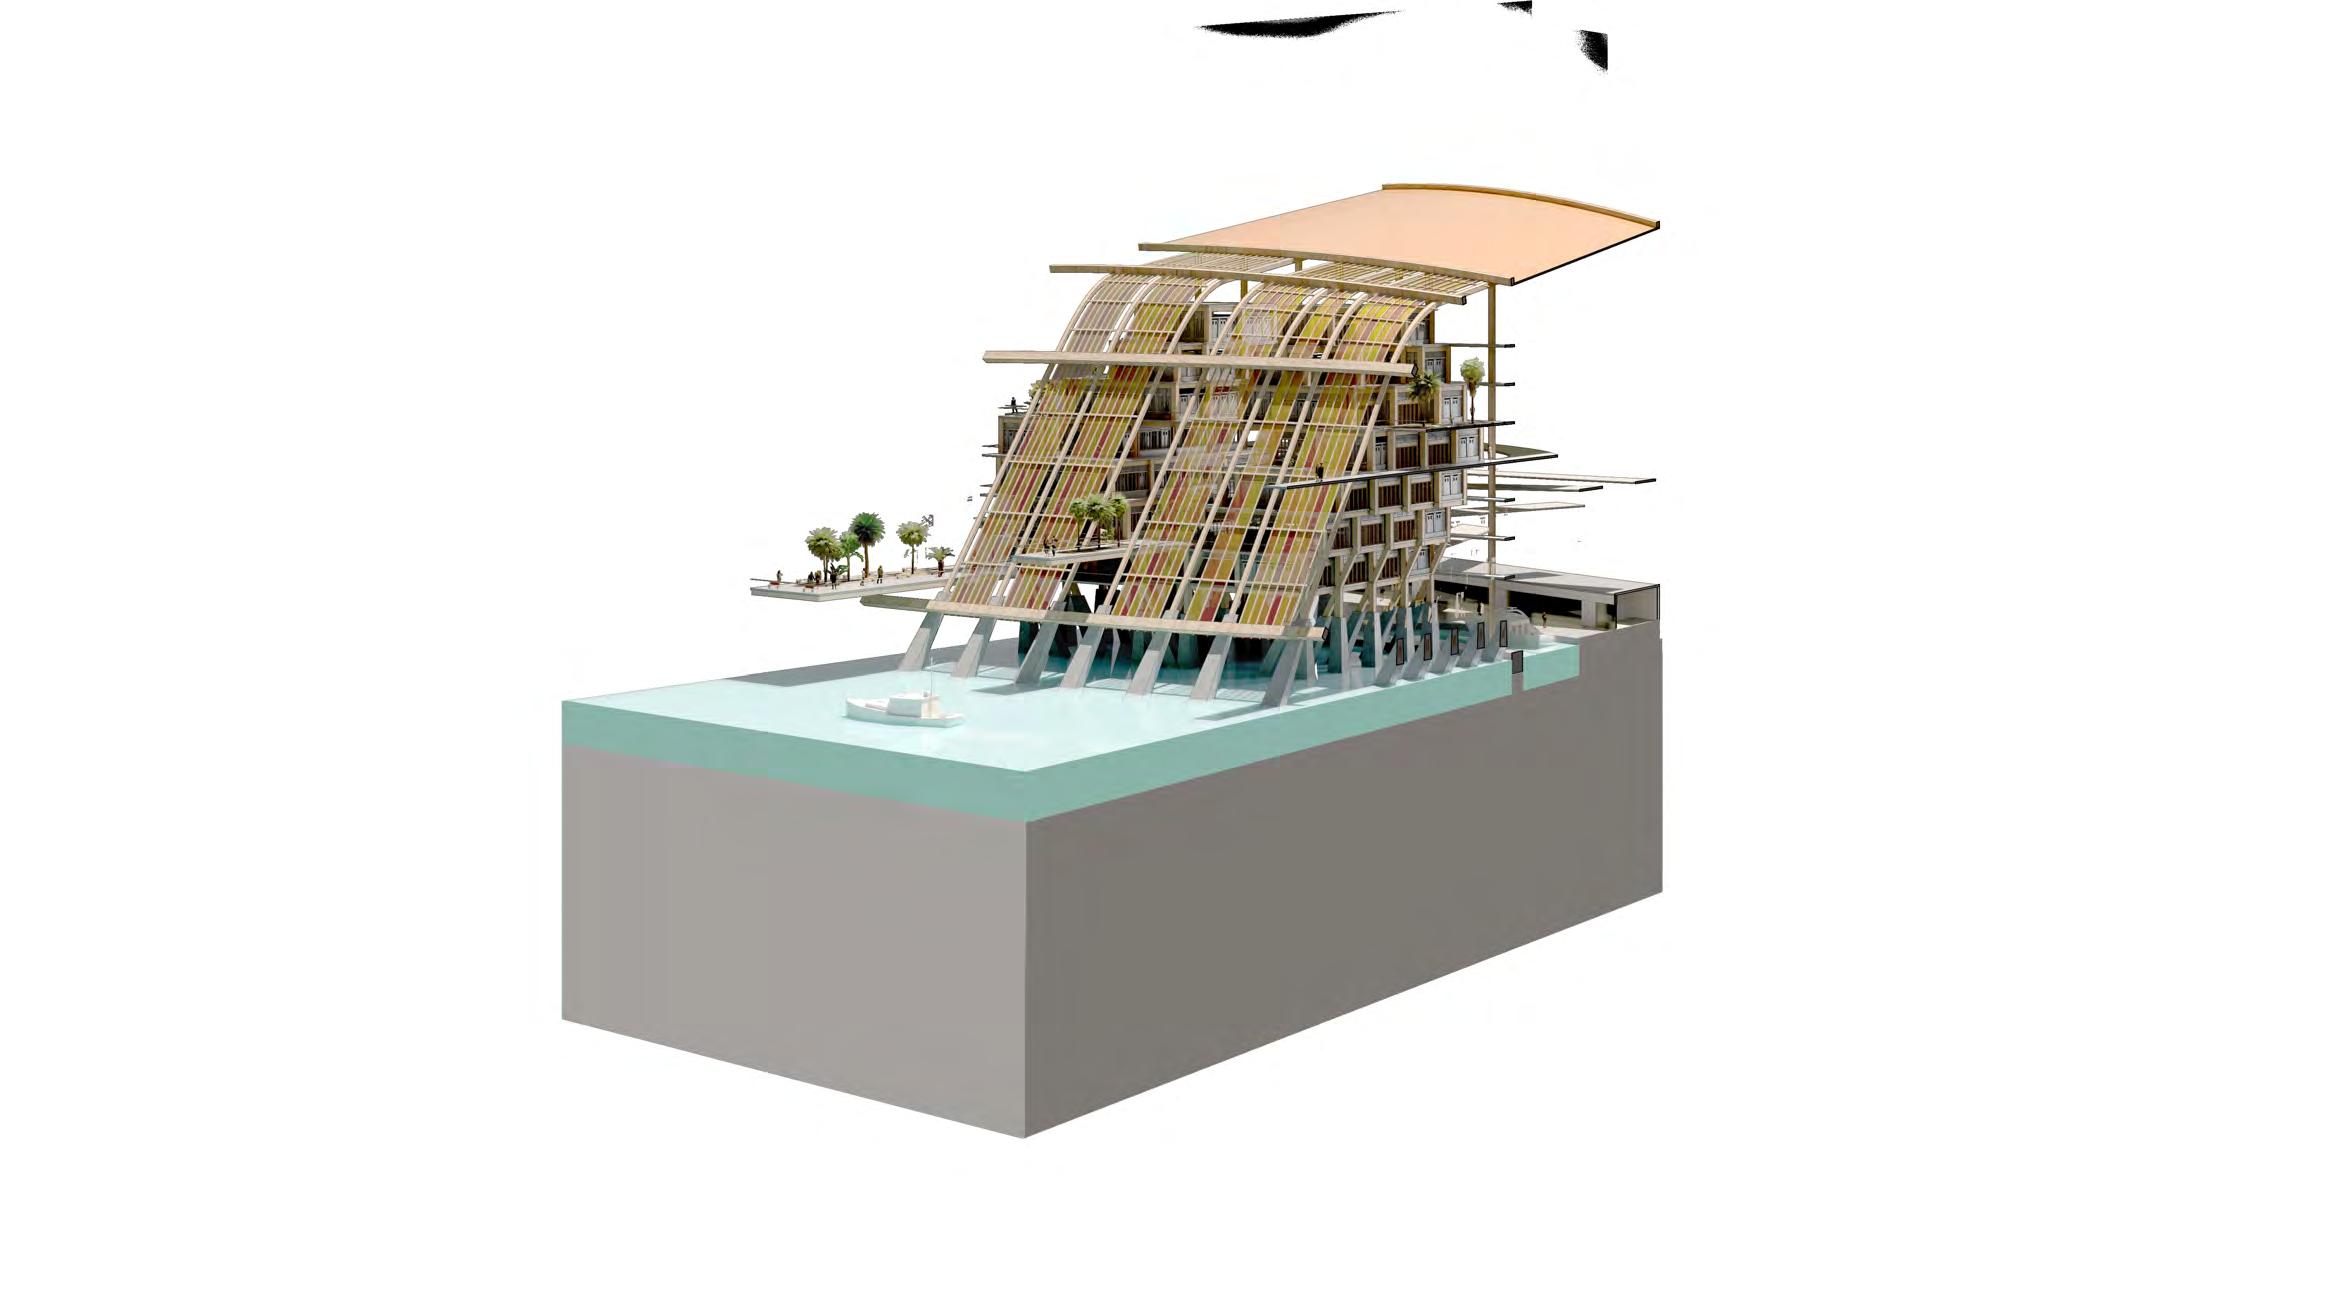
A fundamental driver of the project was not just to provide affordable housing, but for the development to facilitate the inclusion of impoverished communities into society in a dignified way. Informal settlements are often isolated from the rest of the city, but they can also be places where slum dwellers are well networked internally. These, sometimes illicit enterprises, and informal communities are often characteristic of mutual survival and neighbourly support that is usually absent in luxury developments. Affordable housing integrated into higher end developments can contribute to a charismatic identity that supports the local vendors.
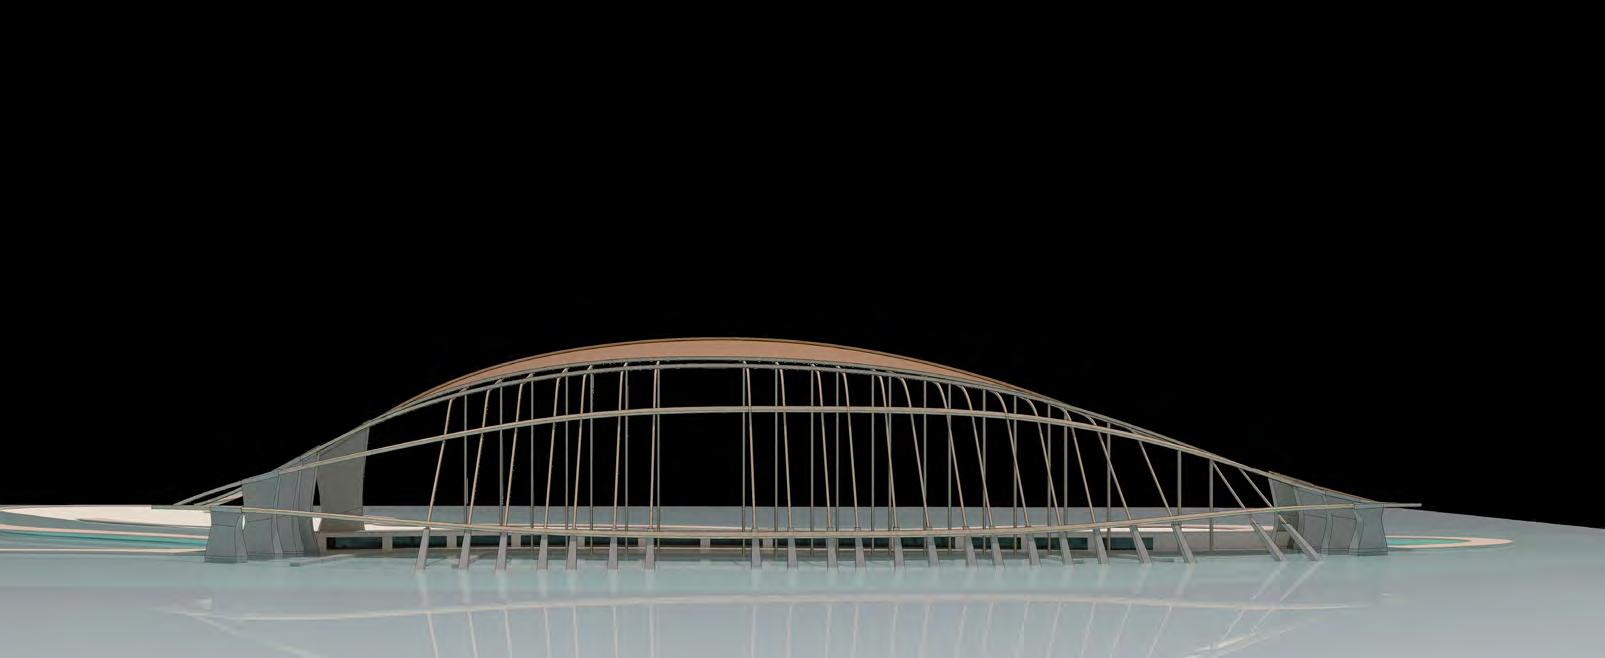
54 5 Final Drawings
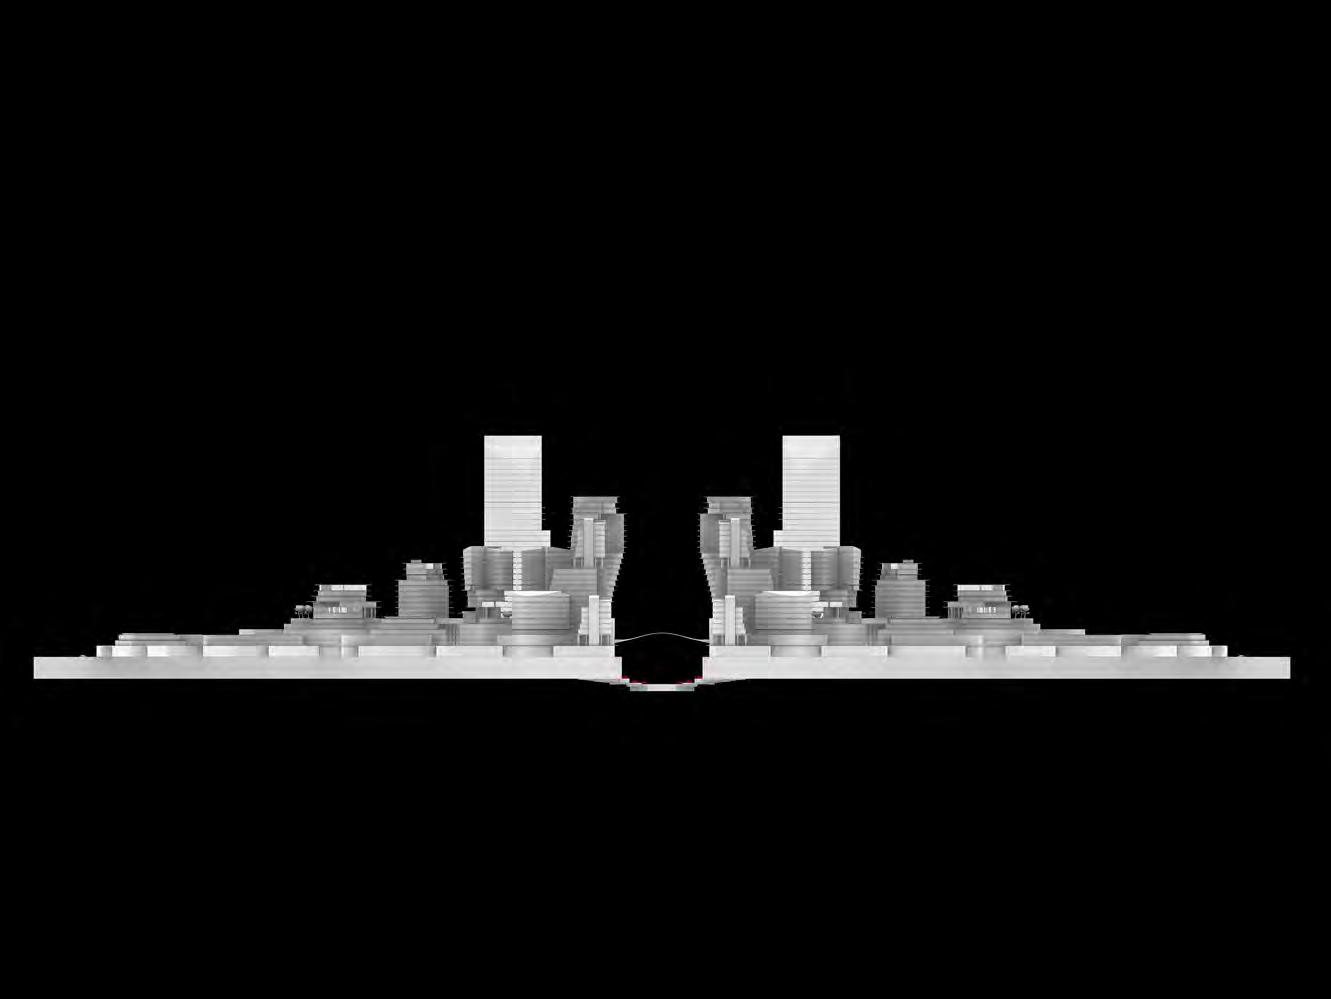
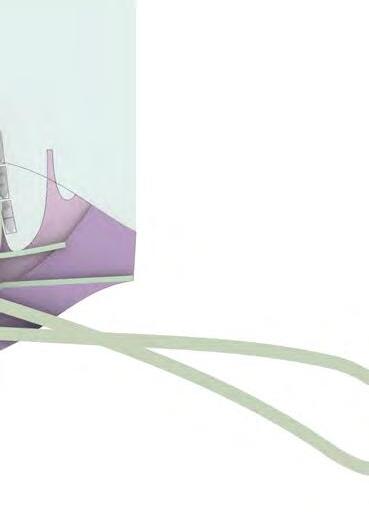
Front Elevation
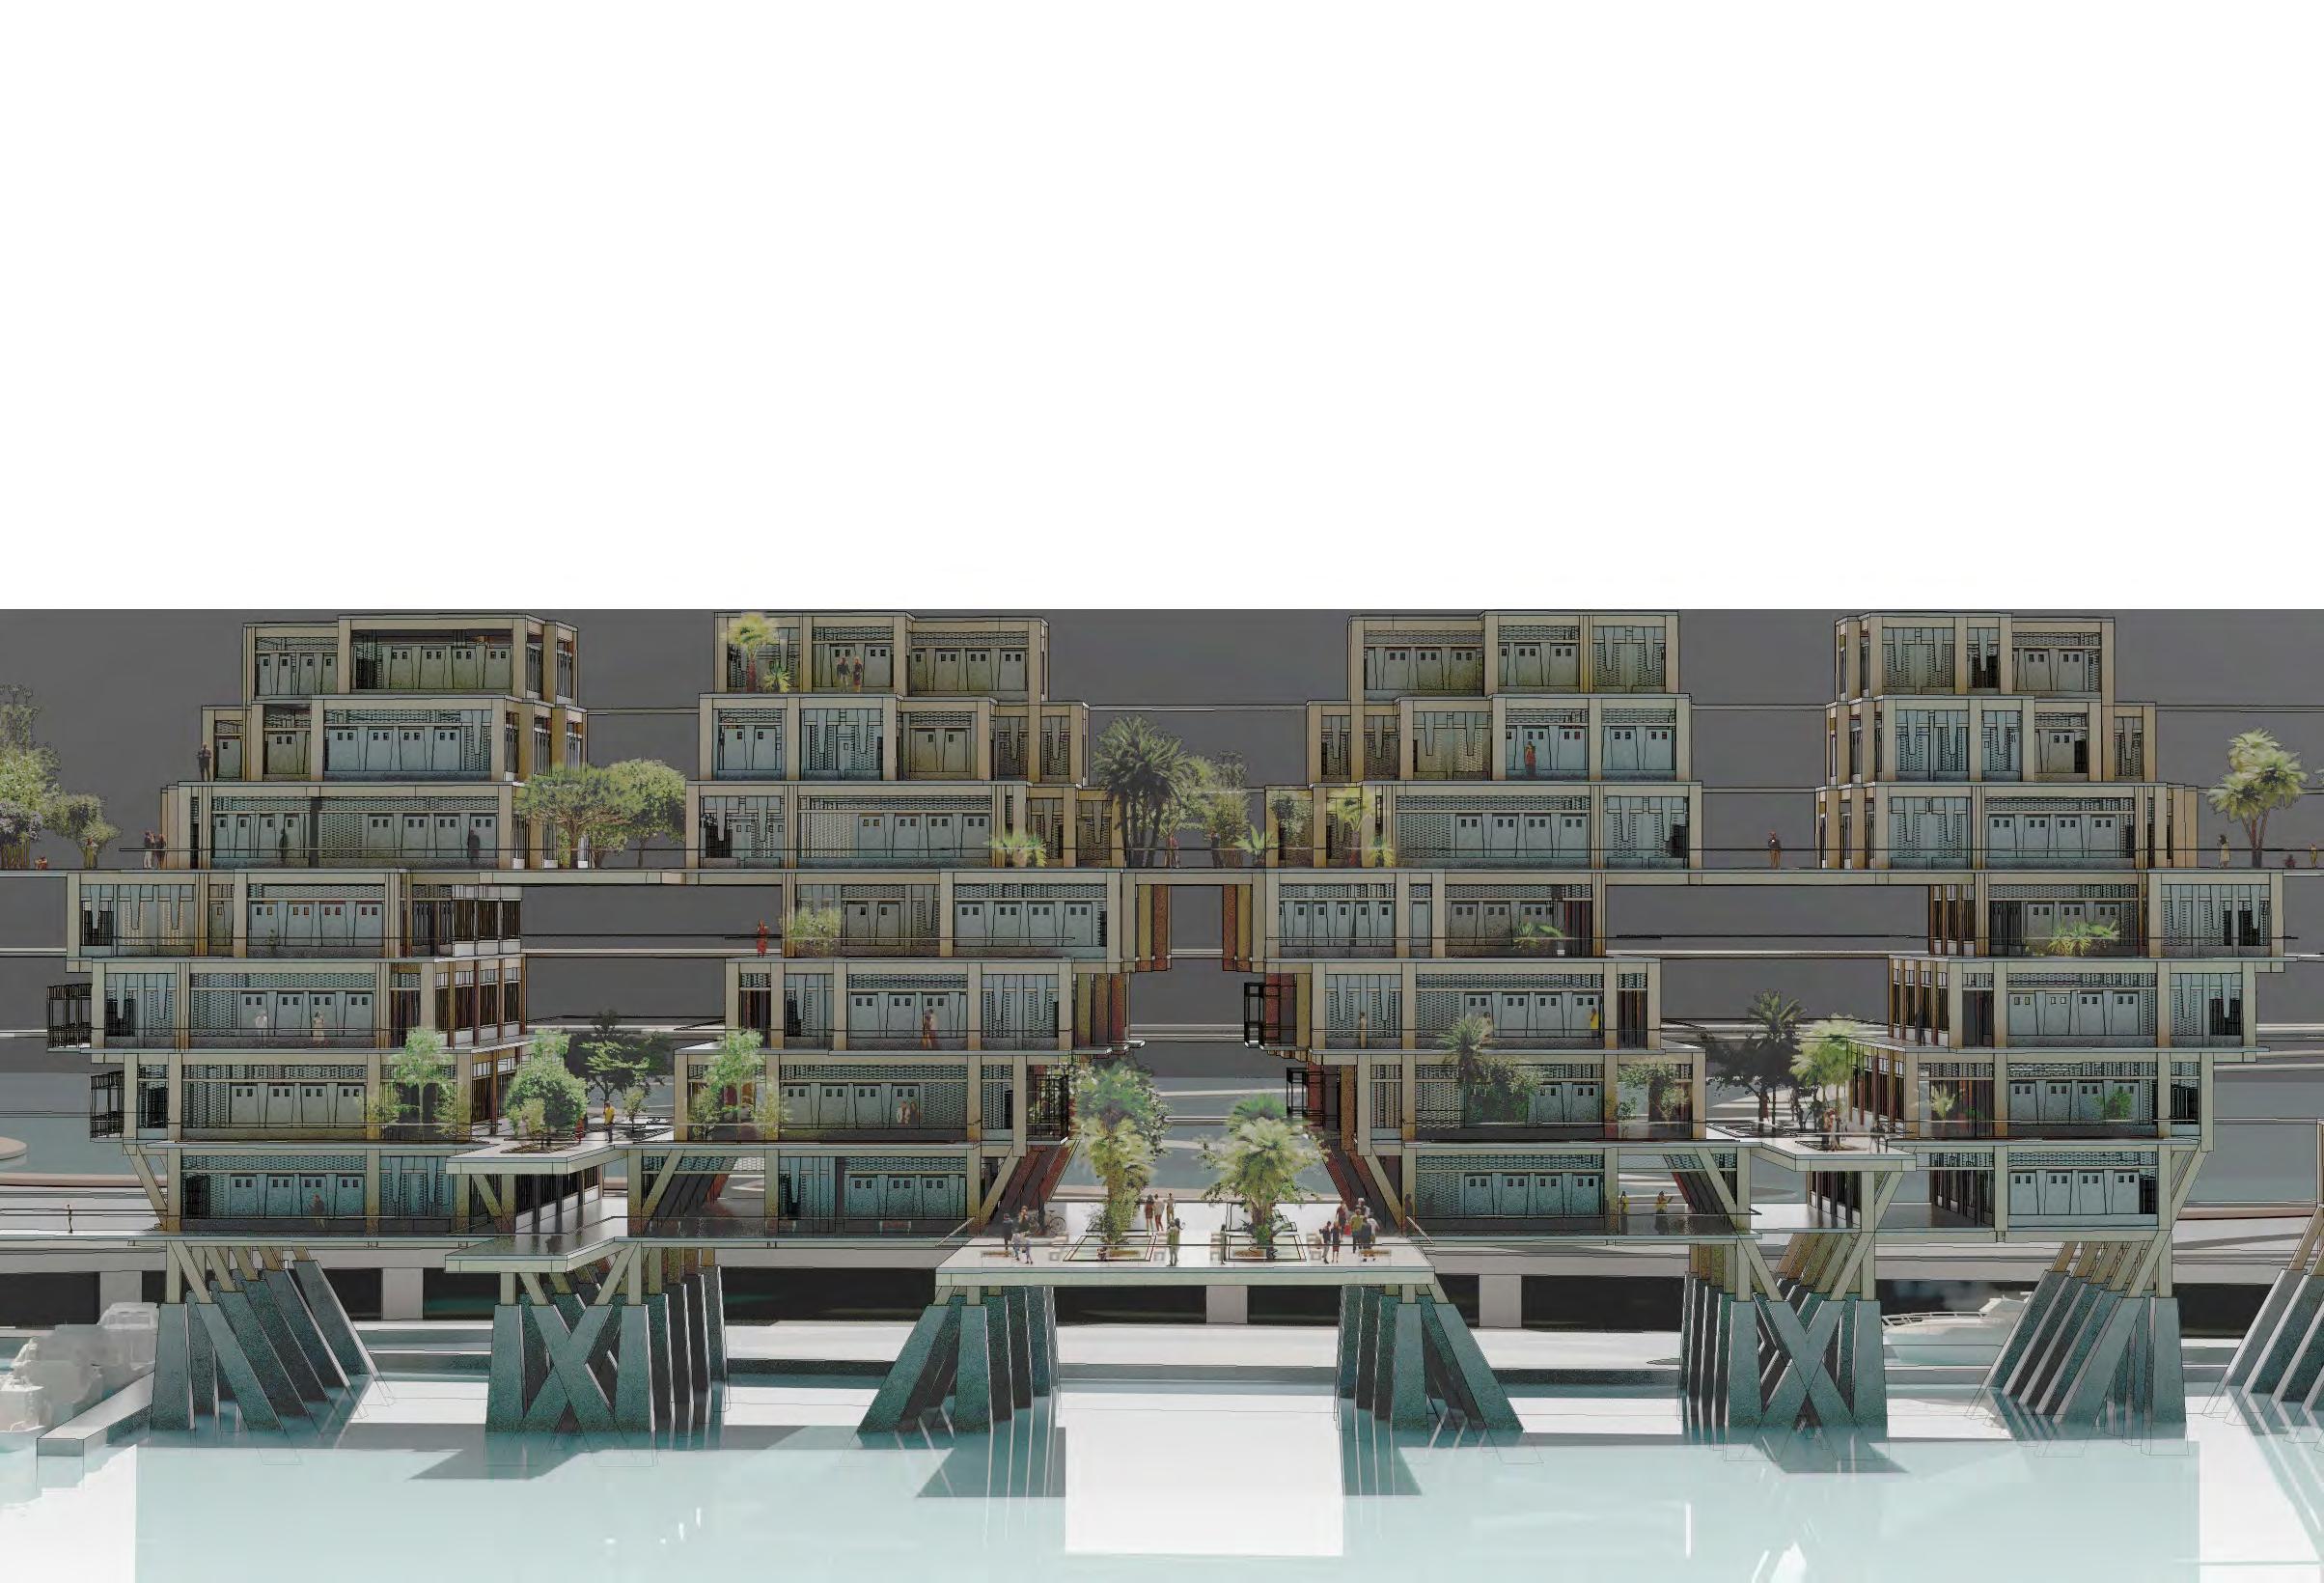
Shell removed to show accommodation 5.1
55 Final Drawings 5
Location key
56 Final Drawings 5
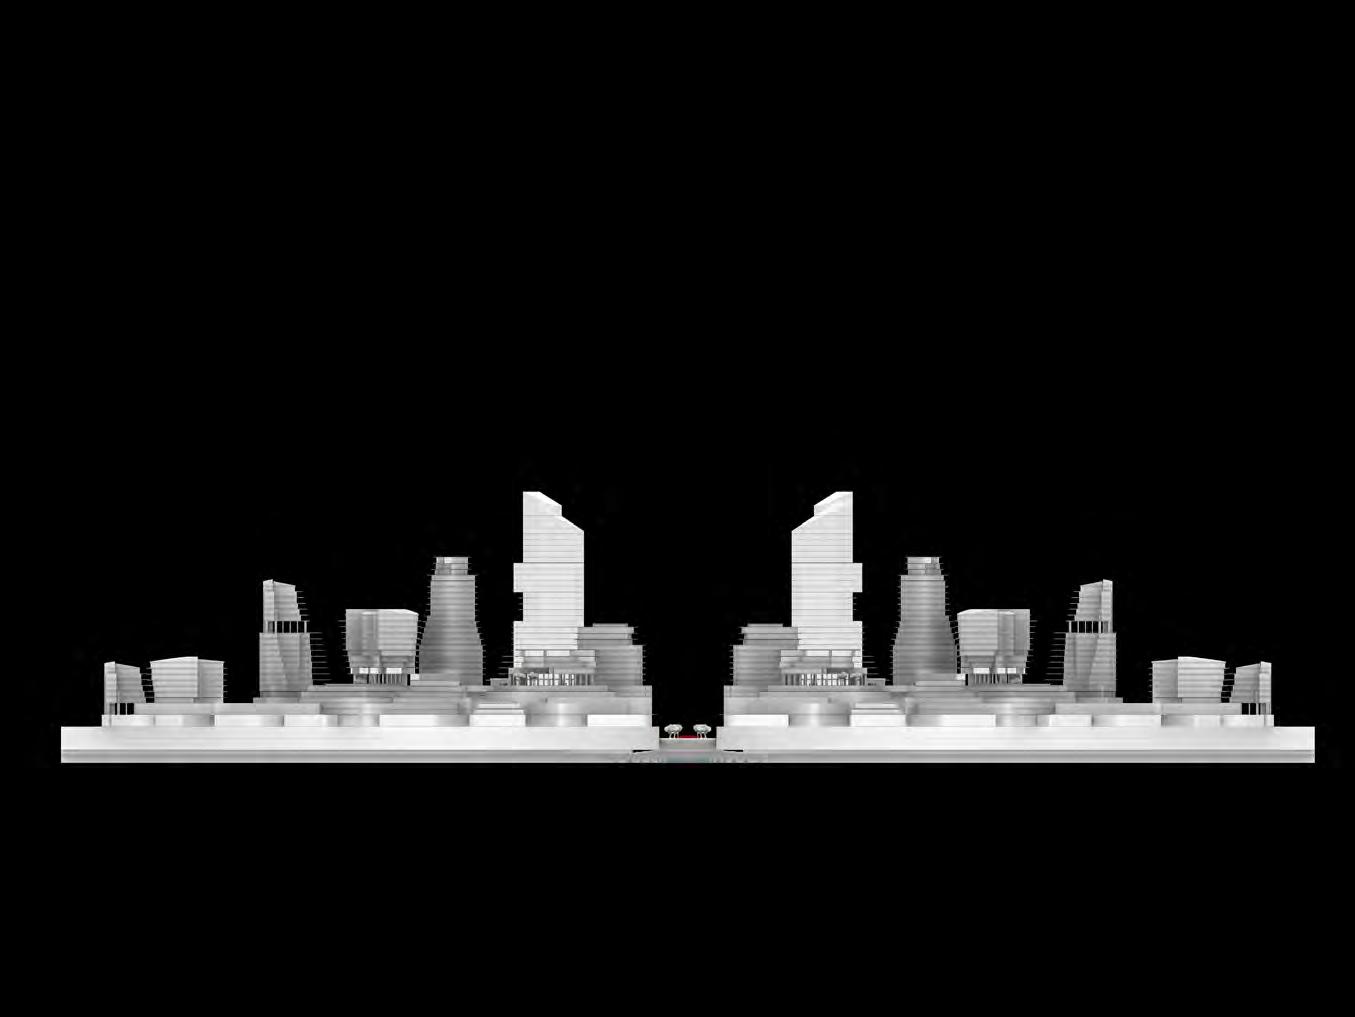
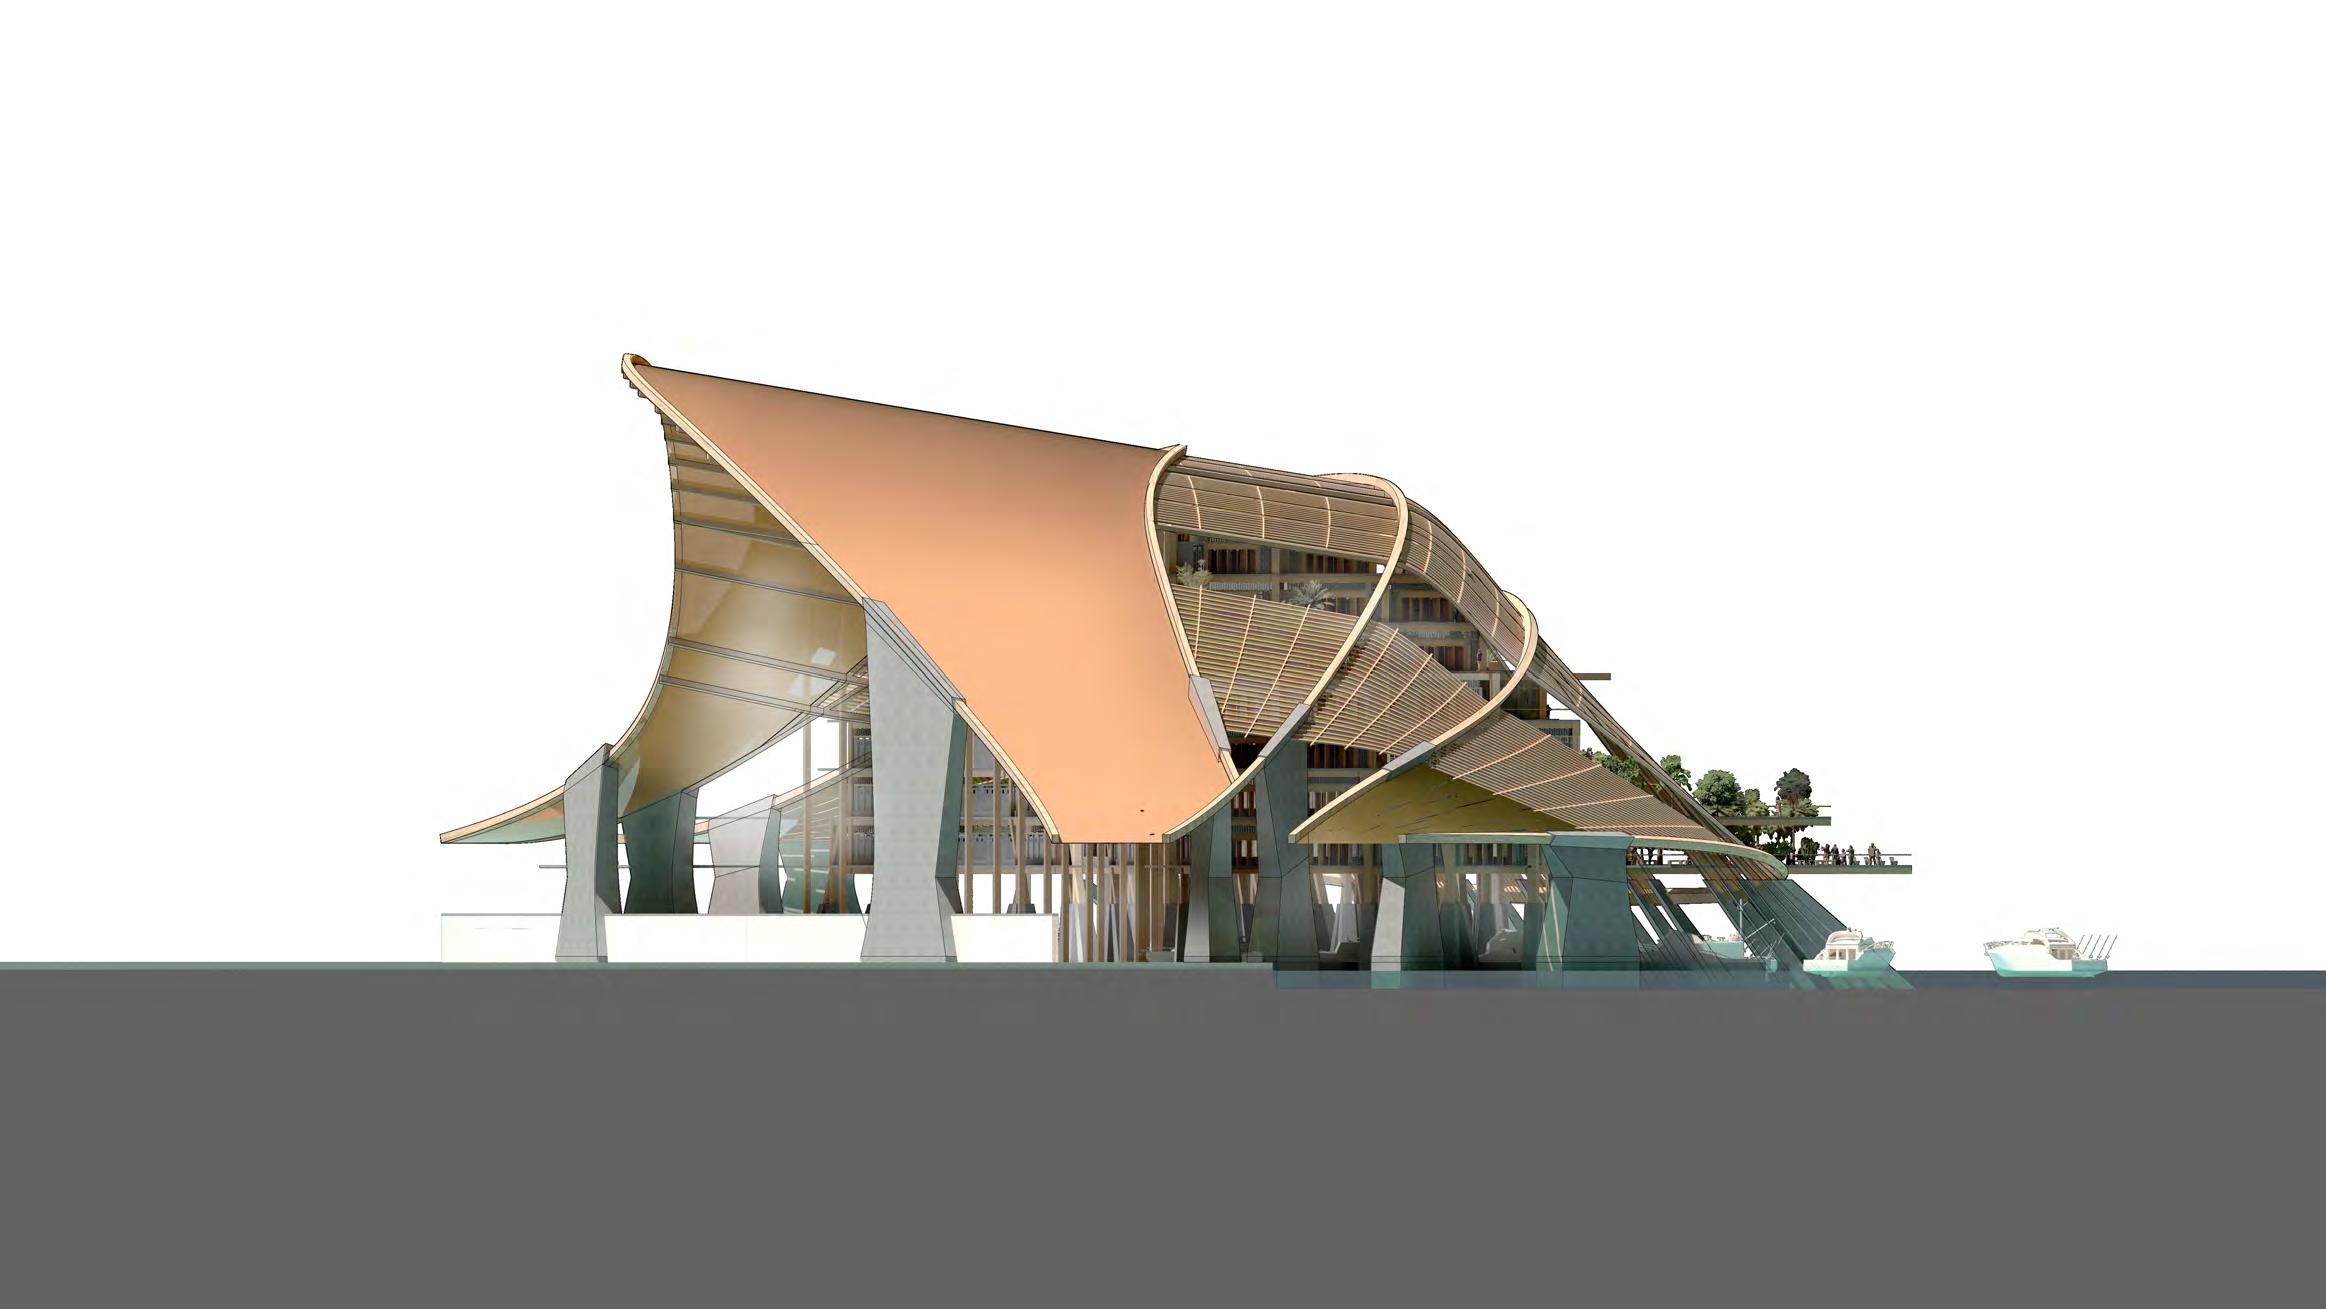
Side Elevation - 5.2
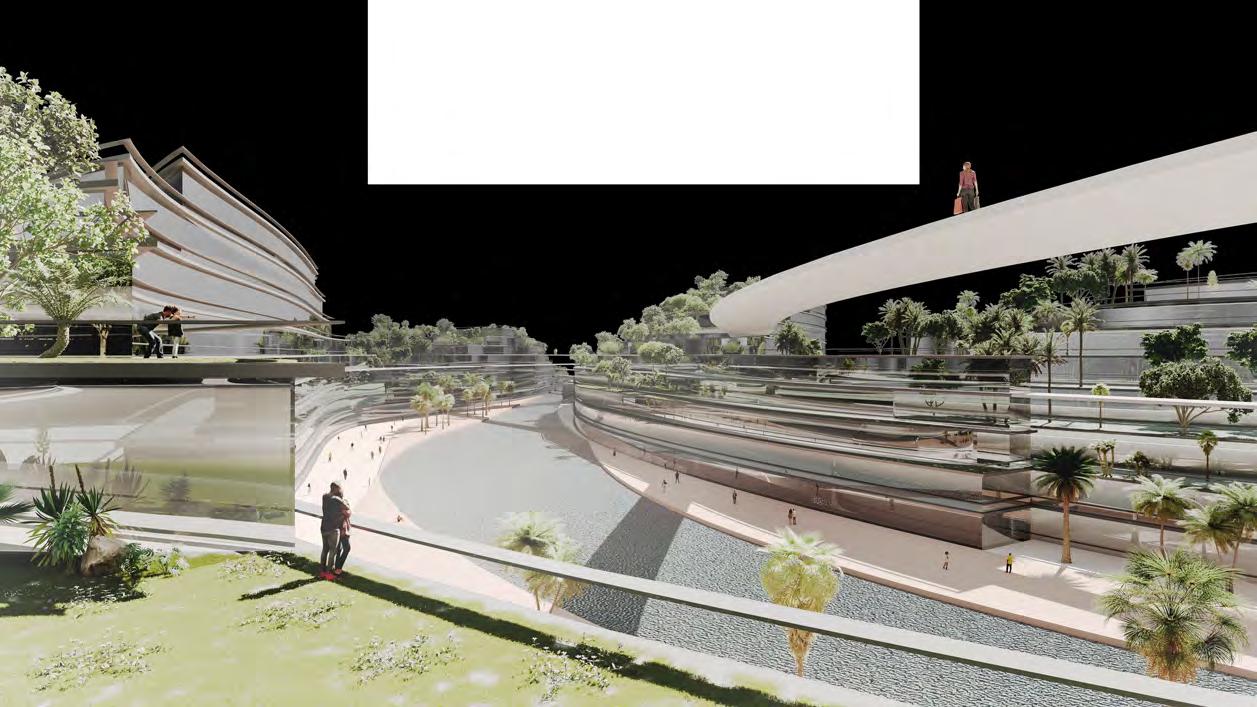
57 Final Drawings 5 Fragment A - 5.3
58 Final Drawings 5 Fragment B - 5.4
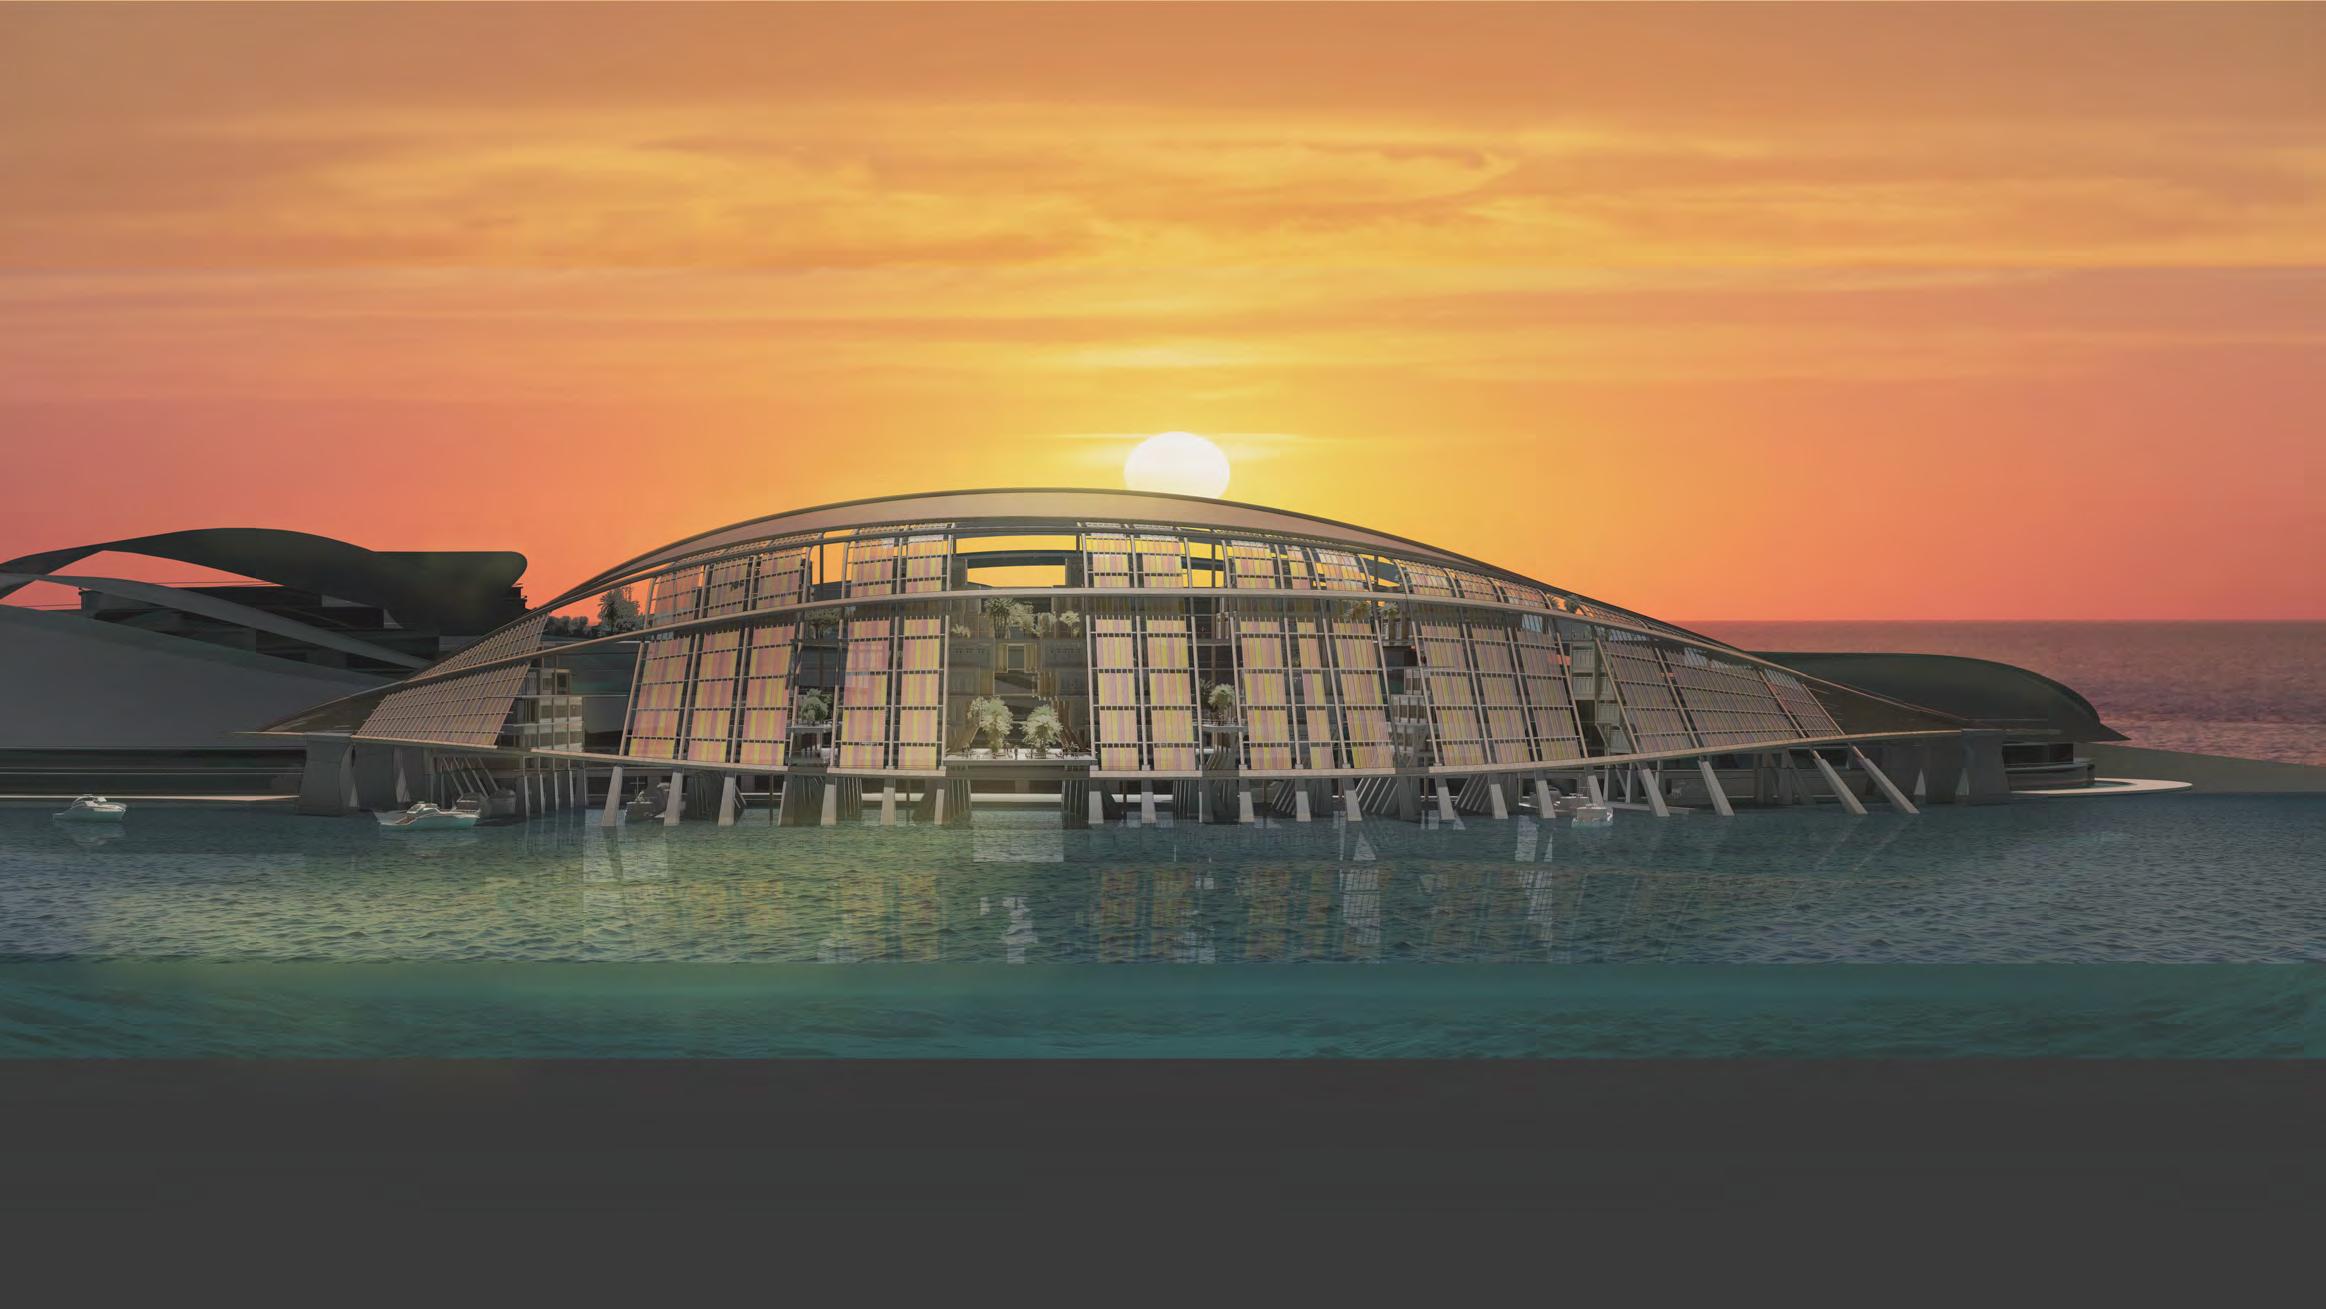
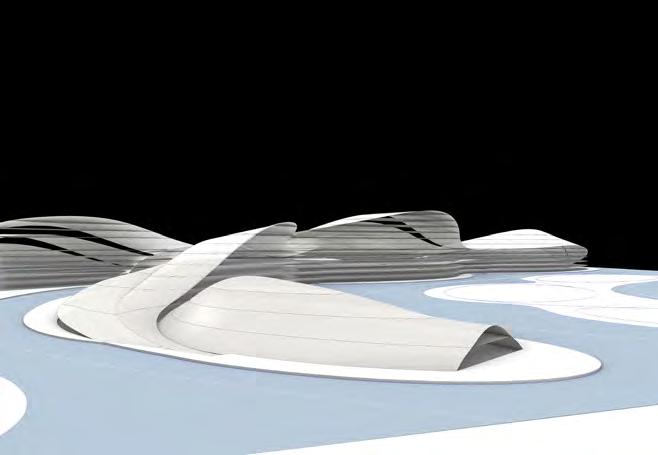
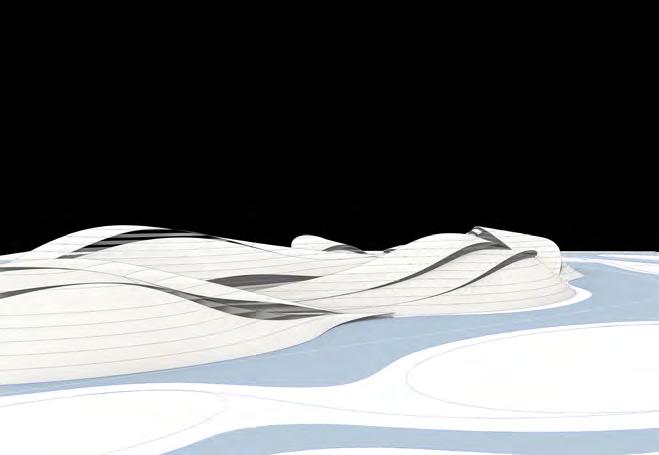
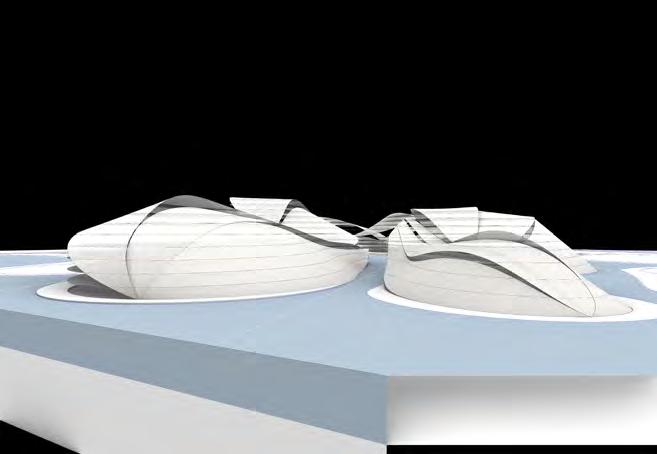
59 Final Drawings 5 Final Render - 5.5
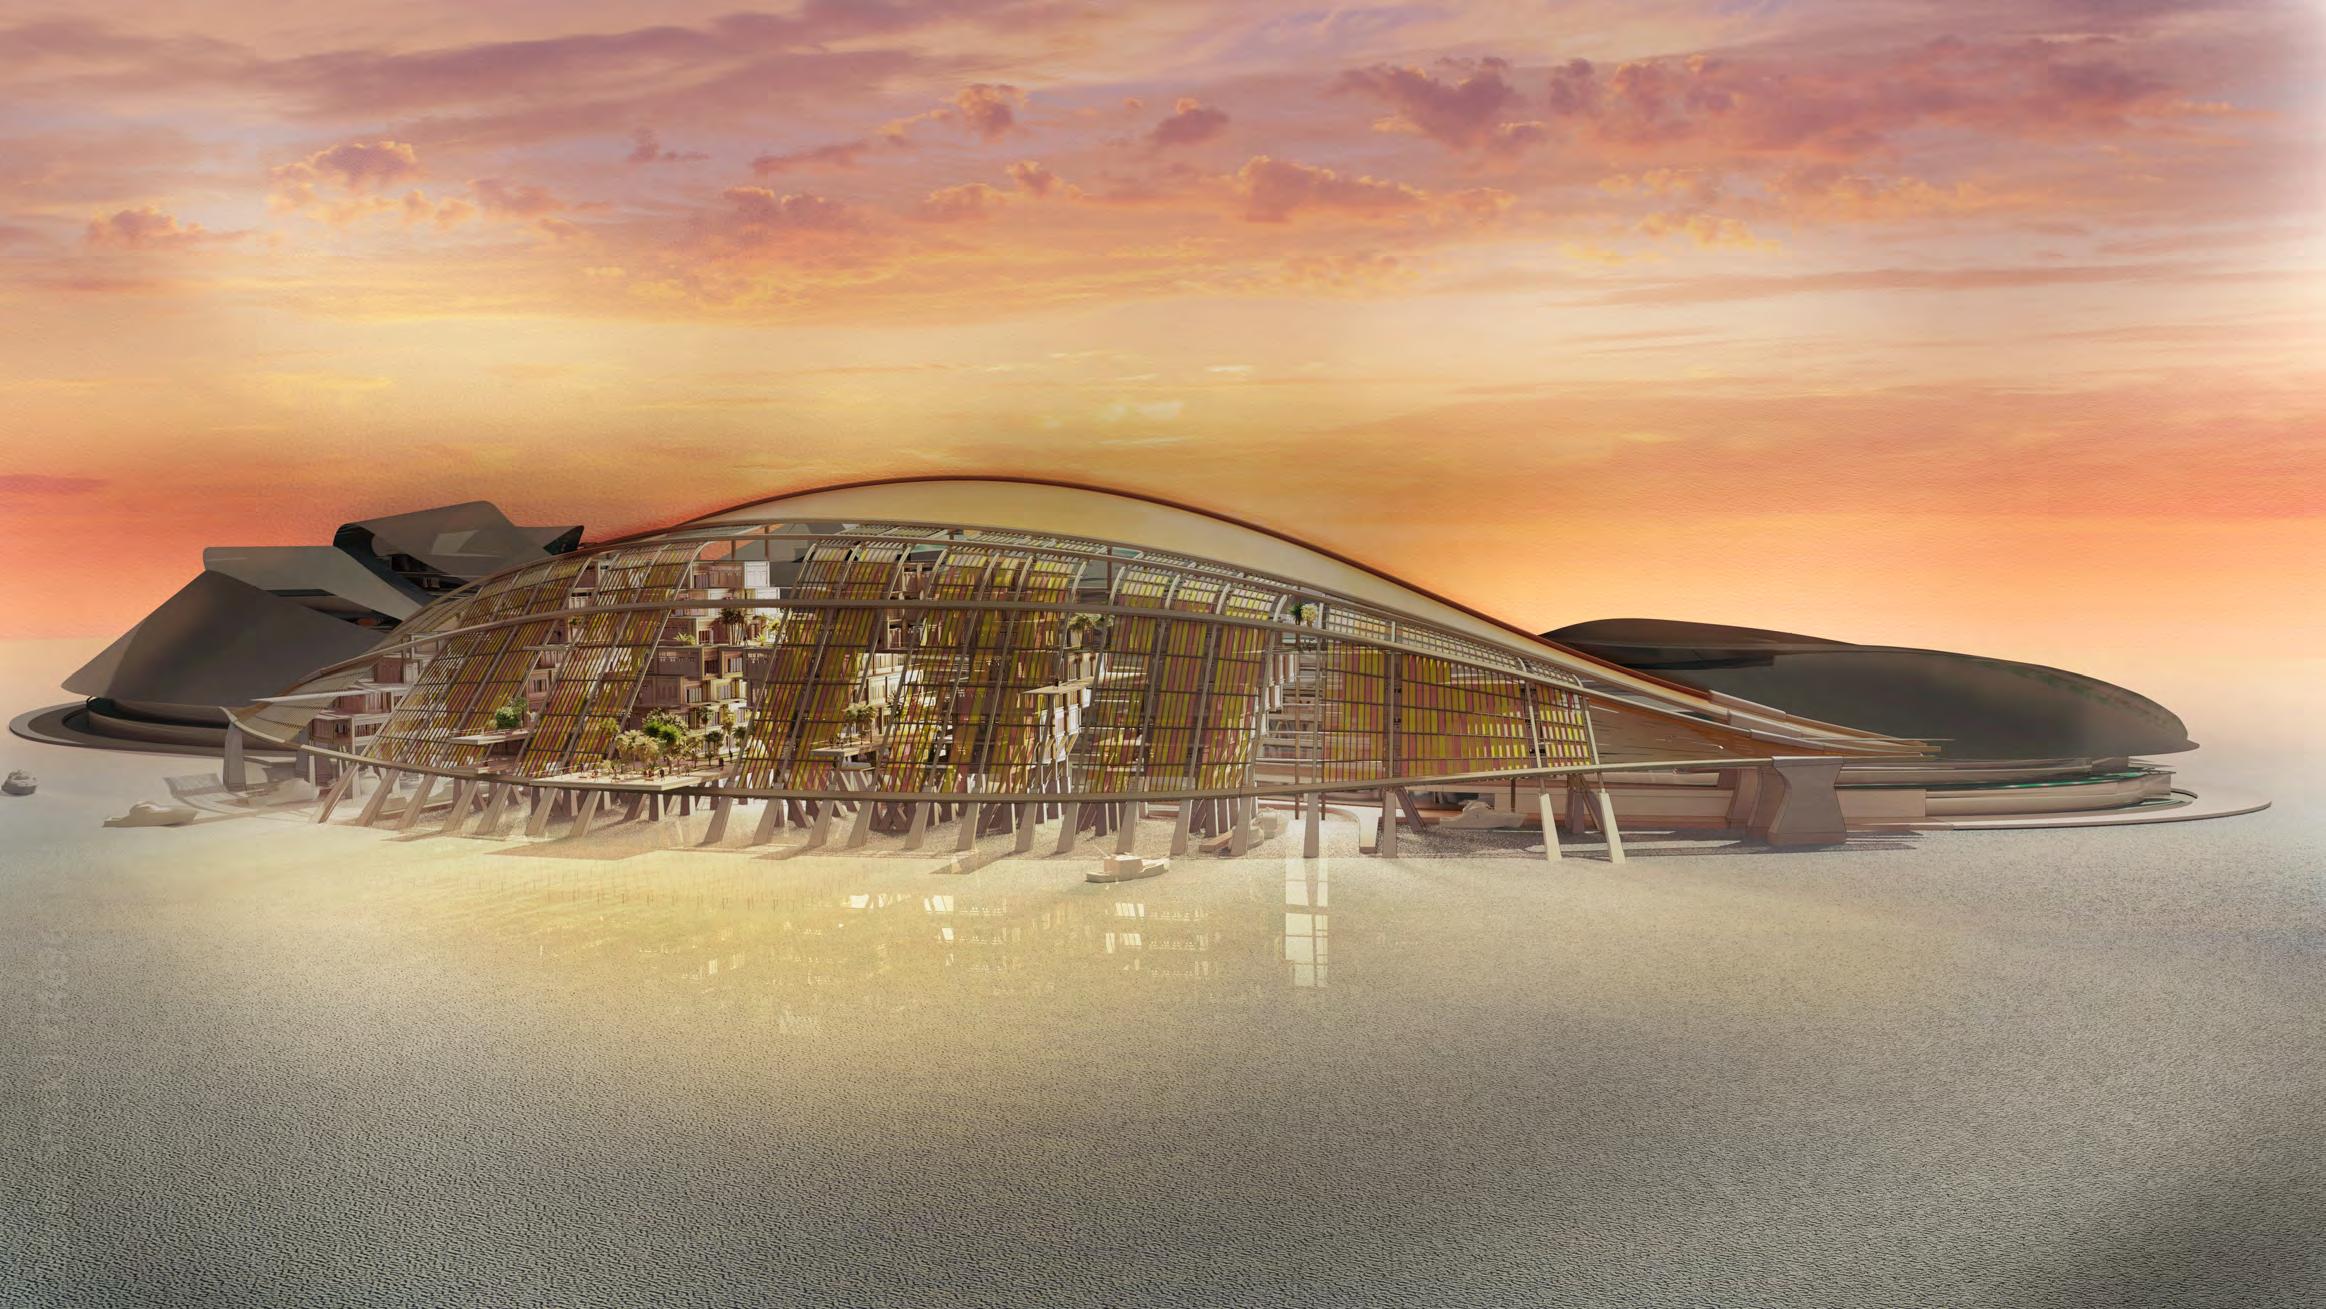
60 Final Drawings 5 Final Render - 5.6
Section 1: Early Research
Section 2: Urban Density
Section 3: Context and Brief
Section 4: Design Development
Section 5: Design Proposal
Section 6: Appendix
62 6 Appendix
63 6 Appendix
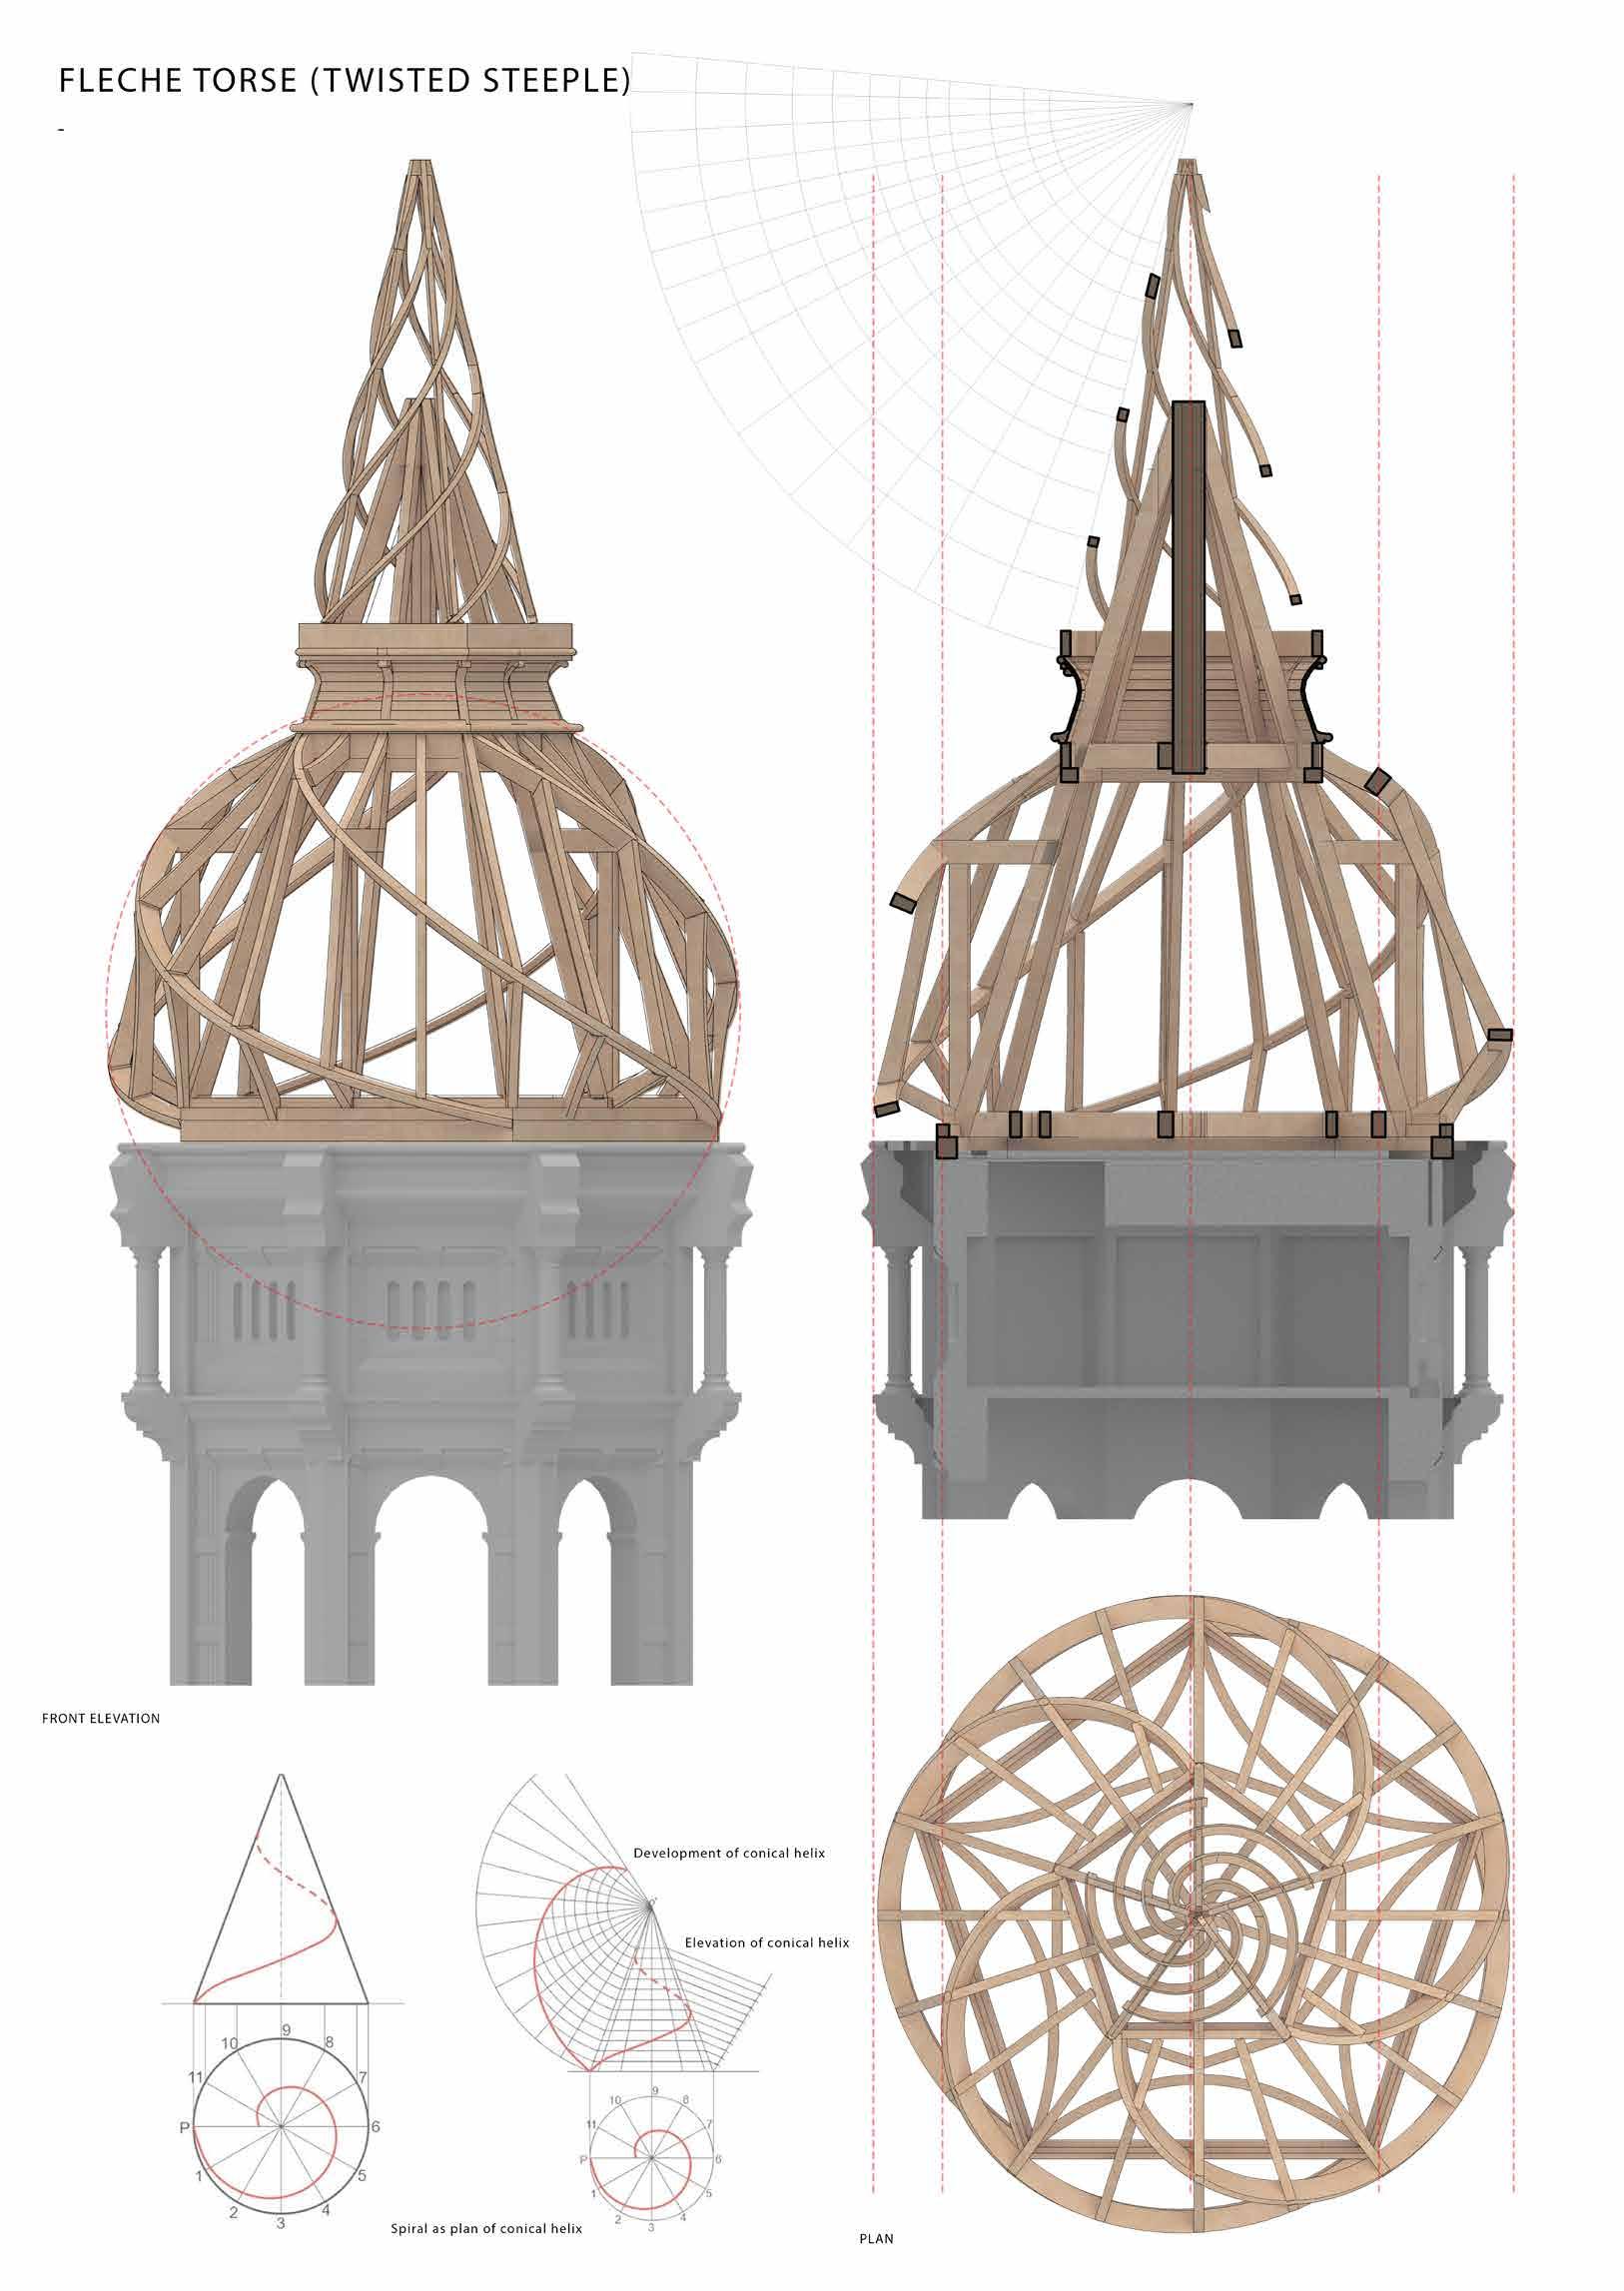
- 6.1
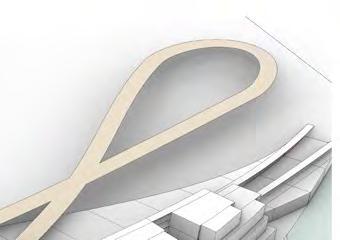
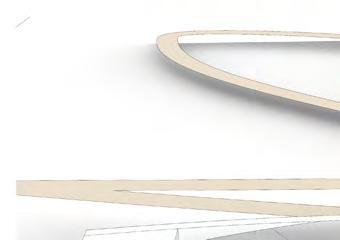
Fleche Torse; Twisted Steeple
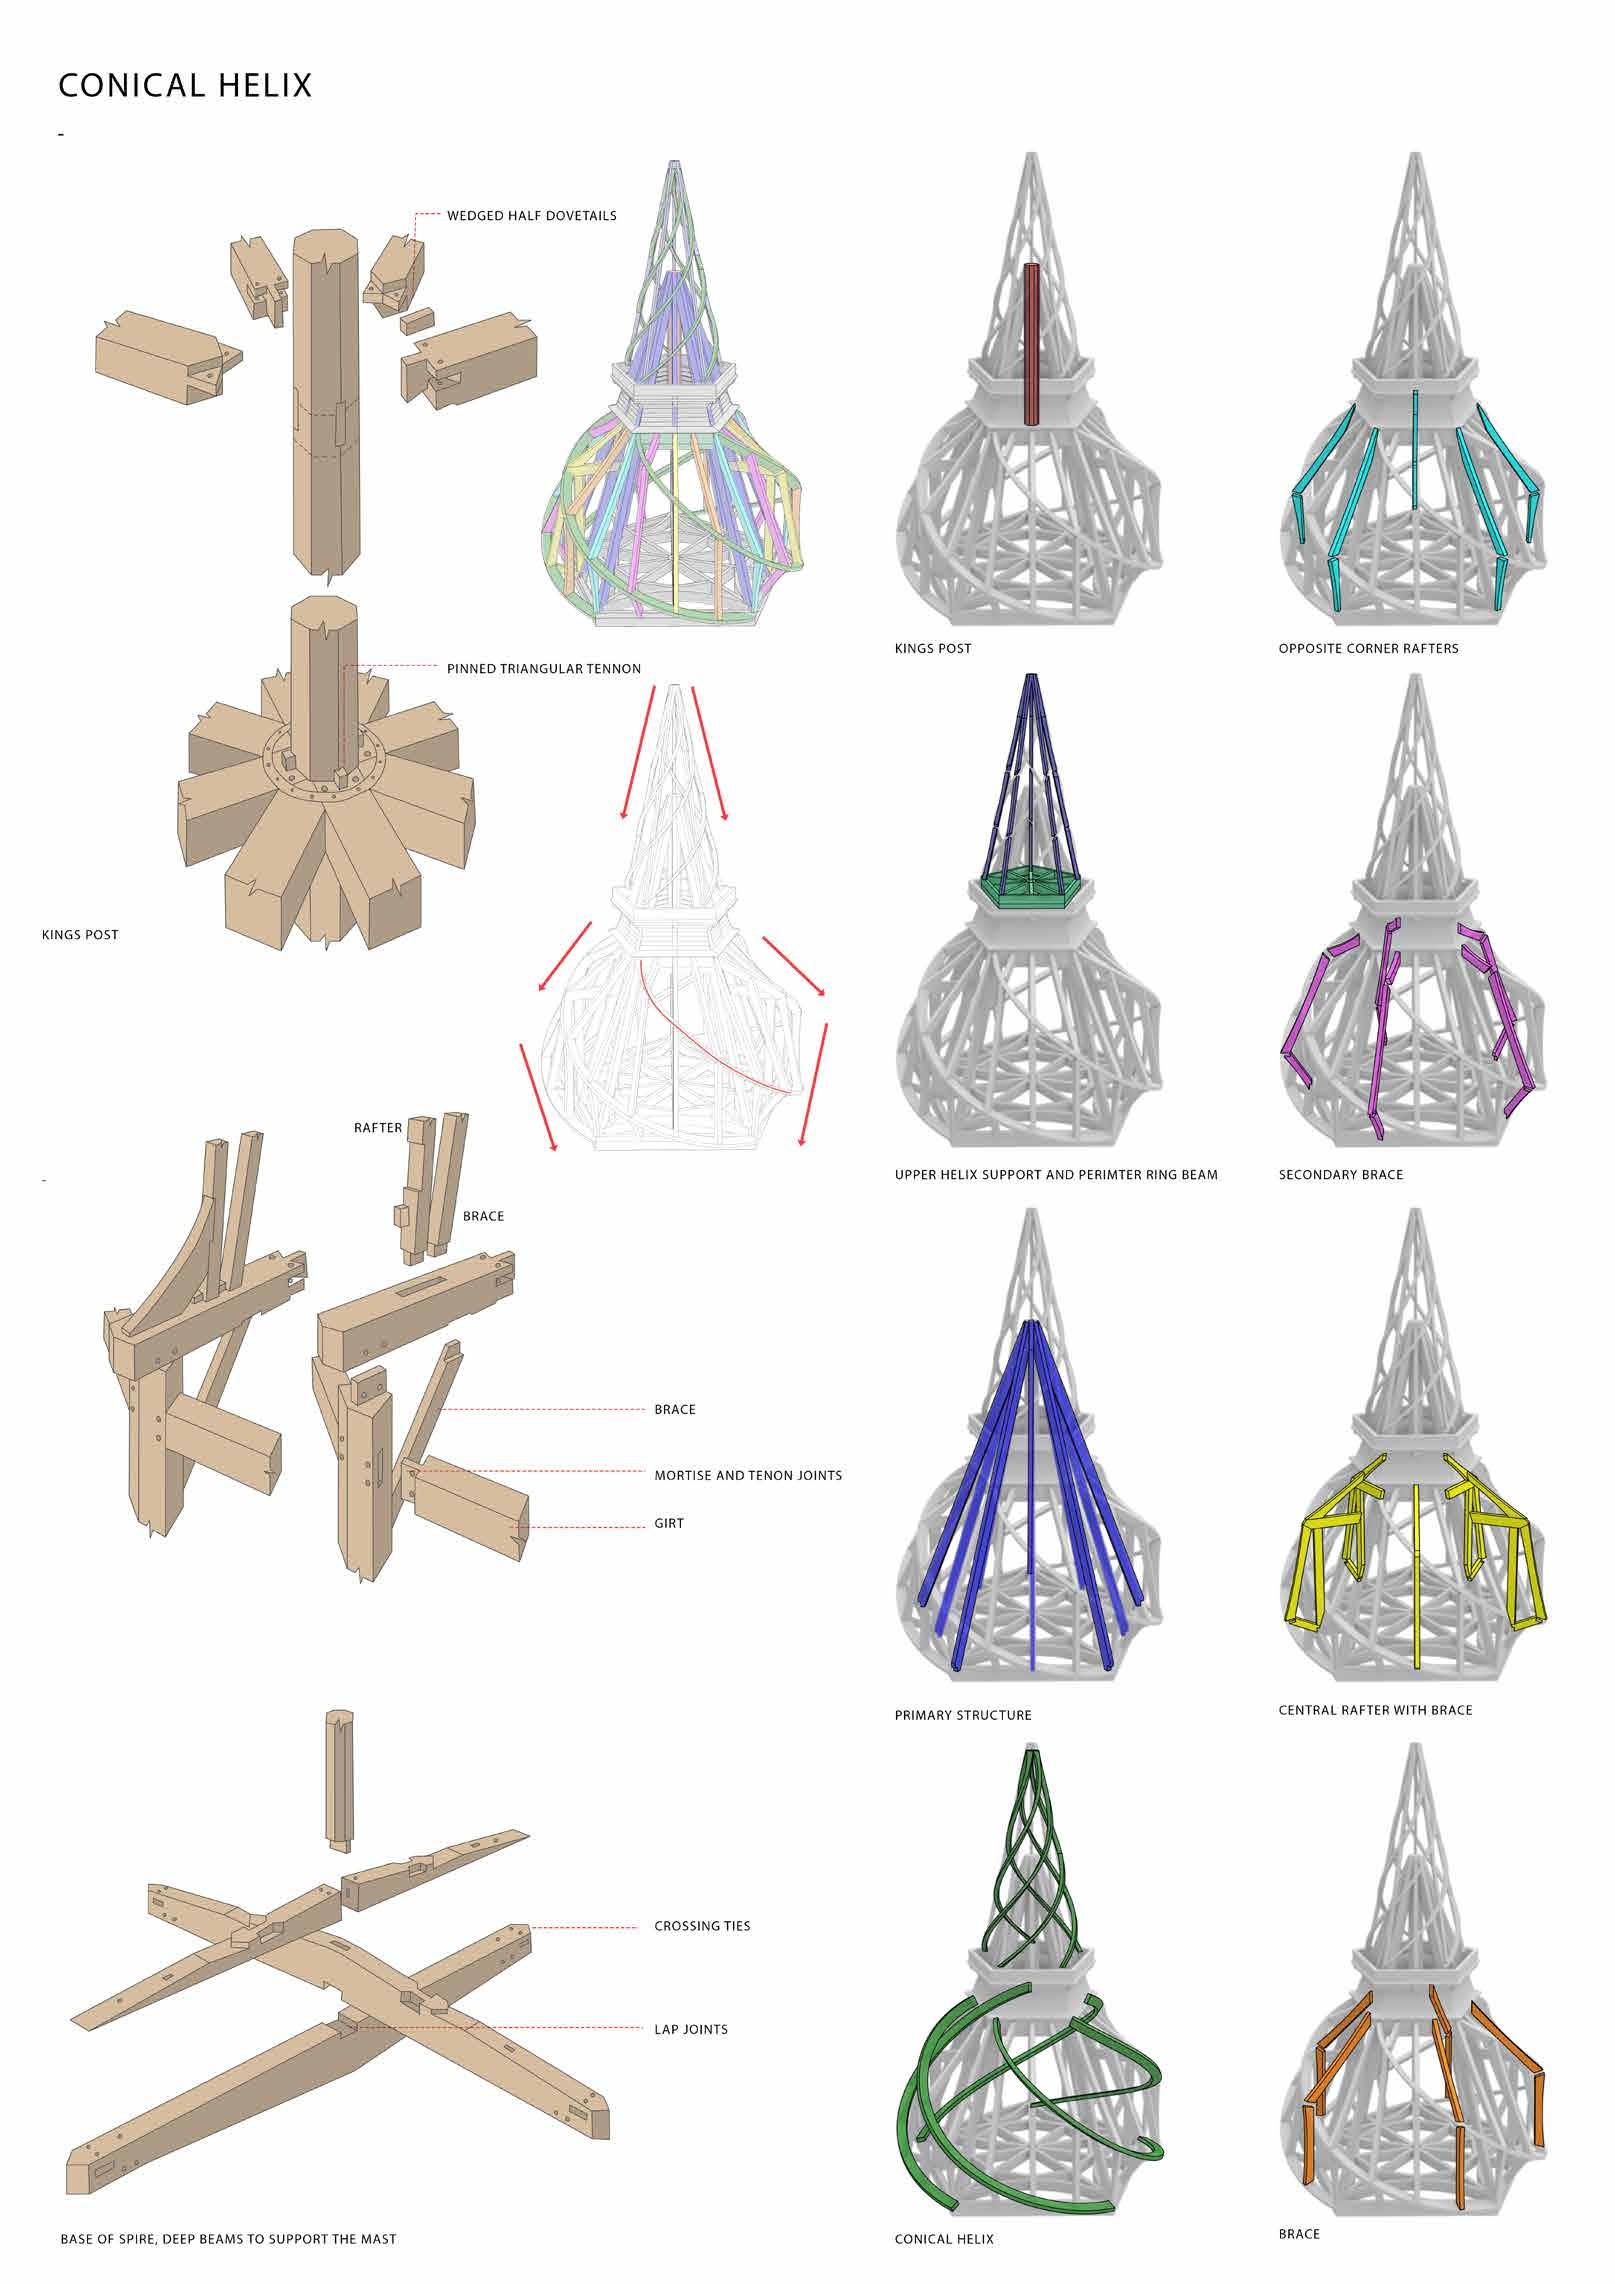
64 6 Appendix Conical Helix - 6.2
Programme; Lifestyle - 6.3
65 6 Appendix Cinema Disco Bar Internal / External Lifts Residence Staircase Wine Cellar Lightwell Gym Games Room Salon Corridor Shower Changing Room Massage Treatment Room Sauna Steam Room Swimming Pool Boiler Room Service Staircase Enthusiasts Workshop Internal External Lifts Residence Staircase Lightwell Car Park Staff Parking / Bike Shed Laundry Boiler Room Commercial Kitchen / Catering Service Staircase Cold Room Service Pantry Pagoda Water Feature Conservatory Various Gardens Various Gardens Painting Collection / Art Display Grand Fireplace Piano Room Library Room Feature Wall Corridor Collectable / Memorabillia Display Lobby Internal External Lifts Grand Staircase Lightwell Grand Entrance Collectable Car Display Piece of Historical Ruin Foyer Portico Deliveries CCTV Room Courtyard Service Staircase Waste / Recycling Driveway / Porte Cochere / Car Valet Security Booth / Barrier / Front Gate Tree Lined Tree Lined Guest Bedroom Corridor Guest (His) Dressing Guest (Her) Dressing Internal / External Lifts Residence Staircase WC Family Kitchen Dining Room Corridor Roof Terrace Storeroom Laundry Service Room Service Staircase Shower Changing Room Infinity Pool Corridor Observation Deck Internal External Lifts Residence Staircase Master (Her) Dressing Master (His) Dressing Corridor Master Bedroom Study / Office Safe Balcony Helipad Corridor Observation Deck Residence Staircase Internal External Lifts Living Recreation; Entertainment Ancillary Circulation Services Recreation; Garden Security Recreation; Leisure Third Second First Ground Lower Ground Basement Programme; Lifestyle Resident: Entrepreneur, Businessman, Tycoon, Dealer / Trader, Merchant, Mogul Butler Chauffeur Chef Gardener Resident’s Guests Security Personal Assistant Nanny Programme; Lifestyle Maintenance Cleaner Concierge
All work produced by Unit 14
Unit book design by Charlie Harriswww.bartlett.ucl.ac.uk/architecture
Copyright 2021
The Bartlett School of Architecture, UCL All rights reserved.

No part of this publication may be reproduced or transmited in any form or by any means, electronic or mechanical, including photocopy, recording or any information storage and retreival system without permission in writing from the publisher.

-

@unit14_ucl UNIT
CONSTRUCTED FUTURES 2023

At the center of Unit 14’s academic exploration lies Buckminster Fuller’s ideal of the ‘The Comprehensive Designer’, a master-builder that follows Renaissance principles and a holistic approach. Fuller referred to this ideal of the designer as somebody who is capable of comprehending the ‘integrateable significance’ of specialised findings and is able to realise and coordinate the commonwealth potentials of these discoveries while not disappearing into a career of expertise. Like Fuller, we are opportunists in search of new ideas and their benefits via architectural synthesis.
As such Unit 14 is a test bed for exploration and innovation, examining the role of the architect in an environment of continuous change. We are in search of the new, leveraging technologies, workflows and modes of production seen in disciplines outside our own. We test ideas systematically by means of digital as well as physical drawings, models and prototypes. Our work evolves around technological speculation with a research-driven core, generating momentum through astute synthesis. Our propositions are ultimately made through the design of buildings and through the in-depth consideration of structural formation and tectonic. This, coupled with a strong research ethos, will generate new and unprecedented, one day viable and spectacular proposals. They will be beautiful because of their intelligence - extraordinary findings and the artful integration of those into architecture.
The focus of this year’s work evolves around the concept of ‘Constructed Futures’. The term aims to describe architecture and as such fundamentally human future as the result of the architect’s highest degree of synthesis of underlying principles. Constructional logic, spatial innovation, typological organisation, environmental and structural performance are all negotiated in a highly iterative process driven by intense architectural investigation. Inspiration for inherent principles of organisational intelligence can be observed in both biotic and abiotic systems, in all spatial arrangements where it is critical for the overall performance of the developed order. Through the deep understanding of constructional principles, we will generate highly developed architectural systems of unencountered intensity where spatial organisation arises as a result of sets of mutual interactions. Observation as well as re-examination of civilisatory developments will enable us to project near future scenarios and position ourselves as avant-garde in the process of designing a comprehensive vision for the forthcoming. The projects will take shape as research based imaginative tales, architectural visions driven by speculation.
Thanks to: ALA, DaeWha Kang Design, Foster + Partners, Heatherwick Studio, Populous, RSH+P, Seth Stein Architects, ZHA, Expedition Engineering

UNIT 14 @unit14_ucl All work produced by Unit 14 Unit book design by Charlie Harriswww.bartlett.ucl.ac.uk/architecture Copyright 2021 The Bartlett School of Architecture, UCL All rights reserved.No part of this publication may be reproduced or transmitted in any form or by any means, electronic or mechanical, including photocopy, recording or any information storage and retreival system without permission in writing from the publisher.
